Abstract
Objective
The inherited component for Alzheimer disease (AD) risk has focused on close relatives; consideration of the full family history may improve accuracy and utility of risk estimates.
Methods
A population resource including a genealogy of Utah pioneers from the 1800s linked to Utah death certificates was used to estimate relative risk for AD based on specific family history constellations, including from first- to third-degree relatives.
Results
Any affected first-degree relatives (FDR) significantly increased risk of AD (≥1 FDRs: relative risk [RR] 1.73, 95% confidence interval [CI] [1.59–1.87]; ≥2 FDRs: RR 3.98 [3.26–4.82]; ≥3 FDRs: RR 2.48 [1.07–4.89]; ≥4 FDRs: RR 14.77 [5.42–32.15]). Affected second-degree relatives (SDR) increased risk even in the presence of affected FDRs (FDR = 1 with SDR = 2: RR 21.29 [5.80–54.52]). AD only in third-degree relatives (TDR) also increased risk (FDR = 0, SDR = 0, TDR ≥3: RR 1.43 [1.21–1.68]). Mixed evidence was observed for differences in risk based on maternal compared to paternal inheritance; higher risks for men than women with equivalent family history, and higher risk for individuals with at least one affected FDR regardless of the relative's age at death, were observed.
Conclusions
This population-based estimation of RRs for AD based on family history ascertained from extended genealogy data indicates that inherited genetic factors have a broad influence, extending beyond immediate relatives. Providers should consider the full constellation of family history when counseling patients and families about their risk of AD.
Alzheimer disease (AD), a chronic progressive neurodegenerative disease that is the major cause of dementia and carries a great financial and societal burden in the United States,1 has well-recognized inherited factors. Mutations in 3 genes explain most cases of autosomal dominant young-onset familial AD (amyloid precursor protein and presenilin-1 and -2), but mutations in these genes represent <5% of AD cases.2–4 Most patients lack family history suggesting autosomal dominant inheritance and are considered sporadic. At least one copy of the ε4 allele of the APOE gene is found in 56% of AD cases, increasing risk 3-fold; 2 copies are found in 11% of AD cases, increasing risk 8- to 12-fold.5–7 Genome-wide association studies have identified additional variants that increase risk.2,8–11 About 53% of AD risk variance is accounted for by genetic variation as measured by single nucleotide polymorphisms.12 There is growing evidence that polygenic approaches to understanding disease risk have value.13–18
It is now recognized that family history is an important risk indicator,19 but most risk prediction studies focus on close relatives,20–22 and most clinicians consider history of dementia only in immediate family members. A broader view of family history could allow individualized determination of risk and more accurate diagnosis that could help guide patients in making health-related decisions. Here an extensive resource linking genealogy with death certificates was used to provide individualized estimates of AD risk based on specific levels of family history for AD.
Methods
Data
The Utah Population Database (UPDB) includes the computerized genealogy of the Utah pioneer founders from the 1800s, and their descendants to modern day, linked to many demographic and health-related data registries.23 Of the 11 million Utah-connected individuals represented in the UPDB, approximately 3 million have at least 3 generations of genealogy connected to the original Utah pioneers. Of these, approximately 1.3 million have genealogy data for at least 12 of their 14 immediate ancestors (both parents, all 4 grandparents, and at least 6 of 8 great-grandparents). These individuals with deep genealogy data were analyzed here in an effort to limit analysis to individuals with the most complete and extended relationship data. The genealogy data in the UPDB have been linked to computerized Utah death certificates from 1904 to 2014. Death certificates include primary cause of death; contributing causes of death are also available for the majority of linked death certificates. Cause of death is coded using the ICD revisions 6–10, depending on the year of death.
Case selection
Individuals with deep ancestry data as described above and linked Utah death certificates were included. AD first appeared as a coded cause of death in ICD-9 and also appears in ICD-10; only death certificates coded with ICD-9 or ICD-10 were included. Individuals with an ICD code for AD as a primary or contributing cause of death (ICD-9: 331.0; ICD-10: F00 or G30) were identified as AD cases. This definition was also used in a previous description of familial clustering of AD in Utah.24 All individuals with ancestral genealogy and a linked Utah death certificate were analyzed to estimate population rates for AD appropriate for the UPDB (n = 270,818). Cohort-specific rates for AD were estimated for sex, 5-year birth year range, and birthplace (Utah or not) cohorts by dividing the number of AD deaths in a cohort by the number of Utah deaths in the cohort. While these rates would not necessarily represent the rate of AD, or AD mortality, in the Utah population, they do represent the UPDB population analyzed, and allow appropriate hypothesis testing.
Estimation of relative risks (RRs)
RRs were estimated for many different family history constellations, based on the number of affected first-degree relatives (FDRs), second-degree relatives (SDRs), and third-degree relatives (TDRs), age at death, sex of proband, and maternal vs paternal inheritance. FDRs include parents, offspring, and siblings. SDRs are the FDRs of FDRs; they include grandparents, grandchildren, aunts and uncles, and nieces and nephews. TDRs are the FDRs of SDRs; they include great-grandparents, great-grandchildren, grand nieces, grand nephews, great aunts, great uncles, and cousins. For each constellation, all probands with the specific family history constellation in the UPDB were identified. The estimated RR for each specific family history constellation was calculated as the ratio of the observed number of AD cases among the probands to the expected number of AD cases among the probands; 95% confidence intervals (CIs) for the RR were calculated using the method of Agresti.25 The expected number of AD cases among the probands was estimated by counting all of the probands by cohort, multiplying the number of probands in each cohort by the cohort-specific rate of AD, and summing over all cohorts.
Standard protocol approvals, registrations, and patient consents
Institutional review board approval is in place for this research.
Data availability statement
Access to UPDB data is allowed with appropriate application and approval.
Results
The UPDB data analyzed included 270,818 individuals with genealogy data for at least 12 immediate ancestors and a linked Utah death certificate; 149,303 (55%) of these individuals died after 1978. Of these individuals, 4,436 have a Utah death certificate that indicates AD as a primary or contributing cause of death; 1,138 of the AD deaths were diagnosed between 1979 and 2000 and 3,298 after 2000; 2,837 of the AD deaths were in women (64%); the median age at death for these individuals was 85 years with a range of 39–105 years. Cohort-specific rates for AD were estimated from this entire population of individuals with Utah death certificate data and with appropriate ancestral genealogy data; 67 of the AD deaths occurred before age 65 years (1.5%) and 1,094 (25%) occurred after age 89 years. The 4,436 AD cases in the UPDB had 18,494 FDRs (average 4.2), 29,618 SDRs (average 6.7), and 82,095 TDRs (average 18.5) with appropriate genealogy and a linked death certificate.
FDR family history
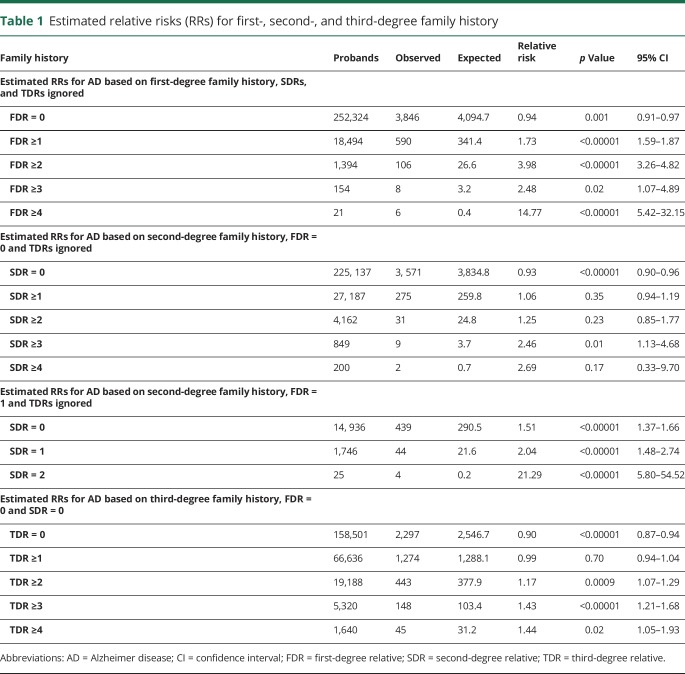
The family history obtained during clinical encounters is usually limited to FDRs; most literature focuses on these relationships.20–22,26 Here the risk of AD was estimated based on an individual's number of affected FDRs, rather than the typical estimate of risk based on presence or absence of any affected FDRs. Table 1 shows estimated RRs for AD based on family history in FDRs, and shows the number of affected FDRs, the number of probands with the specific family history, the observed number of AD cases among the probands (observed), the expected number of AD cases among the probands (expected), the RR for AD, the significance (p value), and 95% CI for the RR. As an example of the estimation of RR in table 1, there were 21 individuals in the UPDB whose family history was FDR ≥4 (probands); 6 of these probands were observed to have died from AD. The 21 probands were members of 14 different sex, birth year, and birth state cohorts; most cohorts had no probands. The cohort with the most probands had 3 with an AD death rate of 0.038; the AD death rate in these 14 different cohorts ranged from 0.00 to 0.042. The expected number of AD deaths among the probands was calculated by summing the number of probands in each cohort times the cohort-specific rate of AD death, over all cohorts; this sum was 0.41. Significantly elevated RRs for AD were observed for all individuals with at least one affected FDR. The estimated RR for the specific case of a family history of at least one FDR (FDR ≥ 1) is equivalent to the traditional RR estimated in all the FDRs of all affected individuals; no other constellation RRs are equivalent to traditional RR measures.
Table 1.
Estimated relative risks (RRs) for first-, second-, and third-degree family history
SDR family history
Table 1 shows estimated RRs for AD based on family history in SDRs in the absence of FDR family history and ignoring TDR family history. RRs were elevated (RR >1.0) for any number of affected SDRs, but were typically not significantly elevated (p < 0.05 only for SDR ≥3). There are fewer data available for SDR family history than for FDR family history because there is a narrow window of view for the AD phenotype (status is only available for individuals dying in Utah after 1978); individuals in the most recent generations in UPDB are more likely to have parents with known phenotype than to have grandparents with known phenotype. The narrow window of ascertainment (1979–2014) and the fact that second-degree relationships primarily involve patients from different generations (e.g., grandparent/grandchild, or uncle/niece) may have resulted in censoring of second-degree relationships, thus reducing the observation of affected SDRs and limiting the power of risk prediction for this set of constellations.
Table 1 showed estimated RRs for SDRs in the absence of any FDR family history. It is also of interest to determine whether positive SDR family history affects risk in the presence of affected FDRs. Table 1 shows estimated RR for AD based on number of affected SDRs in the presence of exactly 1 affected FDR. Estimated RRs for 1 or 2 affected SDRs in the presence of 1 affected FDR were significantly elevated over the estimated RR for exactly 1 affected FDR (RR 1.54; 95% CI 1.40–1.68); no probands were observed with more than 2 affected SDRs in the presence of exactly 1 FDR (data not shown).
TDR family history
Again, it is of interest to determine if TDR family history alone is sufficient to affect risk. Table 1 shows estimated RRs for AD based on positive TDR family history with no affected FDRs or SDRs. Individuals with no affected FDRs, SDRs, or TDRs might be considered to have no family history; the RR for these probands is significantly less than 1.0 (RR 0.90, 95% CI 0.87–0.94), as observed in table 1, and as might be expected. RRs for more than 2 affected TDRs are all significantly elevated, even in the absence of any more closely related affected relatives.
FDR family history by age at death
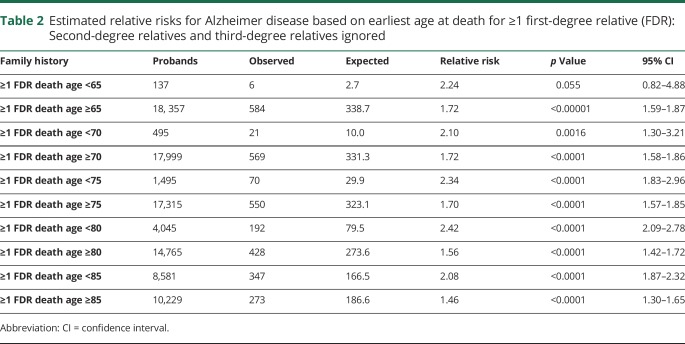
Table 2 shows estimated RRs for AD based on the earliest age at death from AD for an FDR for probands with at least 1 affected FDR, when SDRs and TDRs are ignored. Estimated RRs are shown for multiple age groups for comparison.
Table 2.
Estimated relative risks for Alzheimer disease based on earliest age at death for ≥1 first-degree relative (FDR): Second-degree relatives and third-degree relatives ignored
Specific FDR family history
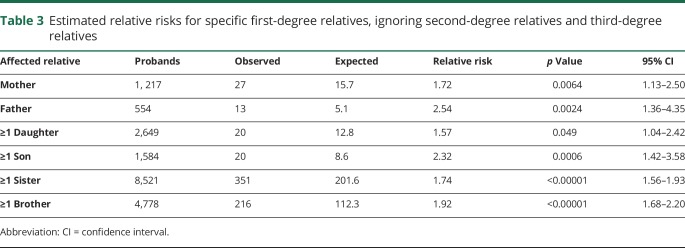
Table 3 shows estimated RRs for AD for specific FDR family history constellations, to allow comparisons by sex and generation of the affected relative. All FDR family history proband subgroups considered had significantly elevated RRs. Estimated RRs for affected female FDRs were lower than estimated RRs for affected male FDRs, but these differences were not typically significant; however, the estimated RR for an individual with an affected father (2.54) exceeded the 95% CI for the estimated RR for individuals with an affected mother (RR 1.72; 95% CI 1.13–2.50).
Table 3.
Estimated relative risks for specific first-degree relatives, ignoring second-degree relatives and third-degree relatives
Family history by sex of proband
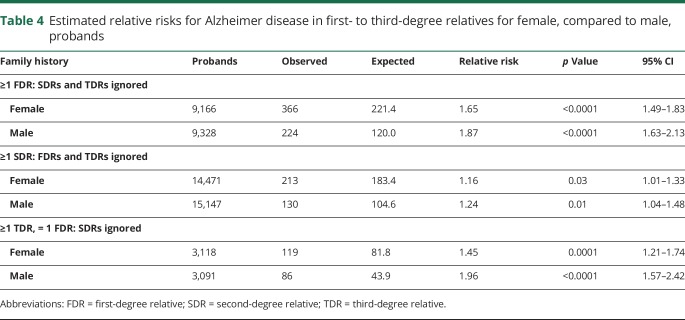
Family history–based risks were also investigated by sex of the proband for a limited selection of constellations. Table 4 shows estimated RRs for AD for female probands compared to male probands. The estimated RR for male participants with at least one affected FDR exceeds the 95% CI for female participants, as does the estimated RR for male participants with at least one affected TDR; the estimated RR for male participants with at least one affected SDR was higher than for female participants, but not significantly. These results suggest that, given an equivalent family history, men are at higher risk for AD than women.
Table 4.
Estimated relative risks for Alzheimer disease in first- to third-degree relatives for female, compared to male, probands
Maternal vs paternal contribution to risk
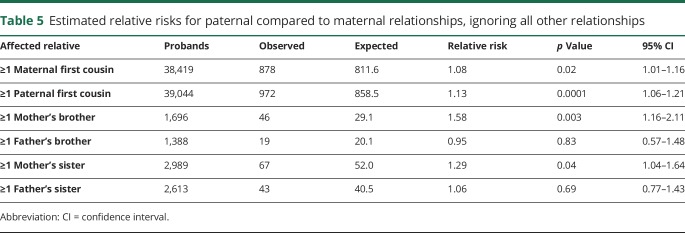
Table 5 shows comparisons of maternal and paternal risk of AD. RR for first cousins (TDRs) of affecteds were significantly elevated for both a maternal and a paternal family history, and were not significantly different (RR 1.08 and 1.13, respectively). Differences for paternal vs maternal family history were noted for the second-degree relationships considered. Individuals with a maternal affected SDR (mother's brother or mother's sister) had significantly elevated RR, while individuals with a paternal affected SDR (father's brother or father's sister) did not.
Table 5.
Estimated relative risks for paternal compared to maternal relationships, ignoring all other relationships
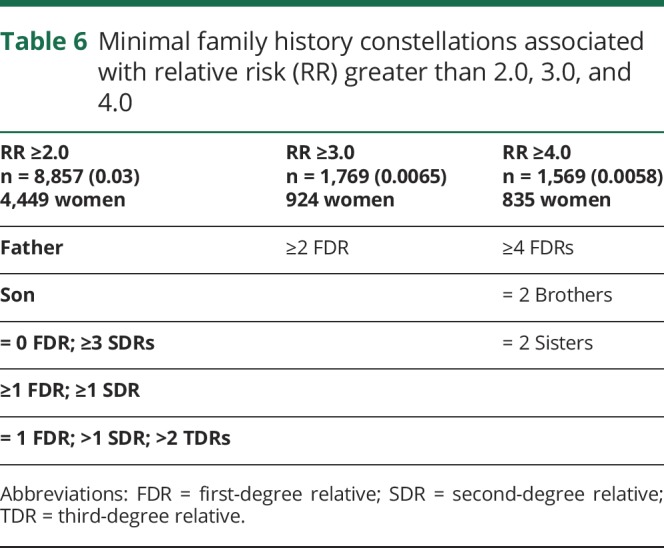
As a concise summary that identifies individuals at greatest risk for AD based on family history, table 6 describes specific family history constellations resulting in estimated RR for AD greater than 2.0, 3.0, and 4.0, respectively. Constellations that were based on fewer than 4 affected probands or fewer than 100 probands were not included. Probands were identified among the 270,818 individuals in the UPDB who had data for 12 of their 14 immediate ancestors and a linked Utah death certificate. Table 6 shows the number of such individuals identified for each RR group, and the number of individuals who were female. Three percent of analyzed individuals had a family history resulting in a RR ≥2.0, and a little over ½ percent had RR ≥3.0, or ≥4.0. There was very little difference in the sex ratio of the individuals with high RRs; 50% of individuals with RR ≥2.0 were female, as were 52% of those with RR ≥3.0% and 53% of those with RR ≥4.0.
Table 6.
Minimal family history constellations associated with relative risk (RR) greater than 2.0, 3.0, and 4.0
Discussion
It has been suggested that 80% of “a typical old-age psychiatrist's time” might be spent in assessment and management of dementia, most due in whole, or in part, to AD, noting that patients are increasingly seeking an estimate of their own genetic risk for AD.27 AD is not unlike other common disorders in this issue, and the increase in availability of genetic knowledge and personal genetic testing has increased the frequency of these questions among patients and their relatives. A heritable contribution to AD has been recognized for decades,28,29 and multiple studies have presented RR estimates for relatives.20,26,30 It has been suggested that a family history review in FDRs should be part of every routine dementia diagnostic process and that clinicians should be able to provide some guidance on risk.27
Traditional RR estimates for AD based on comparisons of the observed to expected numbers of affected relatives of patients with AD of varying degrees based on population rates of AD death for the Utah population have been published previously,24 and independently, based on AD diagnosis using National Veterans Health Administration hospital data.31 Here a different approach to estimation of risk for AD has been pursued, based on specific and complete family history constellation out to TDRs for hundreds of thousands of individuals with deep genealogy and linked death certificate data. The risk estimates presented here, because they are based on specific AD family history, are much more individualized and precise risk estimates than are published elsewhere, but they are also generalized to allow risk prediction in the case of even minimal family history information. Family history changes over the lifetime, and most likely contributes to increasing estimate of risk over time. It is possible that a proband might have limited knowledge of family history; for this reason, many of the constellations presented ignore classes of relatives to allow for unknown family history, or use general descriptions of numbers of affected relatives, such as “>” rather than “=.” While this might lessen the accuracy of some of these estimated risks, it enables the risks presented to be useful for a much larger number of individuals.
The results presented here are more extensive and detailed than most published RR estimates due to the larger sample size, and the consideration of both close and distant relatives. There are few published estimates of RRs for AD based on family history, and these are primarily restricted to family history in FDRs. Nevertheless, the estimates in this analysis are similar to previously published estimates, including (1) FDRs of patients with AD have a 2- to 4-fold increased risk of dementia from ages 65–80 years26; (2) RR of 3.5 for AD in individuals with at least 1 FDR with dementia (95% CI 2.6–4.6)22; (3) estimated RR 3.2 (95% CI 1.8–5.7) with at least 1 FDR affected by AD21; and (4) RR 2.6 (95% CI 2.1–3.2) for FDRs for white patients.30
The RR estimates presented here are also in general agreement with the previously published Utah estimates, but provide much greater precision based on exact family history. We previously presented RR 1.73 for risk of AD in FDRs of individuals dying from AD,24 while here a range of RR 1.73 for ≥1 affected FDR to RR 14.77 for ≥4 affected FDRs was observed (table 1). It is additionally clear from the specific family history constellations presented that second-degree (table 1) and third-degree family history (table 1), even in the absence of first-degree family history, can be indicative of significantly elevated risk. These findings indicate the importance of a full family history that extends beyond immediate family members.
There were few AD deaths prior to age 65 years represented in the UPDB, so while an elevated RR was observed for individuals with at least one affected FDR who died before age 65 years (RR 2.24, 95% CI 0.82–4.88), the risk was not significantly elevated. When a cutoff of 70 years of age was used, individuals with at least one affected FDR dying before age 70 years had significantly higher risk than those whose FDR's death age was >69 years. The increased risk for at least one FDR affected was observed for all age groups considered (up to age 85 years). A significant inverse relationship between age at onset of AD in probands and higher risk in their relatives has been reported.32
Several interesting results were observed when sex-specific comparisons were made, although more data should be considered before conclusions are made. A history of any affected FDR indicated significantly elevated RR for AD (table 3). If the affected FDR was male, estimated RRs were always higher than for the equivalent affected female relative, ignoring sex of the proband (e.g., RR for affected father 2.54 vs RR for affected mother 1.72), but RR differences by sex for FDR family history constellations were not always observed (e.g., ≥1 daughter compared to ≥1 son). These results differ from prior studies in which female relatives were identified to have higher risk than male relatives. Reports from the MIRAGE study concluded that female FDRs of probands “with probable or definite AD” had a higher risk of developing dementia than did their male counterparts.30,33 A sex-modification effect of the E4 isoform on susceptibility, based on differences in risk of AD in apoE groups of male and female participants, has been suggested.34 In a study of families with early-onset AD,35 female FDRs were reported to have higher risk of developing AD than men. Differences in study design, including use of family history data, recruitment, and classification of affecteds in probands and in relatives, could be responsible for different conclusions. Comparisons between studies are difficult given the focus here on probands rather than relatives, and given the reliance on AD diagnosis based on death certificate data here, vs prior studies' reliance on specialty clinics for AD cases and self- or family-report supplanted by medical records, death certificates, and nursing home records for dementia status of family members.
Although sample sizes are reduced, some comparisons of RR were also made separately for probands by sex (table 4). For the 3 constellations considered, the RR for a male proband was higher than the risk for a female with an equivalent family history; in 2 of the comparisons, the estimated RR for male probands exceeded the 95% CI for the estimated RR for female probands with the equivalent family history.
There is also some evidence for increased risk via maternal vs paternal inheritance given equivalent family history (table 5). Among the constellations considered, a family history on the mother's side gave significantly elevated risk while the equivalent family history on the father's side did not (e.g., ≥1 mother's brother: RR 1.58; 95% CI 1.16–2.11 compared to ≥1 father's brother: RR 0.95, 95% CI 0.57–1.48). While still not completely understood, the excess maternal vs paternal inheritance may be due to mitochondrial or X chromosome effects for some AD. For a family history in first cousins (TDRs), significantly elevated RRs were observed for both maternal and paternal family history, and did not significantly differ (table 5). These findings generally concur with other studies showing evidence of a maternal inheritance pattern.20,36–38
The results showing elevated AD risk extending beyond FDRs have important clinical implications. Arguably, those with a family history of AD among FDRs may already be engaged in lifestyle changes to reduce their personal risk by reducing or managing conditions with known associations with AD such as cardiovascular risk factors including hypertension, hypercholesterolemia, obesity, type 2 diabetes, and others.39 Collectively, the effect of reducing modifiable risk factors on AD risk is estimated at 33%,39,40 and promising results of lifestyle changes on cognitive decline in older adults have been reported from the multidomain lifestyle intervention study (Finnish Geriatric Intervention Study to Prevent Cognitive Impairment and Disability [FINGER]).41,42 Persons with a negative history of AD among FDR but positive among SDR or TDR may erroneously underestimate their actual risk for AD. Here it was observed that even in the absence of AD among FDRs, there is a 2-fold increase in risk for those with 3 or more SDR and a 17%–44% increase for those with 2 or more TDR (tables 1 and 6). Knowledge of the increased risk for AD among persons who may otherwise be unaware may motivate such individuals to adopt lifestyle changes to reduce their risk of AD. With information of a patient's personal extended family history of AD, primary care providers may be in an optimal position to educate and recommend lifestyle changes for primary prevention prior to the onset of clinical symptoms.43
Analyses based on population genealogies and disease data can have limitations. Individuals dying from AD might not have had a death certificate that listed AD as a cause of death. Individuals without a specific AD cause of death (e.g., those with senility or dementia-related cause of death coding) were excluded to improve specificity. Individuals dying of AD before appropriate ICD revision coding (only ICD-9 and ICD-10-coded data were used) were censored. Individuals whose genealogy data was not part of UPDB were effectively censored, as were individuals who did not record link to genealogy data; women are recognized to have poorer record linkage rates due to name changes. In order to achieve equivalent genealogic data for all individuals analyzed, only individuals with genealogy for at least 12 of their 14 immediate ancestors in UPDB were analyzed. Nevertheless, these phenotype and censoring issues are likely to be uniform across the data resource, and while power might be reduced, tests of hypotheses were not biased. RRs based on family history constellations for cancer using this method have been published previously.44,45
We recognize the conservative nature of the use of an explicit designation of AD on the death certificate; many individuals with AD would not be identified based on this approach if the physician completing the death certificate did not judge AD as contributing to death. Death certificates are well-known to underestimate the prevalence of AD46–48; here specificity has been favored over sensitivity. Individuals with AD listed on their death certificate are more likely to truly have had an AD diagnosis than if less-specific ICD codes for senility or related dementia (e.g., vascular dementia, dementia with Lewy bodies, frontotemporal dementia, or mixed dementia), which all most likely have their own familial risks, had been included. When appropriate caution is exercised48,49 use of death certificates is an accepted method for assessing AD and has contributed to AD research.50,51 The RR estimates presented here do not take into account many characteristics or risk factors of the proband, nor do they integrate results for any known predisposition genes or SNPs; development of models to integrate these additional factors is underway. Many family members and some health professionals have an unfounded belief that genetics explains most AD. Using death certificates rather than clinical notes makes ascertainment bias in this study unlikely. Especially for SDR and TDR, the listing of AD as a cause of death or contributing factor is unlikely to be due to a clinician's preconceived expectation of family risk.
The RR estimates presented are based on death certificate data for the Utah founding population and their descendants. The Utah founding population was primarily from Great Britain and Scandinavia and Utah has been shown to be genetically similar to the United States and Northern Europe.52 Inbreeding rates for Utah are similar to those estimated for the US population (∼1.5%) or lower.53 The estimated RRs presented for various family history constellations can only be considered appropriate for populations of similar ancestry and should not be extrapolated to other populations without validation. Nevertheless, these RR estimates for AD provide a general classification for patients who are aware of their family history for AD and will allow discrimination of those at population risk from those who are at increased risk for AD. Such classifications could also prove useful for stratification for clinical trials. These results also should encourage further research into possible polygenic contributions to sporadic AD.
Glossary
- AD
Alzheimer disease
- CI
confidence interval
- FDR
first-degree relative
- ICD
International Classification of Diseases
- RR
relative risk
- SDR
second-degree relative
- TDR
third-degree relative
- UPDB
Utah Population Database
Appendix. Authors
Study funding
This research was funded by RF1 AG054052. Partial support for all data sets within the Utah Population Database was provided by Huntsman Cancer Institute, Huntsman Cancer Foundation, University of Utah, and the Huntsman Cancer Institute's Cancer Center Support grant, P30 CA42014, from National Cancer Institute. L.A.C.-A. has support from Huntsman Cancer Foundation and George E. Wahlen Department of Veterans Affairs Medical Center, Salt Lake City, Utah.
Disclosure
L. Cannon-Albright reports no disclosures relevant to the manuscript. N. Foster reports receiving grant support from National Institute of Health, June Morris Trust, Rodney and Carolyn Brady Fund, and research funding from GE Health, AbbVie, Biogen, and Lilly Pharmaceuticals. Dr. Foster serves as a consultant for AbbVie, and is CEO and co-owner of Proactive Memory Services, Inc. K. Schliep, J. Farnham, C. Teerlink, H. Kaddas, J. Tschanz, C. Corcoran, and J. Kauwe report no disclosures relevant to the manuscript. Go to Neurology.org/N for full disclosures.
References
- 1.Herbert LE, Weuve J, Scherr PA, Evans DA. Alzheimer disease in the United States (2010–2050) estimated using the 2010 census. Neurology 2013;80:1778–1783. [DOI] [PMC free article] [PubMed] [Google Scholar]
- 2.Karch CM, Goate AM. Alzheimer's disease risk genes and mechanisms of disease pathogenesis. Biol Psychiatry 2015;77:43–51. [DOI] [PMC free article] [PubMed] [Google Scholar]
- 3.Guerreiro RJ, Gustafson DR, Hardy J. The genetic architecture of Alzheimer's disease: beyond APP, PSENs and APOE. Neurobiol Aging 2012;33:437–456. [DOI] [PMC free article] [PubMed] [Google Scholar]
- 4.Karch CM, Cruchaga C, Goate AM. Alzheimer's disease genetics: from the bench to the clinic. Neuron 2014;83:11–26. [DOI] [PMC free article] [PubMed] [Google Scholar]
- 5.Ward A, Crean S, Mercaldi CJ, et al. Prevalence of apolipoprotein e4 genotype and homozygotes (APOE er/r) among patients diagnosed with Alzheimer’s disease: a systemic review and meta-analysis. Neuroepidemiology 2012;38:1–17. [DOI] [PubMed] [Google Scholar]
- 6.Loy CT, Schofield PR, Turner AM, Kwok JB. Genetics of dementia. Lancet 2014;383:828–840. [DOI] [PubMed] [Google Scholar]
- 7.Holtzman DM, Herz J, Bu G. Apolipoprotein E and apolipoprotein E receptors: normal biology and roles in Alzheimer disease. Cold Spring Harb Perspect Med 2012;2:a006312. [DOI] [PMC free article] [PubMed] [Google Scholar]
- 8.Lambert JC, Ibrahim-Verbaas CA, Harold D, et al. Meta-analysis of 74,046 individuals identifies 11 new susceptibility loci for Alzheimer's disease. Nat Genet 2013;45:1452–1458. [DOI] [PMC free article] [PubMed] [Google Scholar]
- 9.Jonsson T, Stefansson H, Steinberg S, et al. Variant of TREM2 associated with the risk of Alzheimer's disease. N Engl J Med 2013;368:107–116. [DOI] [PMC free article] [PubMed] [Google Scholar]
- 10.Guerreiro R, Wojtas A, Bras J, et al. TREM2 variants in Alzheimer's disease. N Engl J Med 2013;368:117–127. [DOI] [PMC free article] [PubMed] [Google Scholar]
- 11.Scheltens P, Blennow K, Breteler MM, et al. Alzheimer's disease. Lancet 2016;388:505–517. [DOI] [PubMed] [Google Scholar]
- 12.Ridge PG, Hoyt KB, Boehme K, et al. Assessment of the genetic variance of late-onset Alzheimer's disease. Neurobiol Aging 2016;41:200-e20. [DOI] [PMC free article] [PubMed] [Google Scholar]
- 13.Kauppi K, Fan CC, McEvoy LK, et al. Combining polygenic hazard score with volumetric MRI and cognitive measures improves prediction of progression from mild cognitive impairment to Alzheimer's disease. Front Neurosci 2018;12:260. [DOI] [PMC free article] [PubMed] [Google Scholar]
- 14.Tan CH, Fan CC, Mormino EC, et al. Polygenic hazard score: an enrichment marker for Alzheimer's associated amyloid and tau deposition. Acta Neuropathol 2018;135:85–93. [DOI] [PMC free article] [PubMed] [Google Scholar]
- 15.Chaudhury S, Patel T, Barber IS, et al. Polygenic risk score in postmortem diagnosed sporadic early-onset Alzheimer's disease. Neurobiol Aging 2018;62:244.e1–244.e8. [DOI] [PMC free article] [PubMed] [Google Scholar]
- 16.Cruchaga C, Del-Aguila JL, Saef B, et al. Polygenic risk score of sporadic late-onset Alzheimer's disease reveals a shared architecture with the familial and early-onset forms. Alzheimers Dement 2018;14:205–214. [DOI] [PMC free article] [PubMed] [Google Scholar]
- 17.Desikan RS, Fan CC, Wang Y, et al. Genetic assessment of age-associated Alzheimer disease risk: development and validation of a polygenic hazard score. PLoS Med 2017;14:e1002258. [DOI] [PMC free article] [PubMed] [Google Scholar]
- 18.Escott-Price V, Shoai M, Pither R, Williams J, Hardy J. Polygenic score prediction captures nearly all common genetic risk for Alzheimer's disease. Neurobiol Aging 2017;49:214.e7–214.e11. [DOI] [PubMed] [Google Scholar]
- 19.Donix M, Small GW, Bookheimer SY. Family history and APOE-4 genetic risk in Alzheimer's disease. Neuropsychol Rev 2012;22:298–309. [DOI] [PMC free article] [PubMed] [Google Scholar]
- 20.Cupples LA, Farrer LA, Sadovnick AD, Relkin N, Whitehouse P, Green RC. Estimating risk curves for first-degree relatives of patients with Alzheimer’s disease: the REVEAL study. Genet Med 2004;6:192–196. [DOI] [PubMed] [Google Scholar]
- 21.Fratiglioni L, Ahlbom A, Viitanen M, Winblad B. Risk factors for late-onset Alzheimer's disease: a population-based, case-control study. Ann Neurol 1993;33:258–266. [DOI] [PubMed] [Google Scholar]
- 22.van Duijn CM, Clayton D, Chandra V, et al. Familial aggregation of Alzheimer’s disease and related disorders: a collaborative re-analysis of case control studies. Int J Epidemiol 1991;20:S13–S20. [DOI] [PubMed] [Google Scholar]
- 23.Cannon Albright LA. Utah family-based analysis: past, present and future. Hum Hered 2008;65:209–220. [DOI] [PubMed] [Google Scholar]
- 24.Kauwe JS, Ridge PG, Foster NL, Cannon-Albright LA. Strong evidence for a genetic contribution to late-onset Alzheimer's disease mortality: a population-based study. PLoS One 2013;8:e77087. [DOI] [PMC free article] [PubMed] [Google Scholar]
- 25.Agresti A. Categorical Data Analysis. New York: Wiley; 1990. [Google Scholar]
- 26.Farrer LA, O'Sullivan DM, Cupples LA, Growdon JH, Myers RH. Assessment of genetic risk for Alzheimer's disease among first-degree relatives. Ann Neurol 1989;25:485–493. [DOI] [PubMed] [Google Scholar]
- 27.Liddell MB, Lovestone S, Owen MJ. Genetic risk of Alzheimer's disease: advising relatives. Br J Psychiatry 2001;178:7–11. [DOI] [PubMed] [Google Scholar]
- 28.Reitz C, Brayne C, Mayeux R. Epidemiology of Alzheimer disease. Nat Rev Neurol 2011;7:137–152. [DOI] [PMC free article] [PubMed] [Google Scholar]
- 29.Van Cauwenberghe C, Van Broeckhoven C, Sleegers K. The genetic landscape of Alzheimer disease: clinical implications and perspectives. Genet Med 2016;18:421–430. [DOI] [PMC free article] [PubMed] [Google Scholar]
- 30.Green RC, Cupples LA, Go R, et al. Risk of dementia among white and African American relatives of patients with Alzheimer disease. JAMA 2002;287:329–336. [DOI] [PubMed] [Google Scholar]
- 31.Cannon-Albright LA, Dintelman S, Maness T, et al. A population genealogy resource shows evidence of familial clustering for Alzheimer’s disease. Neurol Genet 2018;4:e249. [DOI] [PMC free article] [PubMed] [Google Scholar]
- 32.Li G, Silverman JM, Smith CJ, et al. Age at onset and familial risk in Alzheimer's disease. Am J Psychiatry 1995;152:424–430. [DOI] [PubMed] [Google Scholar]
- 33.Lautenschlager NT, Cupples LA, Rao VS, et al. Risk of dementia among relatives of Alzheimer's disease patients in the MIRAGE study: what is in store for the oldest old? Neurology 1996;46:641–650. [DOI] [PubMed] [Google Scholar]
- 34.Farrer LA, Cupples LA, van Duijn CM, et al. Apolipoprotein E genotype in patients with Alzheimer's disease: implications for the risk of dementia among relatives. Ann Neurol 1995;38:797–808. [DOI] [PubMed] [Google Scholar]
- 35.van Duijn CM, Farrer LA, Cupples LA, Hofman A. Genetic transmission of Alzheimer's disease among families in a Dutch population based study. J Med Genet 1993;30:640–646. [DOI] [PMC free article] [PubMed] [Google Scholar]
- 36.Mosconi L, Berti V, Swerdlow RH, Pupi A, Duara R, de Leon M. Maternal transmission of Alzheimer’s disease: prodromal metabolic phenotype and the search for genes. Hum Genomics 2010;4:170–193. [DOI] [PMC free article] [PubMed] [Google Scholar]
- 37.Ridge PG, Maxwell TJ, Corcoran CD, et al. Mitochondrial genomic analysis of late onset Alzheimer’s disease reveals protective haplogroups H6A1A/H6A1B: the Cache County Study on Memory in Aging. PLoS One 2012;7:e45134. [DOI] [PMC free article] [PubMed] [Google Scholar]
- 38.Edland SD, Silverman JM, Peskind ER, Tsuang D, Wijsman E, Morris JC. Increased risk of dementia in mothers of AD cases: evidence for maternal inheritance. Neurology 1996;47:254–256. [DOI] [PubMed] [Google Scholar]
- 39.de Bruijn RF, Ikram MA. Cardiovascular risk factors and future risk of Alzheimer's disease. BMC Med 2014;12:130. [DOI] [PMC free article] [PubMed] [Google Scholar]
- 40.de Bruijn RF, Bos MJ, Portegies ML, et al. The potential for prevention of dementia across two decades: the prospective, population-based Rotterdam Study. BMC Med 2015;13:132. [DOI] [PMC free article] [PubMed] [Google Scholar]
- 41.Ngandu T, Lehtisalo J, Solomon A, et al. A 2 year multidomain intervention of diet, exercise, cognitive training, and vascular risk monitoring versus control to prevent cognitive decline in at-risk elderly people (FINGER): a randomised controlled trial. Lancet 2015;385:2255–2263. [DOI] [PubMed] [Google Scholar]
- 42.Rosenberg A, Ngandu T, Rusanen M, et al. Multidomain lifestyle intervention benefits a large elderly population at risk for cognitive decline and dementia regardless of baseline characteristics: the FINGER trial. Alzheimer Dement 2018;14:263–270. [DOI] [PubMed] [Google Scholar]
- 43.Allan CL, Behrman S, Ebmeier KP. Early diagnosis beneficial in Alzheimer's disease. Practitioner 2013;257:15–22. [PubMed] [Google Scholar]
- 44.Taylor DP, Burt RW, Williams MS, Haug PJ, Cannon-Albright LA. Population-based family history-specific risks for colorectal cancer: a constellation approach. Gastroenterology 2010;138:877–885. [DOI] [PMC free article] [PubMed] [Google Scholar]
- 45.Albright FS, Stephenson RA, Agarwal N, et al. Prostate cancer risk prediction based on complete prostate cancer family history. Prostate 2015;75:390–398. [DOI] [PMC free article] [PubMed] [Google Scholar]
- 46.Frecker MF, Pryse-Phillips WE, Strong HR. Alzheimer's disease death certificates. Neurology 1995;45:2298–2299. [DOI] [PubMed] [Google Scholar]
- 47.Raiford K, Anton-Johnson S, Haycox Z, et al. CERAD part VII: accuracy of reporting dementia on death certificates of patients with Alzheimer's disease. Neurology 1994;44:2208–2209. [DOI] [PubMed] [Google Scholar]
- 48.Ostbye T, Taylor DH, Jr., Clipp EC, Scoyoc LV, Plassman BL. Identification of dementia: agreement among national survey data, Medicare claims, and death certificates. Health Serv Res 2008;43:313–326. [DOI] [PMC free article] [PubMed] [Google Scholar]
- 49.Tschanz JT, Corcoran C, Skoog I, et al. Dementia: the leading predictor of death in a defined elderly population: the Cache County Study. Neurology 2004;62:1156–1162. [DOI] [PubMed] [Google Scholar]
- 50.Gill TM, Gahbauer EA, Han L, Allore HG. Trajectories of disability in the last year of life. N Engl J Med 2010;362:1173–1180. [DOI] [PMC free article] [PubMed] [Google Scholar]
- 51.Martyn CN, Pippard EC. Usefulness of mortality data in determining the geography and time trends of dementia. J Epidemiol Community Health 1988;42:134–137. [DOI] [PMC free article] [PubMed] [Google Scholar]
- 52.McLellan T, Jorde LB, Skolnick MH. Genetic distances between the UT Mormons and related populations. Am J Hum Genet 1984;36:836–857. [PMC free article] [PubMed] [Google Scholar]
- 53.Jorde LB. Inbreeding in the Utah Mormons: an evaluation of estimates based on pedigrees, isonymy, and migration matrices. Ann Hum Genet 1989;53:339–355. [DOI] [PubMed] [Google Scholar]
Associated Data
This section collects any data citations, data availability statements, or supplementary materials included in this article.
Data Availability Statement
Access to UPDB data is allowed with appropriate application and approval.


