Abstract
Objective
To describe the brain MRI findings in asymptomatic patients with childhood cerebral adrenoleukodystrophy (CCALD).
Methods
We retrospectively reviewed a series of biochemically or genetically confirmed cases of adrenoleukodystrophy followed at our institution between 2001 and 2015. We identified and analyzed 219 brain MRIs from 47 asymptomatic boys (median age 6.0 years). Patient age, MRI scan, and brain lesion characteristics (e.g., contrast enhancement, volume, and Loes score) were recorded. The rate of lesion growth was estimated using a linear mixed effect model.
Results
Sixty percent of patients (28/47) showed brain lesions (median Loes score of 3.0 points; range 0.5–11). Seventy-nine percent of patients with CCALD (22/28) had contrast enhancement on first lesional or subsequent MRI. Lesion progression (Loes increase of ≥0.5 point) was seen in 50% of patients (14/28). The rate of lesion growth (mL/mo) was faster in younger patients (r = −0.745; p < 0.0001). Older patients (median age 14.4 y/o) tended to undergo spontaneous arrest of disease. Early lesions grew 46× faster when still limited to the splenium, genu of the corpus callosum, or the brainstem (p = 0.001).
Conclusion
We provide a description of CCALD lesion development in a cohort of asymptomatic boys. Understanding the early stages of CCALD is crucial to optimize treatments for children diagnosed by newborn screening.
X-linked adrenoleukodystrophy (ALD) is caused by mutations in the ABCD1 gene, which encodes the peroxisome transporter protein ATP-binding cassette domain 1 (ABCD1). Mutations lead to an accumulation of very long-chain fatty acids (VLCFA) in plasma and tissues. A total of 35% of boys with ALD develop childhood cerebral ALD (CCALD), the most severe form of the disease.1 CCALD is characterized by myelin destruction, microglial apoptosis, and blood–brain barrier disruption.2,3 Eighty-five to ninety percent of patients with CCALD will progress to inflammatory demyelination. A total of 10%–15% of patients will have spontaneous arrest of disease (self-halted CCALD), without evidence of brain inflammation.1,4,5 CCALD lesions on MRI precede clinical symptoms. After an asymptomatic time period, patients undergo continuous neurologic decline, resulting in death within 2–3 years.1 Current cellular therapies are most successful when initiated in the window prior to neurologic symptoms in patients with progressive, inflammatory CCALD.5–10 Patients with self-halted CCALD are ineligible for treatment.1,4
MRI is the best available tool for detection and surveillance of CCALD. Typical MRI findings of advanced CCALD have been extensively described.10 Most commonly, brain lesions appear as confluent, symmetrical areas of T2 hyperintensity that originate in the splenium of the corpus callosum and extend into the parieto-occipital periventricular white matter. A rim of contrast enhancement may appear, which indicates active inflammation in the brain.5
There are few reports describing brain MRI findings in asymptomatic patients with ALD, especially with sequential follow-up imaging.11 The recent addition of ALD to the Recommended Universal Screening Panel has given renewed urgency to understand early brain lesion characteristics in presymptomatic patients.12
We provide a description of brain lesion characteristics with serial MRI follow-up, including lesion volumetric analysis, in a cohort of asymptomatic boys with ALD. An understanding of early-stage disease progression is necessary to improve lesion detection and selection of patients for early treatment.
Methods
The primary objective of this study is to describe the brain MRI findings in a cohort of asymptomatic patients with CCALD.
Participants
We performed a retrospective review of our hospital medical records to select cases of asymptomatic patients with ALD who were evaluated between 2001 and 2015. The inclusion criteria were as follows: (1) confirmed diagnosis of ALD by genetic testing (ABCD1 gene mutation) or high levels of plasma VLCFA13; (2) Neurologic Functional Scale (NFS)1 of 0, performed by one of two experienced pediatric neurologists (F.S.E. and P.L.M.); and (3) available brain MRI with at least one axial T2-weighted (T2W) sequence. CCALD was defined as patients with a positive lesion on brain MRI. Asymptomatic was defined as an NFS of 0 (score range 0–15). Neuropsychological evaluation was not considered in our study. MRI surveillance every 6 months between the ages of 3 and 10 years, published by the New York State Newborn Screening workgroup, was followed.12
Imaging
MRI measures
Only pretreatment MRI scans (prior to hematopoietic stem cell transplantation or gene therapy) were included. MRI studies of the brain were performed on 1.5T/3.0T MRI units (Siemens, Munich, Germany; General Electric Medical Systems, Milwaukee, WI; Philips Medical Systems, Cleveland, OH) from Massachusetts General Hospital and various institutions around the world, using 8–12 channel head coils. Outside images were imported into our hospital's imaging database. At least one axial T2W sequence was included in each MRI protocol. The T2W sequences analyzed (including parameters) were axial or sagittal fluid-attenuated inversion recovery (frequency 350–400, phase 250–300, slice thickness 3–5 mm, gap 0–1 mm, number of excitations [NEX] 2–3, field of view [FOV] 22 × 22 to 24 × 24 cm) and axial T2 (frequency 350–400, phase 250–300, slice thickness 3–5 mm, gap 0–1 mm, NEX 2–3, FOV 22 × 22 to 24 × 24 cm). The pre/postcontrast T1-weighted (T1W) sequences (including parameters) were axial or sagittal T1W images (frequency 350–400, phase 250–300, slice thickness 3–5 mm, gap 0–1 mm, NEX 2–3, FOV 22 × 22 to 24 × 24 cm). The time of contrast bolus administration ranged from 2 to 17 minutes, whenever recorded.
Imaging analysis
Each MRI scan was reviewed by a board-certified pediatric neuroradiologist (P.A.C.), a neuroradiologist (A.L.), and a pediatric neurologist (P.L.M.). The reviewers were partially blinded to patient age (minimum age of 3 years was known to allow for appropriate scan interpretation in the context of normal age-dependent degree of myelination) and blinded to other clinical information (i.e., name, medical record number, sibling or parental data, genotype or biochemical data, outcome). Patient demographics, number of scans, follow-up duration, follow-up interval, and brain lesion characteristics were recorded for all MRI scans.
Lesion burden and pattern
Reviewers evaluated T2W sequences for abnormal signal hyperintensity or atrophy involving specific brain structures known to be involved in CCALD. Lesional MRIs were scored according to the Loes MRI severity scoring system, a validated tool for monitoring white matter changes by degree and extent of T2W hyperintense regions.14 Scores range from 0 to 34. Higher scores represent greater lesion burden. In our study, the presence of a brain lesion was defined as a Loes score of ≥0.5.
The lesions were subdivided into 5 patterns according to their primary anatomic distribution as previously published15: (1) parieto-occipital lobe white matter or splenium of the corpus callosum; (2) frontal lobe white matter or genu of the corpus callosum; (3) frontopontine or corticospinal projection fibers; (4) cerebellar white matter; and (5) simultaneous parieto-occipital and frontal white matter involvement.
Lesion contrast enhancement
The readers assessed MRI scans with available postcontrast sequences for the presence of lesional contrast enhancement. Presence of contrast enhancement was defined as an abnormal hyperintensity present on the postcontrast T1W sequence, which was not present at the same site on precontrast T1W sequence. Whenever present, the pattern of contrast enhancement was also recorded.
Lesion progression
In patients with CCALD, the first abnormal scan was used as the reference for progression analysis. Progression was defined as an increase in Loes score by ≥0.5 points in subsequent MRI scans. Patients with unchanged Loes scores during serial MRI follow-up were categorized as having stable Loes scores. Those with stable Loes scores without associated lesion contrast enhancement were considered to have self-halted disease.4
Progression was also assessed by calculating lesion volumes. 3D-SLICER software, a free open source software platform for biomedical research, was used to create 3D label maps of the lesion by thresholding the label intensity to match the lesion on the source axial T2W sequence.16,17 Lesions were then manually segmented voxel-by-voxel, restricted to subject-specific threshold values. Lesion volumes were calculated semi-automatically from the 3D label maps, and are reported in milliliters. Lesion growth rate is reported in on a timescale of months. Correlations were performed between brain lesion growth rates, patient age, and Loes scores at first lesional MRI. In addition, we performed subgroup comparisons between patients with Loes scores ≤1 (early lesion) and Loes scores >1 to evaluate for differences in the lesion growth rate.
Statistical analysis
Continuous variables (age, follow-up duration, follow-up interval, Loes score, and lesion volume) are reported as median and range. Binary variables (presence of brain lesion, contrast enhancement, lesion progression) and the categorical variable (lesion patterns) are summarized as percentages whenever appropriate. Lesion volumes were calculated for all patients with CCALD, with 2 exceptions. Patient 40 presented with extensive cerebral disease that, when compared to the population volumetric average, produced an extreme outlier. Patient 42 presented with small, multifocal brainstem lesions that limited accurate volumetric measurements.
A linear mixed-effect regression model with random intercept and slope and best linear unbiased prediction was performed to assess estimated brain lesion growth rates. The model assumes each calculated volume to be an independent variable with a normally distributed error, and therefore foregoes within-subject volumetric changes over time. In patients with stable Loes scores, the percent change in lesion volume was calculated over the total MRI follow-up period. Spearman rank test was used for correlation analysis. We used a Wilcoxon-Mann-Whitney test to compare differences in lesion volume and growth rate among independent groups of patients with distinct Loes scores. Stata statistical software release 14 (StataCorp LP, College Station, TX) was used for data analysis. p Values lower than 0.05 were considered statistically significant.
Standard protocol approvals, registrations, and patient consents
Participant data were retrospectively reviewed and de-identified and storage was encrypted and password protected. Due to anonymization, consent was waived. Our hospital institutional review board approved this study. Protocol number: 2012P000132.
Data availability
Following publication, any data not published within this article will be anonymized and shared by request from any qualified investigator.
Results
Participants
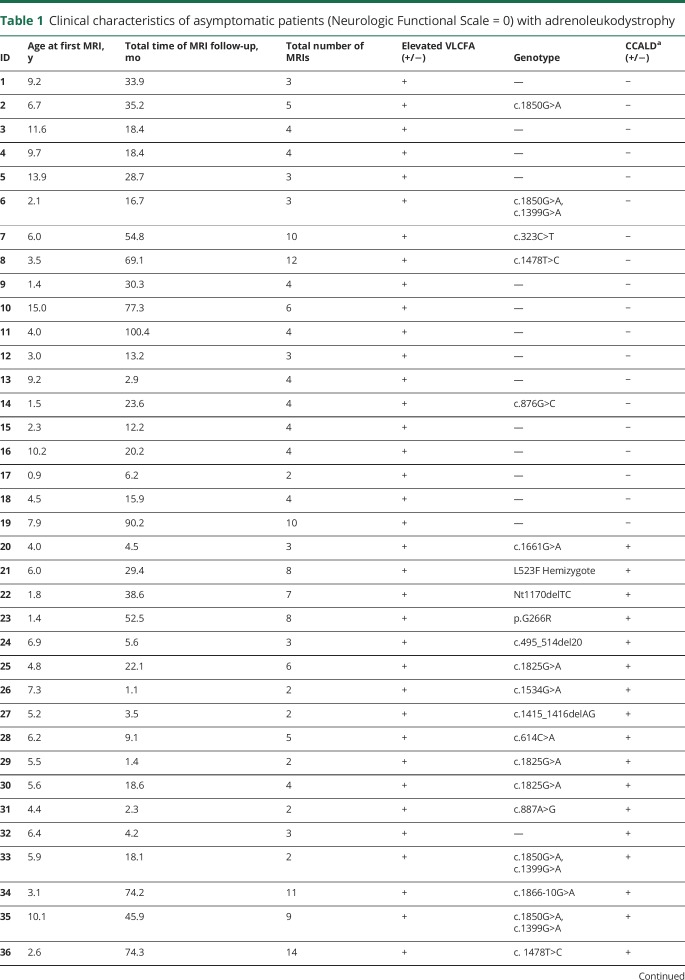
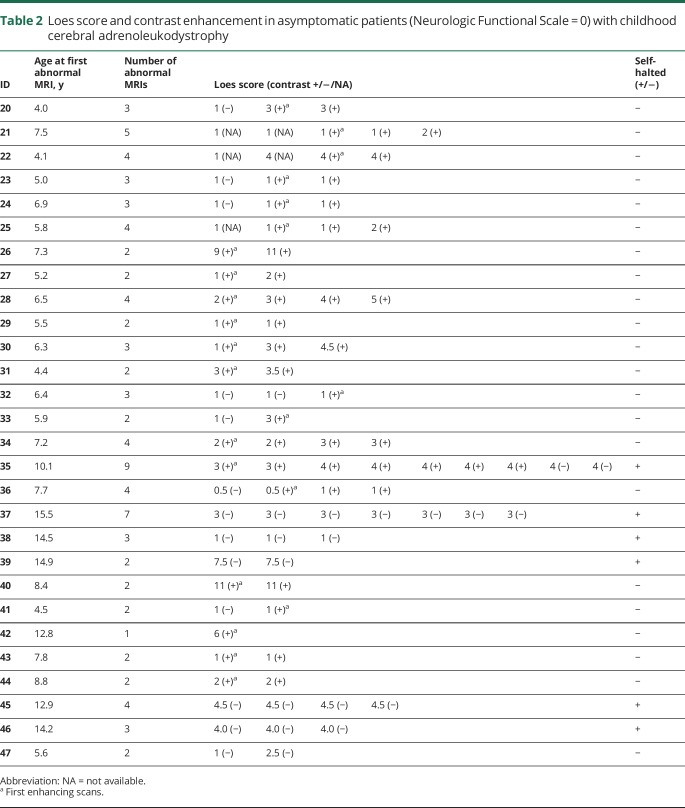
A total of 47 asymptomatic boys with X-linked ALD were included in the study (median age 6.0 years at first MRI; range 1.4–15.5 years). All patients included in the study had elevated VLCFAs, and 57% of patients had ALD genetic testing (table 1). All patients were diagnosed due to a known family history of ALD or presence of adrenal insufficiency.
Table 1.
Clinical characteristics of asymptomatic patients (Neurologic Functional Scale = 0) with adrenoleukodystrophy
Imaging analysis
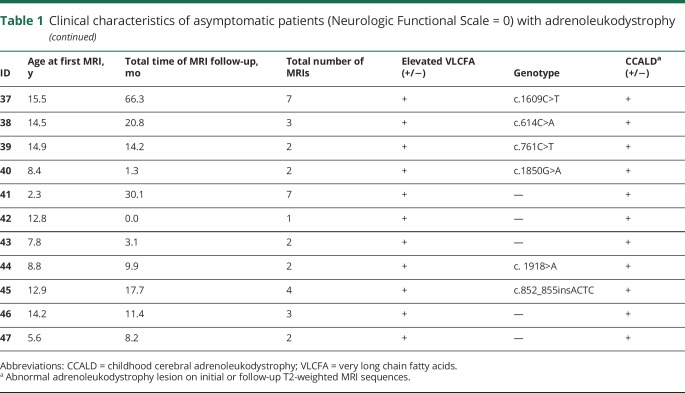
A total of 219 MRI scans were included in the study. A total of 47% were acquired in our home institution. Of these, 55% (120), 44% (97), and 1% (2) of scans were performed on 1.5T, 3.0T, and 1.0T MRI units, respectively. The median number of scans per patient was 4 (range 1–14), follow-up duration was 18.4 months (range 0.0–100.4 months), divided among 6.3-month intervals (range 0.8–64.7 months) (table 1). Eighty-nine MRIs revealed cerebral lesions, and 94% of them included pre- and postcontrast sequences (table 2).
Table 2.
Loes score and contrast enhancement in asymptomatic patients (Neurologic Functional Scale = 0) with childhood cerebral adrenoleukodystrophy
CCALD group
Sixty percent of patients (28/47) manifested CCALD on initial or follow-up MRI (median age 7.1 years at first abnormal MRI; range 4.0–15.5 years) (table 2). The median number of total scans per patient was 3 (range 2–9), distributed over a follow-up period of 18.1 months (range 1.1–90.2 months), with a follow-up interval of 6.3 months (range 0.8–18.1 months) (table 1).
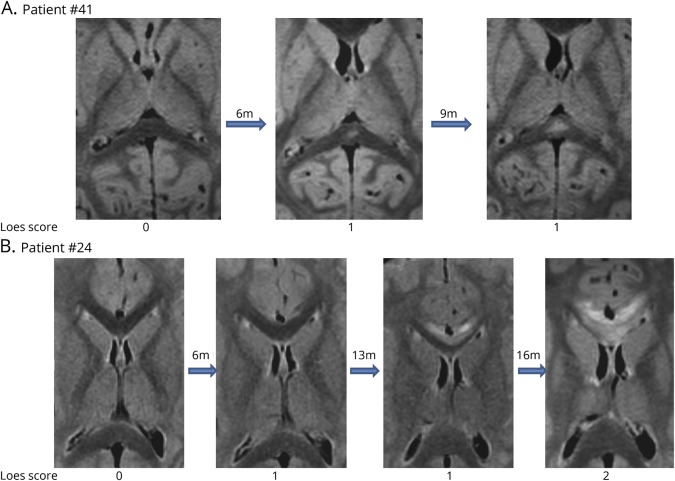
Eleven of the 28 patients initially presented with a normal MRI (median age of 3.1 years, range 1.4–7.9 years), and subsequently converted to CCALD at 6.3 years (range 4.1–11.4 years) (figure 1).
Figure 1. Conversion to childhood cerebral adrenoleukodystrophy on MRI.
Development of a T2-hyperintense lesion in the splenium of a 4-year-old boy (A) and genu of a 5.3-year-old boy (B) from previously normal imaging (Loes score of 0).
Non-CCALD group
The median age of the remaining 19 patients without evidence of cerebral disease was 6.0 years at first MRI (range 0.9–15 years). The median number of scans per patient was 4 (range 2–12), distributed over a follow-up duration of 23.6 months (range 2.9–100.4 months), with an interval of 6.3 months (range 2.9–64.7 months) (table 1).
Lesion burden and pattern
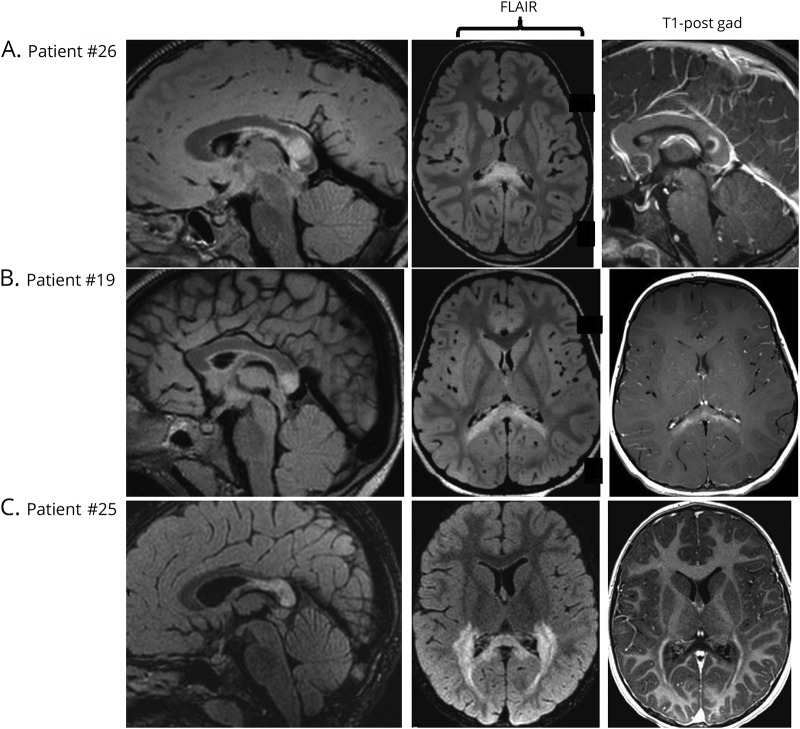
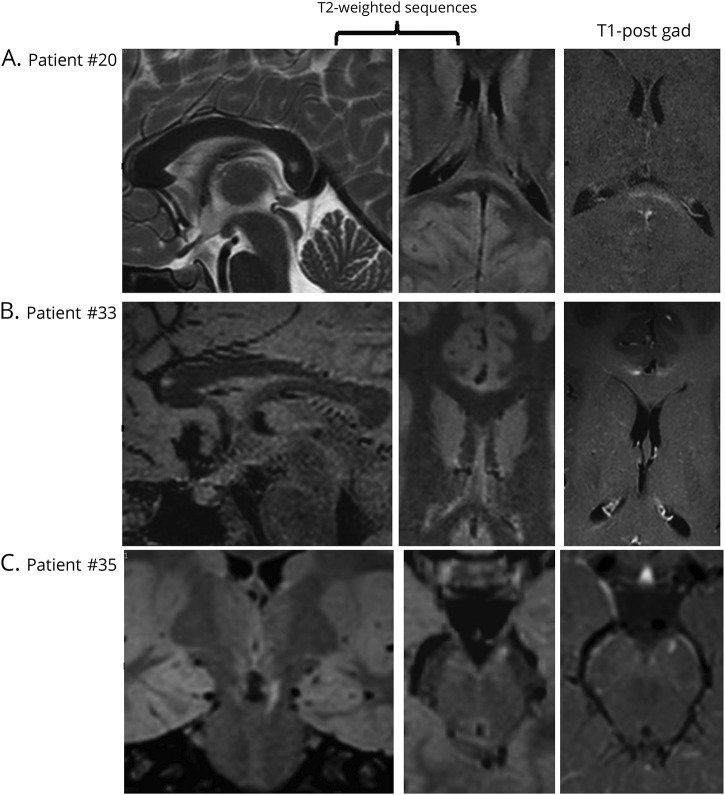
The median Loes score in patients with CCALD was 3.0 (range 0.5–11) (table 2, figure 2). Among the 11 patients with a normal baseline MRI who subsequently converted to CCALD, the median Loes score was 1 (range 0.5–5). The most frequent lesion distribution was pattern 1 (n = 18 patients, 60%), followed by patterns 2 and 3 (n = 5 patients, 17%, each). No patients in our case series had pattern 4 lesions, and only 2 (6%) had pattern 5 lesions. The initial brain lesions were located in the splenium (pattern 1) and genu of the corpus callosum (pattern 2) as well as in the corticospinal or frontopontine tracts (pattern 3). Splenium and genu lesions of the corpus callosum were located at the midline. While the former may originate either in the ventral or dorsal half of the corpus callosum, the latter was typically centered in its most rostroventral portion juxtaposed to the callosal sulcus. Frontopontine or corticospinal tract lesions in the brainstem were usually bilateral and symmetrical except for one case where the first lesion arose from the left frontopontine projection fiber (figure 3).
Figure 2. Loes scores and patterns of enhancement on MRI.
(A) A 5.5-year-old boy with a T2-hyperintense lesion in the splenium, Loes score of 2, and ring-like enhancement on T1-weighted postcontrast MRI. (B) A 4.3-year-old boy with a lesion in the splenium, Loes score of 3, and patchy enhancement. (C) A 7.4-year-old boy with a lesion in the splenium extending into the parieto-occipital white matter, Loes score of 11, with peripheral enhancement.
Figure 3. Early detection of childhood cerebral adrenoleukodystrophy on MRI.
(A) An 8-year-old boy with a T2-hyperintense lesion in the splenium of the corpus callosum, Loes score of 1. (B) A 7.2-year-old boy with a lesion in the genu of the corpus callosum, Loes score of 1. (C) An 8.2-year-old boy with a lesion in the left frontopontine projection fibers, Loes score of 0.5. Contrast enhancement can be appreciated in all cases.
Lesion contrast enhancement
Seventy-nine percent of patients (22/28) had lesional contrast enhancement. A total of 54% (12/22) presented with contrast enhancement on first MRI (median age 7.3 years, range 4.4–12.8), with a median Loes score of 2 (range 1–11).
The 7 patients who converted to contrast enhancement (e.g., had an available noncontrast enhancing image followed by a contrasting enhancing image) were a median age of 5.9 years (range 4.0–7.7) and had a Loes score of 1 (range 0.5–3.0) over a time period of 5.3 months (range 2.1–18.1 months) (figure 4). The most frequent pattern of enhancement was peripheral (rim), around the edges of the lesions, although patchy and solid patterns were also seen (figure 2). Curiously, patient 35 had a stable lesion (pattern 3) that initially showed contrast enhancement. However, it was not detected on MRI follow-up.
Figure 4. Development of contrast enhancement in a cerebral adrenoleukodystrophy lesion.
A 6.9-year-old boy, nonenhancing lesion in the splenium of the corpus callosum, Loes score of 1, develops contrast enhancement on the following MRI 5.6 months later.
Lesion progression
Progression by Loes score
Lesion progression by Loes score was found in 50% of patients (14/28, median age 6.1 years, range 4.0–10.1). Initial scans in this subgroup had a median Loes score of 1 (range 0.5–9).
Twenty-one percent (6/28) of CCALD patients (median 14.4 years of age; range 12.9–15.5 years) showed self-halted brain lesions (median Loes score of 4; range 1–7.5) over a follow-up duration of 17.7 months (range 4.6–66.3 months). The median number of abnormal scans per patient was 3.5 (range 2–9).
Progression by volumetric analysis
Of the 26 patients in whom volumetric analysis was possible (n = 86 MRI scans), the median lesion growth rate was 0.19 mL/mo (range −0.07 to 1.30 mL/mo). The lesion growth rate had a strong, inverse correlation with patient age at first abnormal MRI (r = −0.745; p < 0.0001) (figure 5). The association between lesion growth rate and the Loes score of the first abnormal MRI did not reach statistical significance (r = −0.379; p = 0.056).
Figure 5. Correlation of lesion growth rate and age.
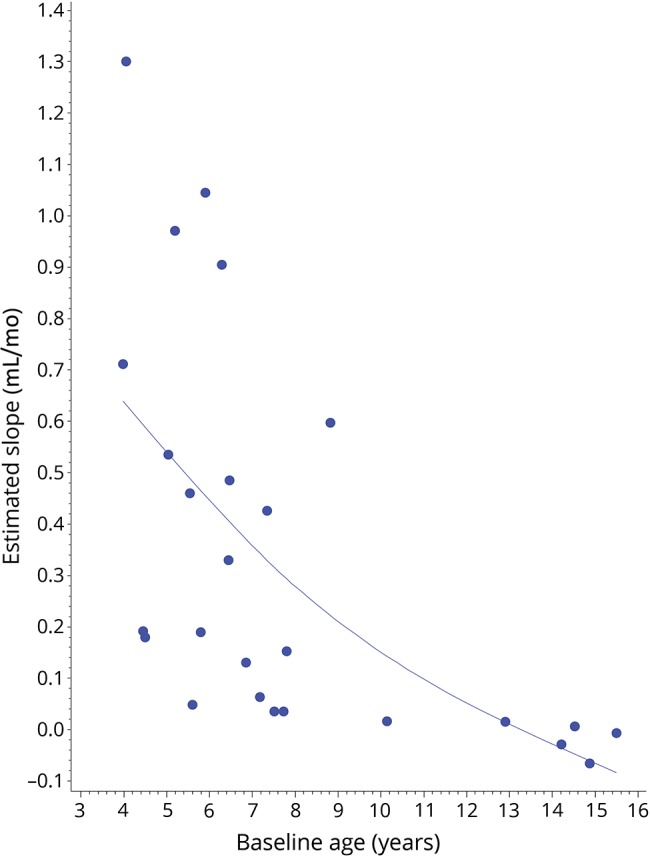
A strong, negative relationship between rate of lesion growth (mL/mo) and patient age (years) at first abnormal MRI can be appreciated (r = −0.745; p < 0.0001).
In the self-halted group, 3 patients showed a minor decrease in lesion volume during total follow-up. The remaining 3 patients had an increase of 0%–21% in lesion volume despite no change in score as captured by the semiquantitative gold standard.
Subgroup comparisons
Twenty patients had stable Loes scores over at least 1 follow-up period. A total of 50% (10/20) had sequential early lesions (Loes score ≤1). The median percent lesion volume change was higher in patients with Loes scores ≤1 (153%; range 8.3–13,045) as compared to patients with Loes scores >1 (11.1%; range −21.2 to 695.5, p = 0.006). The lesion growth rate was 46 times faster in patients with stable Loes scores ≤1 (84.3% volume change/mo; range 1.5–1,404) when compared to those with Loes scores >1 (1.8% volume change/mo; range −1.7 to 71.2, p = 0.001). The median MRI follow-up time did not differ between subgroups (5.6 months; range 1.4–20.8 vs 11 months; range 0.9–66.6, p = 0.200). The number of MRI scans was similar in both groups (3; range 2–4, vs 2; range 2–9, p = 0.942).
Discussion
CCALD remains one of the most devastating neurologic disorders of childhood. Our study describes early lesion development in asymptomatic boys with ALD. Among the 47 patients reviewed, over half (60%) presented with CCALD. Initial lesion size varied widely, and contrast enhancement was not uniformly present. The most important risk factors for rapid lesion growth rate were young age and small initial lesion size.
Eighty to eighty-five percent of patients with CCALD will convert to the expected phenotype of rapid inflammatory demyelination.1 Contrast enhancement at the site of the lesion is the hallmark of active inflammatory disease, indicative of blood–brain barrier disruption and translocation of leukocytes into brain.3,18 Seventy-nine percent of patients in our cohort had active brain inflammation. Only 54% of patients with CCALD presented with contrast enhancement on first MRI. The median age of the 7 patients with CCALD who converted to the inflammatory phenotype on MRI was 5.9 years.
A previous study described a 30%–35% occurrence of CCALD in patients up to 10 years of age, but did not discriminate based on presence or absence of symptoms.1 Spontaneous arrest of brain demyelination was described in 10%–15% of cases.1,4 In our study, 21% of the asymptomatic CCALD cases underwent spontaneous arrest. They tended to be older patients, with a median age of 14.4 years.
Consistent with prior reports,15 we demonstrated that most lesions in the brain originate in the midline of the corpus callosum, especially in the splenium (60%). Less commonly, they arise from the genu (17%) or frontopontine or corticospinal projection fibers (17%) in the brainstem. Least common are the combined frontal and parieto-occipital white matter lesions. Two patients who originally presented with pattern 1 lesions progressed to pattern 5 in this report.
Lesion progression observed in 50% of our patients may have been underestimated by the current scoring system. Patients with early stable Loes scores (≤1) showed an increase in lesion size when measured volumetrically (153% median volume change). In addition, lesions grew faster in the younger patients (r = −0.745). Conversely, lesions in patients with self-halted disease remained volumetrically stable, with a maximum increase in size of 21%, without change in Loes score. The detection of a minor decrease in lesional volume may reflect variability between measurements at different time points, or local atrophy around the lesion over time. Neither the natural history of disease nor serial reports of the Loes score have demonstrated spontaneous regression of lesions in CCALD. Ultimately, the Loes score on the first abnormal MRI was not predictive of growth rate. These observations suggest that boys with small lesions captured at an early age, the situation now made possible by newborn screening, require closer follow-up imaging (e.g., every 3 months) with volumetric analysis to establish disease trajectory and need for intervention.
The underlying pathologic substrate of white matter lesions on MRI in early CCALD remains unclear. Studies in the literature have correlated MR lesions with histopathology, but most have focused on patients with advanced disease.2,15,19 Currently, the earliest T2 sequence abnormality is thought to be due to myelin membrane instability and oxidative stress, which triggers the initial damage in CALD.14 The contrast enhancement seen at later stages may be due to endothelial dysfunction, as ABCD1 is thought to play a role in tight junction maintenance.3,5,18
Our study has several limitations. As a referral center, sampling bias due to geographic, racial, and socioeconomic factors may have influenced our results. Like prior studies, heterogeneity of MR field strength and sequence measures seen in our series could have led to potential errors in brain lesion evaluation. Finally, we used the NFS as a measure of clinical sign and symptom burden. Without neuropsychological testing, subtle cognitive symptoms may have been missed20 and thus, asymptomatic patients may have been overestimated.
In light of the recent addition of ALD to the Recommended Uniform Screening Panel, we expect a substantial increase in the early stage diagnosis of childhood cerebral ALD in the coming years. Therefore, familiarity with the evolution of early cerebral lesions on MRI is paramount to improve diagnosis and follow-up surveillance, and to help optimize the selection of patients for rescue therapies.
Glossary
- ABCD1
ATP-binding cassette domain 1
- ALD
adrenoleukodystrophy
- CCALD
childhood cerebral adrenoleukodystrophy
- FOV
field of view
- NEX
number of excitations
- NFS
Neurologic Functional Scale
- T1W
T1-weighted
- T2W
T2-weighted
- VLCFA
very long-chain fatty acids
Footnotes
Editorial, page 691
Author contributions
A. Liberato: conceptualized and designed the study, drafted the initial manuscript. E. Mallack: carried out the data analyses, completed the manuscript, critically reviewed and revised the manuscript. R. Aziz-Bose: collected data and carried out the initial analyses. D. Hayden: carried out the data analyses and reviewed the manuscript. A. Lauer: designed the data collection instruments, carried out initial analyses. P. Musolino: designed the data collection instruments, supervised the data collection, carried out initial analyses, drafted the initial manuscript, and critically reviewed intellectual content. P. Caruso: designed the data collection instruments, carried out initial analyses. F. Eichler: conceptualized and designed the study, drafted the initial manuscript, supervised data collection, and critically reviewed the manuscript for important intellectual content. All authors approved the final manuscript as submitted and agree to be accountable for all aspects of the work.
Study funding
All phases of this study were supported by the NIH and the Leblang Foundation. Dr. Musolino is supported by a K08 and Dr. Mallack by a K12 (5 K12 NS066274-08), both from NINDS.
Disclosure
A. Liberato reports no disclosures relevant to the manuscript. E. Mallack receives research support from NINDS (5 K12 NS066274-08). R. Aziz-Bose, D. Hayden, A. Lauer, and P. Caruso report no disclosures relevant to the manuscript. P. Musolino receives research support from NINDS (K12NS066225-01A2, 1K08NS094683-01) and Minoryx. F. Eichler receives research support from FDA Orphan Disease Group (R01 FD004127), NINDS (R01 NS072446, R01 NS082331), Retrophin, Neurovia, bluebird bio, and AGTC. Go to Neurology.org/N for full disclosures.
References
- 1.Moser HW, Loes DJ, Melhem ER, et al. X-linked adrenoleukodystrophy: overview and prognosis as a function of age and brain magnetic resonance imaging abnormality: a study involving 372 patients. Neuropediatrics 2000;31:227–239. [DOI] [PubMed] [Google Scholar]
- 2.Eichler FS, Ren JQ, Cossoy M, et al. Is microglial apoptosis an early pathogenic change in cerebral X-linked adrenoleukodystrophy? Ann Neurol 2008;63:729–742. [DOI] [PubMed] [Google Scholar]
- 3.Musolino PL, Gong Y, Snyder JMT, et al. Brain endothelial dysfunction in cerebral adrenoleukodystrophy. Brain 2015;138:3206–3220. [DOI] [PMC free article] [PubMed] [Google Scholar]
- 4.Korenke GC, Pouwels PJ, Frahm J, et al. Arrested cerebral adrenoleukodystrophy: a clinical and proton magnetic resonance spectroscopy study in three patients. Pediatr Neurol 1996;15:103–107. [DOI] [PubMed] [Google Scholar]
- 5.Melhem ER, Loes DJ, Georgiades CS, Raymond GV, Moser HW. X-linked adrenoleukodystrophy: the role of contrast-enhanced MR imaging in predicting disease progression. AJNR Am J Neuroradiol 2000;21:839–844. [PMC free article] [PubMed] [Google Scholar]
- 6.Peters C, Charnas LR, Tan Y, et al. Cerebral X-linked adrenoleukodystrophy: the international hematopoietic cell transplantation experience from 1982 to 1999. Blood 2004;104:881–888. [DOI] [PubMed] [Google Scholar]
- 7.Moser HW, Moser AB, Smith KD, et al. Adrenoleukodystrophy: phenotypic variability and implications for therapy. J Inherit Metab Dis 1992;15:645–664. [DOI] [PubMed] [Google Scholar]
- 8.van Geel BM, Bezman L, Loes DJ, Moser HW, Raymond GV. Evolution of phenotypes in adult male patients with X-linked adrenoleukodystrophy. Ann Neurol 2001;49:186–194. [DOI] [PubMed] [Google Scholar]
- 9.Shapiro E, Krivit W, Lockman L, et al. Long-term effect of bone-marrow transplantation for childhood-onset cerebral X-linked adrenoleukodystrophy. Lancet 2000;356:713–718. [DOI] [PubMed] [Google Scholar]
- 10.Engelen M, Kemp S, De Visser M, et al. X-linked adrenoleukodystrophy (X-ALD): clinical presentation and guidelines for diagnosis, follow-up and management. Orphanet J Rare Dis 2012;7:1–14. [DOI] [PMC free article] [PubMed] [Google Scholar]
- 11.Gasparetto EL, Rosa JM, Davaus T, Neto ADC. Cerebral X-linked adrenoleukodystrophy: follow-up with magnetic resonance imaging. Arq Neuropsiquiatr 2006;64:1033–1035. [DOI] [PubMed] [Google Scholar]
- 12.Vogel BH, Bradley SE, Adams DJ, et al. Newborn screening for X-linked adrenoleukodystrophy in New York State: diagnostic protocol, surveillance protocol and treatment guidelines. Mol Genet Metab 2015;114:599–603. [DOI] [PubMed] [Google Scholar]
- 13.Moser AB, Kreiter N, Bezman L, et al. Plasma very long chain fatty acids in 3,000 peroxisome disease patients and 29,000 controls. Ann Neurol 1999;45:100–110. [DOI] [PubMed] [Google Scholar]
- 14.Loes DJ, Hite S, Moser H, et al. Adrenoleukodystrophy: a scoring method for brain MR observations. AJNR Am J Neuroradiol 1994;15:1761–1766. [PMC free article] [PubMed] [Google Scholar]
- 15.Loes DJ, Fatemi a, Melhem ER, et al. Analysis of MRI patterns aids prediction of progression in X-linked adrenoleukodystrophy. Neurology 2003;61:369–374. [DOI] [PubMed] [Google Scholar]
- 16.Egger J, Kapur T, Fedorov A, et al. GBM volumetry using the 3D slicer medical image computing platform. Sci Rep 2013;3:1–7. [DOI] [PMC free article] [PubMed] [Google Scholar]
- 17.Kikinis R, Pieper SD, Vosburgh KG. 3D slicer: a platform for subject-specific image analysis, visualization, and clinical support. In: Intraoperative Imaging and Image-Guided Therapy. New York: Springer New York; 2014:277–289 [Google Scholar]
- 18.Van Der Voorn JP, Pouwels PJW, Powers JM, et al. Correlating quantitative MR imaging with histopathology in X-linked adrenoleukodystrophy. AJNR Am J Neuroradiol 2011;32:481–489. [DOI] [PMC free article] [PubMed] [Google Scholar]
- 19.Powers JM, Moser HW. Peroxisomal disorders: genotype, phenotype, major neuropathologic lesions, and pathogenesis. Brain Pathol 2006;8:101–120. [DOI] [PMC free article] [PubMed] [Google Scholar]
- 20.Pierpont EI, Eisengart JB, Shanley R, et al. Neurocognitive trajectory of boys who received a hematopoietic stem cell transplant at an early stage of childhood cerebral adrenoleukodystrophy. JAMA Neurol 2017;74:710. [DOI] [PMC free article] [PubMed] [Google Scholar]
Associated Data
This section collects any data citations, data availability statements, or supplementary materials included in this article.
Data Availability Statement
Following publication, any data not published within this article will be anonymized and shared by request from any qualified investigator.


