

Abstract
UTX is a chromatin modifier required for development and neural lineage specification, but how it controls these biological processes is unclear. To determine the molecular mechanisms of UTX, we identified novel UTX protein interaction partners. Here, we show that UTX and 53BP1 directly interact and co-occupy promoters in human embryonic stem cells and differentiating neural progenitor cells. Human 53BP1 contains a UTX-binding site that diverges from its mouse homolog by 41%, and disruption of the 53BP1-UTX interaction abrogated human, but not mouse, neurogenesis in vitro. The 53BP1-UTX interaction is required to upregulate key neurodevelopmental genes during the differentiation of human embryonic stem cells into neurons or into cortical organoids. 53BP1 promotes UTX chromatin binding, and in turn H3K27 modifications and gene activation, at a subset of genomic regions, including neurogenic genes. Overall, our data suggest that the UTX-53BP1 interaction supports the activation of key genes required for human neurodevelopment.
INTRODUCTION
UTX (Ubiquitously transcribed tetratricopeptide repeat, X chromosome; also named KDM6A) is a chromatin modifier that demethylates methylated-lysine 27 in histone H3 (H3K27me) and is required for the development of multiple organs including brain, heart, and bone1,2. UTX can function as an integral subunit of the COMPASS-like H3K4 methyltransferases3,4 or the SWI-SNF chromatin remodeler5,6. These interactions support the proposed model that UTX promotes the transition from suppressed to active gene expression by removing H3K27me and facilitating the establishment of H3K4me and open chromatin structure. However, it remains unclear whether these activities of UTX are indeed crucial for developmental gene regulation. Worms and mice containing only enzymatically dead UTX develop into healthy adults1,7, and UTX regulates gene expression for neural crest development with little effect on H3K27me or H3K4me8. These findings suggest that the H3K27me demethylase activity of UTX is dispensable for early organismal development. In contrast, recent studies showed that UTX removes H3K27me to facilitate transcription factor binding to chromatin for gene expression programming at the early onset of embryonic stem cell (ESC) differentiation programming9 and that UTX is crucial for H3K27 acetylation (H3K27ac) and enhancer activation10. These findings suggest that H3K27me removal and H3K27ac promotion by UTX are important to ESC differentiation. Therefore, the mechanisms of developmental gene regulation by UTX remain to be clarified.
In animal and ESC models, UTX is required for neurogenesis, a process in which neurons are committed and differentiated from neural progenitors. Preceding neurogenesis is an amplification phase in which neural progenitors divide. The intricate balance of neural progenitor amplification, neurogenesis, and neuronal maturation is central to nervous system development11. Although animal studies have uncovered fundamental mechanisms underlying the development of the nervous system, the molecular understanding of neurogenesis in humans is relatively unknown.
The chromatin-bound protein TP53BP1 (Tumor Protein p53 Binding Protein 1; hereafter referred to as 53BP1) is known to coordinate DNA damage repair factors and influence cell cycle in response to DNA damage12. 53/bp1-knockout (KO) mice are born at normal Mendelian ratios and are fertile13, suggesting that 53bp1 is not essential for mouse development. However, little is known about whether 53BP1 affects human development and disease. Importantly, 53BP1 was recently shown to affect gene regulation via a p53-dependent DNA damage response in a human cell line14. Indeed, a growing body of literature implicate DNA damage repair proteins in transcriptional regulation15,16. These findings provoke outstanding questions about the genome-wide influence of 53BP1, whether it affects gene expression outside the context of DNA damage repair, and the developmental impact of its gene-regulatory activities. Here, we uncovered UTX and 53BP1 as cofactors that are crucial for regulating hundreds of neurogenic genes in human.
RESULTS
UTX binds 53BP1 in human embryonic stem cells
To identify novel UTX-binding proteins, we performed mass spectrometry analysis of endogenous proteins that co-immunoprecipitated (co-IP’d) with UTX from human ESC (hESC) nuclear extract. Supplementary Fig. 1 presents all uncropped western blotting (WB) images. We used a validated, specific anti-UTX antibody (Supplementary Fig. 2a, b). This analysis uncovered UTX, as well as the known UTX-binding proteins ARID1A, ARID2, BRG1, and PTIP3-6, validating our approach (Fig. 1a).
Figure 1. 53BP1 binds UTX in hESCs.
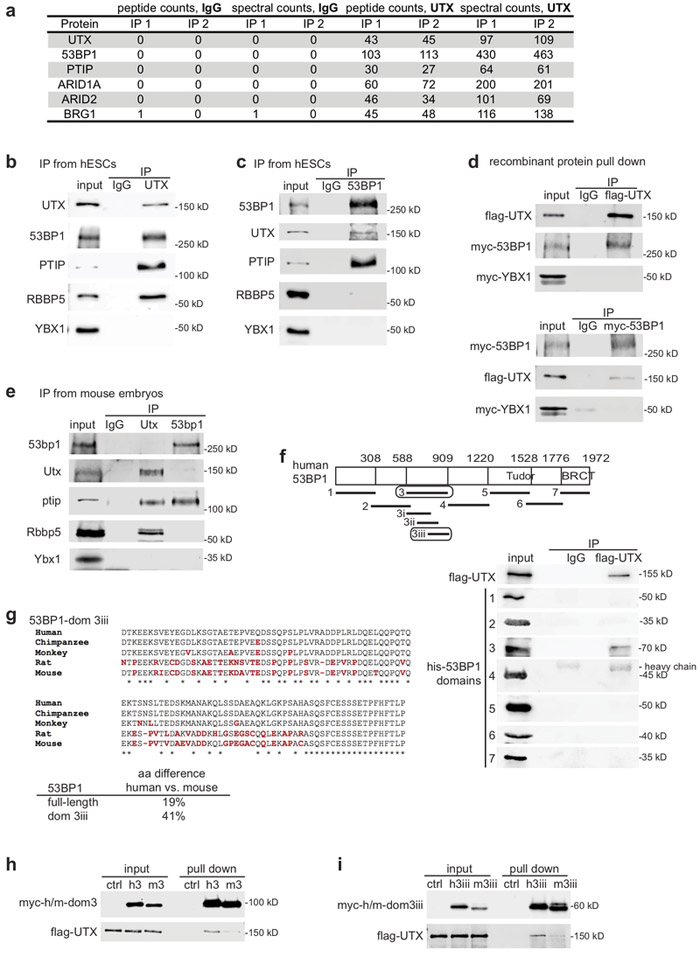
(a) Mass spectrometry peptide counts and spectral counts of proteins identified in replicate UTX and IgG co-immunoprecipitates from hESC nuclear extract. Spectral count is the total number of MS/MS spectra that were matched to an assigned protein. WB analysis of (b) IgG, UTX, (c) IgG, and 53BP1 co-IP of endogenous proteins from hESC nuclear extract, using the antibodies indicated. (d) WB analysis of recombinant proteins pull down of flag-UTX, myc-53BP1, or myc-YBX1. Flag-UTX and myc-53BP1 were purified from the baculovirus-Sf9 cells, and myc-YBX1 was purified from the S2 cells. (e) WB analysis of IgG, Utx, and 53bp1 co-IP of endogenous proteins from mouse embryonic extract (at embryonic day 12). (f) Top: Schematic of human 53BP1 domains analyzed by pull down. Bottom: WB analysis of IgG and UTX co-IP of recombinant protein Flag-UTX with His-tagged full-length 53BP1 or 53BP1 domains. (g) Protein alignment of 53BP1/53bp1 domain 3iii from primates and rodents; red font indicates amino acid differences and asterisks indicate identity. Domain 3iii in human 53BP1 differs from that in mouse 53bp1 by 41%, whereas full-length 53BP1 and 53bp1 differ by only 19%. WB analysis of pull down of flag-UTX with control (bacterial extract not expressing tagged proteins), human-, mouse- (h) domain 3, or (i) domain 3iii of 53BP1. Experiments were independently repeated 5 times for b-d and 3 times for e, f, h, and i to yield similar results. WB images are cropped.
The same analysis uncovered 53BP1 (Fig. 1a). WB analysis verified that 53BP1, PTIP, and RBBP5 co-IP’d with endogenous UTX from hESC nuclear extract (Fig. 1b). The negative control YBX1 did not co-IP with UTX (Fig. 1b). Further, UTX and PTIP, but not RBBP5 or YBX1, co-IP’d with 53BP1 from hESC nuclear extract, when using a specific anti-53BP1 antibody (Fig. 1c,Supplementary Fig. 2c, d). Pull-down analyses revealed that flag-UTX and myc-53BP1 directly interact with each other in vitro, but not with myc-YBX1 (Fig. 1d). Therefore, we concluded that 53BP1 is a novel UTX-binding protein.
Given that human UTX and mouse Utx are 97% identical, we examined whether the UTX- 53BP1 interaction is conserved in mice. Unexpectedly, endogenous Utx and 53bp1 proteins displayed weak co-IP from mouse embryonic extract (harvested at embryonic day 12) (Fig. 1e). This finding motivated us to characterize the UTX-binding domain within human 53BP1, and to determine whether this region differs in mouse 53bp1. We performed pull-down analyses with various His-tagged fragments of 53BP1 and uncovered a ~300 aa domain that directly interacted with flag-UTX (Fig. 1f). Subsequent pull-down analyses revealed that UTX directly binds to 53BP1 “domain 3iii”, which contains amino acids 733-909 (Supplementary Fig. 2e, f). Amino acid sequence comparisons revealed a 41% difference between domain 3iii in primates (human, chimpanzee, and monkey) versus rodents (rat and mouse), whereas full-length human 53BP1 and mouse 53bp1 differ by only 19% (Fig. 1g). Additional pull-down analyses showed that flag-UTX binds more strongly to myc-tagged domains 3 and 3iii from human 53BP1 compared to these regions from mouse 53bp1 (Fig. 1h, i). These data suggest that UTX displays a stronger interaction with human 53BP1 than with mouse 53bp1. Thus, we further analyzed the potential physiological relevance of the UTX-53BP1 interaction in human cells.
53BP1 and UTX co-bind promoters in human ESCs
The 53BP1-UTX physical interaction prompted us to compare the genome-wide binding patterns of 53BP1 and UTX in hESCs using ChIP-Seq. Highly reproducible datasets (Supplementary Fig. 3, 4) were merged to identify the genomic targets co-occupied by 53BP1 or UTX. Comparison of ChIP-seq read counts in control and 53BP1-KO hESCs (described in later sections) showed no correlation (Supplementary Fig. 5a), demonstrating ChIP-seq specificity. We identified 28550 53BP1 targets and 29150 UTX targets within the hESC genome, using a 10−3 false discovery rate (analyzing ChIP-seq read counts per million). 53BP1 and UTX co-occupied 24701 targets, revealing an 84% overlap between their genomic targets (Fig. 2a). 53BP1 and UTX targets were within 8816 proteincoding genes, some of which were confirmed by ChIP-qPCR (Supplementary Fig. 5b). UTX, 53BP1, and IgG Re-ChIP from the primary 53BP1 ChIP suggest UTX and 53BP1 co-bind promoters including H2AX, CHD5, DLL1, GRIK2, PAX5, and SIX3 (Supplementary Fig. 5c).
Figure 2. UTX and 53BP1 co-occupy promoters genome-wide.

(a) 53BP1 and UTX genomic targets overlap at 24,701 sites. (b) Representative 53BP1 and UTX ChIP-seq tracks peak at the transcription start site of the CYP20A1 locus. The input DNA track is displayed for comparison. (c) Kernel density plots of ChIP-seq peaks relative to transcription start sites (0-bp position). Area under the curve values sum to 1, with total peaks normalized to 1. (d) Heat map indicating the binding intensity of 53BP1 and UTX, low intensity (white) – high intensity (blue), and input DNA within 10kb of ChIP-seq peaks. Analyses represent 6 biological replicate 53BP1 ChIP-seq and 6 replicate UTX ChIP-seq of hESCs. Experiments were independently repeated 6 times for b and c to yield similar results.
We noticed that many of the targets co-occupied by 53BP1 and UTX were at or near transcription start sites (Fig. 2b and Supplementary Fig. 5d). Indeed, approximately 41% of regions bound by both 53BP1 and UTX were enriched at promoters (Fig 2c and Supplementary Fig. 5e). The heat map of ChIP-seq read counts from 53BP1 (antibodies 1 and 2), UTX (antibody 1), and input (negative control) further supported the notion that 53BP1 and UTX co-localize genome-wide, with broader distribution of UTX at some targets (metagene profiles summarized the distribution of 53BP1 and UTX at sites co-bound by both proteins [53BP1+UTX], sites bound by 53BP1 [53BP1 only], sites bound by UTX [UTX only], and input; Fig. 2d). These data suggest that UTX and 53BP1 are enriched at promoters and function as co-factors genome-wide in hESCs.
53BP1 loss does not affect self-renewal of hESCs
To investigate the functional significance of 53BP1 in hESCs, we used the CRISPR-Cas9 system17,18 to generate mutations within exons 2, 3, and 4 of the 53BP1 locus. We obtained hESC lines (labeled KO-1, 2, and 3) that generated an early translational stop in 53BP1 (Fig. 3a). As controls, we generated hESCs expressing Cas9 and sgRNAs that target the luciferase locus and have no specificity to the human genome. The 53BP1 protein was undetectable in the 53BP1-KO lines, whereas UTX protein levels were unaffected (Fig. 3b). Whole-genome sequencing of the control and 53BP1-KO lines confirmed that there were no off-target mutations (Supplementary Fig. 6; Supplementary Method).
Figure 3. UTX and 53BP1 binding correlates to gene activation in hNPCs.

(a) CRISPR sgRNA sequences and mutations in 53BP1-KO clones 1-3. The red sequences indicate sgRNA targets. Targets in exons 3 and 4 were separated by approximately 300 bp. Dots indicate deletion, the blue sequence indicates an insertion. Allele 1(al1) and allele 2 (al2) are indicated. KO-1 has homozygous mutations. (b) WB analysis of control cells and 53BP1 KO clones 1-3. (c) Schematic diagram of differentiating hESCs along the neural lineage to mature neurons. Human ESC cells (Day 0) were plated in media for neural induction at D1 and then plated to form rosettes during D5-11. Rosettes were plated at D11 in neural differentiation media to form hNPCs, which were differentiated into neurons by plating in neuronal maturation media at D17. (d) Comparison of UTX and 53BP1 target genes in hESCs and hNPCs (D15 of neural differentiation). (e) Representative UTX and 53BP1 ChIP-seq tracks, along input track (negative control), at FOXG1 and ZIC1 loci in hNPCs. (f) ChIP-qPCR analysis of UTX and 53BP1 binding to the promoters of neurogenic genes in human and mouse NPCs. N=3 technical replicates to generate the graph; 3 independent biological experiments yielded similar results. Center values and error bars are mean and standard deviation. *, **, and *** indicate P<0.05, 0.01, and 0.001 respectively by one-sided Student’s t-test. 53bp1 binding to neurogenic gene promoters in mouse NPCs was only detected at the Grik2 locus. (g) Gene ontology analysis of upregulated 53BP1 target genes in hNPCs. The ontology terms were ranked by P values, which were calculated by the Fisher’s exact test, with the number of bound genes indicated. Experiments were independently repeated 5 times for b and 2 times for e to yield similar results. WB images are cropped.
To evaluate hESC self-renewal, we examined cell proliferation and the expression of various markers. We observed similar expression of pluripotency and germ layer markers in control and 53BP-KO cell lines by immunofluorescence and RT-qPCR (Supplementary Fig. 7a, b). Control and 53BP1-KO cell lines also displayed similar levels of proliferation and apoptosis (Supplementary Fig. 7c-e). These results suggest that 53BP1 does not affect proliferation or self-renewal of hESCs.
Given the crucial role of 53BP1 in DNA damage repair, we investigated the levels of endogenous DNA damage by evaluating phosphorylated serine 139 in H2AX (γH2AX), a biomarker of double stranded DNA breaks19. We identified γH2AX foci by immunofluorescence and observed an average of 1.7 foci in the control cells, and 5.8, 7, and 5.5 foci in the 53BP1-KO lines 1-3, respectively (Supplementary Fig. 7f; Supplementary Method). Thus, 53BP1 depletion in hESCs leads to a modest increase in endogenous DNA damage. Gene expression profiling by deep sequencing of RNAs (RNA-seq) from 3 control and 3 53BP1-KO cell lines did not detect changes in factors mediating DNA damage responses (Supplementary Fig 8a, b). Proteomic profiling by mass spectrometry with tandem mass tags (Supplementary Fig 8c) showed that 17 out of 11,480 quantifiable proteins had significantly more than 2-fold difference between 2 control and 3 53BP1-KO hESC lines (Supplementary Fig 8d, e). No other phenotype could be detected in the 53BP1-KO hESCs.
53BP1 and UTX bind to neurogenic genes that are activated in hNPCs
UTX plays a crucial role in ESC differentiation into the neural lineage9,10, therefore we investigated a potential role for the 53BP1-UTX interaction in this process. The differentiation of hESCs into human neural progenitor cells (hNPCs) and then into neurons serves as a model of human neurogenesis (schematic, Fig. 3c). First, we monitored hESC differentiation into neurons by examining the expression of known markers (Supplementary Fig. 9a) and by RNA-seq. As expected, hNPCs displayed an upregulation of neurodevelopmental genes (Supplementary Fig. 9b) and a molecular signature of human fetal brain (Supplementary Fig. 9c).
To determine how the genomic targets of 53BP1 and UTX change during hESC differentiation along the neural lineage, we performed ChIP-Seq to identify their targets in hNPCs (day 15 of differentiation; Fig. 3d-e). We found that UTX and 53BP1 changed some of their target genes as hESCs differentiate into hNPCs and categorized their target genes as hESC-specific, hESC and hNPC, or hNPC-specific (Fig. 3d, Supplementary Fig. 10a). Moreover, 93% of the targets in hNPCs locate within the promoters (Supplementary Fig 10b). UTX and 53BP1 co-occupied a group of neurogenic gene loci in hESCs and hNPCs, including FOXG1, ZIC1, SIX3, CDK5R1, DLX2, and SOX4 (Fig. 3e and Supplementary Fig. 10c). We performed ChIP-qPCR to evaluate 53BP1 and UTX binding to the promoters of these neurogenic genes in human and mouse ESCs and NPCs. Human 53BP1 and UTX proteins co-occupied the neurogenic gene promoters in hESCs and hNPCs; however, mouse 53bp1 protein did not bind the neurogenic gene promoters in the mouse ESCs and NPCs (Fig. 3f and Supplementary Fig. 10d). This finding is consistent with our data that mouse 53bp1 and Utx proteins only weakly interacted in mouse embryos.
We examined whether the differentially expressed genes in hESCs and hNPCs correlated with 53BP1 and UTX targets in hNPCs. Of the 3133 upregulated genes in hNPCs, 736 (23%) were 53BP1 and UTX targets in hNPCs. In contrast, 169/2899 (~6%) of genes downregulated in hNPCs were 53BP1 and UTX targets in hNPCs. The increased frequency of 53BP1 and UTX targets in upregulated genes vs. downregulated genes was significant, with P = 9.1× 10−88 by a Fisher’s exact test (Supplementary Fig. 10e). Separately, we used gene set enrichment analysis to compare UTX and 53BP1 target genes in hESCs and those gained in hNPCs (Supplementary Fig. 11a-g). Our results suggest that some UTX and 53BP1 target genes in hESCs require UTX and 53BP1 for downregulation during neuronal differentiation (day 22 of differentiation; Supplementary Fig. 11c, d), suggesting a role of UTX and 53BP1 in marking target genes for suppression during lineage restriction of hESCs. Results from the Fisher’s exact test and gene set enrichment test suggest that UTX and 53BP1 co-targeted genes gained in hNPCs require UTX and 53BP1 for activation during neuronal differentiation (day 22; Supplementary Fig. 10e, 11f, g). The 736 upregulated target genes in hNPCs were highly enriched in neuronal functions such as axon guidance, neurogenesis regulation, neuronal differentiation, and glial differentiation (Fig. 3g). These data suggest that 53BP1 and UTX mark genes for suppression during hESC lineage restriction/differentiation and promote neurodevelopmental gene expression in hNPCs.
53BP1 is required for neural differentiation
We evaluated whether 53BP1, like UTX, is required for human neural differentiation9,10. We found that 53BP1-KO hESCs differentiated into hNPCs, similarly to the control cells. During the early phase of hNPC differentiation into neurons (day 17), 53BP1-KO hNPCs expressed the early neural lineage marker OTX2 (Supplementary Fig. 12a) and displayed similar apoptosis profiles as control cells (Supplementary Fig. 12b). However, unlike control cells, 53BP1-KO hNPCs did not express the neuronal differentiation markers TBR1 and MAP2 (Supplementary Fig. 12a). By day 22 of neuronal differentiation, 53BP1-KO cells still did not express TBR1 and MAP2 (Fig. 4a, b), and displayed additional differences with control cells: they did not stop proliferating (Fig. 4c), nor condense their nuclei (Fig. 4d), nor form axons (Supplementary Fig. 12c). These data suggest that 53BP1 is required for the differentiation of hNPCs into neurons.
Figure 4. 53BP1 is required for the differentiation of neurons on monolayer culture and 3-dimensional cortical organoids.

(a) IF of MAP2 and TBR1 in control and 53BP1-KO cells at day 22 of differentiation. Bar, 50 μm. (b) Relative number of MAP2-positive cells in control (1 = 100%) and 53BP1-KO cells at day 22 of differentiation. Cells, 643, 1003, 1054, and 820. P=0.01 by the chi-squared test. (c) Relative cell numbers of 2 control and 3 53BP1-KO clones proliferating during days 18-22 of differentiation. By day 22, 53BP1-KO cells were, on average, 3.5-fold more numerous than control cells. N=2 biologically independent samples. (d) Nuclear area (a proxy for nuclear size) of control and 53BP1-KO cells at day 22 of differentiation. Cells, 1007, 1094, 1141, and 941. *** indicates P<0.001 by one-sided Student’s t-test. (e) At day 45 of differentiation, the control organoids consisted of cells organizing into ventricular zone-like, PAX6-positive regions surrounded by TBR2-positive cells and then CTIP2-positive neurons. (f) Unsupervised hierarchical clustering of transcript profiles of control organoids, 53BP1-KO organoids, and fetal brain regions including orbital frontal cortex, hippocampus, dorsal thalamus, cerebellum, cerebellar cortex, and mediodorsal nucleus of thalamus at different post-conceptual weeks. (g) IF of PAX6 and CTIP2 in sections from organoids at day 45 of differentiation. Bar, 50 μm. (h) Relative proportion of organized and disorganized ventricular zone-like regions in control and 53BP1-KO organoids at day 45 of differentiation. 11 organoids from each group and N=structures were analyzed. P values were calculated by the Chi-squared test. For b, c, and d, center values and error bars are mean and standard deviation. Experiments were independently repeated 4 times for e and 2 times for g to yield similar results.
Next, we used a 3D cortical organoid culture method20,21 to analyze the role of 53BP1 in human cortical development. Control and 53BP1-KO hESCs were aggregated in serum-free cortical differentiation medium. By day 45 of differentiation, cortical patterning in control organoids was verified by the expression of the forebrain NPC marker PAX6 in the ventricular zone-like regions, which were surrounded by cells expressing the intermediate progenitor marker TBR2/EOMES and then by cells expressing the deep-layer subcortical projection neuron marker CTIP2 (Fig. 4e). Unsupervised hierarchical clustering placed the transcriptomes of control organoids with fetal orbital frontal cortex at 16th post-conception week, but the 53BP1-KO organoids with fetal dorsal thalamus at 9th post-conception week or hippocampus at 12th post-conception week (Fig. 4f). Genes enriched in categories related to neural development were downregulated in 53BP1-KO organoids relative to control organoids, whereas genes enriched in categories related to matrix organization were upregulated (Fig 4g; Supplementary Fig. 13a-c). Unlike control organoids, 53BP1-KO organoids did not form apical surfaces positive for phosphorylated vimentin (radial glia marker) and ZO-1 (tight junction marker) (Supplementary Fig. 13d, e). We categorized ventricular zone-like regions as ‘organized’ if they displayed separate PAX6- and CTIP2- positive layers, polarized organization of PAX6-positive cells, and apical membrane and lumen formation (Fig. 4g). With these criteria, 81% and 96% of ventricular zone-like regions were organized in control organoids, compared to 28%, 44%, and 13% of organized regions in 53BP1-KO organoids (Fig. 4h; P<0.0001 by the Chi-squared test). These data suggest that 53BP1 is required for human cortical development.
53BP1 and UTX are required to fully activate neurogenic genes in hNPCs
When comparing the transcript profiles of control and 53BP1-KO hNPCs at day 22 of monolayer differentiation (Supplementary Fig. 14a), we found that 53BP1 was required for the expression of genes involved in nervous system development, synapse formation and function, neuronal differentiation, axon guidance, and neurogenesis regulation in hESC-derived neurons (Supplementary Fig. 14b). In contrast, genes involved in translational regulation and mRNA catabolism were upregulated in 53BP1-KO relative to control hNPCs (Supplementary Fig. 14c). We evaluated the expression of crucial neurogenic factors during neural differentiation (days 11, 17, 19, and 24 of differentiation) by RT-qPCR, and found that 53BP1-KO cells failed to fully upregulate many of these neurogenic genes through the neural differentiation course (Supplementary Fig. 14d). All of these neurogenic genes were co-occupied by UTX and 53BP1 targets in hNPCs (Fig. 3f). Comparison of transcript profiles from the monolayer differentiation and the cortical organoids revealed that 238 downregulated genes (vs. control) were the same in 53BP1-KO monolayer differentiation and cortical organoids, with a P=1.17 × 10−155 by the exact hypergeometric test. These 238 genes were enriched in synapse maturation, synapse transmission, axon guidance, neurogenesis, axonogenesis, and nervous system development (Supplementary Fig. 14e). We concluded that 53BP1likely promotes neurogenic gene expression during human neural differentiation and cortical development.
We next compared the requirements of UTX and 53BP1 for the expression of neurogenic genes by comparing the transcript profiles of control, 53BP1-KO and UTX-depleted hNPCs. Using CRISPR-Cas917,18, we generated 3 different mutation combinations that depleted the UTX proteins (UTX-knockdown [KD] in Fig. 5a, b). Comparing transcript profiles (using normalized RNA-seq counts per million) of 3 UTX-depleted and 3 53BP1-KO hNPCs revealed no statistical differences (Fig. 5c). Individual neurogenic genes, including FOXG1, ZIC1, SIX3, CDK5R1, DLX2, and SOX4 were expressed at significantly lower levels in UTX-depleted and 53BP1-KO hNPCs at day 22 of monolayer differentiation (compared to control hNPCs, Fig. 5d).
Figure 5. UTX and 53BP1 promote a common set of genes related to nervous system development.

(a) CRISPR sequences and mutations in the UTX mutant clones 1-3. Red sequence is CRISPR. Dots indicate deletions. (b) WB analysis of control cells and UTX-knockdown (KD) clones 1-3. Experiments were independently repeated 3 times to yield similar results. (c) Comparison of transcript profiles of 3 biological samples each of UTX-KD, 53BP1-KO, and control cells by counts per million of sequencing reads for each annotated gene. Correlation coefficients are calculated by using the linear model of Goodness-of-Fit package in R. UTX-KD and 53BP1 KO hNPCs are not statistically different. (d) Graphs summarize RNA-seq counts per million of transcripts of representative neurogenic genes in hESCs, hNPCs, and control, UTX-KD, and 53BP1-KO cells at day 22 of differentiation. Center values and error bars are mean and standard deviation. N=3 biological independent samples. *,**, ***, and **** indicate P<0.05, 0.01, 0.001, and 0.0001 by one-sided Student’s t-test. (e) Venn diagram showing that the 437 genes downregulated in the UTX-KD vs. control and 53BP1-KO vs. control comparisons are the same. (f) Gene ontology analysis of the 437 downregulated genes. P values were calculated by the Fisher’s exact test. Six of the 9 gene ontology terms are related to neural development. WB images are cropped.
The transcript profiles of UTX-depleted or 53BP1-KO hNPCs were separately compared to those of control hNPCs at day 22 of monolayer differentiation to uncover significantly differentially expressed genes (Fig. 5c, Supplementary Fig. 15a). Using a criterion of fold-change >2, we found that 437 downregulated genes were the same in UTX-depleted (vs. control) and 53BP1-KO (vs. control) hNPCs: these genes were enriched in functions involved in extracellular matrix organization, synapse formation and function, neurotransmission, nervous system development, neuronal differentiation, negative regulation of cell proliferation, and metabolism (Fig. 5e, f). This fold-change >2 criterion was stringent and missed FOXG1, ZIC1, SIX3, and SOX4. But even with this criterion, we found 205 downregulated (by 2-fold) neurogenic genes in 53BP1-KO vs. control hNPCs, 77 downregulated neurogenic genes in UTX-depleted vs. control hNPCs (Supplementary Fig. 15b), and 50 downregulated neurogenic genes in both UTX-depleted and 53BP1-KO hNPCs. In contrast, only 17 upregulated genes were common between UTX-depleted and 53BP1-KO hNPCs (Supplementary Fig. 15c). These data led us to conclude that UTX and 53BP1 promote neurogenic gene expression during early human neurogenesis.
The interaction between UTX and 53BP1 promotes cortical organoid differentiation
The identification of the UTX-binding domain in 53BP1 (Fig. 1i) enables us to interrogate whether the interaction between of 53BP1 and UTX is crucial to neural differentiation of hESCs. Using CRISPR-Cas917,18, we generated 2 different mutations in the exon 12 of the 53BP1 locus that resulted in in-frame deletion of the UTX-binding domain 3iii in hESCs (Fig. 6a). Co-IP-WB analysis confirmed the reduced interaction between mutant 53BP1 and UTX (Fig. 6b). We used the cortical organoid culture method20,21 to compare control, 53BP1-KO, and 53BP1 mutant cortical organoids. By day 40 of differentiation, control organoids displayed cortical patterning, as indicated by the PAX6-positive ventricular zone-like regions being surrounded by TBR2/EOMES- and CTIP2- positive cells (Fig. 6c). However, no such cortical patterning was observed in 8 organoids each from the 53BP1-KO and the 53BP1 mutant organoids (Fig. 6c). Key neurodevelopmental genes that were downregulated in 53BP1-KO organoids were also downregulated in the 53BP1 mutant organoids (vs. control; Fig. 6d). These data suggest that the interaction between UTX and 53BP1 is crucial for neurodevelopmental gene expression and human cortical development.
Figure 6. The UTX-53BP1 interaction promotes the development of cortical organoids.

(a) CRISPR sgRNA sequences (red) and mutations in the 53BP1 gene locus that result in in-frame deletions (indicated by dots) of protein domain 3iii. (b) WB analysis of IP from 53BP1 mutant 1, mutant 2, and control hESC nuclear extract. (c) IF of CTIP2, TBR2, and PAX6 in control, 53BP1-KO, and 53BP1 mutant cortical organoids at day 40 of differentiation. (d) Transcript profiling of control, 2 53BP1-KO, and 2 53BP1 mutant cortical organoids at day 40 of differentiation. N=3 technical RT samples. Mean and standard deviation are indicated, with **, ***, and **** indicating P<0.01, 0.001, and 0.0001 by one-way ANOVA test. Experiments were independently repeated 2 times for b and c to yield similar results. WB images are cropped.
Murine 53bp1 does not impact NPCs and neural differentiation
Next, we examined whether 53bp1 impacts mouse NPCs (mNPC) growth and differentiation. WB analysis confirmed that 53bp1-KO mNPCs did not have detectable 53bp1 protein (Supplementary Fig. 16a). Compared to control mNPCs, 53bp1-KO mNPCs had comparable expression of NPC markers Sox2 and Nestin (Supplementary Fig. 16b). Transcript profiling of four control and four 53bp1-KO mNPCs showed 477 downregulated genes in 53bp1-KO mNPCs that were enriched in categories related to DNA replication, cell cycle regulation, matrix organization, cholesterol synthesis, and DNA repair; whereas 546 upregulated genes were predominantly enriched in tRNA aminoacylation (Supplementary Fig. 16c). Control and 53bp1-KO mNPCs were cultured in differentiation media for 3 weeks and assayed for marker expression. Control and 53bp1-KO mNPCs expressed comparable levels of neuronal marker Tbr1, oligodendrocyte marker CnPase, and neurogenic genes (Supplementary Fig. 16d, e). These data suggest that 53bp1 does not significantly impact neurogenic gene expression or neural or glial differentiation of mNPCs.
We then investigated the effect of disrupting the weak Utx-53bp1 interaction that we observed in mice (Fig. 1E). As above, we used Cas9-CRISPR was used to generate in-frame deletions within exon 12 of the 53bp1 locus to disrupt the Utx- binding domain (Supplementary Fig. 17a). Binding of the mutant 53bp1 to Utx was undetectable by co-IP (Supplementary Fig. 17b). Control and 53bp1 mutant mNPCs expressed comparable levels of neural stem cell markers (Supplementary Fig. 17c, d). Further, after being cultured in differentiation media for 3 weeks, control and 53bp1 mutant mNPCs expressed comparable levels of Tbr1, CnPase, and neurogenic markers (Supplementary Fig. 17e, f). These data suggest that disruption of the weak 53bp1-Utx interaction in mice does not significantly impact neurogenic gene expression or neural differentiation of mNPCs.
53BP1 is required for histone modification changes during neuronal differentiation
The histone modification H3K79me2 is functionally linked to 53BP1 at chromatin of damaged DNA, whereas H3K27me3 and H3K27ac are regulated by UTX, so we investigated whether 53BP1 affects the genomic distribution of H3K79me2, H3K27me3 and H3K27ac. We performed ChIP-seq for H3K79me2, H3K27me3, and H3K27ac in hNPCs (day 17 of differentiation) derived from control, 53BP1-KO1, and 53BP-KO2 hESCs. H3K79me2 was not affected by 53BP1 KO at individual genes and genome wide (Supplementary Fig. 18). In contrast, H3K27me3 levels were significantly increased, and H3K27ac levels were significantly decreased, at neurogenic genes FOXG1, ZIC1, SIX3, NFIB, MAP6, and EDN1 in 53BP1-KO vs. control hNPCs (Fig. 7a, Supplementary Fig. 19a).The HOXgenes and ACTB gene loci displayed similar levels of H3K27me3 and H3K27ac in control and 53BP1-KO hNPCs (Supplementary Fig. 19b). These changes in H3K27me3 and H3K27ac correlated with the downregulation of these genes in 53BP1-KO hNPCs. Expanding this comparison genome-wide showed that at day 17 of differentiation, 38 (of 205) downregulated genes displayed significantly increased H3K27me3 levels in 53BP1-KO hNPCs, and 21 of the 38 genes are neurogenic (Fig. 7b). Similarly, 116 (of 205) downregulated genes displayed significantly decreased H3K27ac levels in hNPCs, and 40 of the 116 genes are neurogenic (Fig. 7c). These genes had statistically significant changes that passed the criteria of having a fold-change >2 and a false discovery rate <0.05. We performed further analyses by using the Fisher’s exact test to compare changes in gene expression, H3K27me3, and H3K27ac that passed the less-stringent criterion of a false discovery rate <0.05. These tests found that changes in H3K27ac, but not H3K27me3, strongly correlated with transcriptomic changes in control vs. 53BP1-KO hNPCs (P = 2.9×10−155, Fig 7d). We conclude that 53BP1 influences the expression and H3K27me3/ac status of many genes, particularly those involved in neurogenesis.
Figure 7. 53BP1 affects H3K27me3 and H3K27ac during neural differentiation.

(a) Representative H3K27me3 and H3K27ac ChIPseq tracks in 53BP1-KO and control hNPCs at day 17 of differentiation. Comparison of LOG2(fold-changes in 53BP1 KO/control) of (b) H3K27me3 or (c) H3K27ac levels to LOG2(fold-changes) of RNAs in 53BP1-KO/control hNPCs at day 17 of differentiation. (d) Fisher’s exact test comparing changes in H3K27me3 or H3K27ac to RNA changes in hNPCs of 53BP1 KO vs. control. Changes are defined as any difference passing a false discovery rate < 0.05. P values indicate correlation between changes of H3K27me3 (0.15) or H3K27ac (2.9×10−155) to RNA changes by the Fisher’s exact test. N=2 biological ChIP samples and 3 biological RNA samples. (e) UTX ChIPseq tracks at SIX3 and SLIT2 gene loci in control and 53BP1-KO hNPCs at day 17 of differentiation. Dotted green boxes indicate sites with lower UTX levels. Experiments were independently repeated 2 times for a and e to yield similar results.
Next, we used ChIP-seq in control and mutant hNPCs at day 17 of differentiation to evaluate the interdependency of UTX and 53BP1 for their binding to chromatin. The genome-wide binding pattern of 53BP1 was significantly changed in UTX-depleted cells compared to control (Supplementary Fig. 20). UTX depletion led to increased levels of 53BP1 at some genomic regions but decreased levels at others (Supplementary Fig. 21), suggesting that UTX positively and negatively regulates 53BP1 binding to chromatin depending on the context.
53BP1 might affect H3K27me3/ac levels by influencing the chromatin binding and/or the demethylase activity of UTX. Because H3K27me3 changes were restricted to very few genes (Fig. 7b, d), we hypothesized that 53BP1 does not affect the demethylase activity of UTX but instead affects UTX binding to chromatin targets. Therefore, we examined the genome-wide binding of UTX in control and 53BP1-KO hNPCs at day 17 of differentiation (Supplementary Fig. 22a). Compared to control cells, 53BP1-KO hNPCs displayed reduced UTX binding at neurogenic genes, including SLIT2 and SIX3, as well as at other sites (Fig. 7e, Supplementary Fig. 22b). These sites were co-occupied by UTX and 53BP1 in wild-type hNPCs (Supplementary Fig. 10c, 22c). SLIT2 mediates axon guidance22, and SIX3 is required for forebrain specification and patterning23,24. A lower UTX level, higher H3K27me3 level, and lower H3K27ac level at the SIX3 promoter correlated with lower SIX3 expression in 53BP1-KO monolayer differentiation and cortical organoids (Fig 7a, 7e, 5d). We conclude that the 53BP1-UTX interaction is likely required for human forebrain development and that 53BP1 is required for UTX binding to select genomic sites, including the SIX3 locus, to promote histone modification changes and gene activation.
Discussion
We report that 53BP1 is a UTX-binding protein; our data suggest that the UTX-53BP1 interaction mediates neurogenic programming in primates but not rodents. 53BP1 influences UTX-mediated H3K27me3, and to a greater extent H3K27ac, and is required to balance proliferation and differentiation of hNPCs. This requirement is likely mediated by its co-regulation of neurogenic genes with UTX. Altogether, 53BP1 regulates the binding of UTX to select chromatin sites and supports UTX-mediated influence over H3K27me3 removal and H3K27ac, thereby facilitating the activation of neurogenic genes during human neural development.
Human NPCs derived from hESCs strongly resemble embryonic NPCs, which give rise to all cells in the developing brain. We discovered that 53BP1 is crucial for models of human neural differentiation and cortical development. Our findings suggest that UTX and 53BP1 promote the full activation of neurogenic genes in proliferating and differentiating hNPCs, however our assays analyzed bulk populations. In the future, single-cell analysis will help distinguish whether loss of UTX and 53BP1 impact gene expression in a sub-population of cells during differentiation.
UTX and 53BP1 co-occupy gene promoters, particularly at neurogenic genes. These findings correlate with the downregulation of neurogenic genes in cells depleted of UTX or 53BP1, suggesting that UTX and 53BP1 bind these genes to promote their expression. Notably, 53BP1 is required for the expression of 205 genes involved in nervous system development, and UTX is required for the expression of 77 genes in nervous system development (Supplementary Fig. 15b). This difference suggests that 53BP1 has a broader influence over neural development than UTX, and that it likely partners with other gene regulatory factors. The influence of UTX over neural development is, nevertheless, quite broad compared to that of its closest homolog and the only other H3K27me demethylase, JMJD. JMJD3 was previously shown to be required for the expression of 7 neurogenic genes25-27. We did not detect JMJD3 in UTX co-IP analyses, suggesting that JMJD3 is not part of the UTX-53BP1 network in hNPCs. These differences underscore the fact that the molecular understanding of the UTX-53BP1 interaction is incomplete.
Human 53BP1 and mouse 53bp1 proteins differ markedly in their binding affinities to UTX, despite an overall 81% identity in amino acid sequences. Further, mouse 53bp1 does not strongly bind nor impact the expression of neurogenic genes in mouse NPCs. These differences might underlie the apparent differential requirements for 53BP1 in human and mice development and provide a potential molecular explanation for neurodevelopmental differences between humans and mice. How the 53BP1 homologs contribute to differences in human and mouse neural development is an intriguing question for the future.
53BP1 was initially discovered via its binding to p5328 and is most well-known for its regulation of DNA damage repair mechanisms12. Our discovery that it interacts with UTX and promotes neurogenic gene expression was unexpected; however, a growing body of studies has strongly implicated the function of DNA damage repair factors in neural development and neural stem/progenitor cells29-31. Our work adds to these studies by revealing the developmental requirement of 53BP1 in human neurogenesis and cortical development, and places UTX with 53BP1 in neurogenic programming. Given that p53 protein was not detected in our co-IP-mass spectrometry analysis, and that the p53 pathway was not detected in our RNA-seq analyses, p53 is likely involved only minimally in human neurogenesis. The molecular relationship between chromatin structure and the DNA damage repair factors is yet to be determined.
Our findings imply that dysfunction of UTX and 53BP1 cause stem cell defects, leading to imbalanced proliferation and differentiation choices in hNPCs. Increased neural stem cell proliferation and failure to differentiate can cause developmental diseases, such as the pediatric medulloblastoma and Kabuki syndrome. More molecular and developmental studies of the UTX-53BP1 interaction will likely improve the understanding of diseases associated with UTX. Our findings and the recently discovered roles of UTX in enhancer activation10 provoke the following important questions. Do UTX and 53BP1 function as part of the molecular bridge between enhancers and promoters at neurogenic genes? Given that our motif analysis of the 53BP1 targets has not uncovered significant enrichment, how does 53BP1 precisely target neurogenic genes? How do UTX and 53BP1 achieve temporal precision in activating different neurogenic genes at different times? Future molecular and developmental studies will address these questions and significantly advance the understanding of the epigenetic programming of human neurogenesis.
METHODS
Buffers
PBS: 137 mM NaCl, 2.7 mM KCl, 10 mM Na2HPO4, 1.8 mM KH2PO4 (pH 7.4). PBST: PBS with 0.1% Triton X-100. HEPM: 25 mM HEPES (pH 6.9), 10 mM EGTA, 60 mM PIPES, 2 mM MgCl2. IF blocking solution: 1/3 Blocker Casein (ThermoFisher Scientific, #37528), 2/3 HEPM with 0.05% TX-100. Buffer A: 10 mM HEPES (pH 7.9), 10 mM KCl, 1.5 mM MgCl2, 0.34 M sucrose, 10% glycerol. Buffer B: 3 mM EDTA, 0.2 mM EGTA. Buffer D: 400 mM KCl, 20 mM HEPES, 0.2 mM EDTA, 20% glycerol. ChIP lysis buffer 3: 10 mM Tris-HCl (pH 8.0), 100 mM NaCl, 1 mM EDTA, 0.5 mM EGTA, 0.1% sodium deoxycholate, 0.5% N-Lauroylsarcosine. FACS antibody staining solution: PBS containing 0.5% Tween 20, 1% BSA, and 0.5 μg/μL RNase.
Human ESC Culturing, Neural Induction, and Neuronal Maturation
H9/WA09 cells (WiCell) were grown on Matrigel with reduced growth factors (ThermoFisher Scientific, #354230) in mTeSR1 medium (STEMCELL Technologies, #85850) at 37°C and 5% CO2. Neural lineage differentiation was performed using STEMdiff™ neuron differentiation kit (STEMCELL Technologies, #08500) and STEMdiff™ neuron maturation kit (STEMCELL Technologies, #08510).ES cells were seeded onto AggreWell800 plates (STEMCELL Technologies, #34811) and fed with neural induction medium (STEMCELL Technologies, #05835) to form uni-sized embryoid bodies (EBs). On day 5, EBs were re-plated onto Matrigel-treated 6-well plates. Neural differentiation started from day 11 to day 16. On day 17, cells were treated with Accutase® (STEMCELL Technologies) and seeded and fed with neuronal maturation medium till days 22–24. RNA samples were collected on days 10, 11, and 22 for deep-sequencing analysis. Cells were also seeded onto multi-chamber slides for immunofluorescence (IF) analysis.
Co-immunoprecipitation
Approximately 2 mg of nuclear extracts was incubated with primary antibody overnight at 4°C. Extract and antibody were added to protein A and protein G Dynabeads™ (ThermoFisher Scientific, #10002D and 10004D) for 4 h at 4°C, washed with PBST, and eluted with 0.1 M glycine (pH 2.3). Eluates were neutralized with 1.5 M Tris buffer (pH 8.8). Antibodies are listed in Supplementary Table 1.
Western Blotting
Equal amounts of nuclear extracts were separated by SDS-PAGE and transferred onto a nitrocellulose membrane (Bio-Rad). Membranes were blocked with 2% bovine serum albumin (BSA) in HEPM, incubated in primary antibodies (HEPM containing 1% BSA and 0.1% Triton X-100) overnight at 4°C, washed in PBST, incubated in IRDye®-conjugated secondary antibodies (LI-COR), and imaged on an Odyssey® Fc imaging system (LI-COR). Signals were quantitated with the Image Studio™ software (version 1.0.14; LI-COR). Student’s t test was used for statistical analyses.
Mass Spectrometry
Immunoprecipitation eluates were separated by SDS-PAGE to about 10 mm. Proteins in gel bands were treated with dithiothreitol to break disulfide bonds, and Cys residues were alkylated by iodoacetamide to recover Cys-containing peptides. Gel bands were washed, dried in a speed vacuum, and rehydrated with a trypsin-containing buffer. The next day, digested samples were acidified and peptides were extracted multiple times. Extracts were pooled, dried down, reconstituted, loading on a nanoscale capillary C18 reversed-phase HPLC column (Thermo Ultimate 3000), and separated by gradient elution. Eluted peptides were ionized by electrospray ionization and detected by an inline mass spectrometer, Orbitrap Fusion (Software version 2.0.1258.15, Thermo Scientific). MS spectra were collected first, and the most abundant ions in a 2-s window were sequentially isolated for MS/MS analysis. All matched MS/MS spectra were filtered by mass accuracy and matching scores to reduce protein false discovery rate to ~1%. All proteins identified in a gel lane were combined. The total number of spectra, namely spectral counts (SCs), matched to individual proteins reflect their relative abundance. For mass spectrometry with tandem mass tags, cell pellets were extracted in lysis buffer (50 mM HEPES, pH 8.5, 8 M urea and 0.5% sodium deoxycholate), 100μg of protein for each sample was digested with LysC (Wako), and resultant peptides labeled with 10-plex Tandem Mass Tag (TMT) reagents (Thermo Scientific). Samples were fractionated on 2-dimensional HPLC, ionized, and detected by an inline Orbitrap Fusion mass spectrometer (Thermo Scientific). MS/MS raw files were processed by the tag-based hybrid search engine JUMP32 (version 1.13.0) that yields searchable data against the UniProt human database. MS/MS spectra were filtered by mass accuracy and matching scores to reduce protein false discovery rate to ~1%. Proteins were quantified by summing reporter ion counts across all matched PSMs using JUMP. The Limma package33 (version 3.34.9) was used to calculate P values when comparing proteomes.
Recombinant Protein Expression and pull down
Full-length open reading frames of UTX and 53BP1 were cloned into pFastBac, using the Bac-to-Bac N-His or C-His TOPO cloning kit (Life Technologies) for baculovirus generation via Bac-to-Bac baculovirus expression from the St. Jude Protein Production Facility. UTX and 53BP1 domain protein fragments were produced in the pDEST17 vector with an N-terminal His tag or in a modified pGEX vector. Proteins in BL21 cells (Life Technologies) were induced by 0.1% arabinose, cells were lysed with 50 mg/mL lysozyme in PBS, and cell extracts were used for pull-down.
Full-length recombinant proteins were bound overnight at 4°C to HisPur Ni-NTA resin (ThermoFisher Scientific, PI-88221) or to UTX or Myc antibody-Dynabeads™ (Life Technologies). Protein-bead complexes were washed with PBST, added to recombinant protein fragment lysate or control lysate for 4 h at 4°C in PBST, washed in PBST, and eluted with 0.1 M glycine (pH 2.3). Eluates were neutralized with 1.5 M Tris buffer, pH 8.8, and analyzed by Western blotting.
Drosophila S2 cells (ThermoFisher Scientific) were cultured in Schneider’s Drosophila medium (ThermoFisher Scientific) plus 10% heat-inactivated fetal bovine serum (FBS). Cells were plated onto 6-well plates at ~1106 cells/well and grown for 1 day. Before transfection, medium was removed and replaced with FBS-free Schneider’s Drosophila medium.
Transfection was performed using Cellfectin II Reagent (ThermoFisher Scientific, #10362100) and Opti-MEM medium (ThermoFisher Scientific, #31985062). Cells were grown for ~48 h and harvested for nuclear extracts in buffer D. Resulting lysate was used for pull-down experiments. Supplementary Tables 2 and 3 list constructs and primers used.
Chromatin Immunoprecipitation
Cells were harvested in PBS. Cytoplasmic fractions were extracted using buffer A with 1× protease inhibitors and 1 mM DTT. Nuclear pellets were cross-linked by 1.1% formaldehyde in buffer B with 1× protease inhibitors and 1 mM DTT; washed; and lysed in lysis buffer 3 with 1× protease inhibitors, 1 mM DTT, and 1 mM PMSF. The fixed and lysed nuclear extract was sonicated with Bioruptor® Pico (Diagenode) 10 times for 15 s each, with 45-s intervals. Chromatin was added to Dynabeads™ (Life Technologies) prebound with 4 μg of antibodies. For UTX chromatin immunoprecipitation (ChIP), chromatin and antibodies were incubated overnight, followed by 4 h of recapture with Dynabeads™ the next day. After incubation, beads were washed and immunoprecipitates were eluted. DNA from eluates was recovered by the GeneJET FFPE DNA purification kit (ThermoFisher Scientific, #K0882). ChIP-qPCR signals were calculated as the percentage of input. DNA libraries were generated using the NEBNext™ Ultra DNA Library Prep kit (NEB, #E7370S) and sequenced at the St. Jude Hartwell Center. Supplementary Table 4 lists the ChIP-qPCR primers. For Re-ChIP, 10mM DTT was used to elute from the first 53BP1 ChIP, and eluate diluted by 30-fold and used as input for the second ChIP.
Deep sequencing analysis of chromatin immunoprecipitation
50bp single-end reads were obtained and aligned to human genome hg19 by BWA (version 0.5.9-r26-dev, default parameter). Then duplicated reads were marked by Picard(version 1.65(1160)) and uniquely mapped reads were retained by samtools (parameter “-q 1 -F 1024” version 1.4) and quality control following ENCODE criterion34. Fragment size estimated by SPP35 were normalized to 15 million reads. Peaks were inspected on IGV36 and peaks for each replicates were called by MACS2 (version 2.0.9 20111102)37 and SICER38 and then merged by bedtools (version 2.17.0). Sites with CPM more than 1.2-fold of input (fold cutoff chosen by < 1e-3 true negative rate) were considered as target sites. DeepTools39 was used to plot heatmap. Peak overlap was tested by the hypergeometric test with assumed binomial distributions. Gene ontology analysis was generated by Enrichr40. For histone modifications, quality control standard was as previously described41.
Voom42 was used to test significant difference between hESCs and hNPCs after trimmed mean of M-value normalization(TMM)43.
RNA-Seq analysis
Paired-end 100-cycle sequencing was performed on HiSeq 2000 or HiSeq 4000 sequencers, per the manufacturer’s directions (Illumina). RNA-Seq was mapped as previously described44 and HTSeq(version 0.6.1 p1)45 were used to estimate CPM based on GENCODE(v24)46. After normalization by TMM, Voom was used to identify differential expressed genes. Principal component analysis (PCA) was done using R(version 3.2.3) and figures generated by ggbiplot. For GSEA analysis47, gene sets were put together with MSigDB database48(C2, v5.1) analyzed by using prerank mode (version 3.0). For the unsupervised hierarchical cluster analysis (hclust function in R, ward.D method), we downloaded data from brainspan49 and clustered the top1000 variable genes (MAD score in R) using (1 - Pearson correlation coefficient) as distance after batch effect correction by Combat from SVA package50 and log2 transformation.
Genome Editing by Cas9-CRISPR and ESC Clone Generation
To generate lentiviral constructs, exon-specific gRNAs were designed using the clustered regularly interspaced short palindromic repeats (CRISPR) Design Tool (http://crispr.mit.edu/) to minimize off-target effects. Oligos (Integrated DNA Technologies) were synthesized, annealed, and cloned into vector LentiCRISPRv2 (Addgene). gRNA targeting the firefly luciferase gene (exons 6 and 7) was used as non-specific control. Viral constructs were co-transfected with VSVL, REV, and HDL into 293T cells by using Lipofectamin 3000 (Life Technologies) to generate lentiviruses. Lentiviral particles were harvested in mTeSR1, and titer was quantified by the Lenti-X qRT-PCR titration kit (Clontech).
For lentiviral transduction, ESCs were inoculated 2 consecutive times with lentiviral particles (3 h for each time) and allowed to recover in mTeSR overnight. Puromycin (0.375 g/mL; ThermoFisher Scientific) selection started approximately 24 h after transduction. Single cells from transduced and selected populations were sorted into 96-well plates (BD FACSAria™ Fusion) and amplified. Genomic DNA from single-cell clones was harvested by PureLink® Genomic DNA mini kit (Life Technologies). To assess potential DNA indels, genomic DNA was amplified using exon-specific PCR primers. PCR products were cloned into pJET vector (Life Technologies) and sequenced by the Sanger Sequencing Core facility at St. Jude. Supplementary Tables 5 and 6 list primers used for this assay.
Whole-genome-sequencing (WGS) analysis of hESC Clones
To evaluate the off-target effect in cells edited by CRISPR-Cas9, the genomic DNAs of wild-type control and each of the three 53BP1-KO clones were extracted and performed WGS analysis, using CLC Genomics Workbench v9.0 (CLC Bio) for mapping, human genome hg19 as the reference, variant calling, and coverage summarization. Indels from each sample were first called to detect editing-specific small insertions and deletions. Indels that are within the coding regions or alter splicing donor/acceptor sites, with at least x5 coverage and 5% mutation allele, were cross validated among samples, followed by manual confirmation to remove any indels called due to sequencing or mapping errors. All other non-functionally related indels were screened against the predicted off-target sites, up to 4-bp mismatches, according to a CRISPR-Cas9 target online predictor, CCTop. To better identify the editing-specific longer deletions, the relative coverage among samples were summarized using the average of the P values calculated for each of the positions in a region greater than 50 bp, and a P value of 10−4 was used as a threshold for the low coverage regions. To further investigate the longer insertions missed by the above indel analysis, soft-clipped reads with more than 10-bp overhang were extracted, the soft-clipping break points were summarized as genomic locations, and cross filtering between samples was to remove non-specific locations, and the potential insertion sites were defined as a pair of bi-direction break points within a 5-bp window. Manual confirmation, along with coverage filtering, was performed to remove any insertion candidates that caused by sequencing or mapping errors.
Immunofluorescence
Cells cultured on microscope chamber slides (Millipore) were rinsed with PBS, fixed with 3% paraformaldehyde in PBS for 5 min, permeabilized by PBST for 1–3 h, and blocked with IF blocking solution for 2–3 h. Cells were then incubated in diluted primary antibodies in blocking solution at 4°C overnight, washed with PBST, incubated in diluted fluorescent dye–conjugated secondary antibodies for 2 h, washed with PBST, counterstained with DAPI, and mounted in ProLong Gold antifade mountant (Life Technologies, #P36930). Images were acquired with Zeiss LSM780 or Nikon C2.For IF analysis, CellProfiler was used to quantify the number of DAPI-positive nuclei and determine nuclear area. Criteria used for control cells included minimum and maximum of 15 and 80 pixels, respectively, global threshold strategy, Otsu thresholding method for 2 classes, and threshold correction factor of 0.8. Because of cell size difference, for knockdown cells minimum and maximum were modified to 25 and 90 pixels, respectively, and threshold correction factor to 0.85. Cell numbers were indicated. At least 3 images were analyzed for both control and knockout lines. For each line, average nuclear area was determined in pixels^2, which was converted to micrometers2. The number of MAP2-positive cells per image was manually counted. The ratio of MAP2-positive cells in 53BP1-KO clones was normalized to that of control. Cell numbers were indicated.
Flow Cytometry and Cell Counting Analysis
For BrdU and pS10-H3 fluorescence-activated cell sorting (FACS) analysis, ES cells were singularized with Accutase®. Cells were washed with cold PBS and fixed in 70% ethanol at 4°C overnight. Cells were pelleted and treated with 2 N HCl/Triton X-100 at room temperature for 30 min to denature DNA. After neutralization, cells were incubated with primary antibody for 30 min in FACS buffer and washed in PBS. Antibodies APC anti-BrdU (BioLegend, #339808, 1:500 dilution) and anti-pS10-H3-Alexa488 (Cell Signaling Technology, #3465S, 1:1000 dilution) were used. After 3 washes in cold PBS, cells were resuspended in PBS and analyzed by BD FACSAria™ Fusion.
For cell-counting experiments, cells were treated with Accutase® and counted and seeded at the same number before counting. The following day, cells were rinsed with PBS, singularized with Accutase®, and harvested. After pelleting, cells were resuspended in PBS. Exactly 50 μL of Sphero™ ACCUCOUNT fluorescent particles (Spherotech Inc., #ACFP-70-10) were added into each sample. Mixed samples were analyzed by BD FACSAria Fusion.
Reverse Transcription–qPCR
RNA was purified with the GeneJET RNA purification kit (ThermoFisher Scientific, K0732). The cDNA was reverse transcribed from 300 ng of RNA, using SuperScript IV reverse transcriptase (ThermoFisher Scientific, #18090050) with random hexamers. RT reactions were performed in triplicate to minimize variability. Real-time qPCR reactions were performed in iTaq™ SYBR® Green Supermix (Bio-Rad, #1725124), using a Bio-Rad CFX96 system with primers listed in Supplemental Table 6. Relative expression of gene of interest was normalized against housekeeping genes (e.g., ACTB, GATA4). qPCR results were quantified using the difference in threshold cycle values between the gene of interest and endogenous control by the 2-ΔΔct method. Supplementary Table 7 lists RT-qPCR primers.
Double-stranded break foci counting
Cells with immunofluorescence of phosphorylated serine 139 in H2AX (γH2AX) were imaged by a 60x objective on a Zeiss LSM780. Left image in Supplementary Fig. 22 is a representative γH2AX IF image. The Imaris 8.4 (Bitplane) was used to threshold and detect individual γH2AX-positive foci. Right image in Supplementary Fig. 23 is a representative image of foci detection, in which individual foci were highlighted by a yellow ball. Cell counting function of Imaris 8.4 was then used to count the number of foci within individual nuclei, which was detected by DAPI-staining (not shown).
Cortical organoid generation
Cerebral organoids were generated based on previously published methods with minor modifications20,21. In brief, hESCs were dissociated to single cell suspension using Accutase and seeded onto low-attachment 96-well plates (Costar, 7007) at a density of 9,000 cells per well to aggregate into embryoid bodies (EBs). The EB formation medium (DMEM/F12 with 20% knockout serum replacement, 3% ESC-quality FBS, 2 mM GlutaMAX, 0.1 mM nonessential amino acides,) was supplemented with Dorsomorphin (2 μM), WNT inhibitor (IWR1, 3 μM), TGF-ß inhibitor (SB431542, 5 μM) and Rho Kinase inhibitor (Y-27623, 20 μM). Starting form Day4, EBs were fed with cortical differentiation medium (Glasgow-MEM, 20% KSR, 0.1 mM NEAA, 1 mM sodium pyruvate, 0.1 mM ß-ME, 1% anti-anti), supplement with WNT inhibitor (IWR1, 3 μM), TGF-ß inhibitor (SB431542, 5 μM), Cyclopamine (2.5 μM) and Rho Kinase inhibitor (Y-27623, 20 μM). On Day17, EBs were embedded in matri-gel droplets and transferred onto low-attachemnt 6-wells and cultured in suspension using DMEM/F-12 supplemented with 1% N2 supplement, 1% Lipid concentrate, 2% B27suppmenent without Vitamin A, and 1% anti-anti under 40% O2/5% CO2 conditions on shaker. Starting from Day30, medium was changed to 50% DMED/F-12, 50% Neurobasal media, 0.5% N2 supplement, 1% GlutaMax, 0.05 mM NEAA, 0.025% human insulin, 0.1 mM ß-ME and 1% anti-anti, supplemented with 2% B27.
Animals and mNPC isolation and differentiation
Animal experiments were performed in accordance with the guidelines of the Institutional Animal Care and Use Committee of St. Jude Children’s Research Hospital. The Trp53bp1tm1Jc KO mouse, stock 006495, was from the Jackson Laboratory. KO and wild-type embryos of both genders at embryonic day 14 were used for comparison studies. To derive 53bp1 mutant mouse, C57BL/6J zygotes were micro-injected with 100ng/ul Cas9 mRNAs and 25ng/ul CRISPR RNAs diluted in IDTE and transferred into the oviducts of pseudo-pregnant CD-1 females. Targeted region in 53bp1 locus of the resultant pups were sequenced to identify in-frame deletions. Males containing the deletions were mated to Trp53bp1tm1Jc females to generate embryos, whose 53bp1 locus was sequenced to identify deletion/KO embryos. Deletion/KO and wild-type embryos at embryonic day 14 were dissected, their neural tubes were dissociated by collagenase type 2 to yield single cells, and mNPCs isolated by FACS using NeuroFluor CDr3 (STEMCELL Technologies, #01800). Isolated mNPCs were analyzed or cultured in differentiation media (NeuroCult differentiation, STEMCELL Technologies, #05704) for further analyses.
Data analysis
The Life Sciences Reporting Summary for this study is completed and available on the journal website. No statistical methods were used to pre-determine sample sizes for deep-sequencing data. For other data, the sample size were determined by a statistical power analysis using the online tool powerandsamplesize.com/Calculators. Specific statistical tests were listed in respective figure legends and method sections. Most calculations were done with the intention to compare 2 means, with 2-sample, 1-sided assumption. Data distribution was assumed to be normal but this was not formally tested. Data collection was not randomized, not blinded, and analysis not performed blind to the conditions of the experiments. No data points were excluded from data analyses.
Data Availability
All sequencing data are deposited in GEO: GSE108116. Data that support the findings of this study are available from the corresponding author upon reasonable request.
Code Availability.
Bash script for ChIP-Seq is available on the http://www.figshare.com under DOI: 10.6084/m9.figshare.7411835.
Supplementary Material
Acknowledgements
The authors thank M.A. Dyer for helpful discussions; X. Cao, and Y.-G. Han for helpful comments; A. Andersen and C. Guess for editing the manuscript; J. Houston for cell sorting; S. Olsen and D. Roeber for sequencing samples; A. Nityanandam for optimizing the cortical organoid protocol and technical advice; V. Stewart for mouse embryo injection; S. Porter and S. Miller for mi-seq analysis of in-frame clones and mouse embryos; L. Ding and M. Rusch for sequencing mapping; V. Frohlich, J. Klein, L. Griffiths, J. Peters, L. Milburn, and Y. Li for experimental assistance. M.E. is funded by NIH (1F32HD093276). J.P. is funded by American Lebanese Syrian Associated Charities and NIH (R01GM114260, R01AG047928, and R01AG053987). J.C.P is funded by American Lebanese Syrian Associated Charities and American Cancer Society (132096-RSG-18-032-01-DDC).
Footnotes
Accession Codes
All sequencing data are deposited in GEO: GSE108116. Bash script for ChIP-Seq is available on the http://www.figshare.com under DOI: 10.6084/m9.figshare.7411835.
Competing Interests
The authors declare no competing interests.
REFERENCES
- 1.Wang C et al. UTX regulates mesoderm differentiation of embryonic stem cells independent of H3K27 demethylase activity. Proceedings of the National Academy of Sciences of the United States of America 109, 15324–15329, doi: 10.1073/pnas.1204166109 (2012). [DOI] [PMC free article] [PubMed] [Google Scholar]
- 2.Welstead GG et al. X-linked H3K27me3 demethylase Utx is required for embryonic development in a sex-specific manner. Proceedings of the National Academy of Sciences of the United States of America 109, 13004–13009, doi: 10.1073/pnas.1210787109 (2012). [DOI] [PMC free article] [PubMed] [Google Scholar]
- 3.Guo C et al. Global identification of MLL2-targeted loci reveals MLL2's role in diverse signaling pathways. Proceedings of the National Academy of Sciences of the United States of America 109, 17603–17608, doi: 10.1073/pnas.1208807109 (2012). [DOI] [PMC free article] [PubMed] [Google Scholar]
- 4.Hong S et al. Identification of JmjC domain-containing UTX and JMJD3 as histone H3 lysine 27 demethylases. Proceedings of the National Academy of Sciences of the United States of America 104, 18439–18444, doi: 10.1073/pnas.0707292104 (2007). [DOI] [PMC free article] [PubMed] [Google Scholar]
- 5.Tie F, Banerjee R, Conrad PA, Scacheri PC & Harte PJ Histone demethylase UTX and chromatin remodeler BRM bind directly to CBP and modulate acetylation of histone H3 lysine 27. Mol Cell Biol 32, 2323–2334, doi: 10.1128/MCB.06392-11 (2012). [DOI] [PMC free article] [PubMed] [Google Scholar]
- 6.Miller SA, Mohn SE & Weinmann AS Jmjd3 and UTX play a demethylase-independent role in chromatin remodeling to regulate T-box family member-dependent gene expression. Mol Cell 40, 594–605, doi: 10.1016/j.molcel.2010.10.028 (2010). [DOI] [PMC free article] [PubMed] [Google Scholar]
- 7.Vandamme J et al. The C. elegans H3K27 demethylase UTX-1 is essential for normal development, independent of its enzymatic activity. PLoS Genet 8, e1002647, doi: 10.1371/journal.pgen.1002647 (2012). [DOI] [PMC free article] [PubMed] [Google Scholar]
- 8.Shpargel KB, Starmer J, Wang C, Ge K & Magnuson T UTX-guided neural crest function underlies craniofacial features of Kabuki syndrome. Proceedings of the National Academy of Sciences of the United States of America 114, E9046–E9055, doi: 10.1073/pnas.1705011114 (2017). [DOI] [PMC free article] [PubMed] [Google Scholar]
- 9.Petruk S et al. Delayed Accumulation of H3K27me3 on Nascent DNA Is Essential for Recruitment of Transcription Factors at Early Stages of Stem Cell Differentiation. Mol Cell 66, 247–257 e245, doi: 10.1016/j.molcel.2017.03.006 (2017). [DOI] [PMC free article] [PubMed] [Google Scholar]
- 10.Wang SP et al. A UTX-MLL4-p300 Transcriptional Regulatory Network Coordinately Shapes Active Enhancer Landscapes for Eliciting Transcription. Mol Cell 67, 308–321 e306, doi: 10.1016/j.molcel.2017.06.028 (2017). [DOI] [PMC free article] [PubMed] [Google Scholar]
- 11.Gage FH & Temple S Neural stem cells: generating and regenerating the brain. Neuron 80, 588–601, doi: 10.1016/j.neuron.2013.10.037 (2013). [DOI] [PubMed] [Google Scholar]
- 12.Panier S & Boulton SJ Double-strand break repair: 53BP1 comes into focus. Nat Rev Mol Cell Biol 15, 7–18, doi: 10.1038/nrm3719 (2014). [DOI] [PubMed] [Google Scholar]
- 13.Ward IM, Minn K, van Deursen J & Chen J p53 Binding protein 53BP1 is required for DNA damage responses and tumor suppression in mice. Mol Cell Biol 23, 2556–2563 (2003). [DOI] [PMC free article] [PubMed] [Google Scholar]
- 14.Cuella-Martin R et al. 53BP1 Integrates DNA Repair and p53-Dependent Cell Fate Decisions via Distinct Mechanisms. Mol Cell 64, 51–64, doi: 10.1016/j.molcel.2016.08.002 (2016). [DOI] [PMC free article] [PubMed] [Google Scholar]
- 15.Puc J, Aggarwal AK & Rosenfeld MG Physiological functions of programmed DNA breaks in signal-induced transcription. Nat Rev Mol Cell Biol 18, 471–476, doi: 10.1038/nrm.2017.43 (2017). [DOI] [PMC free article] [PubMed] [Google Scholar]
- 16.Bunch H et al. Transcriptional elongation requires DNA break-induced signalling. Nat Commun 6, 10191, doi: 10.1038/ncomms10191 (2015). [DOI] [PMC free article] [PubMed] [Google Scholar]
- 17.Hsu PD et al. DNA targeting specificity of RNA-guided Cas9 nucleases. Nat Biotechnol 31, 827–832, doi: 10.1038/nbt.2647 (2013). [DOI] [PMC free article] [PubMed] [Google Scholar]
- 18.Jinek M et al. A programmable dual-RNA-guided DNA endonuclease in adaptive bacterial immunity. Science 337, 816–821, doi: 10.1126/science.1225829 (2012). [DOI] [PMC free article] [PubMed] [Google Scholar]
- 19.Kuo LJ & Yang LX Gamma-H2AX - a novel biomarker for DNA double-strand breaks. In Vivo 22, 305–309 (2008). [PubMed] [Google Scholar]
- 20.Kadoshima T et al. Self-organization of axial polarity, inside-out layer pattern, and species-specific progenitor dynamics in human ES cell-derived neocortex. Proceedings of the National Academy of Sciences of the United States of America 110, 20284–20289, doi: 10.1073/pnas.1315710110 (2013). [DOI] [PMC free article] [PubMed] [Google Scholar]
- 21.Lancaster MA & Knoblich JA Generation of cerebral organoids from human pluripotent stem cells. Nat Protoc 9, 2329–2340, doi: 10.1038/nprot.2014.158 (2014). [DOI] [PMC free article] [PubMed] [Google Scholar]
- 22.Brose K et al. Slit proteins bind Robo receptors and have an evolutionarily conserved role in repulsive axon guidance. Cell 96, 795–806 (1999). [DOI] [PubMed] [Google Scholar]
- 23.Carl M, Loosli F & Wittbrodt J Six3 inactivation reveals its essential role for the formation and patterning of the vertebrate eye. Development 129, 4057–4063 (2002). [DOI] [PubMed] [Google Scholar]
- 24.Lagutin OV et al. Six3 repression of Wnt signaling in the anterior neuroectoderm is essential for vertebrate forebrain development. Genes Dev 17, 368–379, doi: 10.1101/gad.1059403 (2003). [DOI] [PMC free article] [PubMed] [Google Scholar]
- 25.Burgold T et al. The histone H3 lysine 27-specific demethylase Jmjd3 is required for neural commitment. PLoS One 3, e3034, doi: 10.1371/journal.pone.0003034 (2008). [DOI] [PMC free article] [PubMed] [Google Scholar]
- 26.Jepsen K et al. SMRT-mediated repression of an H3K27 demethylase in progression from neural stem cell to neuron. Nature 450, 415–419, doi: 10.1038/nature06270 (2007). [DOI] [PubMed] [Google Scholar]
- 27.Park DH et al. Activation of neuronal gene expression by the JMJD3 demethylase is required for postnatal and adult brain neurogenesis. Cell Rep 8, 1290–1299, doi: 10.1016/j.celrep.2014.07.060 (2014). [DOI] [PMC free article] [PubMed] [Google Scholar]
- 28.Iwabuchi K, Bartel PL, Li B, Marraccino R & Fields S Two cellular proteins that bind to wild-type but not mutant p53. Proceedings of the National Academy of Sciences of the United States of America 91, 6098–6102 (1994). [DOI] [PMC free article] [PubMed] [Google Scholar]
- 29.Madabhushi R et al. Activity-Induced DNA Breaks Govern the Expression of Neuronal Early-Response Genes. Cell 161, 1592–1605, doi: 10.1016/j.cell.2015.05.032 (2015). [DOI] [PMC free article] [PubMed] [Google Scholar]
- 30.Schwer B et al. Transcription-associated processes cause DNA double-strand breaks and translocations in neural stem/progenitor cells. Proc Natl Acad Sci U S A 113, 2258–2263, doi: 10.1073/pnas.1525564113 (2016). [DOI] [PMC free article] [PubMed] [Google Scholar]
- 31.Wei PC et al. Long Neural Genes Harbor Recurrent DNA Break Clusters in Neural Stem/Progenitor Cells. Cell 164, 644–655, doi: 10.1016/j.cell.2015.12.039 (2016). [DOI] [PMC free article] [PubMed] [Google Scholar]
- 32.Wang X et al. JUMP: a tag-based database search tool for peptide identification with high sensitivity and accuracy. Mol Cell Proteomics 13, 3663–3673, doi: 10.1074/mcp.O114.039586 (2014). [DOI] [PMC free article] [PubMed] [Google Scholar]
- 33.Ritchie ME et al. limma powers differential expression analyses for RNA-sequencing and microarray studies. Nucleic acids research 43, e47, doi: 10.1093/nar/gkv007 (2015). [DOI] [PMC free article] [PubMed] [Google Scholar]
- 34.Landt SG et al. ChIP-seq guidelines and practices of the ENCODE and modENCODE consortia. Genome Research 22, 1813–1831, doi: 10.1101/gr.136184.111 (2012). [DOI] [PMC free article] [PubMed] [Google Scholar]
- 35.Kharchenko PV, Tolstorukov MY & Park PJ Design and analysis of ChIP-seq experiments for DNA-binding proteins. Nat. Biotechnol 26, 1351–1359, doi: 10.1038/nbt.1508 (2008). [DOI] [PMC free article] [PubMed] [Google Scholar]
- 36.Robinson JT et al. Integrative genomics viewer. Nat. Biotechnol 29, 24–26, doi: 10.1038/nbt.1754 (2011). [DOI] [PMC free article] [PubMed] [Google Scholar]
- 37.Zhang Y, Shin H, Song JS, Lei Y & Liu XS Identifying Positioned Nucleosomes with Epigenetic Marks in Human from ChIP-Seq. BMC Genomics 9, 537, doi: 10.1186/1471-2164-9-537 (2008). [DOI] [PMC free article] [PubMed] [Google Scholar]
- 38.Zang C et al. A clustering approach for identification of enriched domains from histone modification ChIP-Seq data. Bioinformatics 25, 1952–1958, doi: 10.1093/bioinformatics/btp340 (2009). [DOI] [PMC free article] [PubMed] [Google Scholar]
- 39.Ramíirez F et al. deepTools2: a next generation web server for deep-sequencing data analysis. Nucleic Acids Research 44, W160–W165, doi: 10.1093/nar/gkw257 (2016). [DOI] [PMC free article] [PubMed] [Google Scholar]
- 40.Kuleshov MV et al. Enrichr: a comprehensive gene set enrichment analysis web server 2016 update. Nucleic Acids Research 44, W90–W97, doi: 10.1093/nar/gkw377 (2016). [DOI] [PMC free article] [PubMed] [Google Scholar]
- 41.Aldiri I et al. The Dynamic Epigenetic Landscape of the Retina During Development, Reprogramming, and Tumorigenesis. Neuron 94, 550–568.e510, doi: 10.1016/j.neuron.2017.04.022 (2017). [DOI] [PMC free article] [PubMed] [Google Scholar]
- 42.Law CW, Chen Y, Shi W & Smyth GK voom: precision weights unlock linear model analysis tools for RNA-seq read counts. Genome Biology 15, R29, doi: 10.1186/gb-2014-15-2-r29 (2014). [DOI] [PMC free article] [PubMed] [Google Scholar]
- 43.Robinson MD & Oshlack A A scaling normalization method for differential expression analysis of RNA-seq data. Genome Biology 11, R25, doi: 10.1186/gb-2010-11-3-r25 (2010). [DOI] [PMC free article] [PubMed] [Google Scholar]
- 44.Downing JR et al. The Pediatric Cancer Genome Project. Nat Genet 44, 619–622, doi: 10.1038/ng.2287 (2012). [DOI] [PMC free article] [PubMed] [Google Scholar]
- 45.Anders S, Pyl PT & Huber W HTSeq—a Python framework to work with high-throughput sequencing data. Bioinformatics 31, 166–169, doi: 10.1093/bioinformatics/btu638 (2015). [DOI] [PMC free article] [PubMed] [Google Scholar]
- 46.Harrow J et al. GENCODE: the reference human genome annotation for The ENCODE Project. Genome Research 22, 1760–1774, doi: 10.1101/gr.135350.111 (2012). [DOI] [PMC free article] [PubMed] [Google Scholar]
- 47.Subramanian A et al. Gene set enrichment analysis: A knowledge-based approach for interpreting genome-wide expression profiles. Proceedings of the National Academy of Sciences 102, 15545–15550, doi: 10.1073/pnas.0506580102 (2005). [DOI] [PMC free article] [PubMed] [Google Scholar]
- 48.Liberzon A et al. The Molecular Signatures Database Hallmark Gene Set Collection. Cell Systems 1,417–425, doi: 10.1016/j.cels.2015.12.004 (2015). [DOI] [PMC free article] [PubMed] [Google Scholar]
- 49.Miller JA et al. Transcriptional landscape of the prenatal human brain. Nature 508, 199, doi: 10.1038/nature13185https://www.nature.com/articles/nature13185#supplementary-information (2014). [DOI] [PMC free article] [PubMed] [Google Scholar]
- 50.Leek JT, Johnson WE, Parker HS, Jaffe AE & Storey JD The sva package for removing batch effects and other unwanted variation in high-throughput experiments. Bioinformatics 28, 882–883, doi: 10.1093/bioinformatics/bts034 (2012). [DOI] [PMC free article] [PubMed] [Google Scholar]
Associated Data
This section collects any data citations, data availability statements, or supplementary materials included in this article.
Supplementary Materials
Data Availability Statement
All sequencing data are deposited in GEO: GSE108116. Data that support the findings of this study are available from the corresponding author upon reasonable request.