ABSTRACT
HPRT is a housekeeping enzyme involved in recycling guanine and inosine in the purine salvage pathway. As a housekeeping gene, HPRT has been widely used as an endogenous control for molecular studies evaluating changes in gene expression. Yet, recent evidence has shown that HPRT exhibits high variability within malignant samples. We designed this study to determine whether this observed upregulation is consistently found, therefore rendering hprt an unsuitable normalization control in cancer. Utilizing protein and RNA-seq expression, we found that malignant and normal patient samples vary significantly both within the same tissue type and across organ sites. Upon staining for HPRT via immunohistochemistry, we found that expression is highly variable in malignant samples (Lung; 89.2–111.8, Breast; 66.7–98.3, Colon; 85.3–129.7, Prostate; 90.8–155.4, Pancreas; 74.1–132.1). Similarly, we observed high variability across cell lines via western blotting (p < 0.0001) which was further confirmed using RNA sequencing. Comparing normal and malignant patient samples, we observed consistent upregulation of HPRT expression within malignant samples relative to normal samples (p = 0.0001). These data indicate that HPRT is unsuitable as an endogenous control for cancer-related studies because its expression is highly variable and exceeds that of an appropriate control; therefore, we recommend its discontinued use as a normalization gene.
KEYWORDS: Hypoxanthine Guanine Phosphoribosyltransferase (HPRT or HGPRT), endogenous control, housekeeping gene
Introduction
Nucleotides provide the essential building blocks to support DNA replication and cell growth.1 Because cell division is controlled by a balance of external and internal factors, the processes that control nucleotide production are tightly regulated as they are connected to cell cycle regulation.2,3 The salvage pathway is a nucleotide synthesis pathway that operates by recycling nucleotides, and supplies the majority of the nucleotide pool needed during the s-phase of the cell cycle.4 Hypoxanthine Guanine Phosphoribosyltransferase (HPRT) is a salvage pathway enzyme involved in the synthesis of both guanine and inosine and is responsible for the majority of guanine production, as 90% of free purines in humans are recycled.5,6 This enzyme transfers phosphoribose from phosphoribosyl pyrophosphate (PRPP) to hypoxanthine or guanine bases to form inosine monophosphate (IMP) and guanosine monophosphate (GMP), respectively.6,7 Due to the constant requirement for GTP, as both a nucleotide for DNA synthesis and as an energy moleule throughout the cell, HPRT is reliably produced as a housekeeping gene and is found in all somatic tissue in low levels.8–10
Due to its housekeeping nature, HPRT is commonly used as a standard endogenous control for transcriptional and protein-level analysis.11–16 Yet, the literature is inconsistent when reporting HPRT expression levels, particularly in cancer. After comparing various housekeeping genes such as GAPDH, β-2 Microglobulin, 18s ribosomal RNA, etc., some researchers have reported HPRT as the most consistent endogenous control,17 while others have reported HPRT levels to be significantly lower than other controls in cancer tissue.18 Further studies have reported HPRT as an unsuitable standard in certain cell types due to varying expression in response to growth factor stimuli.19 Other sources have reported HPRT to be expressed in breast carcinoma cell lines, primary tumors, and metastatic lungs, but undetectable in healthy lung tissue.20 In addition, further evidence shows that HPRT demonstrates significant variability between normal patients and those with cancer.21,22 The inconsistency present in the literature is concerning as HPRT is widely used to standardize both RNA and protein levels.
This study was designed to investigate the use of HPRT as a suitable endogenous control for cancer-related studies. The most essential characteristic of endogenous controls is their relatively constant expression in cells regardless of experimental conditions. As a critical component of several molecular techniques evaluating small discrepancies in mRNA and protein content, using accurate endogenous controls to standardize expression is paramount in correctly representing data.
Results
HPRT expression varies widely between cancer patients
Due to the housekeeping status of HPRT, protein expression within patient tissue was directly compared against normal tissue samples to highlight additional upregulation above that of normal cells. We found significant variability between normal and malignant patient samples with an overall trend of elevated HPRT expression upon malignancy (Table 1). This variability is seen across several different organ types, with prostate cancer patients exhibiting the highest discrepancy between normal (134.2 average gray value) and malignant (120.83 average gray value). Most notably, the range of staining intensity greatly varied amongst the malignant samples (lung; 89.2–111.8, breast; 66.7–98.3, colon; 85.3–129.7, prostate; 90.8–155.4, pancreas; 74.1–132.1) demonstrating that within each organ type, HPRT expression is significantly variable. This same variability was greatly reduced within the normal tissue samples as the overall range of average gray intensity decreased (lung; 93.0–107.6, breast; 81.6–105.1, colon; 101.5–108.7, prostate; 129.4–136.9, pancreas; 51.0–103.6). Pancreatic tissue showed an inverse relationship when compared to all other organ types, as HPRT expression was generally reduced (p < 0.0001) in malignant tissue, 154.95 average gray value, when compared to normal tissue, 137.33 average gray value (Figure 1).
Table 1.
Patient tissue quantification.
| Organ | Tissue Type | Grade Range | Number of Patients | Age Range | Male/Female | Overall gray intensity |
|---|---|---|---|---|---|---|
| Lung | Normal | - | 18 | 30–77 | 14/4 | 101.08 |
| Marginal | - | 18 | 100.74 | |||
| Malignant | 1–3 | 18 | 100.26 | |||
| Breast | Normal | - | 24 | 28–69 | 0/24 | 113.04 |
| Marginal | - | 21 | 32–74 | 0/21 | 107.90 | |
| Malignant | - | 18 | 29–68 | 0/18 | 97.33 | |
| Colon | Normal | - | 8 | 29–42 | 8/0 | 104.37 |
| Marginal | - | 18 | 32–81 | 15/3 | 103.30 | |
| Malignant | 1–3 | 53 | 30–79 | 27/26 | 102.59 | |
| Prostate | Normal | - | 3 | 63–75 | 3/0 | 134.2 |
| Malignant | 1–3 | 53 | 60–85 | 53/0 | 120.83 | |
| Pancreas | Normal | - | 10 | 19–40 | 29/28 | 154.93 |
| Marginal | - | 10 | 49–73 | 6/4 | 137.33 | |
| Malignant | 1–3 | 54 | 40–84 | 4/6 | 154.95 |
Figure 1.
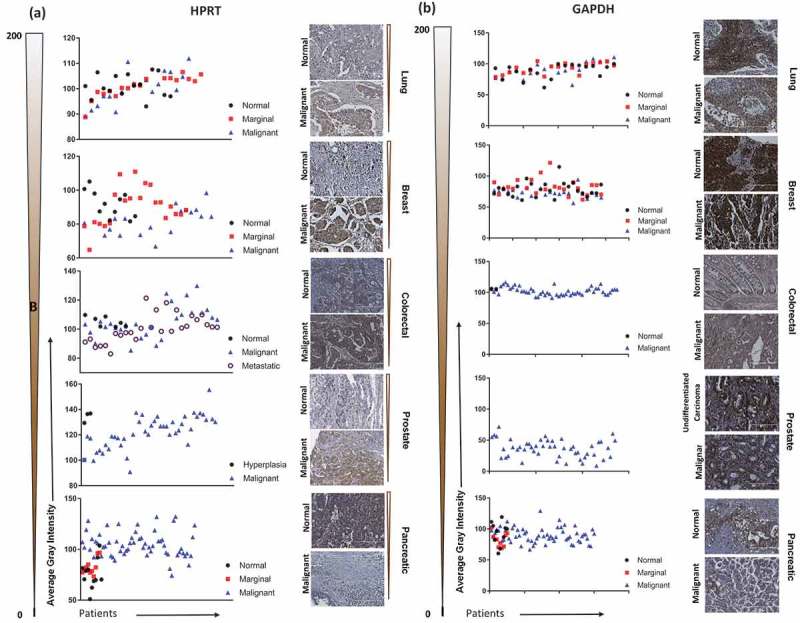
Immunohistochemistry staining of HPRT compared to GAPDH in a variety of organ types. Lung, Breast, Colon, Prostate, and Pancreatic malignant and normal tissue were stained with antibodies against HPRT and GAPDH to determine trends in expression between cancerous and healthy tissue. Tissues were quantified on a gray scale and lower values indicate a darker stain and higher protein binding. The gradient scale directly left of the images shows the directionality and intensity of the DAB staining. (A) HPRT showed a significant variability between malignant and normal tissue samples with an overall trend of increased HPRT upon malignancy. (B) GAPDH had significantly elevated levels of expression in both malignant and normal tissue samples.
Additionally, upon comparing HPRT expression across malignant organ types, we found significant variation with breast tissue showing the highest average HPRT (97.33) and prostate tissue showing the lowest average HPRT (120.83). The discrepancy between the different organ sites was also present in normal tissue, but to a lesser extent (Figure 2). Breast and colon samples showed significant (p = 0.0183) changes in HPRT expression, while pancreatic samples were significantly lower than other organ sites (p < 0.0001). These data indicate that not only is HPRT expression inconsistent between healthy and malignant tissue, but also shows that there is significant variability between various tissue types. On average, the marginal tissue, which is tissue taken from the periphery of the cancer, had intermediate HPRT expression between normal levels and malignant levels, which is consistent with our analysis indicating a general trend of increased HPRT expression upon cancer development.
Figure 2.
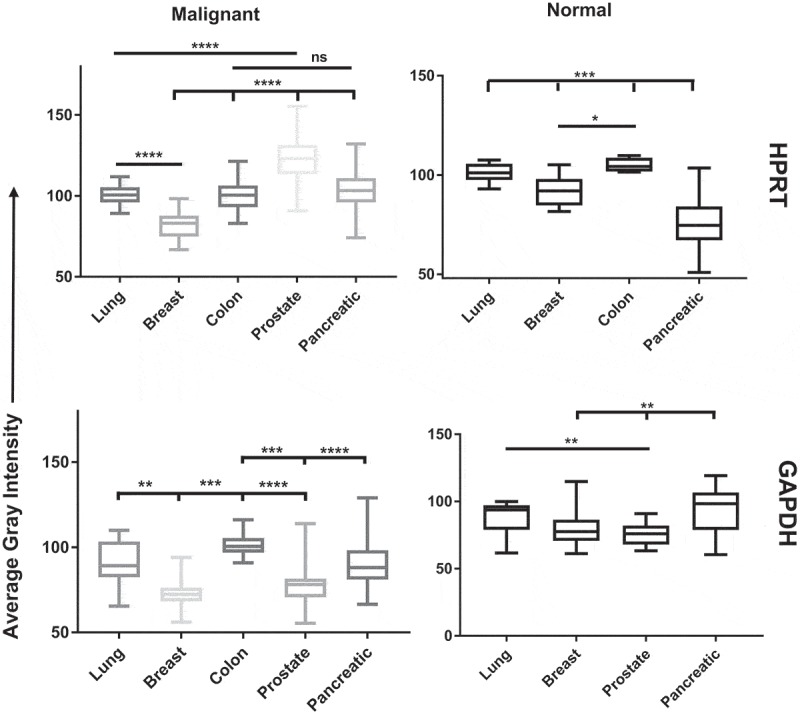
Statistical analysis of HPRT and GAPDH expression in patient tissue. Tissues were quantified on a gray scale and lower values indicate darker staining. Both GAPDH and HPRT had significant variability between organ systems. HPRT showed less significance within normal tissue, with pancreatic tissue showing the greatest significance from other tissue types (p < 0.001). In malignant samples, HPRT showed more significant variability with all organs showing significance from each other with the exception of Colon and Pancreatic tissue samples. GAPDH showed similar patterns as HPRT with significant expression between malignant organ sites.
Less variability was observed in the box plots of GAPDH samples when compared to the HPRT box plots as they were generally tighter in prostate, colon, and breast samples (Figure 2). GAPDH also showed some significance between normal tissue, but was not as extreme as the variability observed in malignant samples.
Protein expression varies significantly across cell lines
We found that expression of the HPRT protein varied significantly across various cell lines from a variety of organ origins. As protein volumes were standardized against GAPDH, we found that EEF2 had no significant differences in protein expression between cell lines. B2M showed similar consistent expression, with the exception of Jurkat cells which had significantly (p = 0.0012) lower expression compared to other cell line samples. While B2M, TBP, and GAPDH show very small changes in total protein expression, HPRT had significant variability across all cell types (Figure 3). Consistent with tissue data, normal PBMC cells had the lowest total amount of protein (p < 0.0001), while A549 and U937 cells had the highest total protein content (p < 0.0001). PC3 and DU145 prostate cancer cell lines had equal HPRT expression (p > 0.999), along with H460 and A549 lung cancer cells (p = 0.87). All other organ pairs had significant differences in expression. SW620 and HT29 colon cancer cells (p = 0.043), MDA-MB-231 and MCF7 breast cancer cells (p = 0.043) all show significant differences in HPRT expression. When comparing normal PBMC lysate to other mononuclear cells, we found Raji cells (p = 0.0007), Jurkat cells (p = 0.0212), and U937 cells (p = 0.0007) each show significant elevation. These data also show that HPRT protein levels within cancer cells are significantly different from one another, especially when compared to other endogenous proteins.
Figure 3.
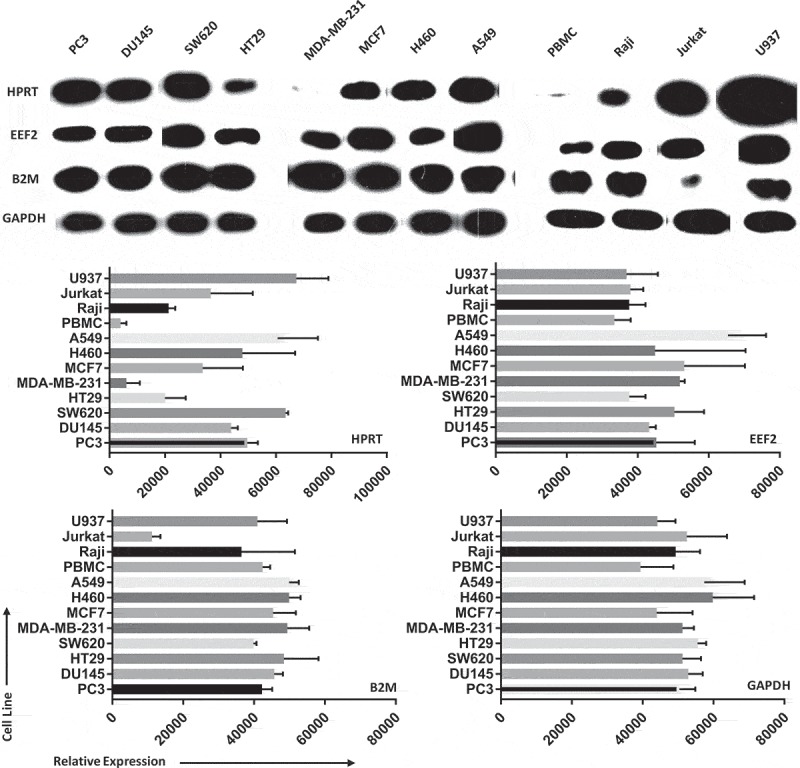
Protein expression between cell lines shows significant variability in HPRT when compared to other endogenous controls. Samples were originally standardized to GAPDH expression and B2M, EEF2, and HPRT were measured in comparison to that standard. Cell lysates were isolated for 2 cell lines from each organ tissue type. We find that HPRT expression varies significantly in comparison to both EEF2 and B2M expression when standardized against GAPDH.
RNA levels are inconsistent across various cancer cell lines
To determine whether HPRT is suitable as a control for RNA expression, we evaluated RNA levels of 90 cancer cell lines from a variety of different organ origins (lung, breast, colon, prostate, pancreas). We found statistically significant variability in expression not only among different cancer cell lines within the same organ site, but also across different organ sites (Figure 4). The highest expressing cell lines according to RNA expression were QGP-1 (pancreas), DV-90 (lung), and OUMS-23 (colon), while the lowest expressing cell lines were LoVo (colon), COR-L105 (lung), and SNU-213 (pancreas). Although the overall average levels of all cell lines evaluated from each tissue type show some similarity, as indicated by the horizontal lines, the variability between the individual cell lines within and between each organ type is significant.
Figure 4.
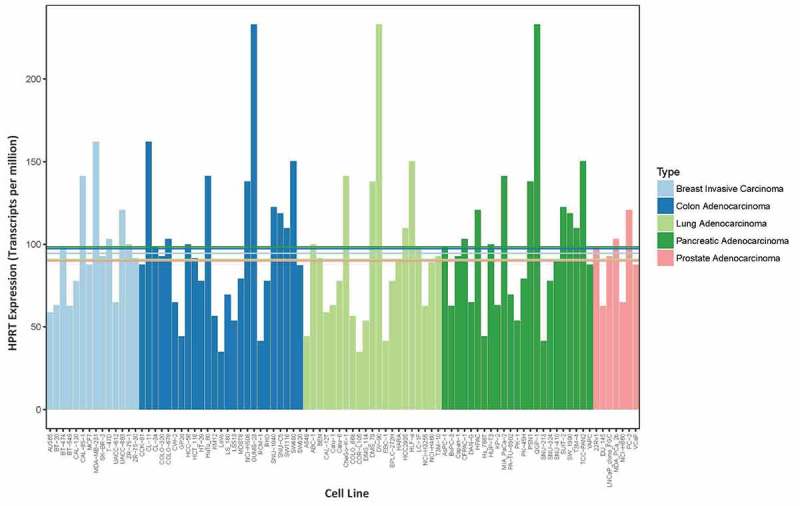
RNA expression in cell lines show a range of HPRT expression. RNA expression of HPRT was plotted for a range of malignant cell lines (7–25 cell lines) from five different organs sites found in the CCLE database. These data do not require error bars a they are a single measurement of the HPRT levels within each sample. The horizontal lines indicate average expression levels across all cell lines within a given organ type, which corresponds to the labeled organ color. These data show the significant variability in HPRT expression across both cancer cell lines and across organ types as well.
Endogenous control variation depends on the original organ tissue
We also evaluated RNA expression levels between malignant and normal samples to determine if the same variability observed within cell line data also existed within patient samples. We found that there was an overall significant increase in HPRT upon malignancy, as was observed in other assays (p-value = 0.0007, Prostate adenocarcinoma; 0.0001, lung squamous carcinoma; 0.0001, Lung adenocarcinoma; 0.0001, Colon adenocarcinoma; 0.0001, Breast invasive carcinoma). The most significant difference was found within lung squamous cell carcinoma patients. Upon analyzing 9 other endogenous control genes we found that their expression levels also varied, but this was according to the organ tissue type (Figure 5). ACTB and TBP generally were elevated in normal patients when compared to malignant patients but showed relatively consistent expression across samples (p-values ACTB: 0.8178, colon adenocarcinoma; 0.4614, lung adenocarcinoma; 0.9974, lung squamous carcinoma; TBP: 0.2615, lung adenocarcinoma; 0.3142, prostate adenocarcinoma). Meanwhile GAPDH, GUSB, PGK1, PP1A, RPLPO, and B2M all generally showed elevation of expression in malignant tumors. TFRC was the only gene that had a variation of elevation, with lung adenocarcinoma and prostate adenocarcinoma patients showing elevated levels in normal samples; and lung squamous cell carcinoma, colon adenocarcinomas, and breast carcinoma showing elevation in tumors.
Figure 5.
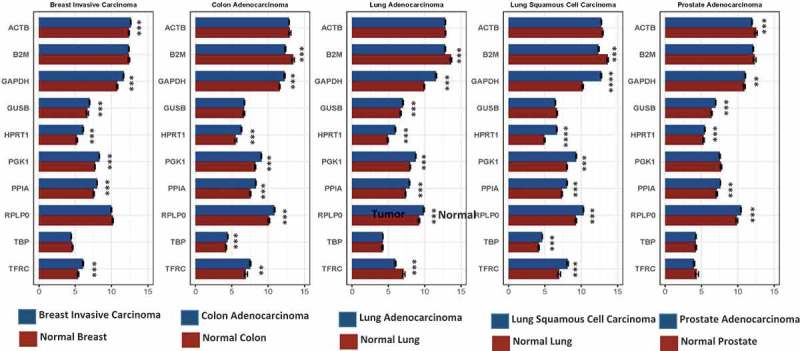
RNA expression in 10 different endogenous control genes was graphed between normal and malignant patient tissue. Expression was determined utilizing transcripts per million of corresponding RNA transcripts within each sample. We observed statistically significant differences in expression for several of the control genes between normal and tumor samples. These data indicate the best normalization genes in each corresponding organ. HPRT1 had a significant difference between every cancerous and normal sample indicating that the gene is not a good choice as an endogenous control when comparing normal and malignant samples.
To show how HPRT variability can affect experimental results and conclusions we mapped the other endogenous control genes utilizing either normal HPRT as the standard or malignant HPRT as the standard. Here we see that gene expression can vary. TFRC goes from showing an elevation when normalized to normal HPRT to a decrease in protein expression when standardized to malignant HPRT. This demonstrates that utilizing HPRT in malignant samples does not provide an adequate representation of gene elevation or reduction compared to normal cells (Figure 6).
Figure 6.
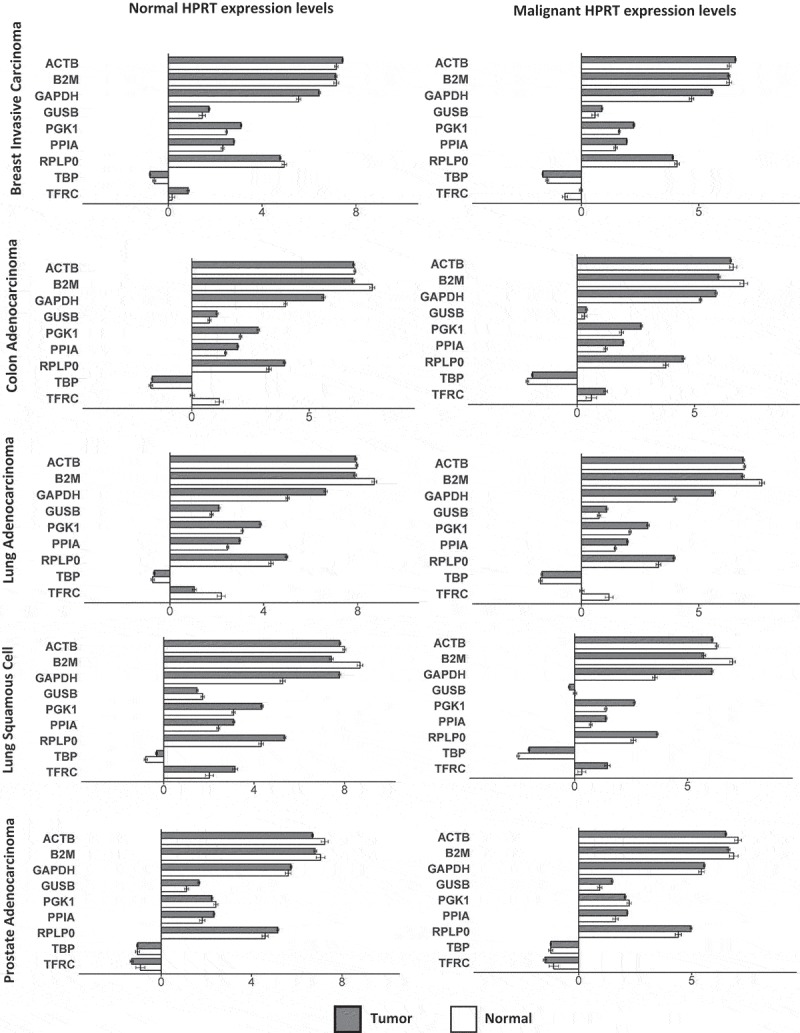
Impact of using HPRT as a normalization standard on gene expression. Normal and malignant HPRT levels were used as a normalization to compare the expression of the remaining 9 endogenous control genes. Total gene expression was plotted with either “normal” or “malignant” HPRT levels within each cancer type as the normal standard to which the fold changes in all other proteins was determined. We found that when using either normal or malignant HPRT levels there was significant variability in the other endogenous control gene expression profiles.
Discussion
This study analyzed expression of HPRT to determine whether the protein is suitable as a normalized control for cancer-related studies. Because HPRT has been used extensively as an endogenous control in many studies, it is important to provide a clear understanding of how it’s expression changes in a cancerous setting.23–29 Here we have shown that HPRT is not a suitable control for cancer-related experiments as it exhibits expression variability at both protein and transcriptional levels. When comparing normal samples to malignant samples, HPRT showed variation that is not consistent with a good normalization control. Additionally, the levels of HPRT also varied across different organ tissues in malignant samples and, to a lesser extent, normal samples.
HPRT has been used as the sole housekeeping standard for several studies involving cancer.30,31 As there is a significant increase in HPRT expression in most tissue types upon developing malignancy, the increased target gene expression observed in several studies may be more significant than originally detected, as some increases in gene expression may be masked by the concomitant increase in malignant HPRT expression. This inherent elevation of HPRT may also conceal genes with increased expression that would have otherwise been significant if a different endogenous control was chosen for the analysis. With this in mind, we would recommend researchers utilizing HPRT as a single standard re-evaluate their data to determine if a different control would result in more accurate results. In addition, we propose the discontinued use of HPRT as a standard control as the variability seen within malignant patients renders it unsuitable for normalization.
When comparing 10 different common endogenous controls, we found that their relative expression between malignant and normal tissue was dependent on the tissue type. TBP showed insignificant differences between malignant and normal cells in lung adenocarcinoma but exhibited significant differences in lung squamous cell carcinoma. Some genes also had inverted expression depending on the tissue type. PGK1 had elevated levels in normal prostate, but also had elevated levels in colon adenocarcinoma. These results indicate that it may be in the best interest of the researcher to select the endogenous control genes based upon previously determined expression levels and change the selected control gene according to the experimental conditions and tissue used. For example, in a study utilizing lung adenocarcinoma as the primary test material, it would be in the best interest of the researcher to use ACTB or TBP as a normalization control, as these genes show insignificant differences between normal and malignant samples.
Previous work has already shown that HPRT is an unsuitable endogenous control in some experimental systems, such as embryonic stem cells,19 and has pseudogenes that affect gene normalization in qPCR.32 Considering this previous data and the results obtained in our evaluation, HPRT appears to be unsuitable as an endogenous control for cancer-related studies.
Conclusions
As a protein with significant elevation and variation in malignant samples, HPRT should no longer be used as an endogenous standard for assays involving gene normalization.
Materials and methods
Chemicals/reagents
We used Anti-HPRT rabbit polyclonal antibody (ab10479) for Western blot analysis; these were purchased from Abcam (Cambridge, United Kingdom) and stored at 4°C. Western bright western blotting detection kit was purchased from Advansta (Menlo Park, CA, USA) and stored at room temperature. DIVA Decloaker 10x, Background Sniper, Mach 4 HRP polymer, DAB Peroxidase, Hematoxylin, Hydrophobic pen, and Universal Negative antibodies were all obtained from Biocare Medical, Concord, CA. GAPDH polyclonal antibody (One World Labs, San Diego CA) was aliquoted and stored at −20°C. Tween20 (Fisher Reagents, Waltham MA) was stored at room temperature. Hydrogen Peroxide, 30% (Fisher Reagents, Waltham MA) was stored at 4°C.
Lysate preparation
Raji, HT-29, Jurkat, U937, PC3, DU145, NCI-H460, SW620, MCF-7, MDA-MB-231, and A549 human cell lines were obtained from the American Type Culture Collection (Rockville, MD, USA). Raji, HT-29, Jurkat, U937, PC3, DU145 and NCI-H460 cells were grown in RPMI 1640 medium supplemented with 10% fetal bovine serum (FBS) and 2mM L-Glutamine. SW620, MCF-7, and MDA-MB-231 cells were grown in DMEM medium supplemented with 10% FBS and 4mM L-Glutamine (Gibco, MD, USA). A549 cells were grown in F-12K medium supplemented with 10% FBS and 2mM L-Glutamine. Cell media was replaced every 48 hours to maintain exponential conditions. Cell viability was evaluated using trypan blue staining. All cells were grown at 37°C and 5% CO2. Cell lines were authenticated in May of 2016 by the University of Arizona Genetics Core.
Whole blood was collected in heparinized tubes from healthy volunteers under IRB approval (BYU X090281) with written informed consent. Blood was diluted with PBS at a 1:1 ratio and layered on Lymphocyte Separation Medium (LSM) (Corning Incorporated, Corning, NY, USA) before being centrifuged for 30 minutes at 400xg. The buffy layer was collected and treated with a red blood cell lysis buffer (Biolegend, San Diego, California) before used for experimentation.
Once confluent, cells were treated with accutase and washed with cold PBS twice and then added to a RIPA buffer solution with freshly added protease and phosphatase inhibitor (Thermo Fisher Scientific, MA, USA). Cells were then thoroughly vortexed and incubated on ice for 30 minutes with an additional vortex step performed every 10 minutes. The lysed solution was then pelleted at 15,000xg for 15 minutes at 4°C and aliquoted to avoid freeze-thawing samples. All lysates were stored at −80°C.
Immunohistochemistry
Tissue microarrays were purchased from Biomax. Patient details and information are found in Table 1 and include lung, prostate, colon, breast, and pancreatic cancer patients and corresponding normal samples.
HPRT levels were assessed using standard immunohistochemistry staining. Following treatment with Histoclear (National Diagnostics, Charlotte, North Carolina), tissues were rehydrated with a series of ethanol washes. To retrieve antigen, tissues were treated with a DIVA Decloaker heated to 80°C for 30 minutes. Tissues were washed with a hydrogen peroxide solution followed by a Tris Buffered Saline-Tween20 (TBST) wash. Following washing, tissues were incubated with a blocking Background Sniper solution to reduce non-specific antibody binding. Following blocking, primary antibody was added at a 1:100 dilution and incubated overnight at 4°C. Tissues were washed and treated with a Mach 4 universal HRP polymer (Biocare Medical, Pacheco, California) and incubated for an hour. DAB peroxidase was added to the tissues along with hematoxylin to highlight target protein and the cell nuclei, respectively. A intelliPATH FLX universal negative control was used as the negative control for background binding, and GAPDH was used as a positive control to ensure protocol functionality.
Tissue quantification
Quantification of tissues was carried out using ImageJ software. An IHC toolbox ImageJ plugin with the DAB more option was chosen and tissues were removed of all non-DAB stain. Following this modification, the image was converted to a grayscale and a threshold was applied to eliminate areas of negative space. This same threshold was applied to all tissue samples to ensure consistency and reduce sample bias.
Western blot and quantification
Cell lysates were blotted for GAPDH, B2M, EEF2, and HPRT expression utilizing standard Western Blotting techniques described in Sewda et al., with minor modifications.22 Briefly, each sample was boiled for 5 minutes prior to running on a 12% polyacrylamide gel under reducing conditions. Gels were then transferred to a nitrocellulose membrane (Biorad Laboratories Hercules, CA, USA), blocked, and treated with primary antibody (1:1000 dilution) overnight at 4°C on a shaker. Following primary antibody treatment, membranes were washed and treated with secondary HRP antibodies (1:20,000 dilution) (Abcam, Cambridge, United Kingdom) for 1 hour at room temperature. Membranes were then washed and treated with a Western Bright (Advansta, California, USA) HRP substrate before capturing the image with X-ray film. Western images were scanned and images were imported into ImageJ and converted to an 8-bit image. Lanes were then selected and plotted. The area under the individual bands were calculated to determine the relative protein expression of the samples. The quantity of westerns required that the gels be run separately due to space; as such the images were excised from the triplicate sample and represented in Figure 3. All westerns were standardized to GAPDH to ensure that the resulting changes in experimental protein values were comparable.
Transcriptomic analysis
We evaluated expression levels for 90 cell lines from the Cancer Cell Line Encyclopedia using data that had been generated using Illumina-based RNA-Sequencing.33,34 The data values were originally calculated at the isoform level using the kallisto software;35 we calculated gene-level values by summing the isoform values for each gene. Next we log-transformed these values and converted them to transcripts-per-million values. We sorted the cell lines according to HPRT1 expression level, from high to low expression per sample.
We obtained gene-level expression values for tumors and normal tissues from The Cancer Genome Atlas.36 The Illumina-based, RNA-Sequencing data had been prepared previously using the featureCounts algorithm and the Rsubread package.37–39 In cases where RNA expression had been profiled for the same patient multiple times, we averaged expression on a per-gene basis across the replicates. Next, we log-transformed the data and normalized the data to transcripts-per-million values. The normal data came from tissue of the same organ type or from blood samples; however, these samples did not necessarily come from the same patients as the tumor samples.
We preprocessed the RNA expression data using scripts written in the Python programming language (https://python.org, v.3.6.1). To make graphs for this analysis, we used the ggplot2 package (v.2.2.1) and the Superheat package (v.0.1.0) implemented for the R (v.3.4.3) statistical software.40–42
Statistical analysis
ANOVA using the multiple comparison method was used to determine significance differences between patient tissue samples in immunohistochemistry staining and western blotting data. These statistical analyses were evaluated using GraphPad Prism 7 software.
In calculating differences in transcriptome between tumor and normal samples, we used a permutation-based test. For a given gene, we repeatedly (n = 10,000) permuted the tumor/normal labels and calculated the difference in mean expression; then we compared the actual difference in expression for a given gene against its respective permuted distribution; lastly, we calculated an empirical p-value by determining the proportion of times that the actual difference was greater than the permuted differences. Differences were considered significant when the p value was < 0.05. These tests were performed using the R (v.3.4.3) statistical software. When evaluating p-values the following legend was used: *; p < 0.05, **; p < 0.01, ***; p < 0.0001, ****; p < 0.00001.
Acknowledgments
The authors would like to thank the Simmons Center for Cancer research for providing funding to support this work. Results from this study are in part based upon data generated by The Cancer Genome Atlas and managed by the United States National Cancer Institute and National Human Genome Research Institute (see http://cancergenome.nih.gov)
Disclosure of Potential Conflicts of Interest
The authors declare that they have no competing interests.
Ethics approval and consent to aprticipate
All procedures performed in studies involving human participants were in accordance with the ethical standards of the institutional and/or national research committee and with the 1964 Helsinki declaration and its later amendments or comparable ethical standards.
Supplementary material
Supplemental data for this article can be accessed on the publisher’s website.
References
- 1.Goodchild J. Review of their synthesis and properties. Bioconjug Chem. 1990;I:1–23 https://pubs.acs.org/doi/pdf/10.1021/bc00003a001. [DOI] [PubMed] [Google Scholar]
- 2.Fridman A, Saha A, Chan A, Casteel DE, Pilz RB, Boss GR.. Cell cycle regulation of purine synthesis by phosphoribosyl pyrophosphate and inorganic phosphate. Biochem J. 2013;454:91–99. doi: 10.1042/BJ20130046. [DOI] [PubMed] [Google Scholar]
- 3.Rajagopal L, Vo A, Silvestroni A, Rubens CE. Regulation of purine biosynthesis by a eukaryotic-type kinase in streptococcus agalactiae. Mol Microbiol. 2005;56:1329–1346. doi: 10.1111/j.1365-2958.2005.04620.x. [DOI] [PMC free article] [PubMed] [Google Scholar]
- 4.Becerra A, Lazcano A. The role of gene duplication in the evolution of 1998. Orig Life Evol Biosphere. 1998;28(4-6):539–553. [DOI] [PubMed] [Google Scholar]
- 5.Caskey CT, Kruh GD. The HPRT Locus review. Cell. 1979;l:1–9. doi: 10.1016/0092-8674(79)90182-X. [DOI] [PubMed] [Google Scholar]
- 6.Stout JT, Caskey CT. Hprt: gene structure, expression, and mutation. Annu Rev Genet. 1985. doi: 10.1146/annurev.ge.19.120185.001015. [DOI] [PubMed] [Google Scholar]
- 7.Wilson JM, Tarrt GE, Kelley WN. Human hypoxanthine (guanine) phosphoribosyltransferase : an amino acid substitution in a mutant form of the enzyme isolated from a patient with gout. Proc Natl Acad Sci. 1983;80:870–873. doi: 10.1073/pnas.80.3.870. [DOI] [PMC free article] [PubMed] [Google Scholar]
- 8.Melton DW, Mcewan C, Reid AM, Mckie B. Expression of the mouse HPRT Gene : deletional analysis of the promoter region of an X-chromosome linked housekeeping gene. Cell. 1986;44:319–328. doi: 10.1016/0092-8674(86)90766-X. [DOI] [PubMed] [Google Scholar]
- 9.Zoref-Shani E, Frishberg Y, Bromberg Y. Kelley-seegmiller syndrome due to a unique variant of hypoxanthine-guanine phosphoribosyltransferase : reduced a ¤ nity for 5-phosphoribosyl-1-pyrophosphate manifested only at low, physiological substrate concentrations. Biochimica Et Biophysica Acta (Bba) - Mol Basis Dis. 2000;1500:197–203. doi: 10.1016/S0925-4439(99)00103-9. [DOI] [PubMed] [Google Scholar]
- 10.Caskey CT. In vitro translation of hypoxanthine/guamne phosphoribosyltrans- ferase mRNA : characterization of a mouse neuroblastoma cell line that has elevated levels of hypoxanthine/guanine phosphoribosyltransferase protein. PNAS. 1981;78:6977–6980. [DOI] [PMC free article] [PubMed] [Google Scholar]
- 11.Boonstra R, Timmer-Bosscha H, van Echten-Arends J, van der Kolk DM, van Den Berg A, de Jong B, Tew KD, Poppema S, de Vries EGE. Mitoxantrone resistance in a small cell lung cancer cell line is associated with ABCA2 upregulation. Br J Cancer. 2004;90:2411–2417. doi: 10.1038/sj.bjc.6601863. [DOI] [PMC free article] [PubMed] [Google Scholar]
- 12.Lukasiak S, Schiller C, Oehlschlaeger P, Schmidtke G, Krause P, Legler DF, Autschbach F, Schirmacher P, Breuhahn K, Groettrup M. Proinflammatory cytokines cause FAT10 upregulation in cancers of liver and colon. Oncogene. 2008;27:6068–6074. doi: 10.1038/onc.2008.201. [DOI] [PubMed] [Google Scholar]
- 13.Morimoto-Tomita M, Uchimura K, Bistrup A, Lum DH, Egeblad M, Boudreau N, Werb Z, Rosen SD. Sulf-2, a proangiogenic heparan sulfate endosulfatase, is upregulated in breast cancer. Neoplasia. 2005;7:1001–1010. doi: 10.1593/neo.05496. [DOI] [PMC free article] [PubMed] [Google Scholar]
- 14.Hillion J, Wood LJ, Mukherjee M, Bhattacharya R, Di Cello F, Kowalski J, Elbahloul O, Segal J, Poirier J, Rudin CM, et al. Upregulation of MMP-2 by HMGA1 promotes transformation in undifferentiated, large-cell lung cancer. Mol Cancer Res. 2009;7:1803–1812. doi: 10.1158/1541-7786.MCR-08-0336. [DOI] [PMC free article] [PubMed] [Google Scholar]
- 15.Carver BS, Tran J, Gopalan A, Chen Z, Shaikh S, Carracedo A, Alimonti A, Nardella C, Varmeh S, Scardino PT, et al. Aberrant ERG expression cooperates with loss of PTEN to promote cancer progression in the prostate. Nat Genet. 2009;41:619–624. doi: 10.1038/ng.370. [DOI] [PMC free article] [PubMed] [Google Scholar]
- 16.Reijm EA, Jansen MPHM, Ruigrok-Ritstier K, Van Staveren IL, Look MP, Van Gelder MEM, Sieuwerts AM, Sleijfer S, Foekens JA, Berns EMJJ. Decreased expression of EZH2 is associated with upregulation of ER and favorable outcome to tamoxifen in advanced breast cancer. Breast Cancer Res Treat. 2011;125:387–394. doi: 10.1007/s10549-010-0836-9. [DOI] [PubMed] [Google Scholar]
- 17.de Kok JB, Roelofs RW, Giesendorf BA, Pennings JL, Waas ET, Feuth T, Sandberg G, Gong M. Normalization of gene expression measurements in tumor tissues: comparison of 13 endogenous control genes. Lab Invest. 2005;85:154–159. doi: 10.1038/labinvest.3700337. [DOI] [PubMed] [Google Scholar]
- 18.Liu DW, Chen ST, Liu HP. Choice of endogenous control for gene expression in nonsmall cell lung cancer. Eur Respir J Off J Eur Soc Clin Respir Physiol. 2005;26:1002–1008. [DOI] [PubMed] [Google Scholar]
- 19.Murphy CL, Polak JM. Differentiating embryonic stem cells: GAPDH, but neither HPRT nor beta-tubulin is suitable as an internal standard for measuring RNA levels. Tissue Eng. 2002;8:551–559. doi: 10.1089/107632702760240472. [DOI] [PubMed] [Google Scholar]
- 20.Homey B, Soto H, Ge N, Catron D, Buchanan ME, Mcclanahan T, McClanahan T, Murphy E, Yuan W, Wagner SN, et al. Involvement of chemokine receptors in breast cancer metastasis. Nature. 2001;410:50–56. doi: 10.1038/35065016. [DOI] [PubMed] [Google Scholar]
- 21.Townsend MH, Anderson MD, Weagel EG, Velazquez EJ, Weber KS, Robison RA, O’Neill K. Non-small-cell lung cancer cell lines A549 and NCI-H460 express hypoxanthine guanine phosphoribosyltransferase on the plasma membrane. Onco Targets Ther. 2017;10:1921–1932. doi: 10.2147/OTT.S128416. [DOI] [PMC free article] [PubMed] [Google Scholar]
- 22.Townsend MH, Felsted AM, Ence ZE, Piccolo SR, Robison RA, O’Neill KL. Elevated expression of hypoxanthine guanine phosphoribosyltransferase within malignant tissue. Cancer Clin Oncol. 2017;6:19. doi: 10.5539/cco.v6n2p19. [DOI] [Google Scholar]
- 23.Stathopoulou A, Ntoulia M, Perraki M, Apostolaki S, Mavroudis D, Malamos N, Georgoulias V, Lianidou ES. A highly specific real-time RT-PCR method for the quantitative determination of CK-19 mRNA positive cells in peripheral blood of patients with operable breast cancer. Int J Cancer. 2006;119:1654–1659. doi: 10.1002/ijc.22017. [DOI] [PubMed] [Google Scholar]
- 24.Dolezalova H, Shankar G, Huang MC, Bikle DD, Goetzl EJ. Biochemical regulation of breast cancer cell expression of S1P2 (Edg-5) and S1P3 (Edg-3) G protein-coupled receptors for sphingosine 1-phosphate. J Cell Biochem. 2003;88:732–743. doi: 10.1002/jcb.10394. [DOI] [PubMed] [Google Scholar]
- 25.Maas S, Warskulat U, Steinhoff C, Mueller W, Grimm MO, Schulz WA, Seifert -H-H. Decreased fas expression in advanced-stage bladder cancer is not related to p53 status. Urology. 2004;63:392–397. doi: 10.1016/j.urology.2003.08.023. [DOI] [PubMed] [Google Scholar]
- 26.Bachmeier B, Fichtner I, Killian PH, Kronski E, Pfeffer U, Efferth T. Development of resistance towards artesunate in MDA-MB-231 human breast cancer cells. PLoS One. 2011;6:1–14. doi: 10.1371/journal.pone.0020550. [DOI] [PMC free article] [PubMed] [Google Scholar]
- 27.Abal M, Bras-Goncalves R, Judde J-G, Fsihi H, de Cremoux P, Louvard D, Lam EW-F, Bevan CL. Enhanced sensitivity to irinotecan by Cdk1 inhibition in the p53-deficient HT29 human colon cancer cell line. Oncogene. 2004;23:1737–1744. doi: 10.1038/sj.onc.1207444. [DOI] [PubMed] [Google Scholar]
- 28.Fiorentino DF, Zlotnik A, Mosmann TR, Howard M, Garra O, Florentino DF. IL-10 inhibits cytokine production by activated macrophages. J Immunol. 1991;147(11):3815–22. [PubMed]
- 29.Carver BS, Chapinski C, Wongvipat J, Hieronymus H, Chen Y, Chandarlapaty S, Arora V, Le C, Koutcher J, Scher H, et al. Reciprocal feedback regulation of PI3K and androgen receptor signaling in PTEN-deficient prostate cancer. Cancer Cell. 2011;19:575–586. doi: 10.1016/j.ccr.2011.04.008. [DOI] [PMC free article] [PubMed] [Google Scholar]
- 30.Saatli B, Kizildag S, Cagliyan E, Dogan E, Saygili U. Alteration of apoptosis-related genes in postmenopausal women with uterine prolapse. Int Urogynecol J Pelvic Floor Dysfunct. 2014;25:971–977. doi: 10.1007/s00192-014-2347-4. [DOI] [PubMed] [Google Scholar]
- 31.Ahmed EM, Bandopadhyay G, Coyle B, Grabowska A. A HIF-independent, CD133-mediated mechanism of cisplatin resistance in glioblastoma cells. Cell Oncol. 2018. doi: 10.1007/s13402-018-0374-8. [DOI] [PMC free article] [PubMed] [Google Scholar]
- 32.Sellner LN, Turbett GR. The presence of a pseudogene may affect the use of HPRT as an endogenous mRNA control in RT-PCR. Mol Cell Probes. 1996;10:481–483. doi: 10.1006/mcpr.1996.0060. [DOI] [PubMed] [Google Scholar]
- 33.Tatlow P, Piccolo SR. A cloud-based workflow to quantify transcript-expression levels in public cancer compendia. Sci Rep. 2016;6:39259. doi: 10.1038/srep39259. [DOI] [PMC free article] [PubMed] [Google Scholar]
- 34.Barretina J, Caponigro G, Stransky N, Venkatesan K, Margolin AA, Kim S, Dugan S, Ding Y, Buhay CJ, Kremitzki C, et al. The cancer cell line encyclopedia enables predictive modelling of anticancer drug sensitivity. Nature. 2012;483:603–607. doi: 10.1038/nature10843. [DOI] [PMC free article] [PubMed] [Google Scholar]
- 35.Bray NL, Pimentel H, Melsted P, Pachter L. Near-optimal probabilistic RNA-seq quantification. Nat Biotechnol. 2016;34:525–527. doi: 10.1038/nbt.3519. [DOI] [PubMed] [Google Scholar]
- 36.McLendon R, Friedman A, Bigner D, Van Meir EG, Brat DJ, Mastrogianakis GM. Comprehensive genomic characterization defines human glioblastoma genes and core pathways. Nature. 2008;455:1061–1068. doi: 10.1038/nature07270. [DOI] [PMC free article] [PubMed] [Google Scholar]
- 37.Rahman M, Jackson LK, Johnson WE, Li DY, Bild AH, Piccolo SR. Alternative preprocessing of RNA-sequencing data in the cancer genome atlas leads to improved analysis results. Bioinformatics. 2015;31:3666–3672. doi: 10.1093/bioinformatics/btv377. [DOI] [PMC free article] [PubMed] [Google Scholar]
- 38.Liao Y, Smyth GK, Shi W. The subread aligner: fast, accurate and scalable read mapping by seed-and-vote. Nucleic Acids Res. 2013:41. doi: 10.1093/nar/gkt214. [DOI] [PMC free article] [PubMed] [Google Scholar]
- 39.Liao Y, Smyth GK, Shi W. FeatureCounts: an efficient general purpose program for assigning sequence reads to genomic features. Bioinformatics. 2014;30:923–930. doi: 10.1093/bioinformatics/btt656. [DOI] [PubMed] [Google Scholar]
- 40.Barter RL, Yu B. Superheat: an R package for creating beautiful and extendable heatmaps for visualizing complex data. J Comput Graph Statist. 2018;27(4). doi: 10.1111/mec.12230. [DOI] [PMC free article] [PubMed] [Google Scholar]
- 41.Wickham H. Ggplot2 : elegant graphics for data analysis. Springer; 2009. [Google Scholar]
- 42.R: The R Foundation [accessed 2018. February 15]. https://www.r-project.org/foundation/.
Associated Data
This section collects any data citations, data availability statements, or supplementary materials included in this article.


