Abstract
Adenylyl cyclase (AC) isoform 6 (AC6) is highly expressed throughout the renal tubule and collecting duct (CD), catalyzes the synthesis of cAMP and contributes to various aspects of renal transport. Several proteins involved in acid–base homeostasis are regulated by cAMP. In the present study, we assess the relative contribution of AC6 to overall acid–base regulation using mice with global deletion of AC6 (AC6−/−) or newly generated mice lacking AC6 in the renal tubule and CD (AC6loxloxPax8Cre). Higher energy expenditure in AC6−/− relative to wild-type (WT) mice, was associated with lower urinary pH, mild alkalosis in conjunction with elevated blood HCO3− concentrations, and significantly higher renal abundance of the H+-ATPase B1 subunit. In contrast with WT mice, AC6−/− mice have a less pronounced increase in urinary pH after 8 days of HCO3− challenge, which is associated with increased blood pH and HCO3− concentrations. Immunohistochemistry demonstrated that AC6 was expressed in intercalated cells (IC), but subcellular distribution of the H+-ATPase B1 subunit, pendrin, and the anion exchangers 1 and 2 in AC6−/− mice was normal. In the AC6−/− mice, H+-ATPase B1 subunit levels after HCO3− challenge were greater, which correlated with a higher number of type A IC. In contrast with the AC6−/− mice, AC6loxloxPax8Cre mice had normal urinary pH under baseline conditions but higher blood HCO3− than controls after HCO3− challenge. In conclusion, AC6 is required for maintaining normal acid–base homeostasis and energy expenditure. Under baseline conditions, renal AC6 is redundant for acid–base balance but becomes important under alkaline conditions.
Introduction
Maintaining acid–base homeostasis is critical for normal physiology and various segments of the renal tubule and collecting duct (CD) contribute to this process by modulating urinary HCO3− reabsorption and H+ excretion [1]. H+ ions are mainly excreted by titrating filtered buffers (such as HPO42−) and by secretion of NH3 generated by the proximal tubule. Reabsorption of HCO3− in the proximal tubule occurs via coupled H+ secretion via the luminal Na+-H+ exchanger isoform 3 (NHE3) and the H+-ATPase and basolateral HCO3− extrusion through the renal electrogenic Na+-HCO3− cotransporter NBCe1-A (hereafter referred to as NBC1) [2]. However, the relative contribution of NHE3 in this process has been recently questioned due to a lack of acid–base disturbances in kidney-specific NHE3 knockout mice [3]. Humans with mutations in NBC1 display type 2 renal tubular acidosis (RTA), highlighting the importance of this transporter for basolateral HCO3− extrusion [4].
In the thick ascending limb (TAL), ~15% of HCO3− reabsorption is coupled with NHE3 activity [5], whereas only a minor fraction of filtered HCO3− is reabsorbed in the distal part of the nephron (distal convoluted tubule (DCT), connecting tubule (CNT), and CD). However, these latter segments still play an important role in fine-tuning urinary pH via regulated H+ secretion and HCO3− reabsorption in both intercalated cells (IC) and principal cells (PC) [1,2]. In mice, the three subtypes of ICs (type A, type B, and non-A-non-B) display various expression patterns of the H+-ATPase B1 subunit, pendrin, and the anion exchanger 1 (AE1) [6]. The H+-ATPase B1 subunit is expressed in all subtypes of ICs, and mice lacking the H+-ATPase B1 subunit have relatively alkaline urine [7]. Pendrin is found in the apical membrane of type B and non-A-non-B ICs where it secretes HCO3− into the lumen in exchange for Cl−. Pendrin knockout mice have reduced urinary pH and metabolic alkalosis [8]. AE1 is normally found in the basolateral membrane of type A ICs where it is responsible for the reabsorption of HCO3−. Specific human mutations in either the H+-ATPase B1 subunit or AE1 are associated with type 1 RTA [9]. Anion exchanger 2 (AE2) is expressed weakly in the cortical CD; however, strong and uniform labeling is found in the inner medullary CD (IMCD) where it is localized to the basolateral membrane of PCs [10,11]. The kidney also expresses the gastric or HKα1 isoform [12] and the colonic or HKα2 isoform [13] of the H+-K+-ATPase. HKα1 is mainly expressed in type A and B ICs [14], whereas HKα2 expression is found from the TAL to the IMCD [15]. In the CD, HKα2 is localized to both type A and B ICs [16].
Several of the described acid–base proteins are modulated by cAMP. For example, the subcellular localization of NHE3, NBC1, and the H+-ATPase B1 subunit are all modulated by cAMP [17–19] and cAMP increases the abundance of pendrin [20]. The regulation of HKα1 and HKα2 by cAMP is incompletely understood, with some data showing an effect of cAMP on HK trafficking [21,22] whereas other studies suggest that cAMP regulates enzyme activity [23]. Whether cAMP regulates AE1 is unclear, but a potential role of cAMP to modulate AE2 activity in the colon has been reported [24]. cAMP formation is catalyzed by adenylyl cyclases (AC), of which nine membrane-bound isoforms (AC1–AC9) and one soluble AC isoform have been described [25]. One of these isoforms, AC isoform 6 (AC6), is highly expressed along the renal tubule system and CD [25,26]. Mice lacking AC6 in the whole body (AC6−/−) have impaired renal cAMP formation, altered aquaporin-2 (AQP2) function, and suffer from nephrogenic diabetes insipidus (NDI) [26]. A similar NDI phenotype is observed in mice lacking AC6 only in CD PC [27,28], alongside altered epithelial Na+ channel (ENaC) activity [29]. A role for AC6 in modulating the functions of the Na+-K+−2Cl− cotransporter and the Na+-Cl− cotransporter were also uncovered using AC6−/− mice [30], in addition to a role of AC6 in body phosphate homeostasis [31].
Based on its known diverse role in renal function, we speculated that AC6 also plays a crucial role in acid–base regulation. We assessed this in the present study by examining the acid–base-related phenotype of AC6−/− mice under baseline conditions or when mice are challenged by HCO3−. We also generated mice lacking AC6 only in the renal tubule and CD (AC6loxloxPax8Cre) to isolate a kidney-specific role of AC6 in acid–base balance. Our results show that AC6−/− mice have a more acidic urinary pH associated with increased IC numbers and higher abundance of the H+-ATPase B1 subunit; implicating AC6 in acid–base regulation. AC6loxloxPax8Cre mice show an acid–base phenotype during HCO3− challenge but not under baseline conditions, suggesting an extrarenal role of AC6, possibly related to increased energy expenditure, contributes to overall acid–base homeostasis.
Materials and methods
Animals and ethics
All animal experimentation was conducted in accordance with the Guide for Care and Use of Laboratory Animals (National Institutes of Health, Bethesda, MD) and was approved by the University of South Florida Institutional Animal Care and Use Committee. Wild-type (WT) and AC6−/− mice were reproduced by heterozygote breeding and were on a C57BL/6 background [26,31]. A novel conditional mouse model with AC6 constitutively deleted in the renal tubule and CD (termed as AC6loxloxPax8Cre) was generated by crossing transgenic mice in which exons 3–12 of the Adcy6 gene were flanked by loxP sites [28] (termed as AC6loxlox) with mice-expressing Cre recombinase under the regulatory element of the Pax8 gene [32]. All primer sequences have been published previously [27,33]. Mice were housed under a 12:12-h light–dark cycle in standard, isolated, and ventilated cages with free access to standard rodent diet (Harlan Teklad 2018, Madison, WI) and tap water. Experiments were performed on 3–6 months old male mice. Renal expression of AC6 was determined in mice where enhanced green fluorescent protein (EGFP) is expressed in AC6-containing cells [34]. These mice are termed as AC6−/−EGFP.
Food and fluid intake, blood, urine, and tissue collection/analysis
Food and fluid intake was determined while the mice were housed in isolated ventilated cages. Urine was obtained by reflex urination and collected in a Petri dish. Blood was collected from the retrobulbar plexus under brief isoflurane anesthesia and blood chemistry was determined by an OPTI® CCA blood gas analyzer using an E-type cassette (OPTIMedical, Roswell, GA). Urinary and stomach pH (the latter after euthanasia) were measured using a calibrated pH electrode (9810BN, Thermo Fisher Scientific, Middletown, VA) inserted via a small incision into the stomach. Urinary ammonia and creatinine were measured using commercially available assays (A7553, Pointe Scientific, Inc., Canton, MI and Infinity™ Creatinine, Thermo Fisher Scientific).
HCO3−/NH4Cl challenge experiments
Baseline collections of urine and blood were performed on WT and AC6−/− mice as well as in AC6loxlox and AC6loxloxPax8Cre mice maintained on a standard rodent diet. Subsequently, mice were challenged with HCO3− (NaHCO3), supplied via drinking water, for a period of 8 days according to the established protocols [35,36]. As daily fluid intake is doubled in the AC6−/− mice [26], NaHCO3 was reduced by 50% in this genotype (0.14 M in AC6−/− compared with 0.28 M in WT). Fluid intake was determined daily, and urine collected. On day 8, an additional blood sampling was performed. In another cohort of AC6loxlox and AC6loxloxPax8Cre mice, an NH4Cl challenge was performed (0.14 M in AC6loxloxPax8Cre compared with 0.28 M in AC6loxlox in 0.25 and 0.5% glucose solution, respectively) [37]. For tissue collection, mice were anesthetized with ketamine/xylazine (100 and 10 mg/kg, respectively) and the left kidney was immediately removed for immunoblotting, and the right kidney perfused via the left cardiac ventricle at a pressure of ~120 mmHg with PBS (pH 7.4, Mediatech, Manassas, VA) followed by 4% paraformaldehyde in PBS (Affymetrix, Santa Clara, CA) and processed for kidney sectioning as described previously [3,31,38]. For mRNA analysis, lung tissue RNA from WT and AC6−/− mice were isolated following PBS perfusion of the lungs via the right ventricle. RNA from the proximal and distal small intestine was isolated after scraping the mucosa from the muscle layer. RNA extraction and real-time quantitative PCR to determine mRNA expression of various transporter and channels was performed as described previously [39] (primer sequences provided on request).
Metabolic balance studies
Mice were analyzed for whole body energy expenditure, O2 consumption, CO2 production, activity, food, and water intake as well as energy expenditure using calorimetric cages (Phenomaster, TSE Systems, Chesterfield, MO, U.S.A.) as previously described [40]. All mice were acclimatized to the metabolic cages for 48 h and individually housed with lights on from 6 a.m. to 6 p.m. at an ambient temperature of 22 ± 1°C
Immunoblot analysis
Renal tissue preparation and immunoblotting was performed on 17000 g membrane fractions prepared from 4000 g supernatants of whole kidney lysates as previously described [3,27,31,41]. Antibodies used were: AC5/6 (sc-590, Santa Cruz Biotechnology, Dallas, TX; dilution 1:800), total H+-ATPase B1 subunit [42] (H7659; dilution 1:1000), pendrin [43] (RA3466/2671; dilution 1:750), NHE3 (Millipore, Billerica, MA; dilution 1:1000) or NHE3 [44] (L546; dilution 1:1000), pS552-NHE3 (Novus Biologicals, Littleton, CO; dilution 1:2000), NBC1 [45] (dilution 1:1000), non-gastric H+-K+-ATPase M79 [46] (dilution 1:10000), AE2a,b [47] (Rb9899/1; dilution 1:500). Coomassie-stained gels were used to adjust for equal protein loading for immunoblotting, with maximal deviations in total protein loading between samples on individual blots +/−10%. Blots of β-actin are presented but were not used to correct protein loading on each individual gel. Sites of antibody reactivity were detected using enhanced chemiluminescence and signal intensity in specific bands was quantitated using Image Studio Lite (Qiagen, Hilden, Germany) densitometry analysis.
Immunohistochemistry
The kidneys were dehydrated in ethanol, incubated in xylene, embedded in paraffin, sectioned at 2 μm, and immunolabeled as described previously [38]. For light microscopy, sections were immunolabeled with primary antibodies against H+-ATPase B1 subunit [42] (H7659, dilution 1:1000), pendrin [43] (RA3466/2671, dilution 1:2400), and proliferating cell nuclear antigen (PCNA; P8825; Sigma–Aldrich; dilution 1:20000). Immunolabeling was visualized using horseradish peroxidase-conjugated goat anti-rabbit secondary antibody (p448, dilution 1:200; Dako, Glostrup, Denmark) and 3,3′ -diaminobenzidine (Kem-En-Tec Diagnostics A/S, Tåstrup Denmark). For immunofluorescent labeling, sections were stained with antibodies targetting pendrin (3466, dilution 1:100), H+-ATPase B1 subunit (H7659; antibody was biotinylated; dilution, 1:50), calbindin (D28K-10R-C106A; Fitzgerald Industries International, Concord, MA; dilution 1:20000), and EGFP (ab6673; Abcam, Cambridge, U.K.). Labeling was visualized using the fluorescence-conjugated secondary antibody probes (Thermo Fisher Scientific) Alexa Fluor® 488 strep-tavidin conjugate (dilution, 1:600), Alexa Fluor® 488 Donkey Antigoat (dilution, 1:1000), Alexa Fluor® 555 Don-key Antirabbit IgG antibody (dilution, 1:1000), and Alexa Fluor® 647 Donkey Antimouse IgG Antibody (dilution, 1:1000).
Microscopy and cell counting
Counting of H+-ATPase B1 subunit-positive cells in the cortex/outer strip outer medulla (OSOM) and inner strip outer medulla (ISOM), and of pendrin-positive cells in the cortex was performed on images of stained kidney slices taken with a Leica DMRE light microscope (5× objective; numerical aperture: 0.15) equipped with a digital camera (Leica, Wetzlar, Germany). Single images were collected and collated to generate a full image of one kidney slice. Using ImageJ (NIH, Bethesda, MD), the size of the region of interest was measured (mm2) and the number of cells positively stained were counted. Data were reported as number of cells/mm2 [48]. Imaging of immunofluorescent sections was performed using a Leica TCS SL confocal microscope with an HCX PL APO 63× oil objective lens (numerical aperture: 1.40).
Statistical analyses
Pairwise comparisons of data meeting the statistical assumptions of variance homogeneity were performed using Student’s two-sided t test, while data not meeting assumptions of variance homogeneity were either transformed [49] or analyzed using Satterthwaite’s two-sided unequal variance t test. Pairwise comparisons of more than two groups were performed using a two-way repeated measurements ANOVA, and if not meeting the assumptions of variance homogeneity, data were log- or square-root-transformed. Analyses were carried out using Stata 12.0 (StataCorp, College Station, TX) for Windows or SigmaPlot 12.0 (Systat Software, Inc., Chicago, IL) for Windows. Sample size is indicated in the text and graphs, all values are presented as mean ± S.E.M.
Results
AC6−/− mice have higher blood pH and lower urinary pH
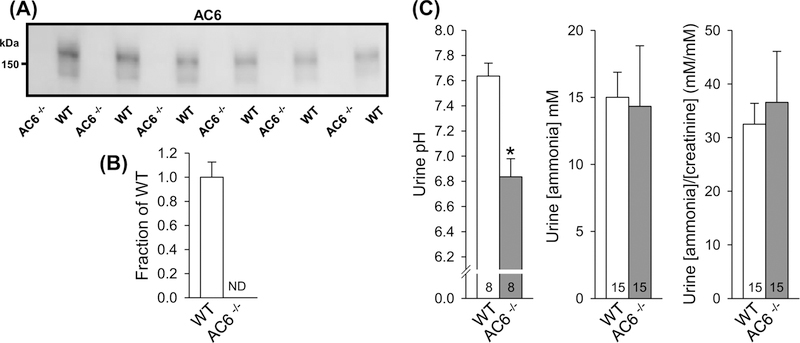
In WT mice, AC6 protein was detectable by immunoblotting as a broad smear centered at 150 kDa, which was absent from AC6−/− mice (Figure 1A,B). We previously demonstrated that AC6−/− mice are mildly alkalotic [30]. In the present study, we found that urinary pH was significantly lower in AC6−/− mice (Figure 1C), indicating that the alkalosis could be linked to altered renal acid–base handling. Further urine analyses revealed no differences in urine ammonia concentrations or ammonia/creatinine ratios (Figure 1C). Urinary creatinine was ∼30% lower in AC6−/− compared with WT mice (0.35 ± 0.04 compared with 0.48 ± 0.04 mmol/l; P<0.05), a finding consistent with our previous study showing higher water excretion in AC6−/− mice [26]. Analysis of WT and AC6−/− mice in PhenoMaster® metabolic cages identified that AC6−/− mice have a normal circadian rhythm; however, hourly water intake was significantly higher compared with WT mice (Supplementary Figure S1). No differences in food intake were observed.
Figure 1. AC6−/− mice present lower urinary pH.
(A) Semiquantitative immunoblotting of AC6 protein in 17000 g membrane fraction of whole kidney lysates from AC6−/− and WT mice under baseline conditions. In WT mice, AC6 protein was detected as a smear centered at 150 kDa. No signal was detectable in AC6−/− mice. (B) Summary data of immunoblot in (A) (n=6/genotype). (C) AC6−/− mice presented lower urinary pH but no difference in ammonia or ammonia/creatinine ratios. Urine pH measurements were performed on urine samples from a previously published animal cohort [26]. Values indicate mean ± S.E.M. Abbreviation: ND, not detectable. *P<0.05. Values on bars indicate sample size.
Indirect calorimetry assessed O2 consumption, CO2 production, and energy expenditure. Each of these parameters was significantly higher in AC6−/− compared with WT mice (Supplementary Figures S1 and S2), the latter consistent with an enhanced metabolic rate. All differences were present independent of the light–dark cycle. Lung mRNA expression of various transporters and channels did not show significant differences between WT and AC6−/− mice (Supplementary Figure S3). The proximal small intestine of AC6−/− mice had significantly higher expression of the Na+-H+ exchanger isoform 2 (NHE2), and tendencies for higher NHE3 and NBC1 expression. In contrast, no significant differences in transporter profiles were observed between genotypes in the distal small intestine (Supplementary Figure S3). Additionally, no differences in stomach pH between WT and AC6−/− mice were detectable (1.3 ± 0.1 compared with 1.6 ± 0.2, NS).
AC6−/− mice have greater abundance of the renal H+-ATPase B1 subunit under baseline conditions
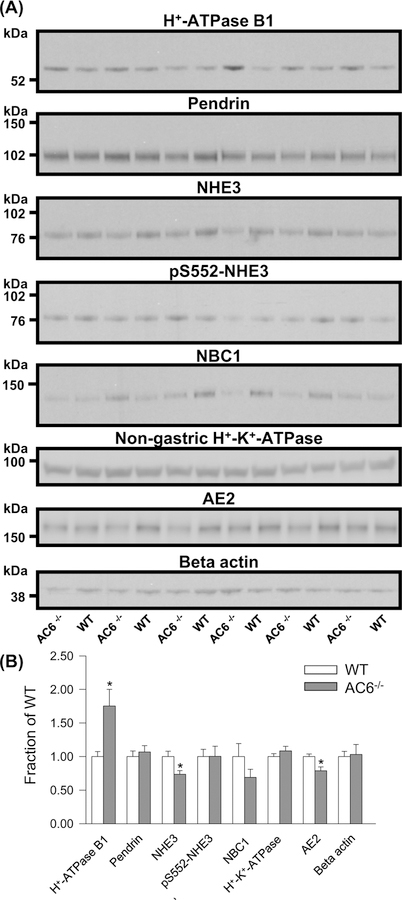
To investigate the molecular basis of the lower urinary pH in AC6−/− mice, the renal abundances of several proteins involved in acid–base homeostasis were profiled. Under baseline conditions, AC6−/− mice had a significantly higher level of the H+-ATPase B1 subunit and significantly lower abundances of NHE3 and AE2 compared with WT mice (Figure 2A,B). No significant differences were found in the abundances of pendrin, pS552-NHE3, NBC1, and non-gastric H+-K+-ATPase (Figure 2A,B).
Figure 2. AC6−/− mice present higher H+-ATPase B1 subunit abundance during standard condition.
(A) Semiquantitative immunoblotting of 17000 g membrane fraction of whole kidney lysates from WT and AC6−/− mice (baseline conditions) using antibodies targetting various proteins involved in acid–base regulation. (B) Summary data demonstrate higher abundance of the H+-ATPase B1 subunit and lower abundances of NHE3 and AE2. Values indicate mean ± S.E.M.; n=6/genotype, *P<0.05.
AC6−/− mice have higher blood pH and blood HCO3− during chronic HCO3− challenge
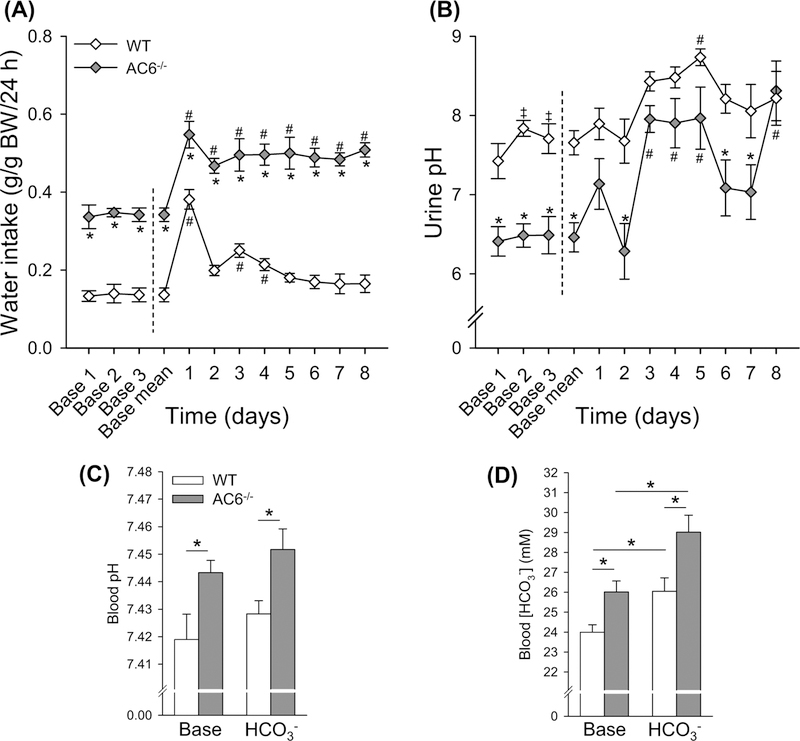
Since AC6−/− mice had lower urinary pH and higher blood pH under baseline conditions, we hypothesized that AC6−/− mice may have a problem when forced to alkalinize their urine. To test this, we challenged mice with HCO3− in their drinking water. Baseline fluid intake and urinary pH were significantly higher and lower, respectively, in AC6−/− compared with WT mice (Figure 3A,B). Water intake remained ~50% higher in AC6−/− mice during the HCO3− challenge (Figure 3A). During the HCO3− challenge fluid intake increased significantly in both genotypes compared with baseline (Figure 3A). However, while fluid intake remained significantly higher than baseline in the AC6−/− mice throughout the entire HCO3− challenge, the increased fluid intake in WT mice appeared to be more transient and was only significantly higher on days 1, 3, and 4 (Figure 3A). AC6−/− mice had higher urinary pH on day 3, 4, 5, and 8 compared with baseline conditions, whereas the WT mice only had significantly higher urinary pH on day 5 (Figure 3B). In response to the HCO3− challenge, urinary pH of the WT mice remained significantly lower than AC6−/− mice on days 2, 6, and 7. Blood gas analysis under baseline conditions showed that AC6−/− mice have higher blood pH and HCO3− concentrations compared with WT mice (Figure 3C,D). Eight days of HCO3− challenge did not significantly alter blood pH levels in either genotype, with blood pH remaining significantly more alkaline in AC6−/− mice. In contrast, blood HCO3− concentrations increased similarly in both groups (Figure 3C,D), but the relative difference between the genotypes was still apparent.
Figure 3. AC6−/− mice present higher blood pH and blood HCO3− under baseline conditions and after 8 days of HCO3− challenge.
To test for a defect in HCO3− handling, AC6−/−mice and WT mice were followed for 3 days during baseline conditions and subsequently challenged with HCO3− (NaHCO3) loading for 8 days (supplied via drinking water). Because daily water intake is double in AC6−/− mice, NaHCO3 was supplied to this genotype at a 50% lower concentration compared with WT mice (0.14 in AC6−/− mice compared with 0.28 M in WT mice). (A) Water intake during baseline conditions and during HCO3− loading (n=3 per genotype; one data point is the average of two mice kept in the same cage). (B) Urinary pH during baseline conditions and during HCO3− challenge (n=6/genotype). (C,D) Blood pH and HCO3− concentrations under baseline conditions and after 8 days HCO3− challenge (n=6/genotype). Statistical comparisons in (A,B): *AC6−/− compared with WT mice (P<0.05); left side of dashed line, ‡baseline day 1 compared with baseline day 2 or 3 in WT mice (P<0.05); right side of dashed line, #baseline mean compared with HCO3− challenge in both genotypes (P<0.05). Statistical comparisons in (C,D): *compared with WT mice or baseline (P<0.05). Statistical comparisons on left and right side of dashed line in (A,B) were performed separately using two-way repeated measurement ANOVAs. Values indicate mean ± S.E.M. Values on bars indicate sample size. Abbreviation: Base, Baseline.
After HCO3− challenge, AC6−/− mice have normal subcellular distributions of H+-ATPase B1 subunit, pendrin, AE1 and AE2
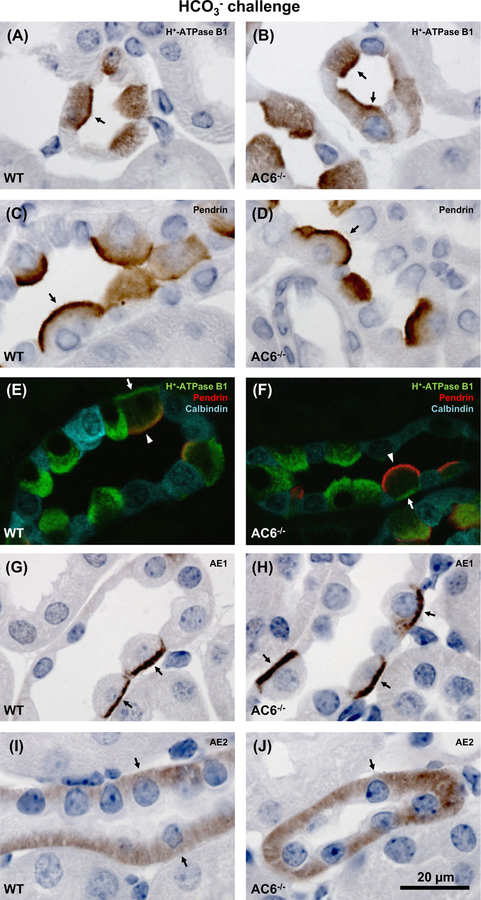
To address whether the alkalosis in AC6−/− mice could be linked to altered subcellular distribution of renal proteins involved in acid–base regulation, the localization of the H+-ATPase B1, pendrin, AE1 and AE2 in renal tissue from mice after 8 days of HCO3− challenge was examined by immunohistochemistry (Figure 4). The H+-ATPase B1 subunit was localized in apical and basolateral domains of ICs, with no apparent difference in distribution between AC6−/− and WT mice (Figure 4A,B,E,F). Pendrin was localized to the apical domain (Figure4C–F) and AE1 to the basolateral domain (Figure 4G,H) of ICs, but again no differences in localization could be observed. In the TAL, AE2 was localized to the basolateral membrane domain in both the AC6−/− and WT mice (Figure 4I,J).
Figure 4. AC6−/− mice present normal subcellular distribution of the H+-ATPase B1 subunit, pendrin, AE1 and AE2.
Representative light and confocal microscopic images of 2-μm kidney sections from AC6−/− and WT mice subjected to 8 days of HCO3− challenge. Immunolabeling was performed using antibodies targetting (A,B) H+-ATPase B1 subunit (arrows: apical labeling in cortex); (C,D) pendrin (arrows: apical labeling in cortex); (E,F) H+-ATPase B1 subunit, pendrin and calbindin (cortex; arrows: basolateral H+-ATPase B1 subunit labeling, arrow heads: apical pendrin labeling); (G,H) AE1 (arrows: basolateral labeling in cortex); and (I,J) AE2 (arrows: basolateral labeling in medullary TAL). No clear differences were identified in subcellular labeling pattern of proteins when comparing AC6−/− with WT mice.
AC6 is expressed in renal ICs
Existing commercial AC6 antibodies are unsuitable for immunohistochemistry (unpublished observations). Thus, to determine whether the lack of altered subcellular distribution of the examined acid–base transporters in ICs of AC6−/− mice are due to AC6 being absent from this cell type, we investigated AC6 expression patterns using AC6−/−EGFP mice, where EGFP expression is a surrogate marker of AC6 expression [34]. Immunofluorescent double labeling identified EGFP in H+-ATPase B1-positive cells of AC6−/−EGFP mice (Figure 5B,D,F), clearly indicating that AC6 is expressed in the ICs. In contrast, H+-ATPase B1-positive cells were identified in WT mice but no EGFP fluorescence was observed (Figure 5 A,C,E). Thus, although AC6 is expressed in ICs, it does not appear to be crucial for regulating the subcellular distribution and/or trafficking of the H+-ATPase B1 subunit, pendrin, AE1 or AE2 (Figure 4).
Figure 5. AC6 is expressed in renal IC.
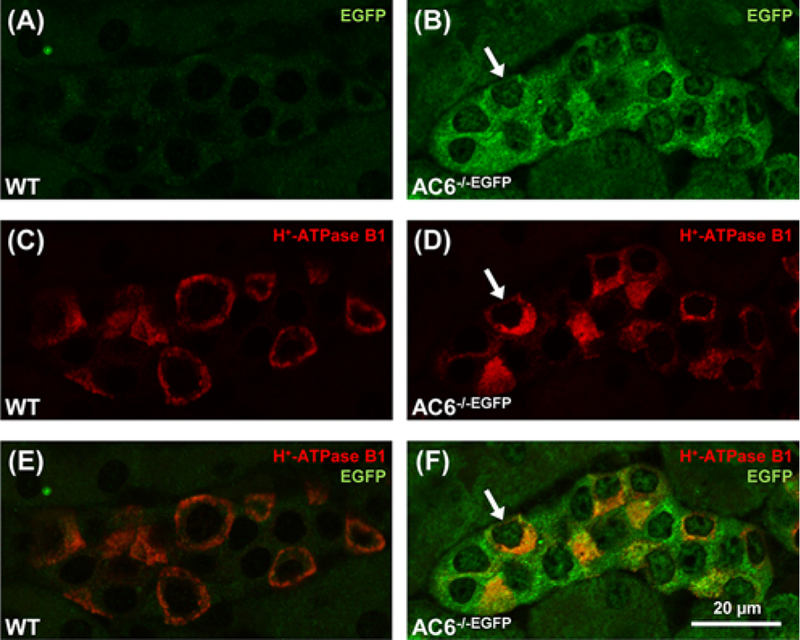
Representative confocal microscopic images of the AC6 localization in AC6−/−EGFP mice with EGFP expression driven by the AC6 promotor (2-μm kidney sections). (A–F) AC6−/−EGFP expressed EGFP in cortical cells positive for the H+-ATPase B1 subunit (arrows), indicating AC6 expression in ICs. EGFP was undetectable in WT mice (A–E).
AC6−/− mice have higher H+-ATPase B1 and pendrin abundances after chronic HCO3− challenge
After 8 days of HCO3− challenge, levels of the H+-ATPase B1 subunit remained significantly higher in AC6−/− mice relative to WT mice (Figure 6). Pendrin abundance in AC6−/− mice was also greater, which could be a compensatory response to lower blood HCO3−. No significant differences in NBC1 levels, NHE3 levels, or NHE3 phosphorylation at Ser552 were observed between the genotypes following the HCO3− challenge (Figure 6).
Figure 6. AC6−/− mice present higher H+-ATPase B1 abundance after 8 days of HCO3− challenge.
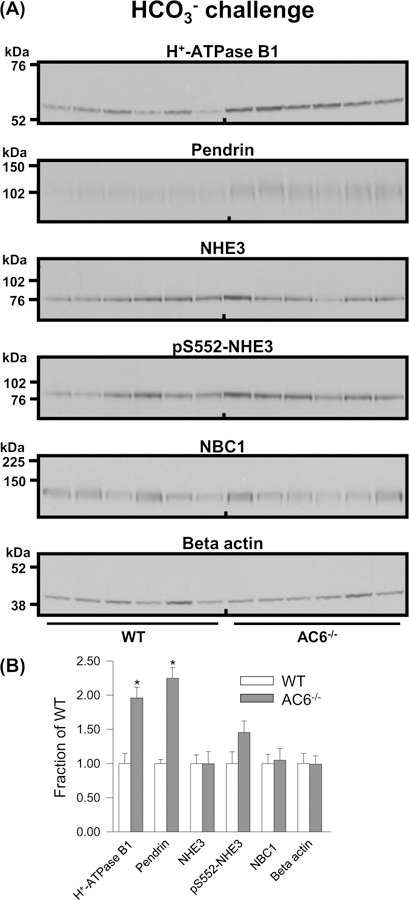
(A) Semiquantitative immunoblotting of 17000 g membrane fraction of whole kidney lysates from WT and AC6−/− mice after 8 days HCO3− challenge using antibodies targetting various proteins involved in acid–base regulation. (B) Summary data demonstrate higher abundances of the H+-ATPase B1 subunit and pendrin. Values indicate mean ± S.E.M.; n=6/genotype, *P<0.05.
Increased number of H+-ATPase B1 subunit-positive cells in AC6−/− mice after chronic HCO3− challenge
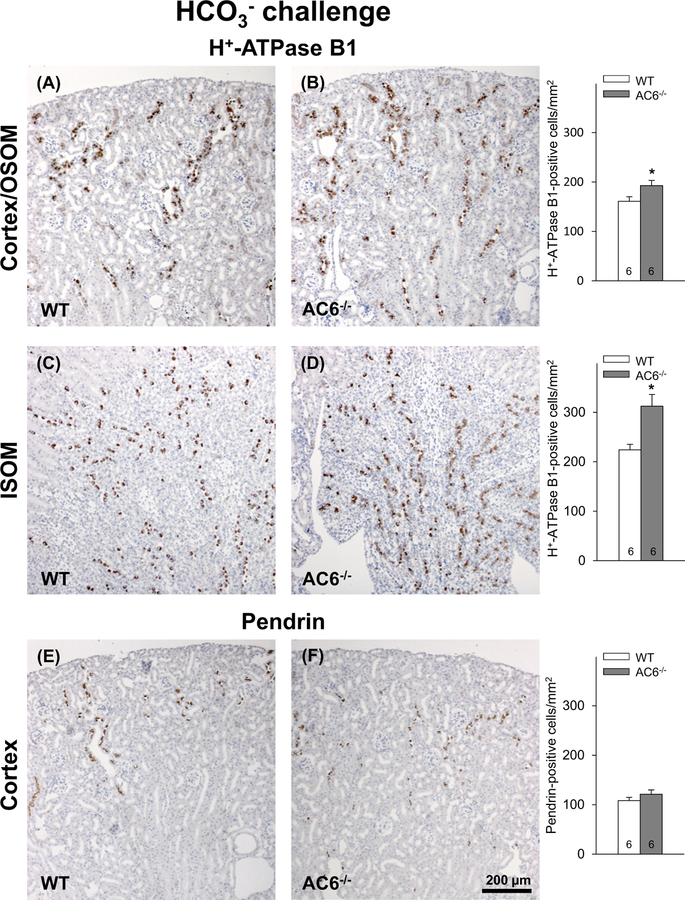
To investigate if the increased abundance of the H+-ATPase B1 subunit and pendrin in response to the HCO3− challenge is caused by greater amounts of protein per cell or the consequence of a higher number of cells expressing these proteins, cell counting was performed. There was a significantly greater number of H+-ATPase B1 subunit-positive cells in the cortex/OSOM (Figure 7A,B) and ISOM in AC6−/− compared with WT mice (Figure 7C,D). No clear differences were found in the number of pendrin-positive cells between genotypes (Figure 7E,F). Since in mice the H+-ATPase B1 subunit is expressed in all subtypes of ICs (type A, type B, and non-A-non-B cells) and pendrin is only expressed in type B and non-A-non-B ICs, the cell counting data suggest that AC6−/− mice have a higher number of type A ICs compared with WT mice. This observation is supported by the greater number of H+-ATPase B1-positive cells detected in the ISOM of AC6−/− mice, a kidney zone that does not normally contain type B and non-A-non-B ICs [50]. The higher number of ICs in AC6−/− mice after 8 days of HCO3− challenge was not accompanied by increased levels of the PCNA (Supplementary Figure S4), often used as a marker of cell proliferation.
Figure 7. AC6−/− mice present more H+-ATPase B1 subunit-positive cells after 8 days of HCO3− challenge.
(A,B) Counting of H+-ATPase B1 subunit-positive cells in the cortex/OSOM, in total 28902 cells counted) revealed significantly more positive cells in the AC6−/− mice compared with WT mice after 8 days of HCO3− challenge. (C,D) Similarly, in ISOM, in total 4935 cells counted, more H+-ATPase B1 subunit-positive cells were identified in AC6−/− mice. (E,F) By contrast, AC6−/− mice showed no difference in the number of pendrin-positive cells in the cortex after 8 days of HCO3− challenge (in total, 13530 cells were counted). Values indicate mean ± S.E.M. Values on bars indicate sample size. *P<0.05.
Low urine pH in AC6−/− mice cannot be fully accounted for by renal tubule and CD AC6
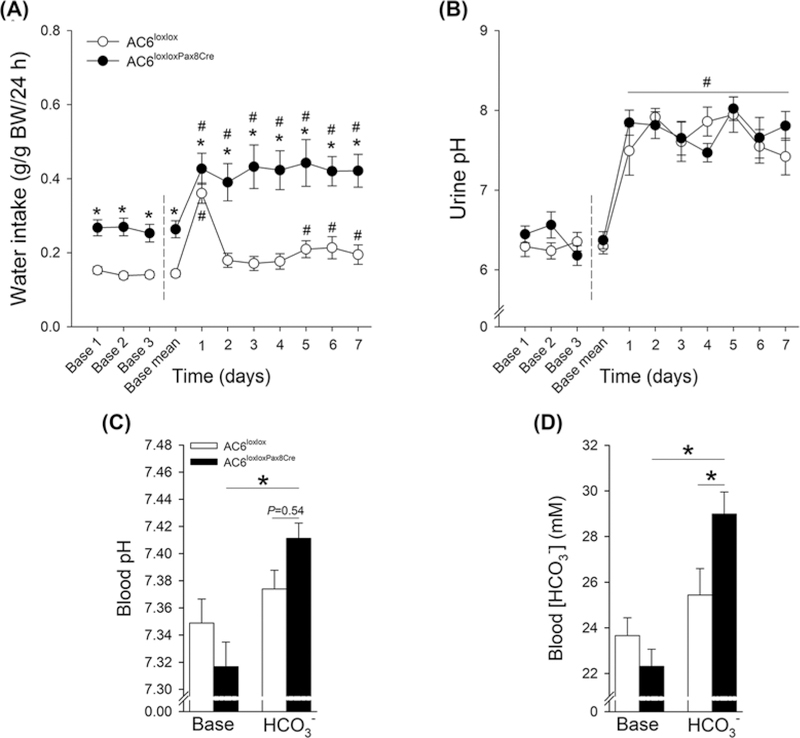
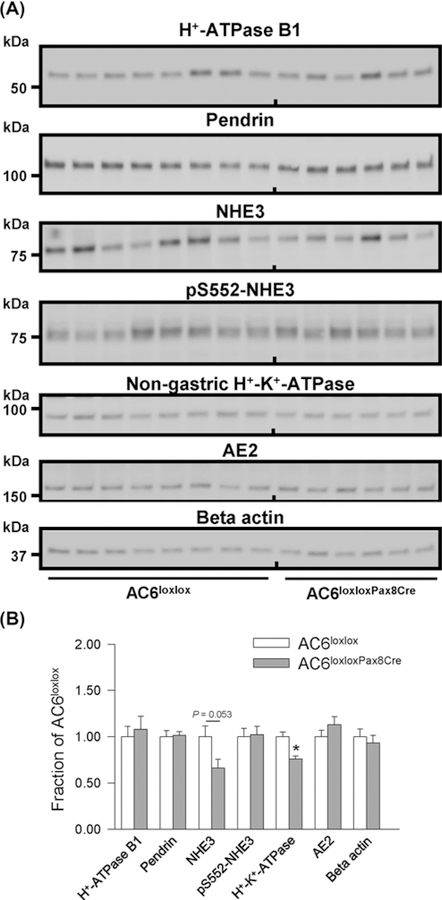
To investigate whether altered acid–base homeostasis in AC6−/− mice was attributable to the absence of AC6 in the renal tubule/CD, we generated mice that lacked AC6 in the renal tubule and CD by crossing AC6loxlox with Pax8-Cre mice, which is expressed along the renal tubule and CD but not in glomeruli, mesangial cells, or blood vessels [51]. Western blotting of kidney membrane fractions from control (AC6loxlox) and AC6loxloxPax8Cre mice showed ~70% reduction in AC6 protein in AC6loxloxPax8Cre mice (Figure 8). The residual AC6 (~30%) may be expressed in glomeruli and vasculature. Consistent with AC6−/− mice [26], AC6loxloxPax8Cre mice have a urinary concentrating defect with significantly lower urine osmolality compared with AC6loxlox mice (964 ± 97 compared with 2389 ± 198 mmol/kg, P<0.05) and a ~two-fold higher water intake (Figure 9A). AC6loxloxPax8Cre mice did not have a significant difference in urinary pH, blood pH or HCO3− levels compared with AC6loxlox mice under baseline conditions (Figure9B,D). To unravel a contribution of renal AC6 in acid–base homeostasis, mice were challenged with HCO3− and NH4Cl in their drinking water. Fluid intake remained significantly higher in AC6loxloxPax8Cre compared with AC6loxlox mice throughout the entire HCO3− challenge (Figure 9A). AC6loxloxPax8Cre mice significantly increased their fluid intake on day 1 of the HCO3− challenge and sustained this level for the remainder of the experimental period. Changes in fluid intake in AC6loxlox mice appeared to be more transient and were only slightly but significantly higher on days 1 and 5–7 (Figure 9A). Both genotypes significantly alkalinized their urinary pH during the entire experimental period (Figure 9B). Seven days of HCO3− challenge did not significantly alter blood pH or HCO3− levels in AC6loxlox mice. In contrast, blood pH and HCO3− levels significantly increased in AC6loxloxPax8Cre mice (Figure 9C,D, respectively). The NH4Cl challenge did not uncover significant differences between genotypes (Supplementary Figure S5). Western blotting identified a tendency toward a significantly lower NHE3 expression (P=0.053) and a significantly lower nongastric H+-K+-ATPase expression in AC6loxloxPax8Cre compared with AC6loxlox mice (Figure 10). The renal protein abundances of other acid–base mediators were not significantly altered between genotypes.
Figure 8. AC6loxloxPax8Cre mice have drastically reduced expression of renal AC6.
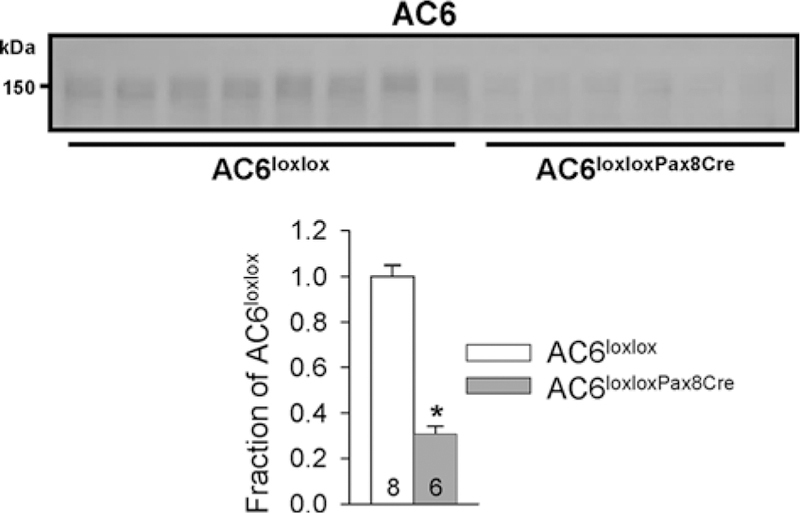
Semiquantitative immunoblotting of whole kidney lysates from control (AC6loxlox) and AC6loxloxPax8Cre mice using an antibody targetting AC6. AC6loxloxPax8Cre mice show a ∼70% reduction in AC6 compared with WT mice. Values indicate mean ± S.E.M. Values on bars indicate sample size. *P<0.05.
Figure 9. AC6loxloxPax8Cre mice present higher blood pH and blood HCO3− after 7 days of HCO3− challenge.
To test for a defect in HCO3− handling, AC6loxloxPax8Cre mice and AC6loxlox were followed for 3 days during baseline conditions and subsequently challenged with HCO3− (NaHCO3) loading for 7 days (supplied via drinking water). Because daily water intake is double in AC6loxloxPax8Cre mice, NaHCO3 was supplied to this genotype at a 50% lower concentration compared with WT mice (0.14 M in AC6loxloxPax8Cre mice compared with 0.28 M in AC6loxlox mice). (A) Fluid intake during baseline conditions and during HCO3− loading (n=8 per genotype). (B) Urinary pH during baseline conditions and during HCO3− challenge (n=8/genotype). (C,D) Blood pH and HCO3− concentrations under baseline conditions and after 7 days HCO3− challenge (n=8/genotype). Statistical comparisons in (A and B): *AC6loxloxPax8Cre compared with AC6loxlox mice (P<0.05); #baseline mean compared with HCO3− challenge in both genotypes (P<0.05). Statistical comparisons in (C,D): *compared with AC6loxlox mice or baseline (P<0.05). Statistical comparisons on left and right side of dashed line in (A, B) were performed separately using two-way repeated measurement ANOVAs. Values indicate mean ± S.E.M. Values on bars indicate sample size. Abbreviation: Base, Baseline.
Figure 10. Immunoblotting of cAMP-regulated renal proteins involved in acid–base homeostasis in AC6loxloxPax8Cre mice.
(A) Semiquantitative immunoblotting of whole kidney lysates 17000g membrane fractions from AC6loxlox and AC6loxloxPax8Cre mice using antibodies targetting various proteins involved in acid–base regulation. (B) Summary data demonstrate higher abundance of the non-gastric H+-K+-ATPase and a tendency toward a significantly lower NHE3 expression (P=0.053). Values indicate mean ± S.E.M.; n=6–8/genotype,*P<0.05.
Discussion
The kidneys play an important role in acid–base homeostasis. Several of the renal transport proteins involved in acid–base homeostasis are regulated by cAMP. However, whether AC6, a highly abundant AC throughout the nephron, contributed to acid–base regulation is not clear. In the present study we demonstrated that AC6 is required for maintaining normal acid–base homeostasis. However, similar acid–base disturbances were not observed in renal tubule/CD-specific AC6 knockout mice under baseline conditions, although a HCO3− challenge suggested a contribution. Extrarenal AC6 function, in particular a role in energy expenditure, may contribute to altered acid–base balance in AC6−/− mice.
One aspect of maintaining acid–base homeostasis involves an intricate interplay between various transport proteins expressed in the kidney. Here we chose to study how this balance is potentially disturbed when the major AC isoform, AC6, responsible for the majority of cAMP formation in the cortex [31] and medulla [26], is absent. Under baseline conditions AC6−/− mice had lower urinary pH alongside higher blood pH and HCO3− concentrations compared with WT mice. In terms of urinary H+ excretion, the majority of acid is excreted as ammonia; however, our data do not support that renal ammonia excretion is substantially contributing to the lower urinary pH in AC6−/− mice because ammonia/creatinine ratios were not significantly different between genotypes. Phosphate is another important urinary buffer and AC6−/− mice are phosphaturic [31]. The reduced NHE3 expression observed in AC6−/− mice here could be a compensatory response to limit the H+ loss due to increased protonation of HPO42−→ H2PO4−. However, AC6loxloxPax8Cre mice tended to have lower renal NHE3 expression (P=0.053 and our unpublished observations indicate that urinary phosphate/creatinine ratio in this model is also increased comapared with control mice). Thus, as AC6loxloxPax8Cre do not have altered urinary pH, the observed phosphate wasting in AC6−/− mice [31] is unlikely to have a significant impact on urinary pH. Intriguingly, our metabolic phenotyping data are consistent with the idea that AC6 contributes to energy expenditure, which is associated with minor differences in locomotor activity. The increase in energy expenditure is associated with increased CO2 production, which is reflected in a higher blood pH and HCO3− concentration in AC6−/− mice. Of note, AC5 knockout mice show comparable findings to AC6−/− mice with increased O2 consumption, CO2 production and energy expenditure on a standard and high fat diet [52]. If knockout of AC6 has similar protective effects in obesity remains to be determined.
Consistent with the lower urinary pH, the increased levels of the H+-ATPase B1 subunit in AC6−/− mice under baseline conditions could contribute to the more acidic urine. Vice versa, H+-ATPase B knockout mice have a ~1 pH unit more alkaline urine [7], supporting the idea of the importance of this protein for urinary acidification. However, knockout of H+-ATPase B1 does not affect blood pH or HCO3− concentrations unlike what is observed here for AC6−/− mice. Another cAMP-regulated protein important for acid–base balance is carbonic anhydrase II (CA II), which is also regulated by cAMP [53]. CAII mutations cause type II RTA, which is defined by metabolic acidosis and a urinary pH < 5.5. Although the soluble AC is thought to be a major regulator of CAII [54] – a role of AC6 cannot be discounted.
A possible contribution of AC6 to handling of an acute HCO3− load can be depicted from Figure 1A,B. On day 1 of the HCO3− challenge, both genotypes significantly increased fluid intake (and consequently HCO3−); however, WT mice did not show a change in urinary pH while AC6−/− mice had a drastic increase in urinary pH. AC6−/− mice had lower AE2 abundance under baseline conditions, presumably in the medullary TAL [10,47]. AE2 levels can be regulated by the levels of the transported cation, e.g. metabolic alkalosis induced by NaHCO3 loading causes an increase in AE2 protein abundance, which is in contrast with metabolic alkalosis induced by KHCO3 loading [42].A reduced AE2 expression in AC6−/− mice under baseline conditions could be a mechanism to reduce HCO3− uptake back into the systemic circulation. Unfortunately, our studies do not allow a direct comparison in the HCO3− responses of proteins compared with baseline conditions; however, the NaHCO3 challenge diminished the observed differences in AE2 expression between genotypes.
In type A ICs, H+-ATPase B1 subunit trafficking to the apical plasma membrane can be stimulated by cAMP [19]. Although the use of AC6−/−EGFP mice clearly demonstrated that AC6 was expressed in ICs, the AC6−/− mice had normal subcellular distribution of the H+-ATPase B1 subunit following HCO3− challenge. This indicates that membrane-bound AC6 activity is not mediating the trafficking of H+-ATPase B1. Furthermore, the H+-ATPase B1 subunit was more abundant in AC6−/− mice under baseline conditions and after HCO3− challenge. In the absence of luminal HCO3−, H+ secretion by type A ICs may acidify the urine while in the presence of luminal HCO3−, H+ secretion may lead to HCO3− reabsorption (reviewed in [2]). Thus, increasing the activity of apical H+-ATPase in type-A ICs can potentially both acidify the urine and increase blood HCO3−. We previously showed that AC6 is instrumental in determining PC–IC ratios when mice are exposed to dietary Li+ [27]. This current study identifies that AC6−/− mice have significantly higher numbers of ICs that are positive for the H+-ATPase B1 subunit, which are found in all types of IC. In contrast, type B and non-A-non-B ICs, which are both positive for pendrin, do not show a significant difference in cell number after HCO3− challenge. Consequently, the type A ICs must be the cell type increased in number in AC6−/− mice. Consistent with this, we see a significantly higher number of H+-ATPase B1 subunit positive cells in the ISOM, a region that normally does not contain type B and non-A-non-B ICs. Interconversion between IC types is well described [55,56]. Since mice with lack of renal AC6 (AC6loxloxPax8Cre mice) had no alterations in H+-ATPase B1 subunit levels, our data suggest that the interconversion between IC types is a secondary event due to differences in acid–base homeostasis between genotypes.
Due to the clear acid–base imbalance observed in the AC6−/−mice, we were surprised by the results in our novel AC6loxloxPax8Cre mice that had severely diminished AC6 along the entire tubule system and CD. Despite drastically reduced renal AC6 protein expression and presenting with a urinary concentrating defect (comparable in magnitude to AC6−/− mice), AC6loxloxPax8Cre mice had a similar urinary pH compared with AC6loxloxPax8Cre mice. Of note, a contribution of renal AC6 in acid–base regulation was unraveled in response to HCO3− challenge. Mice that lack AC6 in only CD PCs, AC6loxloxAQP2Cre mice [27], also had no significant differences in urinary pH under baseline conditions (control: 6.81 ± 0.13 compared with AC6loxloxAQP2Cre: 6.54 ± 0.24, n=9–17/genotype, NS, unpublished data). However, we cannot completely exclude that the remainder of the AC6 expression (~25%) contributes to cAMP-mediated acid–base regulation in AC6loxloxPax8Cre mice at least under baseline conditions.
The present study is not without limitations. The multitude of changes in various acid–base transporters, in kidney, lung, and intestine in the absence of AC6 implies that there must be either systemic ‘cross-talk’ between organs, and/or intrarenal communication between different nephron segments. Which hormones and/or paracrine signaling molecules responsible remain to be determined. If AC6 is such an important isoform for renal cAMP formation and kidney function, as supported by our previous studies in AC6−/− mice [26–28,30,31]; why a larger number of cAMP-regulated acid–base transport proteins are not affected by lack of AC6 remains unclear. We can only speculate other AC isoform(s), such as the soluble AC that also functions as a pH sensor [57], play a much more important role than AC6 in regulating renal acid–base transporter function.
Supplementary Material
Clinical perspectives.
The kidneys have an important role in acid–base regulation, several proteins involved in acid–base regulation are regulated by AC-mediated cAMP formation. Out of nine different AC isoforms, AC6 is the most abundant in the kidney.
We propose that AC6 in the body has an important role in acid–base regulation which is possibly related to a role of AC6 in energy expenditure. This is concluded from experiments where AC6 is completely absent from the body. In contrast, lack of AC6 in the tubule/CD or PCs has a minor effect on acid–base status.
Our study could help identify acid–base phenotypes in humans with genetic variation of AC6. Previous reports identified patient populations with increased and decreased AC6 activity [58,59].
Acknowledgements
We thank the technical assistance of Inger-Merete Paulsen, Helle Høyer, Ahmed Abduljabar, and Christian Westberg.
Funding
This work is supported by the Novo Nordisk Foundation (to R.A.F.); the Lundbeck Foundation; the Danish Medical Research Council; and the National Institute of Diabetes and Digestive Kidney Diseases [grant number 1R01DK110621 (to T.R.)].
Abbreviations
- AC
adenylyl cyclase
- AC6
AC isoform 6
- AE1
anion exchanger 1
- AE2
anion exchanger 2
- CD
collecting duct
- IC
intercalated cell
- IMCD
inner medullary CD
- ISOM
inner strip outer medulla
- NBC1
Na+-HCO3− cotransporter
- NDI
nephrogenic diabetes insipidus
- NHE3
Na+-H+ exchanger isoform 3
- OSOM
outer strip outer medulla
- PC
principal cell
- PCNA
proliferating cell nuclear antigen
- RTA
renal tubular acidosis
- TAL
thick ascending limb
- WT
wild-type
Footnotes
Competing interests
The authors declare that there are no competing interests associated with the manuscript.
References
- 1.Kurtz I (2014) Molecular mechanisms and regulation of urinary acidification. Compr. Physiol 4, 1737–1774, 10.1002/cphy.c140021 [DOI] [PMC free article] [PubMed] [Google Scholar]
- 2.Hamm LL, Nakhoul N and Hering-Smith KS (2015) Acid–base homeostasis. Clin. J. Am. Soc. Nephrol 10, 2232–2242, 10.2215/CJN.07400715 [DOI] [PMC free article] [PubMed] [Google Scholar]
- 3.Fenton RA, Poulsen SB, de la Mora Chavez S, Soleimani M, Dominguez Rieg JA and Rieg T (2017) Renal tubular NHE3 is required in the maintenance of water and sodium chloride homeostasis. Kidney Int 92, 397–414, 10.1016/j.kint.2017.02.001 [DOI] [PMC free article] [PubMed] [Google Scholar]
- 4.Igarashi T, Inatomi J, Sekine T, Cha SH, Kanai Y, Kunimi M et al. (1999) Mutations in SLC4A4 cause permanent isolated proximal renal tubular acidosis with ocular abnormalities. Nat. Genet 23, 264–266, 10.1038/15440 [DOI] [PubMed] [Google Scholar]
- 5.Wang T, Hropot M, Aronson PS and Giebisch G (2001) Role of NHE isoforms in mediating bicarbonate reabsorption along the nephron. Am. J. Physiol. Renal Physiol 281, F1117–F1122, 10.1152/ajprenal.2001.281.6.F1117 [DOI] [PubMed] [Google Scholar]
- 6.Wall SM, Hassell KA, Royaux IE, Green ED, Chang JY, Shipley GL et al. (2003) Localization of pendrin in mouse kidney. Am. J. Physiol. Renal Physiol 284, F229–F241, 10.1152/ajprenal.00147.2002 [DOI] [PubMed] [Google Scholar]
- 7.Finberg KE, Wagner CA, Bailey MA, Paunescu TG, Breton S, Brown D et al. (2005) The B1-subunit of the H+ ATPase is required for maximal urinary acidification. Proc. Natl. Acad. Sci. U.S.A 102, 13616–13621, 10.1073/pnas.0506769102 [DOI] [PMC free article] [PubMed] [Google Scholar]
- 8.Amlal H, Petrovic S, Xu J, Wang Z, Sun X, Barone S et al. (2010) Deletion of the anion exchanger Slc26a4 (pendrin) decreases apical Cl−/HCO3− exchanger activity and impairs bicarbonate secretion in kidney collecting duct. Am. J. Physiol. Cell Physiol 299, C33–C41, 10.1152/ajpcell.00033.2010 [DOI] [PMC free article] [PubMed] [Google Scholar]
- 9.Batlle D and Haque SK (2012) Genetic causes and mechanisms of distal renal tubular acidosis. Nephrol. Dial. Transplant 27, 3691–3704, 10.1093/ndt/gfs442 [DOI] [PubMed] [Google Scholar]
- 10.Alper SL, Stuart-Tilley AK, Biemesderfer D, Shmukler BE and Brown D (1997) Immunolocalization of AE2 anion exchanger in rat kidney. Am. J. Physiol 273, F601–F614 [DOI] [PubMed] [Google Scholar]
- 11.Stuart-Tilley AK, Shmukler BE, Brown D and Alper SL (1998) Immunolocalization and tissue-specific splicing of AE2 anion exchanger in mouse kidney. J. Am. Soc. Nephrol 9, 946–959 [DOI] [PubMed] [Google Scholar]
- 12.Ahn KY and Kone BC (1995) Expression and cellular localization of mRNA encoding the ‘gastric’ isoform of H+-K+-ATPase α-subunit in rat kidney. Am. J. Physiol 268, F99–F109 [DOI] [PubMed] [Google Scholar]
- 13.Crowson MS and Shull GE (1992) Isolation and characterization of a cDNA encoding the putative distal colon H+,K+-ATPase. Similarity of deduced amino acid sequence to gastric H+,K+-ATPase and Na+,K+-ATPase and mRNA expression in distal colon, kidney, and uterus. J. Biol. Chem 267, 13740–13748 [PubMed] [Google Scholar]
- 14.Lynch IJ, Rudin A, Xia SL, Stow LR, Shull GE, Weiner ID et al. (2008) Impaired acid secretion in cortical collecting duct intercalated cells from H-K-ATPase-deficient mice: role of HKα isoforms. Am. J. Physiol. Renal Physiol 294, F621–F627, 10.1152/ajprenal.00412.2007 [DOI] [PubMed] [Google Scholar]
- 15.Gumz ML, Lynch IJ, Greenlee MM, Cain BD and Wingo CS (2010) The renal H+-K+-ATPases: physiology, regulation, and structure. Am. J. Physiol. Renal Physiol 298, F12–F21, 10.1152/ajprenal.90723.2008 [DOI] [PMC free article] [PubMed] [Google Scholar]
- 16.Verlander JW, Moudy RM, Campbell WG, Cain BD and Wingo CS (2001) Immunohistochemical localization of H-K-ATPase α2c-subunit in rabbit kidney. Am. J. Physiol. Renal Physiol 281, F357–F365, 10.1152/ajprenal.2001.281.2.F357 [DOI] [PubMed] [Google Scholar]
- 17.Zhang Y, Norian JM, Magyar CE, Holstein-Rathlou NH, Mircheff AK and McDonough AA (1999) In vivo PTH provokes apical NHE3 and NaPi2 redistribution and Na-K-ATPase inhibition. Am. J. Physiol 276, F711–F719 [DOI] [PubMed] [Google Scholar]
- 18.Gross E, Hawkins K, Pushkin A, Sassani P, Dukkipati R, Abuladze N et al. (2001) Phosphorylation of Ser982 in the sodium bicarbonate cotransporter kNBC1 shifts the HCO3−: Na+ stoichiometry from 3: 1 to 2: 1 in murine proximal tubule cells. J. Physiol 537, 659–665, 10.1113/jphysiol.2001.012956 [DOI] [PMC free article] [PubMed] [Google Scholar]
- 19.Paunescu TG, Ljubojevic M, Russo LM, Winter C, McLaughlin MM, Wagner CA et al. (2010) cAMP stimulates apical V-ATPase accumulation, microvillar elongation, and proton extrusion in kidney collecting duct A-intercalated cells. Am. J. Physiol. Renal Physiol 298, F643–F654, 10.1152/ajprenal.00584.2009 [DOI] [PMC free article] [PubMed] [Google Scholar]
- 20.Thumova M, Pech V, Froehlich O, Agazatian D, Wang X, Verlander JW et al. (2012) Pendrin protein abundance in the kidney is regulated by nitric oxide and cAMP. Am. J. Physiol. Renal Physiol 303, F812–F820, 10.1152/ajprenal.00577.2011 [DOI] [PMC free article] [PubMed] [Google Scholar]
- 21.Codina J, Liu J, Bleyer AJ, Penn RB and DuBose TD Jr (2006) Phosphorylation of S955 at the protein kinase A consensus promotes maturation of the alpha subunit of the colonic H+,K+-ATPase. J. Am. Soc. Nephrol 17, 1833–1840, 10.1681/ASN.2006010032 [DOI] [PubMed] [Google Scholar]
- 22.Cornelius F and Mahmmoud YA (2003) Direct activation of gastric H,K-ATPase by N-terminal protein kinase C phosphorylation. Comparison of the acute regulation mechanisms of H,K-ATPase and Na,K-ATPase. Biophys. J 84, 1690–1700, 10.1016/S0006-3495(03)74977-7 [DOI] [PMC free article] [PubMed] [Google Scholar]
- 23.Laroche-Joubert N, Marsy S, Michelet S, Imbert-Teboul M and Doucet A (2002) Protein kinase A-independent activation of ERK and H,K-ATPase by cAMP in native kidney cells: role of Epac I. J. Biol. Chem 277, 18598–18604, 10.1074/jbc.M201868200 [DOI] [PubMed] [Google Scholar]
- 24.Gawenis LR, Bradford EM, Alper SL, Prasad V and Shull GE (2010) AE2 Cl−/HCO3− exchanger is required for normal cAMP-stimulated anion secretion in murine proximal colon. Am. J. Physiol. Gastrointest. Liver Physiol 298, G493–G503, 10.1152/ajpgi.00178 [DOI] [PMC free article] [PubMed] [Google Scholar]
- 25.Rieg T and Kohan DE (2014) Regulation of nephron water and electrolyte transport by adenylyl cyclases. Am. J. Physiol. Renal Physiol 306, F701–F709, 10.1152/ajprenal.00656.2013 [DOI] [PMC free article] [PubMed] [Google Scholar]
- 26.Rieg T, Tang T, Murray F, Schroth J, Insel PA, Fenton RA et al. (2010) Adenylate cyclase 6 determines cAMP formation and aquaporin-2 phosphorylation and trafficking in inner medulla. J. Am. Soc. Nephrol 21, 2059–2068, 10.1681/ASN.2010040409 [DOI] [PMC free article] [PubMed] [Google Scholar]
- 27.Poulsen SB, Kristensen TB, Brooks HL, Kohan DE, Rieg T and Fenton RA (2017) Role of adenylyl cyclase 6 in the development of lithium-induced nephrogenic diabetes insipidus. JCI Insight 2, e91042, 10.1172/jci.insight.91042 [DOI] [PMC free article] [PubMed] [Google Scholar]
- 28.Roos KP, Strait KA, Raphael KL, Blount MA and Kohan DE (2012) Collecting duct-specific knockout of adenylyl cyclase type VI causes a urinary concentration defect in mice. Am. J. Physiol. Renal Physiol 302, F78–F84, 10.1152/ajprenal.00397.2011 [DOI] [PMC free article] [PubMed] [Google Scholar]
- 29.Roos KP, Bugaj V, Mironova E, Stockand JD, Ramkumar N, Rees S et al. (2013) Adenylyl cyclase VI mediates vasopressin-stimulated ENaC activity. J. Am. Soc. Nephrol 24, 218–227, 10.1681/ASN.2012050449 [DOI] [PMC free article] [PubMed] [Google Scholar]
- 30.Rieg T, Tang T, Uchida S, Hammond HK, Fenton RA and Vallon V (2013) Adenylyl cyclase 6 enhances NKCC2 expression and mediates vasopressin-induced phosphorylation of NKCC2 and NCC. Am. J. Pathol 182, 96–106, 10.1016/j.ajpath.2012.09.014 [DOI] [PMC free article] [PubMed] [Google Scholar]
- 31.Fenton RA, Murray F, Dominguez Rieg JA, Tang T, Levi M and Rieg T (2014) Renal phosphate wasting in the absence of adenylyl cyclase 6. J. Am. Soc. Nephrol 25, 2822–2834, 10.1681/ASN.2013101102 [DOI] [PMC free article] [PubMed] [Google Scholar]
- 32.Bouchard M, Souabni A and Busslinger M (2004) Tissue-specific expression of cre recombinase from the Pax8 locus. Genesis 38, 105–109, 10.1002/gene.20008 [DOI] [PubMed] [Google Scholar]
- 33.Fenton RA, Poulsen SB, de la Mora Chavez S, Soleimani M, Busslinger M, Dominguez Rieg JA et al. (2015) Caffeine-induced diuresis and natriuresis is independent of renal tubular NHE3. Am. J. Physiol. Renal Physiol 308, F1409–F1420, 10.1152/ajprenal.00129.2015 [DOI] [PMC free article] [PubMed] [Google Scholar]
- 34.Chien CL, Wu YS, Lai HL, Chen YH, Jiang ST, Shih CM et al. (2010) Impaired water reabsorption in mice deficient in the type VI adenylyl cyclase (AC6). FEBS Lett 584, 2883–2890, 10.1016/j.febslet.2010.05.004 [DOI] [PubMed] [Google Scholar]
- 35.Rizzo M, Capasso G, Bleich M, Pica A, Grimaldi D, Bindels RJ et al. (2000) Effect of chronic metabolic acidosis on calbindin expression along the rat distal tubule. J. Am. Soc. Nephrol 11, 203–210 [DOI] [PubMed] [Google Scholar]
- 36.Wagner CA, Finberg KE, Stehberger PA, Lifton RP, Giebisch GH, Aronson PS et al. (2002) Regulation of the expression of the Cl−/anion exchanger pendrin in mouse kidney by acid–base status. Kidney Int 62, 2109–2117, 10.1046/j.1523-1755.2002.00671.x [DOI] [PubMed] [Google Scholar]
- 37.Nowik M, Kampik NB, Mihailova M, Eladari D and Wagner CA (2010) Induction of metabolic acidosis with ammonium chloride (NH4Cl) in mice and rats: species differences and technical considerations. Cell. Physiol. Biochem 26, 1059–1072, 10.1159/000323984 [DOI] [PubMed] [Google Scholar]
- 38.Moeller HB, Knepper MA and Fenton RA (2009) Serine 269 phosphorylated aquaporin-2 is targeted to the apical membrane of collecting duct principal cells. Kidney Int 75, 295–303, 10.1038/ki.2008.505 [DOI] [PMC free article] [PubMed] [Google Scholar]
- 39.Yde J, Keely S, Wu Q, Borg JF, Lajczak N, O’Dwyer A et al. (2016) Characterization of AQPs in mouse, rat, and human colon and their selective regulation by bile acids. Front Nutr 3, 46, 10.3389/fnut.2016.00046 [DOI] [PMC free article] [PubMed] [Google Scholar]
- 40.Joly-Amado A, Serraneau KS, Brownlow M, Marin de Evsikova C, Speakman JR, Gordon MN et al. (2016) Metabolic changes over the course of aging in a mouse model of tau deposition. Neurobiol. Aging 44, 62–73, 10.1016/j.neurobiolaging.2016.04.013 [DOI] [PMC free article] [PubMed] [Google Scholar]
- 41.Poulsen SB and Christensen BM (2017) Long-term aldosterone administration increases renal Na+-Cl− cotransporter abundance in late distal convoluted tubule. Am. J. Physiol. Renal Physiol 313, F756–F66, 10.1152/ajprenal.00352.2016 [DOI] [PubMed] [Google Scholar]
- 42.Christensen BM, Kim YH, Kwon TH and Nielsen S (2006) Lithium treatment induces a marked proliferation of primarily principal cells in rat kidney inner medullary collecting duct. Am. J. Physiol. Renal Physiol 291, F39–F48, 10.1152/ajprenal.00383.2005 [DOI] [PubMed] [Google Scholar]
- 43.Kim YH, Kwon TH, Frische S, Kim J, Tisher CC, Madsen KM et al. (2002) Immunocytochemical localization of pendrin in intercalated cell subtypes in rat and mouse kidney. Am. J. Physiol. Renal Physiol 283, F744–F754, 10.1152/ajprenal.00037.2002 [DOI] [PubMed] [Google Scholar]
- 44.Kim GH, Ecelbarger C, Knepper MA and Packer RK (1999) Regulation of thick ascending limb ion transporter abundance in response to altered acid/base intake. J. Am. Soc. Nephrol 10, 935–942 [DOI] [PubMed] [Google Scholar]
- 45.Maunsbach AB, Vorum H, Kwon TH, Nielsen S, Simonsen B, Choi I et al. (2000) Immunoelectron microscopic localization of the electrogenic Na/HCO3 cotransporter in rat and ambystoma kidney. J. Am. Soc. Nephrol 11, 2179–2189 [DOI] [PubMed] [Google Scholar]
- 46.Swarts HG, Koenderink JB, Willems PH and De Pont JJ (2005) The nongastric H,K-ATPase is oligomycin-sensitive and can function as an H+,NH4+-ATPase. J. Biol. Chem 280, 33115–33122, 10.1074/jbc.M504535200 [DOI] [PubMed] [Google Scholar]
- 47.Frische S, Zolotarev AS, Kim YH, Praetorius J, Alper S, Nielsen S et al. (2004) AE2 isoforms in rat kidney: immunohistochemical localization and regulation in response to chronic NH4Cl loading. Am. J. Physiol. Renal Physiol 286, F1163–F1170, 10.1152/ajprenal.00409.2003 [DOI] [PubMed] [Google Scholar]
- 48.Seron D, Cameron JS and Haskard DO (1991) Expression of VCAM-1 in the normal and diseased kidney. Nephrol. Dial. Transplant 6, 917–922, 10.1093/ndt/6.12.917 [DOI] [PubMed] [Google Scholar]
- 49.Sokal RR and Rohlf FJ (1995) Biometry, 3rd ed., W.H. Freeman and Company, New York, NY [Google Scholar]
- 50.Wall SM and Lazo-Fernandez Y (2015) The role of pendrin in renal physiology. Annu. Rev. Physiol 77, 363–378, 10.1146/annurev-physiol-021014-071854 [DOI] [PubMed] [Google Scholar]
- 51.Espana-Agusti J, Zou X, Wong K, Fu B, Yang F, Tuveson DA et al. (2016) Generation and characterisation of a Pax8-CreERT2 transgenic line and a Slc22a6-CreERT2 knockin line for inducible and specific genetic manipulation of renal tubular epithelial cells. PLoS ONE 11, e0148055, 10.1371/journal.pone.0148055 [DOI] [PMC free article] [PubMed] [Google Scholar]
- 52.Ho D, Zhao X, Yan L, Yuan C, Zong H, Vatner DE et al. (2015) Adenylyl cyclase type 5 deficiency protects against diet-induced obesity and insulin resistance. Diabetes 64, 2636–2645, 10.2337/db14-0494 [DOI] [PMC free article] [PubMed] [Google Scholar]
- 53.Mardones P, Chang JC and Oude Elferink RP (2014) Cyclic AMP and alkaline pH downregulate carbonic anhydrase 2 in mouse fibroblasts. Biochim. Biophys. Acta 1840, 1765–1770, 10.1016/j.bbagen.2013.12.015 [DOI] [PubMed] [Google Scholar]
- 54.Rahman N, Buck J and Levin LR (2013) pH sensing via bicarbonate-regulated ‘soluble’ adenylyl cyclase (sAC). Front. Physiol 4, 343, 10.3389/fphys.2013.00343 [DOI] [PMC free article] [PubMed] [Google Scholar]
- 55.Tsuruoka S and Schwartz GJ (1996) Adaptation of rabbit cortical collecting duct HCO3- transport to metabolic acidosis in vitro. J. Clin. Invest 97, 1076–1084, 10.1172/JCI118500 [DOI] [PMC free article] [PubMed] [Google Scholar]
- 56.Schwartz GJ, Tsuruoka S, Vijayakumar S, Petrovic S, Mian A and Al-Awqati Q (2002) Acid incubation reverses the polarity of intercalated cell transporters, an effect mediated by hensin. J. Clin. Invest 109, 89–99, 10.1172/JCI0213292 [DOI] [PMC free article] [PubMed] [Google Scholar]
- 57.Pastor-Soler N, Beaulieu V, Litvin TN, Da Silva N, Chen Y, Brown D et al. (2003) Bicarbonate-regulated adenylyl cyclase (sAC) is a sensor that regulates pH-dependent V-ATPase recycling. J. Biol. Chem 278, 49523–49529, 10.1074/jbc.M309543200 [DOI] [PMC free article] [PubMed] [Google Scholar]
- 58.Hodges GJ, Gros R, Hegele RA, Van Uum S, Shoemaker JK and Feldman RD (2010) Increased blood pressure and hyperdynamic cardiovascular responses in carriers of a common hyperfunctional variant of adenylyl cyclase 6. J. Pharmacol. Exp. Ther 335, 451–457, 10.1124/jpet.110.172700 [DOI] [PubMed] [Google Scholar]
- 59.Gros R, Van Uum S, Hutchinson-Jaffe A, Ding Q, Pickering JG, Hegele RA et al. (2007) Increased enzyme activity and beta-adrenergic mediated vasodilation in subjects expressing a single-nucleotide variant of human adenylyl cyclase 6. Arterioscler. Thromb. Vasc. Biol 27, 2657–2663, 10.1161/ATVBAHA.107.145557 [DOI] [PubMed] [Google Scholar]
Associated Data
This section collects any data citations, data availability statements, or supplementary materials included in this article.


