

Abstract
Background
Phosphate binders are used to reduce positive phosphate balance and to lower serum phosphate levels for people with chronic kidney disease (CKD) with the aim to prevent progression of chronic kidney disease‐mineral and bone disorder (CKD‐MBD). This is an update of a review first published in 2011.
Objectives
The aim of this review was to assess the benefits and harms of phosphate binders for people with CKD with particular reference to relevant biochemical end‐points, musculoskeletal and cardiovascular morbidity, hospitalisation, and death.
Search methods
We searched the Cochrane Kidney and Transplant Register of Studies up to 12 July 2018 through contact with the Information Specialist using search terms relevant to this review. Studies in the Register are identified through searches of CENTRAL, MEDLINE, and EMBASE, conference proceedings, the International Clinical Trials Register (ICTRP) Search Portal and ClinicalTrials.gov.
Selection criteria
We included randomised controlled trials (RCTs) or quasi‐RCTs of adults with CKD of any GFR category comparing a phosphate binder to another phosphate binder, placebo or usual care to lower serum phosphate. Outcomes included all‐cause and cardiovascular death, myocardial infarction, stroke, adverse events, vascular calcification and bone fracture, and surrogates for such outcomes including serum phosphate, parathyroid hormone (PTH), and FGF23.
Data collection and analysis
Two authors independently selected studies for inclusion and extracted study data. We applied the Cochrane 'Risk of Bias' tool and used the GRADE process to assess evidence certainty. We estimated treatment effects using random‐effects meta‐analysis. Results were expressed as risk ratios (RR) for dichotomous outcomes together with 95% confidence intervals (CI) or mean differences (MD) or standardised MD (SMD) for continuous outcomes.
Main results
We included 104 studies involving 13,744 adults. Sixty‐nine new studies were added to this 2018 update.
Most placebo or usual care controlled studies were among participants with CKD G2 to G5 not requiring dialysis (15/25 studies involving 1467 participants) while most head to head studies involved participants with CKD G5D treated with dialysis (74/81 studies involving 10,364 participants). Overall, seven studies compared sevelamer with placebo or usual care (667 participants), seven compared lanthanum to placebo or usual care (515 participants), three compared iron to placebo or usual care (422 participants), and four compared calcium to placebo or usual care (278 participants). Thirty studies compared sevelamer to calcium (5424 participants), and fourteen studies compared lanthanum to calcium (1690 participants). No study compared iron‐based binders to calcium. The remaining studies evaluated comparisons between sevelamer (hydrochloride or carbonate), sevelamer plus calcium, lanthanum, iron (ferric citrate, sucroferric oxyhydroxide, stabilised polynuclear iron(III)‐oxyhydroxide), calcium (acetate, ketoglutarate, carbonate), bixalomer, colestilan, magnesium (carbonate), magnesium plus calcium, aluminium hydroxide, sucralfate, the inhibitor of phosphate absorption nicotinamide, placebo, or usual care without binder. In 82 studies, treatment was evaluated among adults with CKD G5D treated with haemodialysis or peritoneal dialysis, while in 22 studies, treatment was evaluated among participants with CKD G2 to G5. The duration of study follow‐up ranged from 8 weeks to 36 months (median 3.7 months). The sample size ranged from 8 to 2103 participants (median 69). The mean age ranged between 42.6 and 68.9 years.
Random sequence generation and allocation concealment were low risk in 25 and 15 studies, respectively. Twenty‐seven studies reported low risk methods for blinding of participants, investigators, and outcome assessors. Thirty‐one studies were at low risk of attrition bias and 69 studies were at low risk of selective reporting bias.
In CKD G2 to G5, compared with placebo or usual care, sevelamer, lanthanum, iron and calcium‐based phosphate binders had uncertain or inestimable effects on death (all causes), cardiovascular death, myocardial infarction, stroke, fracture, or coronary artery calcification. Sevelamer may lead to constipation (RR 6.92, CI 2.24 to 21.4; low certainty) and lanthanum (RR 2.98, CI 1.21 to 7.30, moderate certainty) and iron‐based binders (RR 2.66, CI 1.15 to 6.12, moderate certainty) probably increased constipation compared with placebo or usual care. Lanthanum may result in vomiting (RR 3.72, CI 1.36 to 10.18, low certainty). Iron‐based binders probably result in diarrhoea (RR 2.81, CI 1.18 to 6.68, high certainty), while the risks of other adverse events for all binders were uncertain.
In CKD G5D sevelamer may lead to lower death (all causes) (RR 0.53, CI 0.30 to 0.91, low certainty) and induce less hypercalcaemia (RR 0.30, CI 0.20 to 0.43, low certainty) when compared with calcium‐based binders, and has uncertain or inestimable effects on cardiovascular death, myocardial infarction, stroke, fracture, or coronary artery calcification. The finding of lower death with sevelamer compared with calcium was present when the analysis was restricted to studies at low risk of bias (RR 0.50, CI 0.32 to 0.77). In absolute terms, sevelamer may lower risk of death (all causes) from 210 per 1000 to 105 per 1000 over a follow‐up of up to 36 months, compared to calcium‐based binders. Compared with calcium‐based binders, lanthanum had uncertain effects with respect to all‐cause or cardiovascular death, myocardial infarction, stroke, fracture, or coronary artery calcification and probably had reduced risks of treatment‐related hypercalcaemia (RR 0.16, CI 0.06 to 0.43, low certainty). There were no head‐to‐head studies of iron‐based binders compared with calcium. The paucity of placebo‐controlled studies in CKD G5D has led to uncertainty about the effects of phosphate binders on patient‐important outcomes compared with placebo.
It is uncertain whether the effects of binders on clinically‐relevant outcomes were different for patients who were and were not treated with dialysis in subgroup analyses.
Authors' conclusions
In studies of adults with CKD G5D treated with dialysis, sevelamer may lower death (all causes) compared to calcium‐based binders and incur less treatment‐related hypercalcaemia, while we found no clinically important benefits of any phosphate binder on cardiovascular death, myocardial infarction, stroke, fracture or coronary artery calcification. The effects of binders on patient‐important outcomes compared to placebo are uncertain. In patients with CKD G2 to G5, the effects of sevelamer, lanthanum, and iron‐based phosphate binders on cardiovascular, vascular calcification, and bone outcomes compared to placebo or usual care, are also uncertain and they may incur constipation, while iron‐based binders may lead to diarrhoea.
Plain language summary
Phosphate binders to prevent complications of chronic kidney disease
What is the issue?
People with chronic kidney disease (CKD) have a reduction in their capacity to remove phosphate from the body via the kidneys, so that phosphate levels in the blood and in body tissues increase as kidney function decreases. This may lead to the development of deposits comprised of calcium plus phosphate in blood vessels and other tissues, together with damage to the skeleton, worsening of kidney failure and an increased risk of cardiovascular disease, bone pain, fractures, and death.
Phosphate binders are often prescribed with meals to people with kidney disease, with the intention of reducing the absorption of dietary phosphate from the gastrointestinal tract.
What did we do? This review asked whether phosphate binders influence damage to blood vessels and soft tissues, skeletal changes, kidney function, and risks of cardiovascular disease, bone pain, fractures, and death that accompany worsening kidney failure. We included all clinical studies in which people with CKD were given different phosphate binders (by random chance) for at least eight weeks. We also checked the quality of the information in the studies to learn how certain we could be about the results.
What did we find?
We identified 104 studies of phosphate binders that included 13,744 people. Some studies gave treatment for only eight weeks while some studies treated participants for three years. People in the studies had a range of kidney function, and many were on dialysis. Overall we could not be certain of a number of important outcomes because many of the clinical studies we included had important flaws in their design.
Sevelamer treatment may have decreased death for those patients given this medication when taken instead of calcium. The phosphate binders probably caused constipation, but we could not be very certain about the risks of other side‐effects. We were not very certain whether phosphate binders reduced heart complications, stroke, bone pain, or calcification of blood vessels.
Conclusions
Overall, we are not very sure whether specific phosphate binders are beneficial to patients with CKD. There is a possibility that sevelamer may prevent death compared to calcium‐based binders, but we don't know whether this may be caused by an increased risk of calcium‐based binders, a lower risk with sevelamer treatment, or the possibility that both may be true. Patients need to know that it is not certain whether phosphate binders help to prevent complications of kidney disease, but sevelamer may be preferred to calcium binders.
We did not find differences in the effects of treatment for patients on dialysis and those not on dialysis, although most studies evaluating treatment with calcium‐based binders were among dialysis patients and those comparing binders with placebo were among people not treated with dialysis.
Summary of findings
Background
Description of the condition
People with chronic kidney disease (CKD) develop impaired excretion of their dietary phosphate load (Hruska 2008) leading to positive phosphate balance. Hyperphosphataemia leads to a rise in fibroblast growth factor‐23 (FGF23) levels that provide a compensatory increase of renal phosphate excretion and inhibit 1,25 dihydroxy‐vitamin D production and increase its catabolism (Gutiérrez 2005). However, in the presence of further reductions in kidney function, these initial homeostatic responses fail and further increases in serum phosphate and reductions in serum 1,25‐dihydroxy‐vitamin D contribute to an increase in parathyroid hormone (PTH), the actions of which will initially restore calcium and phosphate values toward their normal ranges (Cozzolino 2005; Hruska 2008; Silver 2005). With progression of CKD, these homeostatic responses fail and result in increased risks for hypocalcaemia and hyperphosphataemia that increase PTH release via the calcium‐sensing receptor on parathyroid cells. Prolonged low serum calcium levels lead to stabilisation of mRNA encoding PTH. Reduced 1,25 dihydroxy‐vitamin D levels allow increased transcription of the PTH gene (Kumar 2011). Abnormal serum levels of PTH are observed in 10% of people with a glomerular filtration rate (GFR) above 80 mL/min and in 80% of people with a GFR below 20 mL/min (Levin 2007). Serum levels of calcium and phosphate tend to be within the normal range with a GFR above 40 mL/min and tend to remain stable until the GFR is below 20 mL/min (Levin 2007).
Together, these changes may contribute to the development of a cluster of inter‐related conditions described as chronic kidney disease‐mineral and bone disorder (CKD‐MBD). This systemic disorder manifests in a number of ways. In bone, there are alterations of bone turnover, mineralization, and volume that may be accompanied by marrow fibrosis. These changes can cause altered bone growth and strength, leading to bone pain. In the cardiovascular system, excess vascular and other soft‐tissue calcification leads to occlusive arterial disease and cardiac valvular abnormalities.
Commonly measured laboratory abnormalities that accompany the development of CKD‐MBD include values of serum calcium, phosphate, vitamin D metabolites, PTH, markers of bone turnover, and FGF23. Epidemiological data have increasingly demonstrated an association between abnormal values of serum phosphate, PTH, calcium, and FGF23 caused by CKD and increased cardiovascular events and death, hospitalisation, reduced quality of life, and increased costs of care (Block 1998; Block 2004; Gutiérrez 2008; Tentori 2008).
Description of the intervention
Over the past few decades, cardiovascular disease has accounted for over half of the deaths in people receiving dialysis (USRDS 2009). The development of CKD‐MBD causing vascular calcification in the media of arterial vessels and soft tissues is recognised as a major contributing factor (Guerin 2001; Stevens 2004) to this increased death.
Several agents such as phosphate binders, vitamin D compounds, and calcimimetics are widely used to retard the development and progression of CKD‐MBD complications by acting to reduce dietary phosphate absorption and uptake, treat hyperphosphataemia and hypocalcaemia, increase low 1,25 dihydroxy‐vitamin D levels, and attenuate PTH secretion.
How the intervention might work
Several phosphate binders, including aluminium‐ and calcium‐based agents, have been widely used since 1970. Non‐calcium and non‐aluminium‐based agents, such as sevelamer hydrochloride and lanthanum carbonate, subsequently became available, and more recently, iron‐based compounds have been developed. The use of sevelamer, lanthanum, and iron‐based compounds is increasing in nephrology practice, although they incur greater cost than the older phosphate binders (St Peter 2008; St Peter 2009; USRDS 2009).
The avoidance of calcium‐based agents in CKD theoretically avoids the risks associated with positive calcium balance and the consequent acceleration of vascular calcification and cardiovascular events. For control of hyperphosphataemia, the 2003 National Kidney Foundation Kidney Disease Outcomes Quality Initiatives (NKF‐KDOQI) recommended calcium‐based binders in CKD stages 3 and 4 (glomerular filtration rate (GFR) 30 to 59 mL/min/1.73 m2 and 15 to 29 mL/min/1.73 m2, respectively), and both calcium‐based and calcium‐ and aluminium‐free binders in CKD stages 5 and 5D (GFR < 15 mL/min/1.73 m2 and dialysis) (K/DOQI 2003). However, more recently, the Kidney Disease: Improving Global Outcomes (KDIGO) 2017 update suggests that for patients with CKD G3a‐G5D, elevated phosphate levels should be lowered toward the normal range rather than normalised, while avoiding hypercalcaemia for adult patients (KDIGO 2017). The 2017 KDIGO update suggested restricting the dose of calcium‐based phosphate binders and tolerance of mild and asymptomatic hypocalcaemia, in order to avoid exogenous calcium loading. These guidelines offered a more conservative approach to the use of phosphate binders in patients with CKD G3a to G4, due to insufficient evidence that targeting normal range serum phosphate values improved clinical outcomes, and based upon the safety and side effects of the therapeutic interventions.
Why it is important to do this review
The utility of calcium‐free phosphate binders in reducing clinical events in CKD, balanced against their cost and potential harms has been controversial (Salusky 2006; St Peter 2009). The KDIGO guidelines of 2009 recommended restricting the use of calcium‐based binders in people with persistent or recurrent hypercalcaemia or arterial calcification, or both (KDIGO 2009) and that phosphate binders might be used in patients with CKD G3‐5 and on dialysis (CKD G5D) to achieve improvements in serum phosphate levels toward the normal range. However, citing new trial evidence, the KDIGO 2017 guidelines suggest that phosphate binders have an insufficient evidence base for efficacy and safety among patients with CKD G3a to G5 not on dialysis and that phosphate binders be limited to patients with "progressive or persistent" hyperphosphataemia (KDIGO 2017). The 2017 KDIGO guidelines have suggested that not all phosphate binders are interchangeable, and that excess exposure to calcium, as calcium‐based binders, may be harmful across all GFR categories, however there has remained some uncertainty about the evidence that calcium‐free agents are superior to calcium‐based agents for prevention of adverse clinical outcomes.
In addition, non‐calcium binders may increase healthcare costs. Subsidisation of non‐calcium based phosphate binders in Australia led to increased medication costs from AUD 12.85 per patient per week to AUD 59.85 per patient per week (an additional AUD 2444 per patient per years) (Gray 2011). Medicare costs for phosphate binders among dialysis patients in the US were in excess of USD 1.5 billion in 2015 (St. Peter 2018).
Current guidelines suggest the restriction of calcium‐based phosphate binders for patients treated with dialysis, and a more tolerant approach to higher phosphate levels among patients with CKD G3a to 5 not requiring dialysis, likely to lead to less phosphate binder use for these patients. Because of these factors and the emergence of new studies since the 2011 Cochrane review, we have updated the evidence to address the use of phosphate binder for patients with CKD.
Objectives
The aim of this review was to assess the benefits and harms of phosphate binders for people with CKD with particular reference to relevant biochemical end‐points, musculoskeletal and cardiovascular morbidity, hospitalisation, and death.
In particular we aimed to evaluate the effects of aluminium‐, calcium‐, sevelamer‐, lanthanum‐, iron‐, bixalomer‐, colestilan‐, and magnesium‐based phosphate binders, and nicotinamide, on:
Relevant biochemical end‐points: serum PTH, calcium, phosphate and FGF23
Symptoms: pruritis and bone pain
Bone structure and function: bone mineral density (BMD) assessed by dual‐energy X‐ray absorptiometry (DEXA) or quantitative computerised tomography (QCT), bone turnover and mineralisation based on biochemical bone turnover markers, turnover and volume based on histomorphometry, and fracture events
Clinical outcomes: cardiovascular events, number of hospital admissions, and cardiovascular and death (all causes)
Vascular calcification
Adverse events
We also aimed to identify whether treatment efficacy differed based on GFR categories (CKD G5D and CKD G2 to G5) and whether individual phosphate binders within each class had different effects.
Methods
Criteria for considering studies for this review
Types of studies
All randomised controlled trials (RCTs) and quasi‐RCTs (RCTs in which allocation to treatment was obtained by alternation, use of alternate medical records, date of birth, or other predictable methods) of phosphate binders used for CKD (any GFR category). Studies of phosphate binders, alone or in combination with other (non‐randomised) co‐interventions (for example vitamin D compounds) were included. The first phase of randomised cross‐over studies was included, or both study phases, if appropriate statistical analyses were reported. There were no language restrictions.
Types of participants
Inclusion criteria
Adults with CKD (any category) including G2 to G5 (GFR 15 to 90 mL/min) and G5D (dialysis) (KDIGO 2012).
Exclusion criteria
Studies of participants with a kidney transplant (CKD 5T) were excluded as these studies have been reviewed in a separate Cochrane review (Palmer 2007) that is currently being updated. Studies evaluating treatment in children were excluded as these have been evaluated in a separate Cochrane review (Hahn 2015).
Types of interventions
We included studies with follow‐up of at least eight weeks evaluating phosphate binders (including: sevelamer‐, lanthanum‐, calcium‐, iron‐, bixalomer‐, colestilan‐ (colestimide), magnesium‐, and aluminium‐ based binders) and nicotinamide (nicotinic acid), compared with another phosphate binder or placebo or usual care without phosphate binder.
Types of outcome measures
Primary outcomes
Death (all causes)
Secondary outcomes
Cardiovascular death
Hospitalisation
Nonfatal myocardial infarction
Nonfatal stroke
Fracture (incidence of fracture at any site; vertebral compression fractures; fracture of femur, hip, and any long bones identified by radiographic studies)
Pruritus
Calciphylaxis
Adverse effects: including gastrointestinal (nausea, diarrhoea, constipation, abdominal bloating, abdominal pain), electrolyte imbalance (hyperkalaemia)
Hypercalcaemia (defined as serum calcium level > 10.2 mg/dL (2.6 mmol/L) or as defined by the study investigators)
Serum phosphate (mg/dL), serum calcium (mg/dL), calcium‐by‐phosphate product (mg2/dL2), PTH (intact (iPTH), or PTH (1‐84)); alkaline phosphatase (IU/L), serum bicarbonate (mEq/L), fibroblast growth factor 23 (FGF23), fetuin‐A, and Klotho (any form)
Vascular calcification, soft tissue or valvular calcification
Bone mineral density assessed by dual energy X‐ray absorptiometry (DXA) or quantitative computed tomography (QCT) (change in bone mineral density using Z‐scores, T‐scores, or g/cm2 (DXA) or g/cm3 (QCT) at the lumbar spine, femoral neck, or radius)
Estimated GFR (eGFR); end‐stage kidney disease (ESKD) (defined as eGFR < 15 mL/min/1.73 m2, or commencing dialysis, or as defined by investigators).
Search methods for identification of studies
Electronic searches
We searched the Cochrane Kidney and Transplant Register of Studies up to 12 July 2018 through contact with the Information Specialist using search terms relevant to this review. The Register contains studies identified from the following sources:
Monthly searches of the Cochrane Central Register of Controlled Trials (CENTRAL)
Weekly searches of MEDLINE OVID SP
Handsearching of kidney‐related journals and the proceedings of major kidney conferences
Searching of the current year of EMBASE OVID SP
Weekly current awareness alerts for selected kidney and transplant journals
Searches of the International Clinical Trials Register (ICTRP) Search Portal and ClinicalTrials.gov.
Studies contained in the Register are identified through searches of CENTRAL, MEDLINE, and EMBASE based on the scope of Cochrane Kidney and Transplant. Details of search strategies, as well as a list of handsearched journals, conference proceedings and current awareness alerts, are available in the Specialised Register section of information about Cochrane Kidney and Transplant.
See Appendix 1 for search terms used in strategies for this review.
Searching other resources
Reference lists of review articles, relevant studies and clinical practice guidelines.
Letters seeking information about unpublished or incomplete studies to investigators known to be involved in previous studies.
Data collection and analysis
Selection of studies
The search strategy described was used to obtain titles and abstracts of studies that may have been relevant to the review. The titles and abstracts were screened independently by two authors, who discarded studies that were not applicable. Studies and reviews that might have included relevant data or information on studies were retained initially. Two authors independently assessed retrieved abstracts and, if necessary, the full text of these studies to determine which studies satisfied the inclusion criteria.
Data extraction and management
Studies reported in non‐English language journals were translated before assessment. Where more than one publication of one study existed, reports were grouped together and the publication with the most complete data was used in the analyses. Data were extracted on the characteristics of participants, interventions, comparisons, and the outcomes listed above. Authors were contacted if data relating to death, phosphate, calcium, PTH, or calcium‐by‐phosphate product were not available or not reported in the published reports. Discrepancies between the assessments of the two data extractors were resolved by discussion with an arbitrator.
Assessment of risk of bias in included studies
The following items were assessed independently by two authors using the risk of bias assessment tool (Higgins 2011) (see Appendix 2).
Was there adequate sequence generation (selection bias)?
Was allocation adequately concealed (selection bias)?
-
Was knowledge of the allocated interventions adequately prevented during the study?
Participants and personnel (performance bias)
Outcome assessors (detection bias)
Were incomplete outcome data adequately addressed (attrition bias)?
Are reports of the study free of suggestion of selective outcome reporting (reporting bias)?
Was the study apparently free of other problems that could put it at a risk of bias?
Measures of treatment effect
Dichotomous data were analysed using the risk ratio (RR) and its 95% confidence interval (CI). Where continuous measurements of outcomes were used, the mean difference (MD) and its 95% CI were computed.
Dealing with missing data
Any further information (relating to serum phosphate, calcium, PTH, and death) required from the original author was requested by written correspondence and any relevant information obtained in this manner was included in the review.
Assessment of heterogeneity
We first assessed the heterogeneity by visual inspection of the forest plot. We then quantified statistical heterogeneity using the I2 statistic, which describes the percentage of total variation across studies that is due to heterogeneity rather than sampling error (Higgins 2003). A guide to the interpretation of I2 values was as follows:
0% to 40%: might not be important;
30% to 60%: may represent moderate heterogeneity;
50% to 90%: may represent substantial heterogeneity;
75% to 100%: considerable heterogeneity
The importance of the observed value of I2 depends on the magnitude and direction of treatment effects and the strength of evidence for heterogeneity (e.g. P‐value from the Chi2 test, or a confidence interval for I2) (Higgins 2011).
Assessment of reporting biases
We had planned to examine for publication bias using evidence of asymmetry in a funnel plot in the absence of between‐study statistical heterogeneity (Higgins 201).
Data synthesis
Risk estimates from individual studies were pooled using the inverse variance random‐effects model.
Subgroup analysis and investigation of heterogeneity
Sources of heterogeneity that were explored in the subgroup analyses for the primary outcome (death (all causes)) were: age (older than 60 years and 60 years or younger), CKD stage (stages 1‐4 and stage 5D), baseline serum phosphate (above or below 4.5 mg/dL (1.5 mmol/L)), study duration (above and below 12 months), and methodological quality (low risk of bias for allocation concealment and high or unclear risk of bias). We did not complete planned subgroup analyses for older versus newer agents as most binder types are well‐established. We have also not included subgroup analysis based on number of participants. We have now included subgroup analyses based on age and CKD category, which were not pre‐defined in the previous protocol for this review.
'Summary of findings' tables
The main results are presented in the 'Summary of findings' tables. These tables present key information concerning the quality of the evidence, the magnitude of the effects of the interventions examined, and the sum of the available data for the main outcomes (Schünemann 2011a). The 'Summary of findings' tables also include an overall grading of the evidence related to each of the main outcomes using the GRADE (Grades of Recommendation, Assessment, Development and Evaluation) approach (GRADE 2008; GRADE 2011). The GRADE approach defines the quality of a body of evidence as the extent to which one can be confident that an estimate of effect or association is close to the true quantity of specific interest. The quality of a body of evidence involves consideration of within‐trial risk of bias (methodological quality), directness of evidence, heterogeneity, precision of effect estimates and risk of publication bias (Schünemann 2011b). We present the following outcomes in the 'Summary of findings' tables.
Death (all causes)
Cardiovascular death
Hypercalcaemia
Nausea
Vomiting
Constipation
Serum phosphate
Vascular calcification
Results
Description of studies
Results of the search
Search results are shown in Figure 1. For this 2018 review update, we identified 404 new reports. Sixty‐nine new studies in 138 reports were eligible (Characteristics of included studies). Ninety‐two additional reports of 20 studies included in the 2011 review were identified in the updated search and added to the review. Our search identified three studies that have not yet been completed (COMBINE 2014; IMPROVE‐CKD 2012; LANDMARK 2017) according to details held within the www.ClinicalTrials.gov registry. Three studies were identified as completed without published results and have been categorised as "Awaiting Classification" (NCT00317694; NCT00560300; NCT01968759). These three studies are reported as completed within www.ClinicalTrials.gov, but no results have been published or were available directly from the investigators. Twenty‐three studies in 24 reports were removed from the 2011 review during the update process as the studies did not have eight weeks follow‐up or longer (Al‐Baaj 2005; Chertow 1997; Chiang 2005; d'Almeida Filho 2000; Emmett 1991; Fan 2009; Joy 2003; Koiwa 2005a; Kurihara 2005; Finn 2004; McIntyre 2009; Pflanz 1994; Ring 1993; Schaefer 1991; Sprague 2009b; Yang 2002), included non‐randomised patients (Borrego 2000), did not evaluate an eligible intervention (Fischer 2006; FORESEE 2008; Ittel 1991; Phelps 2002), evaluated treatment in children (Salusky 1991), or were a secondary publication of an existing excluded study.
1.
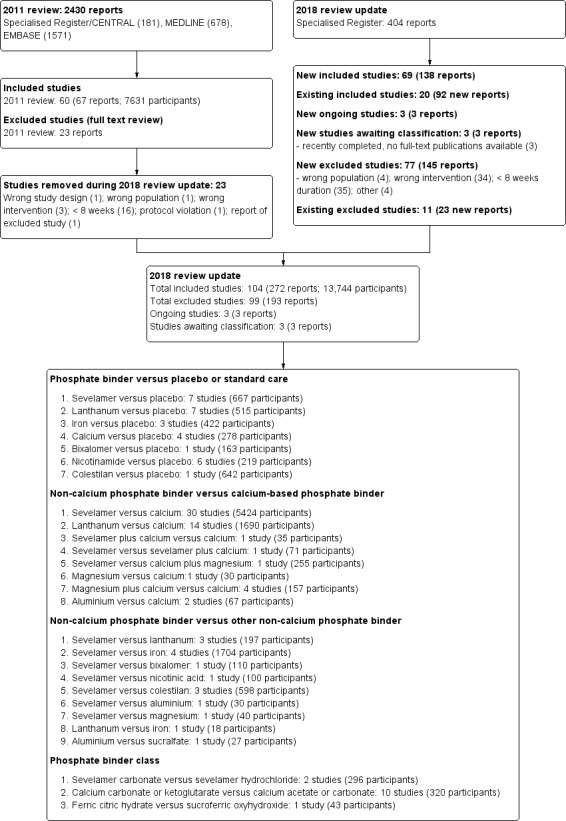
Flow diagram.
This 2018 review update therefore includes 104 studies (272 reports) involving 13,744 adult participants.
Included studies
The characteristics of the participants and the interventions in included studies are detailed in the Characteristics of included studies.
Study design, setting, and characteristics
Study duration varied from 8 weeks to 36 months (median 3.7 months). Twenty studies were a cross‐over study design in which participants were administered each of the study interventions sequentially with or without a washout period.
Studies were conducted in twenty‐nine different countries or regions including Australia (SLO‐NIACIN 2013; Toussaint 2009), Belgium (Tielmans 1990), Brazil (BRiC 2005; Lemos 2013), China (Chen 2014; Song 2014; Wang 2015b; Zhao 2014), Denmark (Bro 1998; Jespersen 1991; Rudnicki 1994), Egypt (Allam 2012) multiple European countries (CALMAG 2010; Evenepoel 2009; Hutchison 2005), France (Liabeuf 2017; NICOREN 2017; PREFECT 2014; Sadek 2003), Germany (Birck 1999; Deuber 2004), Greece (Katopodis 2006; Tzanakis 2014), Iran (Shahbazian 2011), Italy (De Santo 2006; Gallieni 2005; INDEPENDENT‐CKD 2012; INDEPENDENT‐HD 2009; Riccio 2018; Russo 2007), Japan (Akizawa 2000; Akizawa 2014a; Akizawa 2016; Fujii 2017; Fujimori 2017; Itoh 2008; Kakuta 2011; Kasai 2012; Matsushima 2017; Ohtake 2013; Shibata 2007; Shigematsu 2008; Takahara 2014; Wada 2014; Yokoyama 2014; Yokoyama 2014a), Japan and Taiwan (Chen 2011b; Toida 2012), Republic of Korea (Ko 2010; Lee 2013), Macedonia (Spasovski 2006), multinational (D'Haese 2003; Floege 2014; Locatelli 2013; Locatelli 2014; NCT00542815), Pakistan (Ahmed 2014; Saif 2007), Poland (Zwiech 2011), Portugal (Ferreira 2008), Saudi Arabia (Shaheen 2004), Spain (Almirall 1994; Caravaca 1992; Foraster 1998; Hervas 2003; Navarro‐Gonzalez 2011; Soriano 2013), Taiwan (Lee 2015b; Lin 2010; Lin 2014a; Liu 2006), Thailand (Aramwit 2012), The Netherlands (Janssen 1995; Janssen 1996), Turkey (Caglar 2008; Sezer 2010), the USA (Bleyer 1999; Block 2005; Block 2009; Block 2015; CARE‐2 2008; CARE 2004; Cheng 2008; Chennasamudram 2013; Chertow 1999; DCOR 2007; Delmez 1996; Delmez 2007; Fishbane 2010; Greenberg 1994; Isakova 2013; Qunibi 2011; Roxe 1989; Seifert 2013; Spiegel 2007; Sprague 2009a; Vlassara 2012; Young 2009a), and the USA and Europe (Chertow 2002). Forty‐six studies received at least some funding from companies that manufacture phosphate binders, while 41 studies provided no specific details about funding sources.
Study participants
The 104 studies included 13,744 randomised participants. Most studies involved participants with CKD G5D ((83 studies). Of these, 73 were among participants treated with haemodialysis, two involved participants treated with haemodialysis or peritoneal dialysis, and eight involved participants treated with peritoneal dialysis. Twenty studies involved participants with CKD G2 to G5 not requiring dialysis. In one study, the GFR category of CKD was not reported. The sample size varied from eight participants (De Santo 2006) to 2013 participants (DCOR 2007). The median number of participants was 69. The inclusion criteria included specific serum phosphate levels in 40 studies; the requirement for a phosphate binder in 26 studies; and was not specified in the remaining 38 studies. The mean study age ranged from 42.6 years (Saif 2007) to 68.9 years (Wang 2015b), with a median of 57.2 years.
Interventions
Details of interventions in each study are presented in the Characteristics of included studies. Twenty‐eight studies compared a phosphate binder with placebo or usual care (not including phosphate binder), 49 studies compared a calcium‐free binder with a calcium‐based binder, 16 studies compared a calcium‐free binder with a second calcium‐free binder class, and 14 studies compared two different drugs within the same binder class. In 77 studies, the phosphate binder was titrated to specific levels of serum phosphate, while in 25 studies, a fixed dose of phosphate binder was used. Specific approaches to phosphate binder therapy were not reported in two studies. Most placebo or usual care controlled studies were among participants with CKD G2 to G5 not requiring dialysis (15/25 studies involving 1467 participants) while most head to head studies involved participants with CKD G5D treated with dialysis (74/81 studies involving 10,364 participants).
Phosphate binder versus placebo or usual care
Sevelamer versus placebo or usual care (677 participants)
Sevelamer hydrochloride or carbonate was compared with placebo or usual care in seven studies involving 667 participants (Block 2009; Chen 2014; CRIB‐PHOS 2011; Liabeuf 2017; Lemos 2013; Riccio 2018; Russo 2007). Six of the seven studies involved participants with CKD G2 to G5 not requiring dialysis. Treatment duration and follow‐up ranged between 2 and 24 months with a median of 3 months.
Lanthanum versus placebo or usual care (515 participants)
Lanthanum carbonate was compared with placebo or usual care in seven studies involving 515 participants (Block 2009; Isakova 2013; PREFECT 2014; Seifert 2013; Sprague 2009a; Takahara 2014; Wang 2015b). Six of the seven studies evaluated therapy for participants with CKD G2 to G5 not requiring dialysis. Treatment and follow‐up ranged between 3 and 12 months with a median of 3 months.
Iron versus placebo or usual care (422 participants)
An iron‐based binder (ferric citrate, previously designated as JTT‐751) was compared with placebo or usual care in three studies involving 422 participants (Block 2015; Lee 2015b; Yokoyama 2014). Two of the three studies involved adults with CKD G2 to G5 not requiring dialysis. Treatment and follow‐up ranged between 1.8 and 3 months with a median of 2.75 months.
Calcium versus placebo or usual care (278 participants)
Calcium carbonate was compared with placebo in four studies (Block 2009; Qunibi 2011; Rudnicki 1994; Russo 2007) involving 278 participants. Three of the four studies evaluated treatment in patients with CKD G2 to G5 not requiring dialysis. Treatment and follow‐up ranged between 3 and 9 months with a median of 7 months.
Bixalomer versus placebo or usual care (163 participants)
Bixalomer is a non‐calcium, metal‐free non‐absorbable polymer which has been compared with placebo for 3 months among 163 participants with CKD G2 to G5 not requiring dialysis (Akizawa 2016).
Nicotinamide versus placebo or usual care (219 participants)
Nicotinamide (also known as nicotinic acid), while not a phosphate binder, inhibits active phosphate absorption from the gut. Nicotinamide was compared with placebo or usual care in six studies involving 219 participants (Allam 2012; Aramwit 2012; Cheng 2008; Shahbazian 2011; SLO‐NIACIN 2013; Young 2009a). All studies involved participants with CKD G5D. Treatment and follow‐up ranged between 1.8 and 3.7 months with a median of 2.4 months.
Colestilan versus placebo or usual care (642 participants)
Colestilan (also known as colestimide) was compared with placebo for three months in a single study involving 642 haemodialysis patients (Locatelli 2013).
Non‐calcium phosphate binder versus calcium phosphate binder
Sevelamer versus calcium (5424 participants)
Thirty studies (5424 participants) compared sevelamer hydrochloride or sevelamer carbonate with calcium carbonate or acetate (Ahmed 2014; Akizawa 2000; Bleyer 1999; Block 2005; Block 2009; BRiC 2005; Caglar 2008; CARE‐2 2008; CARE 2004; Chennasamudram 2013; Chertow 2002; DCOR 2007; De Santo 2006; Evenepoel 2009; Ferreira 2008; Gallieni 2005; Hervas 2003; INDEPENDENT‐CKD 2012; INDEPENDENT‐HD 2009; Kakuta 2011; Lin 2010; Lin 2014a; Liu 2006; Navarro‐Gonzalez 2011; Russo 2007; Sadek 2003; Sezer 2010; Shaheen 2004; Vlassara 2012; Zhao 2014). The duration of treatment ranged between 1.8 and 24 months with a median of 5.5 months. Nearly all studies (25) involved participants with CKD G5D treated with haemodialysis (24 studies) or peritoneal dialysis (1 study).
Lanthanum versus calcium (1690 participants)
Fourteen studies (1690 participants) compared lanthanum carbonate with calcium carbonate or acetate (Block 2009; D'Haese 2003; Fujii 2017; Hutchison 2005; Ko 2010; Lee 2013; Ohtake 2013; Shigematsu 2008; Song 2014; Soriano 2013; Spasovski 2006; Toida 2012; Toussaint 2009; Wada 2014). The duration of treatment ranged between 1.8 and 18 months with a median of 6 months. All but three studies involved participants with CKD G5D treated with haemodialysis (9 studies) or peritoneal dialysis (3 studies).
Sevelamer plus calcium versus calcium (35 participants)
Sevelamer hydrochloride plus calcium carbonate was compared with calcium carbonate for 36 months in 35 patients with CKD G5D treatment with haemodialysis (Shibata 2007).
Sevelamer versus calcium plus magnesium (255 participants)
Sevelamer hydrochloride was compared with calcium acetate plus magnesium carbonate for six months in 255 participants with CKD G5D treated with haemodialysis (CALMAG 2010).
Sevelamer versus sevelamer plus calcium (71 participants)
Sevelamer hydrochloride was compared with sevelamer hydrochloride plus calcium for 2.8 months in one study of 71 patients with CKD 5D treated with haemodialysis (Chertow 1999).
Magnesium versus calcium (30 participants)
Spiegel 2007 evaluated magnesium carbonate versus calcium carbonate treatment for 2.8 months among 30 dialysis patients.
Magnesium plus calcium versus magnesium (157 participants)
Combined magnesium and calcium therapy was compared with calcium alone in four studies (157 participants) (Deuber 2004; Evsanaa 2015; Spiegel 2007; Tzanakis 2014). All studies involved participants with CKD 5D treated with long‐term haemodialysis or peritoneal dialysis. Follow‐up ranged from three months to 30 months, with a median of 7.5 months.
Aluminium versus calcium (67 participants)
Aluminium hydroxide was compared with calcium carbonate or acetate over 6 to 12 months among 67 haemodialysis patients (Janssen 1996; Jespersen 1991).
Non‐calcium phosphate binder versus non‐calcium phosphate binder
Sevelamer versus lanthanum (197 participants)
Sevelamer hydrochloride or carbonate was compared with lanthanum carbonate in three studies (Block 2009; Kasai 2012; Pratt 2007) involving 197 participants. Two of the three studies involved participants with CKD 5D treated with haemodialysis. Follow‐up ranged from 2 months to 12 months.
Sevelamer versus iron (1704 participants)
Sevelamer hydrochloride or carbonate was compared with iron‐based binders (SBR759 (iron (III) starch/saccharose complex); sucroferric oxyhydroxide; ferric citrate) in four studies involving 1704 participants (Chen 2011b; Floege 2014; Koiwa 2017; Yokoyama 2014a). Three of the four studies involved participants with CKD G5D. Follow‐up ranged between 3 and 6 months, with a median of 3 months.
Sevelamer versus bixalomer (110 participants)
Akizawa 2014a evaluated sevelamer hydrochloride versus bixalomer over three months in 110 participants with CKD G5D treated with haemodialysis.
Sevelamer versus nicotinamide (100 participants)
Sevelamer hydrochloride was compared with nicotinamide for six months in one study (NICOREN 2017) involving 100 participants with CKD G5D treated with haemodialysis.
Sevelamer versus colestilan (598 participants)
Sevelamer was compared with colestilan in three studies involving 598 participants (Itoh 2008; Locatelli 2014; NCT00542815). All participants had CKD G5D treated with haemodialysis or peritoneal dialysis. Treatment and follow‐up continued for 1.9 to 12 months.
Sevelamer versus aluminium (30 participants)
Sevelamer hydrochloride was compared with aluminium hydroxide during treatment over 16 months in 30 participants with CKD G5D treated with peritoneal dialysis (Katopodis 2006).
Sevelamer versus magnesium (40 participants)
Zwiech 2011 compared sevelamer hydrochloride with magnesium carbonate during treatment of 3 months in 40 participants with CKD G5D treated with haemodialysis.
Lanthanum versus iron (18 participants)
Fujimori 2017 evaluated lanthanum carbonate versus ferric citrate for 3 months in 18 participants with CKD G5D treated with haemodialysis.
Aluminium versus sucralfate (27 participants)
Aluminium hydroxide was compared with sucralfate (not used in current clinical care) for 1.8 months in 27 participants with CKD G5D treated with haemodialysis (Roxe 1989).
Phosphate binder class
Sevelamer hydrochloride versus sevelamer carbonate (296 participants)
Sevelamer hydrochloride was compared with sevelamer carbonate in two studies involving 296 participants with CKD G5D treated with haemodialysis (Delmez 2007; Fishbane 2010). Treatment and follow‐up was for 5.5 and 12 months, respectively.
Calcium‐based binder versus calcium‐based binder (320 participants)
Calcium carbonate was compared with calcium acetate in eight studies (209 participants) (Almirall 1994; Caravaca 1992; Foraster 1998; Greenberg 1994; Janssen 1995; Janssen 1996; Tielmans 1990). Calcium ketoglutarate was compared with calcium acetate or carbonate in two studies involving 47 participants (Birck 1999; Bro 1998). All studies involved participants with CKD G5D treated with haemodialysis. Treatment and follow‐up ranged between 2 and 12 months with a median of 3 months.
Ferric citrate versus sucroferric oxyhydroxide (43 participants)
Ferric citrate was compared with sucroferric oxyhydroxide during three months of treatment among 43 participants with CKD G5D treated with haemodialysis (Matsushima 2017).
Excluded studies
In total, we excluded 99 studies (in 193 reports) as studies were not RCTs, were studies involving children, did not evaluate two different phosphate binders, or had follow‐up of less than eight weeks (Characteristics of excluded studies).
Risk of bias in included studies
The risk of bias for studies overall are summarised in Figure 2 and the risk of bias in each individual study is reported in Figure 3.
2.
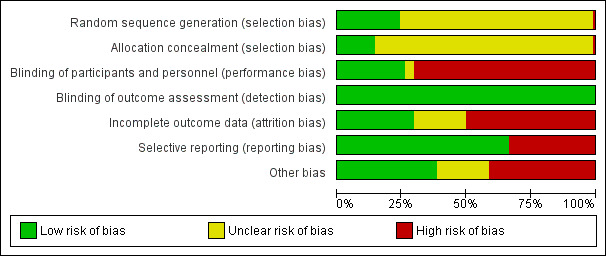
Risk of bias graph: review authors' judgements about each risk of bias item presented as percentages across all included studies.
Allocation
Methods for generating the random sequence were deemed to be at low risk of bias in 25 studies (Block 2005; Block 2009; Block 2015; BRiC 2005; CARE‐2 2008; Chertow 2002; Floege 2014; Liabeuf 2017; Greenberg 1994; INDEPENDENT‐CKD 2012; Katopodis 2006; Koiwa 2017; Lemos 2013; Locatelli 2013; Locatelli 2014; Navarro‐Gonzalez 2011; Ohtake 2013; Riccio 2018; Rudnicki 1994; Seifert 2013; SLO‐NIACIN 2013; Song 2014; Toida 2012; Toussaint 2009; Tzanakis 2014). The sequence did not appear to be random in one study, in which treatment group may have been based on serum phosphate levels (Fujii 2017). In the remaining 78 studies, the method for generating the random sequence was unclear.
Allocation concealment was adjudicated as low risk of bias in 15 studies (Block 2005; Block 2009; Block 2015; BRiC 2005; Floege 2014; Liabeuf 2017; Greenberg 1994; INDEPENDENT‐CKD 2012; Kakuta 2011; Koiwa 2017; NICOREN 2017; PREFECT 2014; Riccio 2018; Riccio 2018; Russo 2007; Toussaint 2009). The method to conceal allocation was deemed to be high risk in one study in which some participants could choose their treatment group (Tzanakis 2014). The risk of bias for allocation concealment was unclear in the remaining 88 studies.
Blinding
Twenty‐seven studies were blinded and considered to be at low risk of bias for performance bias (Akizawa 2016; Block 2009; Block 2015; CARE 2004; Chen 2014; Cheng 2008; CRIB‐PHOS 2011; Evsanaa 2015; Liabeuf 2017; Isakova 2013; Lee 2015b; Locatelli 2013; PREFECT 2014; Qunibi 2011; Riccio 2018; Rudnicki 1994; Seifert 2013; Shahbazian 2011; Shigematsu 2008; SLO‐NIACIN 2013; Sprague 2009a; Takahara 2014; Tielmans 1990; Toussaint 2009; Tzanakis 2014; Yokoyama 2014; Young 2009a). Blinding was unclear in four studies (Almirall 1994; Aramwit 2012; Matsushima 2017; Sezer 2010). The remaining 73 studies were not blinded and were considered at high risk of performance bias.
As most studies were based on laboratory assessment or patient‐centred outcomes including death, all studies were considered at low risk of bias for blinding of outcome assessment.
Incomplete outcome data
Thirty‐one studies met criteria for low risk of attrition bias (Almirall 1994; Aramwit 2012; Bleyer 1999; Block 2015; Caglar 2008; Chen 2011b; Chen 2014; Cheng 2008; CRIB‐PHOS 2011; Delmez 2007; Evsanaa 2015; Hervas 2003; INDEPENDENT‐HD 2009; Isakova 2013; Kasai 2012; Liu 2006; Navarro‐Gonzalez 2011; Riccio 2018; Rudnicki 1994; Russo 2007; Sezer 2010; Shahbazian 2011; Shaheen 2004; Shigematsu 2008; SLO‐NIACIN 2013; Spasovski 2006; Tzanakis 2014; Wada 2014; Wang 2015b; Young 2009a; Zhao 2014). Fifty‐two studies were considered at high risk of attrition bias when there was differential loss to follow‐up between treatment groups, high attrition rates (> 10%), or when adverse events were substantially higher in one or both treatment groups (Akizawa 2014a; Akizawa 2016; Allam 2012; Birck 1999; Block 2005; Block 2009; BRiC 2005; Bro 1998; CALMAG 2010; Caravaca 1992; CARE 2004; CARE‐2 2008; D'Haese 2003; DCOR 2007; Evenepoel 2009; Ferreira 2008; Fishbane 2010; Floege 2014; Fujimori 2017; Hutchison 2005; INDEPENDENT‐CKD 2012; Itoh 2008; Janssen 1995; Janssen 1996; Jespersen 1991; Kakuta 2011; Koiwa 2017; Lee 2013; Lee 2015b; Lemos 2013; Liabeuf 2017; Lin 2010; Lin 2014a; Locatelli 2013; Locatelli 2014; NCT00542815; NICOREN 2017; Ohtake 2013; PREFECT 2014; Qunibi 2011; Roxe 1989; Sadek 2003; Saif 2007; Seifert 2013; Seifert 2013; Sprague 2009a; Takahara 2014; Toida 2012; Toussaint 2009; Vlassara 2012; Yokoyama 2014; Yokoyama 2014a). In the remaining 21 studies, attrition bias was considered unclear. Loss to follow‐up was commonly due to death, transplantation, withdrawal of consent, protocol violation, or adverse events.
Selective reporting
Sixty‐nine studies reported expected and clinically‐relevant outcomes and were deemed to be at low risk of bias (Akizawa 2000; Akizawa 2014a; Akizawa 2016; Allam 2012; Aramwit 2012; Bleyer 1999; Block 2005; Block 2009; Block 2015; BRiC 2005; Bro 1998; CALMAG 2010; CARE‐2 2008; CARE 2004; Chen 2011b; Chen 2014; CRIB‐PHOS 2011; DCOR 2007; Delmez 2007; Evenepoel 2009; Fishbane 2010; Floege 2014; Gallieni 2005; Hutchison 2005; INDEPENDENT‐CKD 2012; INDEPENDENT‐HD 2009; Isakova 2013; Janssen 1995; Janssen 1996; Kakuta 2011; Kasai 2012; Katopodis 2006; Ko 2010; Koiwa 2017; Lee 2013; Lee 2015b; Lemos 2013; Liabeuf 2017; Lin 2010; Lin 2014a; Liu 2006; Locatelli 2013; Locatelli 2014; Matsushima 2017; NCT00542815; NICOREN 2017; Ohtake 2013; Pratt 2007; PREFECT 2014; Qunibi 2011; Riccio 2018; Sadek 2003; Seifert 2013; Sezer 2010; Shahbazian 2011; Shigematsu 2008; SLO‐NIACIN 2013; Spasovski 2006; Sprague 2009a; Takahara 2014; Tielmans 1990; Toida 2012; Toussaint 2009; Tzanakis 2014; Vlassara 2012; Wada 2014; Yokoyama 2014; Yokoyama 2014a; Zhao 2014). The remaining 35 studies did not report patient‐centred outcomes of death or adverse events.
Other potential sources of bias
Forty studies appeared to be free from other sources of bias (Allam 2012; Block 2005; Block 2009; Block 2015; BRiC 2005; Caglar 2008; CALMAG 2010; Caravaca 1992; CARE‐2 2008; Chertow 1999; Chertow 2002; CRIB‐PHOS 2011; Deuber 2004; Floege 2014; Hutchison 2005; INDEPENDENT‐CKD 2012; INDEPENDENT‐HD 2009; Isakova 2013; Itoh 2008; Kakuta 2011; Lemos 2013; Liabeuf 2017; Lin 2010; Locatelli 2013; Locatelli 2014; Riccio 2018; Russo 2007; Seifert 2013; Shahbazian 2011; Song 2014; Soriano 2013; Spiegel 2007; Toida 2012; Toussaint 2009; Tzanakis 2014; Vlassara 2012; Wada 2014; Wang 2015b; Yokoyama 2014a; Zhao 2014). Forty‐three studies had other sources of bias (Ahmed 2014; Akizawa 2014a; Akizawa 2016; Almirall 1994; Aramwit 2012; Birck 1999; Bleyer 1999; Bro 1998; CARE 2004; Chen 2011b; Chen 2014; Cheng 2008; Chennasamudram 2013; DCOR 2007; Delmez 1996; Delmez 2007; De Santo 2006; Evenepoel 2009; Evsanaa 2015; Ferreira 2008; Fishbane 2010; Greenberg 1994; Hervas 2003; Jespersen 1991; Ko 2010; Koiwa 2017; Lin 2014a; Liu 2006; Navarro‐Gonzalez 2011; NICOREN 2017; Ohtake 2013; PREFECT 2014; Qunibi 2011; Roxe 1989; Rudnicki 1994; Sadek 2003; Shaheen 2004; Shigematsu 2008; SLO‐NIACIN 2013; Spasovski 2006; Sprague 2009a; Takahara 2014; Young 2009a). It was unclear whether the remaining 21 studies had other sources of bias.
Effects of interventions
See: Table 1; Table 2; Table 3; Table 4; Table 5; Table 6
Summary of findings for the main comparison. Summary of findings: Sevelamer versus placebo/usual care.
| Sevelamer versus placebo or usual care for preventing and treating bone disease in people chronic kidney disease (CKD) | ||||||
|
Patient or population: people with CKD Setting: most studies involved people with CKD not requiring dialysis Intervention: sevelamer versus placebo or usual care | ||||||
| Outcomes | Illustrative comparative risks* (95% CI) | Relative effect (95% CI) | No. of participants (studies) | Quality of the evidence (GRADE) | Comments | |
| Assumed risk | Corresponding risk | |||||
| Placebo | Sevelamer | |||||
| Death (all causes) Follow‐up: 3 to 24 months (median 10 months) |
Low risk population |
RR 2.16 (0.20 to 22.8) |
248 (3) | ⊕⊝⊝⊝ very low1,5 | A single study reported 1 or more events. The studies were predominantly in CKD G2 to G5. Therefore, the evidence certainty for patients treated with dialysis (GFR 5D) is very low | |
| 8 per 1000 |
17 per 1000 (2 to 183) |
|||||
| Cardiovascular death | No data observations | Not estimable | No studies | No studies | Not estimable | ‐‐ |
|
Hypercalcaemia Follow‐up: 9 months |
18 per 1000 | 33 per 1000 | RR 1.90 (0.12 to 29.32) | 42 (1) | ⊕⊝⊝⊝ very low6 | A single study reported 1 event in each group |
|
Nausea Follow‐up: 2 to 9 months (median 3 months) |
30 per 1000 |
38 per 1000 (2 to 673) |
RR 1.27 (0.07 to 22.42) |
370 (3) | ⊕⊝⊝⊝ very low1,5 | The studies were predominantly in CKD G2 to G5. Therefore, the evidence certainty for patients treated with dialysis (GFR 5D) is very low |
|
Vomiting Follow‐up: 2.8 to 9 months |
10 per 1000 |
22 per 1000 (3 to 173) |
RR 2.09 (0.26 to 16.57) |
165 (2) | ⊕⊝⊝⊝ very low1,5 | The studies were predominantly in CKD G2 to G5. Therefore, the evidence certainty for patients treated with dialysis (GFR 5D) is very low |
|
Constipation Follow‐up: 2 to 9 months (median 3 months) |
10 per 1000 |
71 per 1000 (23 to 218) |
RR 6.92 (2.24 to 21.38) |
430 (4) | ⊕⊕⊝⊝ low1,3 |
The studies were predominantly in CKD G2 to G5. Therefore, the evidence certainty for patients treated with dialysis (GFR 5D) is very low |
|
Serum phosphate level Follow‐up: 2 to 10 months (median 3 months) |
The mean serum phosphate level in the placebo group was 4.48 mg/dL | The mean serum phosphate level in the sevelamer group was 0.28 mg/dL lower (0.39 higher to 0.94 lower) | ‐‐ | 483 (5) | ⊕⊝⊝⊝ very low1,2,3 |
The studies were predominantly in CKD G2 to G5. Therefore, the evidence certainty for patients treated with dialysis (GFR 5D) is very low |
|
Coronary artery calcification score Follow‐up: 24 months (both studies) |
The mean coronary artery calcium score in the placebo group was 945 | The mean coronary artery calcium score in the sevelamer group was 70 lower (362 lower to 222 higher) |
‐‐ | 115 (2) | ⊕⊝⊝⊝ very low1,5 | The studies were predominantly in CKD G2 to G5. Therefore, the evidence certainty for patients treated with dialysis (GFR 5D) is very low |
| *The basis for the assumed risk (e.g. the median control group risk across studies) is provided in footnotes. The corresponding risk (and its 95% confidence interval) is based on the assumed risk in the comparison group and the relative effect of the intervention (and its 95% CI). CI: Confidence interval; RR: Risk Ratio | ||||||
| GRADE Working Group grades of evidence High quality: Further research is very unlikely to change our confidence in the estimate of effect. Moderate quality: Further research is likely to have an important impact on our confidence in the estimate of effect and may change the estimate. Low quality: Further research is very likely to have an important impact on our confidence in the estimate of effect and is likely to change the estimate. Very low quality: We are very uncertain about the estimate. | ||||||
The assumed risk is the event rate per annum in the control arm of included studies
1 Evidence certainty was downgraded by one level due to study limitations. Most studies had unclear risks for random sequence generation and allocation concealment and were not blinded (participants or investigators)
2 Evidence certainty was downgraded by one level due to moderate or substantial between‐study heterogeneity
3 Evidence certainty was downgraded by one level due to imprecision
4 Evidence certainty was downgraded by one level due to publication bias
5 Evidence certainty was downgraded by two levels due to severe imprecision
6 Data came from only one study
Summary of findings 2. Summary of findings: Lanthanum versus placebo/usual care.
| Lanthanum versus placebo or usual care for preventing and treating bone disease in people chronic kidney disease (CKD) | ||||||
|
Patient or population: people with CKD Setting: most studies involved people with CKD not requiring dialysis Intervention: lanthanum versus placebo or usual care | ||||||
| Outcomes | Illustrative comparative risks* (95% CI) | Relative effect (95% CI) | No. of participants (studies) | Quality of the evidence (GRADE) | Comments | |
| Assumed risk | Corresponding risk | |||||
| Placebo or standard care | Lanthanum | |||||
| Death (all causes) Follow‐up: 1.8 to 12 months (median 3 months) |
Low risk population |
RR 1.63 (0.07 to 37.12) |
214 (3) | ⊕⊝⊝⊝ very low1,5,6 | A single death was reported among three studies. The studies were predominantly in CKD G2 to G5. Therefore, the evidence certainty for patients treated with dialysis (GFR 5D) is very low | |
| 0 per 1000 | 0 per 1000 | |||||
| Cardiovascular death | No data observations | Not estimable | No studies | No studies | Not estimable | ‐‐ |
|
Nausea Follow‐up: 1.8 to 12 months (median 2 months) |
23 per 1000 |
87 per 1000 (32 to 237) |
RR 3.72 (1.36 to 10.18) |
383 (4) | ⊕⊕⊝⊝ low1,3 |
The studies were predominantly in CKD G2 to G5. Therefore, the evidence certainty for patients treated with dialysis (GFR 5D) is very low |
|
Vomiting Follow‐up: 1.8 to 9 months (median 3 months) |
32 per 1000 |
89 per 1000 (13 to 601) |
RR 2.76 (0.41 to 18.63) |
261 (3) | ⊕⊝⊝⊝ very low1,5 | The studies were predominantly in CKD G2 to G5. Therefore, the evidence certainty for patients treated with dialysis (GFR 5D) is very low |
|
Constipation Follow‐up: 1.8 to 9 months (median 3 months) |
35 per 1000 |
104 per 1000 (42 to 255) |
RR 2.98 (1.21 to 7.30) |
299 (4) | ⊕⊕⊕⊝ moderate1 |
The studies were predominantly in CKD G2 to G5. Therefore, the evidence certainty for patients treated with dialysis (GFR 5D) is very low |
|
Serum phosphate level Follow‐up: 1.8 to 12 months (median 3 months) |
The mean serum phosphate level in the placebo group was 4.7 mg/dL | The mean serum phosphate level in the lanthanum group was 0.48 mg/dL lower (0.05 to 0.90 lower) |
‐‐ | 171 (4) | ⊕⊕⊝⊝ low1,2 |
The studies were predominantly in CKD G2 to G5. Therefore, the evidence certainty for patients treated with dialysis (GFR 5D) is very low |
|
Coronary artery calcification score Follow‐up: 12 months |
The mean coronary artery calcification score in the placebo group was 23 mm3 | The mean coronary artery calcification score in the lanthanum group was3 mm3 higher (9.86 lower to 15.86 higher) | ‐‐ | 38 (1) | ⊕⊝⊝⊝ very low6 | A single study reported this outcome |
| *The basis for the assumed risk (e.g. the median control group risk across studies) is provided in footnotes. The corresponding risk (and its 95% confidence interval) is based on the assumed risk in the comparison group and the relative effect of the intervention (and its 95% CI). CI: Confidence interval; RR: Risk Ratio | ||||||
| GRADE Working Group grades of evidence High quality: Further research is very unlikely to change our confidence in the estimate of effect. Moderate quality: Further research is likely to have an important impact on our confidence in the estimate of effect and may change the estimate. Low quality: Further research is very likely to have an important impact on our confidence in the estimate of effect and is likely to change the estimate. Very low quality: We are very uncertain about the estimate. | ||||||
The assumed risk is the event rate per annum in the control arm of included studies
1 Evidence certainty was downgraded by one level due to study limitations. Most studies had unclear risks for random sequence generation and allocation concealment and were not blinded (participants or investigators)
2 Evidence certainty was downgraded by one level due to moderate or substantial between‐study heterogeneity
3 Evidence certainty was downgraded by one level due to imprecision
4 Evidence certainty was downgraded by one level due to publication bias
5 Evidence certainty was downgraded by two levels due to severe imprecision
6 Data came from only one study
Summary of findings 3. Summary of findings: Iron versus placebo/usual care.
| Iron versus placebo or usual care for preventing and treating bone disease in people chronic kidney disease (CKD) | ||||||
|
Patient or population: people with CKD Setting: dialysis (1 study) and CKD (2 studies) Intervention: iron versus placebo or usual care | ||||||
| Outcomes | Illustrative comparative risks* (95% CI) | Relative effect (95% CI) | No. of participants (studies) | Quality of the evidence (GRADE) | Comments | |
| Assumed risk | Corresponding risk | |||||
| Placebo or standard care | Iron | |||||
| Death (all causes) Follow‐up: 2.75 to 3 months |
19 per 1000 |
10 per 1000 (1 to 89) |
RR 0.52 (0.06 to 4.65) |
239 (2) | ⊕⊕⊝⊝ low1,3 |
The studies were predominantly in CKD G2 to G5. Therefore, the evidence certainty for patients treated with dialysis (GFR 5D) is very low |
| Cardiovascular death | No data observations | Not estimable | No studies | No studies | Not estimable | ‐‐ |
| Hypercalcaemia | No data observations | Not estimable | No studies | No studies | Not estimable | ‐‐ |
| Nausea | 68 per 1000 |
67 per 1000 (20 to 221) |
RR 0.99 (0.30 to 3.27) | 149 (1) | ⊕⊝⊝⊝ very low6 | A single study reported this outcome |
| Vomiting | No data observations | Not estimable | Not estimable | No studies | Not estimable | ‐‐ |
|
Constipation Follow‐up: 1.8 to 3 months (median 2.75 months) |
43 per 1000 |
114 per 1000 (49 to 262) |
RR 2.66 (1.15 to 6.12) |
422 (3) | ⊕⊕⊕⊝ moderate1 |
The studies were predominantly in CKD G2 to G5. Therefore, the evidence certainty for patients treated with dialysis (GFR 5D) is very low |
|
Serum phosphate level Follow‐up: 1.8 to 3 months (median 2.75 months) |
The mean serum phosphate level in the placebo group was 5.8 mg/dL | The mean serum phosphate in the iron group was 1.33 mg/dL lower (0.41 to 2.25 lower) |
‐‐ | 422 (3) | ⊕⊕⊝⊝ low1,2 |
The studies were predominantly in CKD G2 to G5. Therefore, the evidence certainty for patients treated with dialysis (GFR 5D) is very low |
| Coronary artery calcification score | No data observations | Not estimable | Not estimable | No studies | Not estimable | ‐‐ |
| *The basis for the assumed risk (e.g. the median control group risk across studies) is provided in footnotes. The corresponding risk (and its 95% confidence interval) is based on the assumed risk in the comparison group and the relative effect of the intervention (and its 95% CI). CI: Confidence interval; RR: Risk Ratio | ||||||
| GRADE Working Group grades of evidence High quality: Further research is very unlikely to change our confidence in the estimate of effect. Moderate quality: Further research is likely to have an important impact on our confidence in the estimate of effect and may change the estimate. Low quality: Further research is very likely to have an important impact on our confidence in the estimate of effect and is likely to change the estimate. Very low quality: We are very uncertain about the estimate. | ||||||
The assumed risk is the event rate per annum in the control arm of included studies
1 Evidence certainty was downgraded by one level due to study limitations. Most studies had unclear risks for random sequence generation and allocation concealment and were not blinded (participants or investigators)
2 Evidence certainty was downgraded by one level due to moderate or substantial between‐study heterogeneity
3 Evidence certainty was downgraded by one level due to imprecision
4 Evidence certainty was downgraded by one level due to publication bias
5 Evidence certainty was downgraded by two levels due to severe imprecision
6 Data came from only one study
Summary of findings 4. Summary of findings: Calcium versus placebo/usual care.
| Calcium versus placebo or usual care for preventing and treating bone disease in people chronic kidney disease (CKD) | ||||||
|
Patient or population: people with CKD Setting: Most studies involved people with CKD not requiring dialysis Intervention: calcium versus placebo or usual care | ||||||
| Outcomes | Illustrative comparative risks* (95% CI) | Relative effect (95% CI) | No. of participants (studies) | Quality of the evidence (GRADE) | Comments | |
| Assumed risk | Corresponding risk | |||||
| Placebo | Calcium | |||||
| Death (all causes) | 47 per 1000 |
22 per 1000 (2 to 203) |
RR 0.46 (0.05 to 4.32) |
110 (1) | ⊕⊝⊝⊝ very low6 | A single study reported this outcome |
| Cardiovascular death | No data observations | Not estimable | Not estimable | No studies | Not estimable | ‐‐ |
|
Hypercalcaemia Follow‐up: 3 to 9 months |
8 per 1000 |
56 per 1000 (13 to 248) |
RR 7.28 (1.64 to 32.2) |
215 (3) | ⊕⊕⊝⊝ low1,3 |
The studies were predominantly in CKD G2 to G5. Therefore, the evidence certainty for patients treated with dialysis (GFR 5D) is very low |
|
Nausea Follow‐up: 3 to 9 months |
66 per 1000 |
38 per 1000 (10 to 144) |
RR 0.58 (0.15 to 2.18) |
197 (2) | ⊕⊕⊝⊝ low1,3 |
The studies were predominantly in CKD G2 to G5. Therefore, the evidence certainty for patients treated with dialysis (GFR 5D) is very low |
| Vomiting | No data observations | Not estimable | Not estimable | No studies | Not estimable | ‐‐ |
|
Constipation Follow‐up: 3 to 9 months |
66 per 1000 |
161 per 1000 Not estimable |
RR 2.44 (0.32 to 18.4) |
197 (2) | ⊕⊝⊝⊝ very low1,5 | The studies were predominantly in CKD G2 to G5. Therefore, the evidence certainty for patients treated with dialysis (GFR 5D) is very low |
|
Serum phosphate level Follow‐up: 5.5 to 24 months (median 9 months) |
The mean serum phosphate level in the placebo group was 5.0 mg/dL | The mean serum phosphate level in the calcium group was 0.18 mg/dL lower (0.95 higher to 1.30 lower) | ‐‐ | 151 (3) | ⊕⊝⊝⊝ very low1,2,3 |
The studies were predominantly in CKD G2 to G5. Therefore, the evidence certainty for patients treated with dialysis (GFR 5D) is very low |
| Coronary artery calcification score | The mean coronary artery calcification score in the placebo group was 473 | The mean coronary artery calcification score in the calcium group was 74 lower (443 lower to 295 higher) | ‐‐ | 60 (1) | ⊕⊝⊝⊝ very low6 | A single study reported this outcome |
| *The basis for the assumed risk (e.g. the median control group risk across studies) is provided in footnotes. The corresponding risk (and its 95% confidence interval) is based on the assumed risk in the comparison group and the relative effect of the intervention (and its 95% CI). CI: Confidence interval; RR: Risk Ratio | ||||||
| GRADE Working Group grades of evidence High quality: Further research is very unlikely to change our confidence in the estimate of effect. Moderate quality: Further research is likely to have an important impact on our confidence in the estimate of effect and may change the estimate. Low quality: Further research is very likely to have an important impact on our confidence in the estimate of effect and is likely to change the estimate. Very low quality: We are very uncertain about the estimate. | ||||||
The assumed risk is the event rate per annum in the control arm of included studies
1 Evidence certainty was downgraded by one level due to study limitations. Most studies had unclear risks for random sequence generation and allocation concealment and were not blinded (participants or investigators)
2 Evidence certainty was downgraded by one level due to moderate or substantial between‐study heterogeneity
3 Evidence certainty was downgraded by one level due to imprecision
4 Evidence certainty was downgraded by one level due to publication bias
5 Evidence certainty was downgraded by two levels due to severe imprecision
6 Data came from only one study
Summary of findings 5. Summary of findings: Sevelamer versus calcium.
| Sevelamer versus calcium for preventing and treating bone disease people with in chronic kidney disease (CKD) | ||||||
|
Patient or population: people with CKD Setting: most studies involved people treated with dialysis Intervention: sevelamer versus calcium | ||||||
| Outcomes | Illustrative comparative risks* (95% CI) | Relative effect (95% CI) | No. of participants (studies) | Certainty of the evidence (GRADE) | Comments | |
| Assumed risk | Corresponding risk | |||||
| Calcium | Sevelamer | |||||
|
Death (all causes) Follow‐up: 1.8 to 36 months (median 5.5 months) |
Low risk population (CKD G2 to G5) |
RR 0.53 (0.30 to 0.91) |
3688 (16) | ⊕⊕⊝⊝ low1,2 | The studies were predominantly in CKD G5D Therefore, the evidence certainty for patients with CKD G2 to G5 is very low | |
| 124 per 1000 |
79 per 1000 (27 to 227) |
|||||
| High risk population (CKD G5D) | ||||||
| 210 per 1000 |
105 per 1000 (55 to 199) |
|||||
|
Cardiovascular death Follow‐up: 3 to 36 months (median 12 months) |
Low risk population (CKD G2 to G5) |
RR 0.45 (0.11 to 1.77) |
2829 (6) | ⊕⊝⊝⊝ very low1,2,3 | The studies were predominantly in CKD G5D Therefore, the evidence certainty for patients with CKD G2 to G5 is very low | |
| 92 per 1000 |
34 per 1000 (1 to 1000) |
|||||
| High risk population (CKD G5D) | ||||||
| 132 per 1000 |
112 per 1000 (11 to 177) |
|||||
|
Hypercalcaemia Follow‐up: 1.8 to 36 months (median 5.5 months) |
139 per 1000 | 42 per 1000 (28 to 60) |
RR 0.30 (0.20 to 0.43) |
4084 (19) | ⊕⊝⊝⊝ very low1,2,4 | The studies were predominantly in CKD G5D Therefore, the evidence certainty for patients with CKD G2 to G5 is very low |
|
Nausea Follow‐up: 2 to 12 months (median 9 months) |
125 per 1000 | 123 per 1000 (70 to 214) |
RR 0.98 (0.56 to 1.71) |
365 (4) | ⊕⊕⊝⊝ low1,3 | The studies were predominantly in CKD G5D Therefore, the evidence certainty for patients with CKD G2 to G5 is very low |
|
Vomiting Follow‐up: 9 to 12 months |
158 per 1000 |
150 per 1000 (85 to 267) |
RR 0.95 (0.54 to 1.69) |
263 (2) | ⊕⊕⊝⊝ low1,3 | The studies were predominantly in CKD G5D Therefore, the evidence certainty for patients with CKD G2 to G5 is very low |
|
Constipation Follow‐up: 2 to 20 months (median 12 months) |
13 per 1000 | 17 per 1000 (9 to 33) |
RR 1.35 (0.71 to 2.57) |
2652 (6) | ⊕⊕⊝⊝ low1,3 | The studies were predominantly in CKD G5D Therefore, the evidence certainty for patients with CKD G2 to G5 is very low |
|
Serum phosphate level Follow‐up: 1.8 to 36 months (median 5.5 months) |
The mean serum phosphate level in the calcium group was 5.39 mg/dL | The mean serum phosphate level in the sevelamer group was
0.06 mg/dL higher (0.11 lower to 0.23 higher) |
‐‐ | 4360 (23) | ⊕⊝⊝⊝ very low1,2,3 | The studies were predominantly in CKD G5D Therefore, the evidence certainty for patients with CKD G2 to G5 is very low |
|
Coronary artery calcium score Follow‐up: 12‐24 months (median 12 months) |
The mean coronary artery calcium score in the calcium group was 923 | The mean coronary artery calcium score in the sevelamer group was 25 lower (76 lower to 26 higher) |
‐‐ | 517 (4) | ⊕⊕⊝⊝ low1,3 | The studies were predominantly in CKD G5D Therefore, the evidence certainty for patients with CKD G2 to G5 is very low |
| *The basis for the assumed risk (e.g. the median control group risk across studies) is provided in footnotes. The corresponding risk (and its 95% confidence interval) is based on the assumed risk in the comparison group and the relative effect of the intervention (and its 95% CI). CI: Confidence interval; RR: Risk Ratio | ||||||
| GRADE Working Group grades of evidence High certainty: Further research is very unlikely to change our confidence in the estimate of effect. Moderate certainty: Further research is likely to have an important impact on our confidence in the estimate of effect and may change the estimate. Low certainty: Further research is very likely to have an important impact on our confidence in the estimate of effect and is likely to change the estimate. Very low certainty: We are very uncertain about the estimate. | ||||||
The assumed risk is the median incidence of the event in the control arm of included studies. Where there was a wide range of reported incidence (for example, Death (all causes) ranged from 10 per 1000 to 340 per 1000), two levels of risk (high and low) were generated for calculation of absolute risks
1 Evidence certainty was downgraded by one level due to study limitations. Most studies had unclear risks for random sequence generation and allocation concealment and were not blinded (participants or investigators)
2 Evidence certainty was downgraded by one level due to moderate or substantial between‐study heterogeneity
3 Evidence certainty was downgraded by one level due to imprecision
4 Evidence certainty was downgraded by one level due to publication bias
Summary of findings 6. Summary of findings ‐ Lanthanum versus calcium.
| Lanthanum versus calcium for preventing and treating bone disease people with in chronic kidney disease (CKD) | ||||||
|
Patient or population: patients with CKD Setting: most studies involved people treated with dialysis Intervention: lanthanum versus calcium | ||||||
| Outcomes | Illustrative comparative risks* (95% CI) | Relative effect (95% CI) | No. of participants (studies) | Quality of the evidence (GRADE) | Comments | |
| Assumed risk | Corresponding risk | |||||
| Calcium | Lanthanum | |||||
| Death (all causes) Follow‐up: 1.8 to 18 months (median 6 months) |
High risk population (CKD G5D) |
RR 0.76 (0.18 to 3.11) |
505 (6) | ⊕⊕⊝⊝ low1,3 | The studies were in CKD G5D | |
| 15 per 1000 |
12 per 1000 (3 to 48) |
|||||
| Cardiovascular death | No data observations | Not estimable | No studies | No studies | Not estimable | ‐‐ |
|
Hypercalcaemia Follow‐up: 1.8 to 12 months (median 6 months) |
240 per 1000 | 38 per 1000 (14 to 103) |
RR 0.16 (0.06 to 0.43) |
1347 (8) | ⊕⊕⊝⊝ low1,2 | The studies were predominantly in CKD G5D Therefore, the evidence certainty for patients with CKD G2 to G5 is very low |
|
Nausea Follow‐up: 1.8 to 12 months (median 6 months) |
88 per 1000 | 145 per 1000 (84 to 254) |
RR 1.65 (0.95 to 2.89) |
1191 (5) | ⊕⊕⊝⊝ low1,3 | The studies were predominantly in CKD G5D Therefore, the evidence certainty for patients with CKD G2 to G5 is very low |
|
Vomiting Follow‐up: 1.8 to 6 months |
78 per 1000 |
301 per 1000 (37 to 1000) |
RR 3.88 (0.48 to 31.7) |
1058 (2) | ⊕⊝⊝⊝ very low1,3,5 | The studies were predominantly in CKD G5D Therefore, the evidence certainty for patients with CKD G2 to G5 is very low |
|
Constipation Follow‐up: 1.8 to 18 months (median 6 months) |
67 per 1000 | 53 per 1000 (33 to 84) |
RR 0.79 (0.50 to 1.26) |
1213 (5) | ⊕⊕⊝⊝ low1,3 | The studies were predominantly in CKD G5D Therefore, the evidence certainty for patients with CKD G2 to G5 is very low |
|
Serum phosphate level Follow‐up: 3 to 12 months (median 6 months) |
The mean serum phosphate level in the calcium group was 5.39 mg/dL | The mean serum phosphate level in the lanthanum group was 0.01 mg/dL lower (0.42 higher to 0.43 lower) | ‐‐ | 400 (9) | ⊕⊝⊝⊝ very low1,2,3 | It was not possible to assess for publication bias due to substantial between‐study heterogeneity. The studies were predominantly in CKD G5D Therefore, the evidence certainty for patients with CKD G2 to G5 is very low |
|
Coronary artery calcium score Follow‐up: 6 months |
The mean coronary artery calcium score in the calcium group was 1640 | The mean coronary artery calcium score in the lanthanum group was 57 lower (1308 lower to 5 higher) | ‐‐ | 42 (1) | ⊕⊝⊝⊝ very low6 | A single study reported 1 or more events |
| *The basis for the assumed risk (e.g. the median control group risk across studies) is provided in footnotes. The corresponding risk (and its 95% confidence interval) is based on the assumed risk in the comparison group and the relative effect of the intervention (and its 95% CI). CI: Confidence interval; RR: Risk Ratio. | ||||||
| GRADE Working Group grades of evidence High quality: Further research is very unlikely to change our confidence in the estimate of effect. Moderate quality: Further research is likely to have an important impact on our confidence in the estimate of effect and may change the estimate. Low quality: Further research is very likely to have an important impact on our confidence in the estimate of effect and is likely to change the estimate. Very low quality: We are very uncertain about the estimate. | ||||||
The assumed risk is the event rate per annum in the control arm of the control arm of included studies. Where there was a wide range of reported incidence (for example, Death (all causes) ranged from 10 per 1000 to 340 per 1000), two levels of risk (high and low) were generated for calculation of absolute risks.
1 Evidence certainty was downgraded by one level due to study limitations. Most studies had unclear risks for random sequence generation and allocation concealment and were not blinded (participants or investigators)
2 Evidence certainty was downgraded by one level due to moderate or substantial between‐study heterogeneity
3 Evidence certainty was downgraded by one level due to imprecision
4 Evidence certainty was downgraded by one level due to publication bias
5 Evidence certainty was downgraded by two levels due to severe imprecision
6 Data came from only one study
Sevelamer versus placebo or usual care
The major outcomes for the comparison of sevelamer with placebo or usual care are shown in the Table 1. Evidence was generally restricted to people with CKD G2 to G5 not requiring dialysis.
No study was designed to evaluate death or cardiovascular events. In the three studies comparing sevelamer with placebo or usual care, deaths were reported as reasons for drop‐out from study follow‐up. A single study reported one or more deaths during a median of 10 months (Lemos 2013). In very low certainty evidence, sevelamer had uncertain effects on death (all causes) (RR 2.16, 95% CI 0.20 to 22.84) (Analysis 1.1). No studies reported whether deaths due to cardiovascular events occurred. Two studies each reported one participant experiencing a myocardial infarction (Liabeuf 2017; Russo 2007), while a third posted zero events on a studies registry web site (Block 2009). Whether sevelamer prevents myocardial infarction is uncertain due to very low certainty evidence (Analysis 1.2 RR 1.00, 95% CI 0.11 to 9.35). A single study reported one stroke event in the sevelamer group on www.ClinicalTrials.gov (Block 2009) (Analysis 1.3). One study reported no difference in the number of patients requiring hospitalisation during follow‐up (CRIB‐PHOS 2011) (Analysis 1.4).
1.1. Analysis.
Comparison 1 Sevelamer versus placebo or usual care, Outcome 1 Death (all causes).
1.2. Analysis.
Comparison 1 Sevelamer versus placebo or usual care, Outcome 2 Myocardial infarction.
1.3. Analysis.
Comparison 1 Sevelamer versus placebo or usual care, Outcome 3 Stroke.
1.4. Analysis.
Comparison 1 Sevelamer versus placebo or usual care, Outcome 4 Hospitalisation.
Block 2009 reported two fracture events in the control group (Analysis 1.5) and one participant experienced pruritus during follow‐up in the control group (Analysis 1.6).
1.5. Analysis.
Comparison 1 Sevelamer versus placebo or usual care, Outcome 5 Fracture.
1.6. Analysis.
Comparison 1 Sevelamer versus placebo or usual care, Outcome 6 Pruritus.
With respect to adverse events, nausea was reported in three studies (370 participants) in a meta‐analysis marked by substantial heterogeneity. In very low certainty evidence, sevelamer had uncertain risks of nausea (Analysis 1.7: RR 1.27, 95% CI 0.07 to 22.42; I2 = 71%). In low‐ or very‐low certainty evidence, sevelamer had uncertain risks of vomiting (Analysis 1.8 (2 studies, 165 participants): RR 2.09, 95% CI 0.26 to 16.57; I2 = 0%), abdominal pain (Analysis 1.9 (3 studies, 370 participants): RR 0.38, 95% CI 0.13 to 1.14; I2 = 0%), and diarrhoea (Analysis 1.11 (2 studies, 1965 participants): RR 2.02, 95% CI 0.13 to 31.62; I2 = 66%). Liabeuf 2017 reported no difference in abdominal bloating between the two groups (Analysis 1.12). Compared with placebo or usual care, sevelamer may lead to an increased risk of constipation (Analysis 1.10 (4 studies, 430 participants): RR 6.92, 95% CI 2.24 to 21.38; I2 = 0%; low certainty evidence).
1.7. Analysis.
Comparison 1 Sevelamer versus placebo or usual care, Outcome 7 Nausea.
1.8. Analysis.
Comparison 1 Sevelamer versus placebo or usual care, Outcome 8 Vomiting.
1.9. Analysis.
Comparison 1 Sevelamer versus placebo or usual care, Outcome 9 Abdominal pain.
1.11. Analysis.
Comparison 1 Sevelamer versus placebo or usual care, Outcome 11 Diarrhoea.
1.12. Analysis.
Comparison 1 Sevelamer versus placebo or usual care, Outcome 12 Abdominal bloating.
1.10. Analysis.
Comparison 1 Sevelamer versus placebo or usual care, Outcome 10 Constipation.
Two studies reported ESKD; Riccio 2018 reported no events during treatment while Lemos 2013 reported 12 events (7 in the sevelamer group and 5 in the placebo group). In very low certainty evidence, sevelamer had uncertain effects on the need for renal replacement therapy (Analysis 1.13 (2 studies, 139 participants): RR 1.51, 95% CI 0.52 to 4.36; I2 = 0%).
1.13. Analysis.
Comparison 1 Sevelamer versus placebo or usual care, Outcome 13 End‐stage kidney disease.
At 24 months, the mean coronary artery calcium score measured by multislice computed tomography was 434 with placebo or usual care and 70 points lower (362 lower to 222 higher) with sevelamer (Analysis 1.14 (2 studies, 155 participants): MD ‐70.19, 95% CI ‐362.44 to 222.06; I2 = 0%; very low certainty evidence).
1.14. Analysis.
Comparison 1 Sevelamer versus placebo or usual care, Outcome 14 Coronary artery calcium score.
With respect to biochemical responses to therapy, at a median of 3 months the mean serum phosphate level was 0.28 mg/dL (0.09 mmol/L) lower (0.94 mg/dL lower to 0.39 mg/dL higher (‐0.30 to 0.13 mmol/L) with sevelamer (Analysis 1.15) in an analysis characterised by substantial heterogeneity (I2 = 95%) (leading to very low certainty). Compared with placebo or usual care, sevelamer did not have clinically important effects on serum calcium (MD 0.03 mg/dL (0.0085 mmol/L), 95% CI ‐0.08 to 0.14 (0.02 to 0.04 mmol/L); I2 = 72%) (Analysis 1.16). The impact of treatment on hypercalcaemia (Analysis 1.17) was uncertain. Sevelamer had uncertain effects on the serum calcium‐by‐phosphate product (MD 2.66 mg2/dL2, 95% CI ‐5.52 to 10.84; I2 = 98%) (Analysis 1.18), serum iPTH (MD ‐6.55 pg/mL (0.74 pmol/L), 95% CI ‐21.16 to 8.07 (‐2.41 to 0.92 pmol/L); I2 = 0%) (Analysis 1.19), serum alkaline phosphatase (Analysis 1.20), serum bicarbonate (MD 0.12 mEq/L, 95% CI ‐1.30 to 1.54; I2 = 82%) (Analysis 1.21), eGFR (MD ‐0.45 mL/min, 95% CI ‐4.74 to 3.85; I2 = 45%) (Analysis 1.22), and bone mineral density measured at the hip or spine (Analysis 1.23; Analysis 1.24). Serum FGF23 levels were not reported in a format that was extractable for meta‐analysis. CRIB‐PHOS 2011 reported no difference in Klotho levels between the two groups (Analysis 1.25).
1.15. Analysis.
Comparison 1 Sevelamer versus placebo or usual care, Outcome 15 Serum phosphate.
1.16. Analysis.
Comparison 1 Sevelamer versus placebo or usual care, Outcome 16 Serum calcium.
1.17. Analysis.
Comparison 1 Sevelamer versus placebo or usual care, Outcome 17 Hypercalcaemia.
1.18. Analysis.
Comparison 1 Sevelamer versus placebo or usual care, Outcome 18 Serum calcium‐by‐phosphate product.
1.19. Analysis.
Comparison 1 Sevelamer versus placebo or usual care, Outcome 19 Serum iPTH.
1.20. Analysis.
Comparison 1 Sevelamer versus placebo or usual care, Outcome 20 Serum alkaline phosphatase.
1.21. Analysis.
Comparison 1 Sevelamer versus placebo or usual care, Outcome 21 Serum bicarbonate.
1.22. Analysis.
Comparison 1 Sevelamer versus placebo or usual care, Outcome 22 eGFR.
1.23. Analysis.
Comparison 1 Sevelamer versus placebo or usual care, Outcome 23 Bone mineral density: lumbar spine.
1.24. Analysis.
Comparison 1 Sevelamer versus placebo or usual care, Outcome 24 Bone mineral density: hip.
1.25. Analysis.
Comparison 1 Sevelamer versus placebo or usual care, Outcome 25 Klotho.
Lanthanum versus placebo or usual care
The major outcomes for the comparison of lanthanum with placebo or usual care are shown in the Table 2.
None of the seven studies were designed to measure death or cardiovascular events. Studies generally involved people with CKD G2 to G5 not requiring dialysis.
Three studies reported death as either a reason for study drop‐out or as an adverse event. PREFECT 2014 reported a single death in the lanthanum group. Compared with placebo or usual care, it was uncertain whether lanthanum made any difference to the risk of death (all causes) (Analysis 2.1 (3 studies, 214 participants): RR 1.63, 95% CI 0.07 to 37.12; I2 = 100%) after a median study follow‐up of 3 months. No study reported cardiovascular deaths. Three studies reported myocardial infarction as an adverse treatment event, with only two events reported in the lanthanum group. Lanthanum had very uncertain effects on myocardial infarction (Analysis 2.2 (3 studies, 239 participants): RR 1.61, 95% CI 0.17 to 14.97; I2 = 0%). There were no reports of stroke in Block 2009 (Analysis 2.3), Isakova 2013 reported no difference in hospitalisation events (Analysis 2.4), and Block 2009 reported no difference in fractures (Analysis 2.5).
2.1. Analysis.
Comparison 2 Lanthanum versus placebo or usual care, Outcome 1 Death (all causes).
2.2. Analysis.
Comparison 2 Lanthanum versus placebo or usual care, Outcome 2 Myocardial infarction.
2.3. Analysis.
Comparison 2 Lanthanum versus placebo or usual care, Outcome 3 Stroke.
2.4. Analysis.
Comparison 2 Lanthanum versus placebo or usual care, Outcome 4 Hospitalisation.
2.5. Analysis.
Comparison 2 Lanthanum versus placebo or usual care, Outcome 5 Fracture.
Lanthanum treatment had uncertain effects on the risk of pruritus measured as a discrete outcome (Analysis 2.6 (3 studies, 345 participants): RR 1.09, 95% CI 0.14 to 8.45; I2 = 37%) or as a continuous pruritus score (Wang 2015b) (Analysis 2.7).
2.6. Analysis.
Comparison 2 Lanthanum versus placebo or usual care, Outcome 6 Pruritus.
2.7. Analysis.
Comparison 2 Lanthanum versus placebo or usual care, Outcome 7 Pruritus.
Adverse events were measured over a median of two to three months. In low or moderate certainty evidence, lanthanum may have led to nausea (Analysis 2.8 (4 studies, 383 participants): RR 3.72, 95% CI 1.36 to 10.18; I2 = 0%) and probably leads to an increased risk of constipation (RR 2.98, 95% CI 1.21 to 7.30) (Analysis 2.11). Lanthanum had uncertain risks of abdominal pain (RR 0.23, 95% CI 0.03 to 1.96) (Analysis 2.10) and diarrhoea (RR 0.68, 95% CI 0.13 to 3.68; I2 = 71%) (Analysis 2.12).
2.8. Analysis.
Comparison 2 Lanthanum versus placebo or usual care, Outcome 8 Nausea.
2.11. Analysis.
Comparison 2 Lanthanum versus placebo or usual care, Outcome 11 Constipation.
2.10. Analysis.
Comparison 2 Lanthanum versus placebo or usual care, Outcome 10 Abdominal pain.
2.12. Analysis.
Comparison 2 Lanthanum versus placebo or usual care, Outcome 12 Diarrhoea.
Single studies reported no difference in treatment effects of lanthanum on ESKD (Analysis 2.13), coronary artery calcification (Analysis 2.14), or vascular calcification (Analysis 2.15).
2.13. Analysis.
Comparison 2 Lanthanum versus placebo or usual care, Outcome 13 End‐stage kidney disease.
2.14. Analysis.
Comparison 2 Lanthanum versus placebo or usual care, Outcome 14 Coronary artery calcification score.
2.15. Analysis.
Comparison 2 Lanthanum versus placebo or usual care, Outcome 15 Vascular calcification score.
After a median of 3 months, the average serum phosphate level was 0.48 mg/dL (0.16 mmol/L) lower (0.05 lower to 0.90 mg/dL lower (‐0.02 to 0.29), low certainty) (Analysis 3.8). Lanthanum did not lead to clinically‐important effects on serum calcium (MD 0.03 mg/dL (0.008 mmol/L), 95% CI ‐0.18 to 0.23 mg/dL (‐0.04 to 0.06 mmol/L)) (Analysis 2.17), and the risk of hypercalcaemia were uncertain in one study (Analysis 2.18). The effects of sevelamer were uncertain for the outcomes of serum calcium by phosphate product (2 studies, 194 participants: MD ‐4.36 mg2/dL2, 95% CI ‐9.96 to 1.24; I2 = 77%) (Analysis 2.19), serum iPTH (4 studies, 253 participants: MD 10.07 pg/mL (1.15 pmol/L), 95% CI ‐10.69 to 30.83 pg/mL (‐1.22 to 3.52 pmol/L); I2 = 61%) (Analysis 2.20), eGFR (2 studies, 128 participants: MD 0.13 mL/min, 95% CI ‐1.80 to 2.07; I2 = 0%) (Analysis 2.21), bone mineral density at the lumbar spine measured as a Z‐score (Analysis 2.22), and serum FGF23 levels (2 studies, 50 participants: SMD 0.32, 95% CI ‐0.81 to 1.45; I2 = 73%) (Analysis 2.23).
3.8. Analysis.
Comparison 3 Iron versus placebo or usual care, Outcome 8 Serum phosphate.
2.17. Analysis.
Comparison 2 Lanthanum versus placebo or usual care, Outcome 17 Serum calcium.
2.18. Analysis.
Comparison 2 Lanthanum versus placebo or usual care, Outcome 18 Hypercalcaemia.
2.19. Analysis.
Comparison 2 Lanthanum versus placebo or usual care, Outcome 19 Serum calcium‐by‐phosphate product.
2.20. Analysis.
Comparison 2 Lanthanum versus placebo or usual care, Outcome 20 Serum iPTH.
2.21. Analysis.
Comparison 2 Lanthanum versus placebo or usual care, Outcome 21 eGFR.
2.22. Analysis.
Comparison 2 Lanthanum versus placebo or usual care, Outcome 22 Bone mineral density: lumbar spine.
2.23. Analysis.
Comparison 2 Lanthanum versus placebo or usual care, Outcome 23 Serum FGF23.
Iron versus placebo or usual care
The major outcomes for the comparison of iron with placebo or usual care are shown in the Table 3.
In the three studies comparing iron‐based binders with placebo or usual care, one involved dialysis patients and two involved patients with CKD G2 to G5 not requiring dialysis. The studies were not designed to measure the effects of treatment on death or cardiovascular events. Death (all causes) was reported in two studies. At 2.75 to 3 months, iron‐based binders had uncertain effects on death (all causes) (2 studies, 239 participants: RR 0.52, 95% CI 0.06 to 4.65; I2 = 0%; very low certainty evidence) (Analysis 3.1). Cardiovascular death, myocardial infarction, and stroke were not reported. Block 2015 reported no differences in the risks of fracture (Analysis 3.2), pruritus (Analysis 3.3), or nausea (Analysis 3.4). Outcome data for vascular calcification and bone‐related outcomes could not be extracted for analysis.
3.1. Analysis.
Comparison 3 Iron versus placebo or usual care, Outcome 1 Death (all causes).
3.2. Analysis.
Comparison 3 Iron versus placebo or usual care, Outcome 2 Fracture.
3.3. Analysis.
Comparison 3 Iron versus placebo or usual care, Outcome 3 Pruritus.
3.4. Analysis.
Comparison 3 Iron versus placebo or usual care, Outcome 4 Nausea.
Iron‐based binders had clinically uncertain risks for abdominal pain (2 studies, 332 participants: RR 1.20, 95% CI 0.34 to 4.27) (Analysis 3.7), while probably increasing the risk of constipation (3 studies, 422 participants: RR 2.66, 95% CI 1.15 to 6.12; I2 = 0%; moderate certainty evidence) (Analysis 3.5) and diarrhoea (3 studies, 422 participants: RR 2.81, 95% CI 1.18 to 6.68; I2 = 25%) (Analysis 3.6).
3.7. Analysis.
Comparison 3 Iron versus placebo or usual care, Outcome 7 Abdominal pain.
3.5. Analysis.
Comparison 3 Iron versus placebo or usual care, Outcome 5 Constipation.
3.6. Analysis.
Comparison 3 Iron versus placebo or usual care, Outcome 6 Diarrhoea.
Iron‐based binders lowered serum phosphate levels (3 studies, 301 participants: MD ‐1.33 mg/dL (‐0.43 mmol/L), 95% CI ‐2.25 to ‐0.41 mg/dL (‐0.73 to ‐0.13 mmol/L); I2 = 91%) in an analysis possessing substantial between‐study heterogeneity (Analysis 3.8). Iron‐based binder therapy may be associated with higher serum calcium levels (3 studies, 301 participants: MD 0.21 mg/dL (0.05 mmol/L), 95% CI 0.09 to 0.33 mg/dL (0.02 to 0.08 mmol/L); I2 = 0%) (Analysis 3.9) while singles studies reported uncertain effects on serum calcium‐by‐phosphate product (Analysis 3.10), alkaline phosphatase (Analysis 3.11), and serum bicarbonate (Analysis 3.12). Iron‐based binders had uncertain effects on eGFR (2 studies, 239 participants: MD ‐0.67 mL/min, 95% CI ‐2.97 to 1.64; I2 = 0%) (Analysis 3.13). Outcome data for serum FGF23 levels could not be extracted for analysis.
3.9. Analysis.
Comparison 3 Iron versus placebo or usual care, Outcome 9 Serum calcium.
3.10. Analysis.
Comparison 3 Iron versus placebo or usual care, Outcome 10 Serum calcium‐by‐phosphate product.
3.11. Analysis.
Comparison 3 Iron versus placebo or usual care, Outcome 11 Serum alkaline phosphatase.
3.12. Analysis.
Comparison 3 Iron versus placebo or usual care, Outcome 12 Serum bicarbonate.
3.13. Analysis.
Comparison 3 Iron versus placebo or usual care, Outcome 13 eGFR.
Calcium versus placebo or usual care
The major outcomes for the comparison of calcium‐based binders compared with usual care are shown in the Table 4.
Evidence was generally restricted to people with CKD G2 to G5 not requiring dialysis. Meta‐analyses involved two studies (or three for biochemical outcomes). As a result, evidence certainty was either low, very low, or absent. No study was specifically designed to measure death or cardiovascular complications. Treatment endpoints were measured during nine months of therapy.
Qunibi 2011 reported no difference in the number of deaths between calcium and placebo (Analysis 4.1). Death due to cardiovascular events was not reported by any study. It is uncertain whether calcium‐based binders make any difference to the risk of myocardial infarction (2 studies, 147 participants: RR 1.36, 95% CI 0.09 to 21.71; I2 = 35%) (Analysis 4.2). Two studies reported stroke; there were no reports of stoke in Block 2009, while Qunibi 2011 reported one stroke in the calcium group. The summary estimate for stroke was extremely imprecise (Analysis 4.3). Block 2009 reported two fractures in the placebo group (Analysis 4.4). The effect of calcium‐based binders on pruritus was very uncertain in two studies (2 studies, 197 participants: RR 1.19, 95% CI 0.29 to 4.81; I2 = 0%) (Analysis 4.5).
4.1. Analysis.
Comparison 4 Calcium versus placebo or usual care, Outcome 1 Death (all causes).
4.2. Analysis.
Comparison 4 Calcium versus placebo or usual care, Outcome 2 Myocardial infarction.
4.3. Analysis.
Comparison 4 Calcium versus placebo or usual care, Outcome 3 Stroke.
4.4. Analysis.
Comparison 4 Calcium versus placebo or usual care, Outcome 4 Fracture.
4.5. Analysis.
Comparison 4 Calcium versus placebo or usual care, Outcome 5 Pruritus.
In low‐ or very low‐certainty evidence, calcium‐based binders had uncertain risks on adverse events including nausea (2 studies, 197 participants: RR 0.58, 95% CI 0.15 to 2.18; I2 = 0%) (Analysis 4.6), abdominal pain (2 studies, 197 participants: RR 0.66, 95% CI 0.13 to 3.34; I2 = 0%) (Analysis 4.8), constipation (2 studies, 197 participants: RR 2.44, 95% CI 0.32 to 18.42; I2 = 53%) (Analysis 4.9), and diarrhoea (2 studies, 197 participants: RR 0.94, 95% CI 0.39 to 2.28; I2 = 0%) (Analysis 4.10). Block 2009 reported one vomiting event in the placebo group (Analysis 4.7).
4.6. Analysis.
Comparison 4 Calcium versus placebo or usual care, Outcome 6 Nausea.
4.8. Analysis.
Comparison 4 Calcium versus placebo or usual care, Outcome 8 Abdominal pain.
4.9. Analysis.
Comparison 4 Calcium versus placebo or usual care, Outcome 9 Constipation.
4.10. Analysis.
Comparison 4 Calcium versus placebo or usual care, Outcome 10 Diarrhoea.
4.7. Analysis.
Comparison 4 Calcium versus placebo or usual care, Outcome 7 Vomiting.
Russo 2007 reported no differences between the two groups in coronary artery calcium score at 2 years (Analysis 4.11).
4.11. Analysis.
Comparison 4 Calcium versus placebo or usual care, Outcome 11 Coronary artery calcification score.
In very low certainty evidence, calcium‐based binders had uncertain effects on serum phosphate (3 studies, 151 participants: MD ‐0.18 mg/dL (‐0.06 mmol/L), 95% CI ‐1.30 to 0.95 mg/dL (‐0.42 to 0.31 mmol/L); I2 = 85%) (Analysis 4.12) and serum calcium (3 studies, 151 participants: MD 0.33 mg/dL (0.08 mmol/L), 95% CI ‐0.26 to 0.92 (‐0.07 to 0.23 mmol/L); I2 = 85%) (Analysis 4.13) in meta‐analyses with by substantial heterogeneity. Hypercalcaemia was reported as an adverse event in three studies after 12 weeks, 3 months, and 9 months of treatment. There was no uniform definition of hypercalcaemia. In low certainty evidence, calcium‐based binders may increase the risk of hypercalcaemia (3 studies, 215 participants: RR 7.28, 95% CI 1.64 to 32.29; I2 = 0%)) (Analysis 4.14).
4.12. Analysis.
Comparison 4 Calcium versus placebo or usual care, Outcome 12 Serum phosphate.
4.13. Analysis.
Comparison 4 Calcium versus placebo or usual care, Outcome 13 Serum calcium.
4.14. Analysis.
Comparison 4 Calcium versus placebo or usual care, Outcome 14 Hypercalcaemia.
Calcium‐based binders had uncertain effects on serum iPTH (2 studies, 133 participants: MD ‐80.15 pg/mL (‐9.14 pmol/L), 95% CI ‐305.46 to 145.16 pg/mL (‐34.8 to 16.5 pmol/L); I2 = 94%) (Analysis 4.16) and alkaline phosphatase (2 studies, 78 participants: MD 34.86 IU/L, 95% CI ‐21.47 to 91.20; I2 = 60%) (Analysis 4.17). Calcium binders may lead to a small clinical reduction in serum bicarbonate (2 studies 138 participants: MD ‐1.85 mEq/L, 95% CI ‐3.12 to ‐0.59) (Analysis 4.18). Russo 2007 reported no differences between calcium and placebo in serum calcium‐by‐phosphate product or eGFR (Analysis 4.15; Analysis 4.19). Outcome data for serum FGF23 levels could not be extracted for analysis.
4.16. Analysis.
Comparison 4 Calcium versus placebo or usual care, Outcome 16 Serum iPTH.
4.17. Analysis.
Comparison 4 Calcium versus placebo or usual care, Outcome 17 Serum alkaline phosphatase.
4.18. Analysis.
Comparison 4 Calcium versus placebo or usual care, Outcome 18 Serum bicarbonate.
4.15. Analysis.
Comparison 4 Calcium versus placebo or usual care, Outcome 15 Serum calcium‐by‐phosphate product.
4.19. Analysis.
Comparison 4 Calcium versus placebo or usual care, Outcome 19 eGFR.
Bixalomer versus placebo or usual care
Akizawa 2016 evaluated bixalomer versus placebo for 12 weeks among people with an eGFR < 60 mL/min per 1.73 m2. This study reported no differences in death (Analysis 5.1), ESKD (Analysis 5.2), nausea (Analysis 5.3), abdominal pain (Analysis 5.4), constipation (Analysis 5.5), and diarrhoea (Analysis 5.6).
5.1. Analysis.
Comparison 5 Bixalomer versus placebo or usual care, Outcome 1 Death (all causes).
5.2. Analysis.
Comparison 5 Bixalomer versus placebo or usual care, Outcome 2 End‐stage kidney disease.
5.3. Analysis.
Comparison 5 Bixalomer versus placebo or usual care, Outcome 3 Nausea.
5.4. Analysis.
Comparison 5 Bixalomer versus placebo or usual care, Outcome 4 Abdominal pain.
5.5. Analysis.
Comparison 5 Bixalomer versus placebo or usual care, Outcome 5 Constipation.
5.6. Analysis.
Comparison 5 Bixalomer versus placebo or usual care, Outcome 6 Diarrhoea.
Nicotinamide versus placebo or usual care
Four studies evaluated nicotinamide or placebo or usual care in patients with CKD G5D treated with dialysis. Studies were between 1.8 and 3 months in duration. The studies were not designed to measure the effects of treatment on death or cardiovascular events. SLO‐NIACIN 2013 reported one death as a study drop‐out (Analysis 6.1). There were no reported cardiovascular deaths. Young 2009a reported no differences in the risk of pruritus (Analysis 6.2).
6.1. Analysis.
Comparison 6 Nicotinamide versus placebo or usual care, Outcome 1 Death (all causes).
6.2. Analysis.
Comparison 6 Nicotinamide versus placebo or usual care, Outcome 2 Pruritus.
Constipation was reported in one study at 2.75 months (Aramwit 2012) (Analysis 6.3). It was very uncertain whether nicotinamide increased risks of diarrhoea (RR 1.61, 95% CI 0.06 to 40.36) (Analysis 6.4).
6.3. Analysis.
Comparison 6 Nicotinamide versus placebo or usual care, Outcome 3 Constipation.
6.4. Analysis.
Comparison 6 Nicotinamide versus placebo or usual care, Outcome 4 Diarrhoea.
There was no evidence that nicotinamide had clinically‐important effects on serum phosphate (3 studies, 98 participants: MD ‐0.56 mg/dL (‐0.18 mmol/L), 95% CI ‐1.24 to 0.12 mg/dL (‐0.40 to 0.04 mmol/L); I2 = 61%), in an analysis with moderate heterogeneity (Analysis 6.5). Nicotinamide had uncertain effects on serum calcium (3 studies, 98 participants: MD 0.07 mg/dL (0.02 mmol/L), 95% CI ‐0.30 to 0.44 mg/dL (‐0.06 to 0.11 mmol/L); I2 = 0%) (Analysis 6.6), and may lower serum calcium‐by‐phosphate product (2 studies, 74 participants: MD ‐7.81 mg2/dL2, 95% CI ‐13.36 to ‐2.25) (Analysis 6.8). Allam 2012 reported on difference in serum PTH (Analysis 6.7).
6.5. Analysis.
Comparison 6 Nicotinamide versus placebo or usual care, Outcome 5 Serum phosphate.
6.6. Analysis.
Comparison 6 Nicotinamide versus placebo or usual care, Outcome 6 Serum calcium.
6.8. Analysis.
Comparison 6 Nicotinamide versus placebo or usual care, Outcome 8 Serum calcium‐by‐phosphate product.
6.7. Analysis.
Comparison 6 Nicotinamide versus placebo or usual care, Outcome 7 Serum iPTH.
Colestilan versus placebo or usual care
Data from a single placebo‐controlled, multiple fixed‐dose study in patients treated with dialysis was available (Locatelli 2013). This study reported no differences between colestilan and placebo in death (Analysis 7.1), abdominal pain (Analysis 7.3), diarrhoea (Analysis 7.4), and constipation (Analysis 7.5). Locatelli 2013 reported more nausea in the placebo group (Analysis 7.2).
7.1. Analysis.
Comparison 7 Colestilan versus placebo or usual care, Outcome 1 Death (all causes).
7.3. Analysis.
Comparison 7 Colestilan versus placebo or usual care, Outcome 3 Abdominal pain.
7.4. Analysis.
Comparison 7 Colestilan versus placebo or usual care, Outcome 4 Diarrhoea.
7.5. Analysis.
Comparison 7 Colestilan versus placebo or usual care, Outcome 5 Constipation.
7.2. Analysis.
Comparison 7 Colestilan versus placebo or usual care, Outcome 2 Nausea.
Sevelamer versus calcium
The major outcomes for the comparison of sevelamer with calcium are shown in the Table 5.
Studies comparing sevelamer with calcium were dominated by those evaluating therapy in participants with CKD G5D treated with dialysis. Death (all causes) was reported in sixteen studies. Of these, zero events were reported in four studies (Bleyer 1999; CARE 2004; Ferreira 2008; Kakuta 2011), deaths were reported as reasons for drop‐out from study follow‐up in six studies (BRiC 2005; CARE‐2 2008; Hervas 2003; Lin 2014a; Sadek 2003; Vlassara 2012), and were reported as adverse events in two studies (Chertow 2002; Sezer 2010). In four studies, all‐cause or cause‐specific death was a pre‐specified primary or secondary outcome (Block 2005; DCOR 2007; INDEPENDENT‐CKD 2012; INDEPENDENT‐HD 2009). In low certainty evidence downgraded for study limitations and evidence of important statistical heterogeneity, sevelamer may reduce death (all causes) compared with calcium‐based binders (16 studies, 4266 participants: RR 0.53, 95% CI 0.30 to 0.91; I2 = 78%) (Analysis 8.1). It was not possible to evaluate for presence of publication bias due to the important statistical heterogeneity.
8.1. Analysis.
Comparison 8 Sevelamer versus calcium, Outcome 1 Death (all causes).
In very low certainty evidence, whether sevelamer made any difference to cardiovascular death was uncertain (6 studies, 2904 participants: RR 0.45, 95% CI 0.11 to 1.77; I2 = 73%) (Analysis 8.2), with important statistical heterogeneity in the analysis. Myocardial infarction (2 studies, 177 participants: RR 1.02, 95% CI 0.11 to 9.59; I2 = 0%) (Analysis 8.3) and stroke (2 studies, 102 participants: RR 3.00, 95% CI 0.32 to 27.90; I2 = 0%) (Analysis 8.4) were reported for a single patient in each of two studies leading to a very imprecise risk estimates. Two studies reported hospitalisation, with the evidence dominated by a single study with a large number of reported events in both groups (2 studies, 242 participants: RR 0.78, 95% CI 0.56 to 1.08; I2 = 0%) (Analysis 8.5). Block 2009 reported no differences in fracture events between the two groups (Analysis 8.6).
8.2. Analysis.
Comparison 8 Sevelamer versus calcium, Outcome 2 Cardiovascular death.
8.3. Analysis.
Comparison 8 Sevelamer versus calcium, Outcome 3 Myocardial infarction.
8.4. Analysis.
Comparison 8 Sevelamer versus calcium, Outcome 4 Stroke.
8.5. Analysis.
Comparison 8 Sevelamer versus calcium, Outcome 5 Hospitalisation.
8.6. Analysis.
Comparison 8 Sevelamer versus calcium, Outcome 6 Fracture.
In low certainty evidence involving studies with a median follow‐up of 5.5 months, sevelamer may have similar risks of nausea compared with calcium (4 studies, 365 participants: RR 0.98, 95% CI 0.56 to 1.71; I2 = 0%) (Analysis 8.7). Based on two studies in low certainty evidence, there was no clinical difference in the risk of vomiting between sevelamer and calcium (2 studies, 263 participants: RR 0.95, 95% CI 0.54 to 1.69; I2 = 0%) (Analysis 8.8). There was no evidence of important differences in treatments for the risk of abdominal pain (4 studies, 363 participants: RR 1.77, 95% CI 0.68 to 4.63; I2 = 0%) (Analysis 8.9), constipation (6 studies, 2652 participants: RR 1.35, 95% CI 0.71 to 2.57; I2 = 2%) (Analysis 8.10), diarrhoea (3 studies, 315 participants: RR 0.98, 95% CI 0.55 to 1.75; I2 = 0%) (Analysis 8.11), or abdominal bloating (2 studies, 112 participants: RR 4.85, 95% CI 0.87 to 27.03; I2 = 0%) (Analysis 8.12).
8.7. Analysis.
Comparison 8 Sevelamer versus calcium, Outcome 7 Nausea.
8.8. Analysis.
Comparison 8 Sevelamer versus calcium, Outcome 8 Vomiting.
8.9. Analysis.
Comparison 8 Sevelamer versus calcium, Outcome 9 Abdominal pain.
8.10. Analysis.
Comparison 8 Sevelamer versus calcium, Outcome 10 Constipation.
8.11. Analysis.
Comparison 8 Sevelamer versus calcium, Outcome 11 Diarrhoea.
8.12. Analysis.
Comparison 8 Sevelamer versus calcium, Outcome 12 Abdominal bloating.
In very low certainty evidence with important statistical heterogeneity in the analysis, sevelamer may result in markedly less hypercalcaemia compared with calcium‐based binders (19 studies, 4084 participants: RR 0.30, 95% CI 0.20 to 0.43; I2 = 49%) (Analysis 8.13). DCOR 2007 reported no difference in the comparative effect of sevelamer and calcium on calciphylaxis (Analysis 8.14). There was no evidence that the coronary artery calcium score at 12 or 24 months was different for sevelamer or calcium use (4 studies, 517 participants: MD ‐24.89, 95% CI ‐75.66 to 25.88; I2 = 0%) (Analysis 8.15).
8.13. Analysis.
Comparison 8 Sevelamer versus calcium, Outcome 13 Hypercalcaemia.
8.14. Analysis.
Comparison 8 Sevelamer versus calcium, Outcome 14 Calciphylaxis.
8.15. Analysis.
Comparison 8 Sevelamer versus calcium, Outcome 15 Coronary artery calcium score.
Among twenty‐three studies involving 4360 participants, the mean serum phosphate at end of treatment was clinically similar between treatment groups (MD 0.06 mg/dL (0.02 mmol/L), 95% CI ‐0.11 to 0.23 mg/dL (‐0.04 to 0.07 mmol/L); I2 = 78%) (Analysis 8.16), although there was important statistical heterogeneity between the studies. Sevelamer may provide a small clinical impact on serum calcium compared with a calcium‐based binder (22 studies, 4313: MD ‐0.38 mg/dL (‐0.10 mmol/L), 95% CI ‐0.54 to ‐0.21 mg/dL (‐0.14 to ‐0.05 mmol/L); I2 = 92%), in an analysis showing substantial statistical heterogeneity (Analysis 8.17). Sevelamer may have similar clinical effects on the serum calcium‐by‐phosphate product (13 studies, 2983 participants: MD 0.36 mg2/dL2, 95% CI ‐0.57 to 1.28; I2 = 25%) (Analysis 8.18), while sevelamer was possibly associated with a clinically increased serum iPTH levels (16 studies, 1420 participants: MD 44.24 pg/mL (5.04 pmol/L), 95% CI 10.93 to 77.55 (1.24 to 8.84 pmol/L); I2 = 71%) (Analysis 8.19). Calcium‐based treatment may decrease serum alkaline phosphatase compared to placebo (7 studies, 611 participants: MD 17.64 IU/L, 95% CI ‐0.16 to 35.43; I2 = 68%) although the confidence interval included the possibility of no difference (Analysis 8.20). Sevelamer use may result in lower serum bicarbonate levels (7 studies, 695 participants: MD ‐1.57 mEq/L, 95% CI ‐2.15 to ‐1.00; I2 = 24%) (Analysis 8.21). Russo 2007 reported no difference in eGFR between the groups at the end of treatment (Analysis 8.22). Lin 2014a reported no differences between the groups for serum FGF23 (Analysis 8.23) and soluble Klotho levels (Analysis 8.24).
8.16. Analysis.
Comparison 8 Sevelamer versus calcium, Outcome 16 Serum phosphate.
8.17. Analysis.
Comparison 8 Sevelamer versus calcium, Outcome 17 Serum calcium.
8.18. Analysis.
Comparison 8 Sevelamer versus calcium, Outcome 18 Serum calcium‐by‐phosphate product.
8.19. Analysis.
Comparison 8 Sevelamer versus calcium, Outcome 19 Serum iPTH.
8.20. Analysis.
Comparison 8 Sevelamer versus calcium, Outcome 20 Serum alkaline phosphatase.
8.21. Analysis.
Comparison 8 Sevelamer versus calcium, Outcome 21 Serum bicarbonate.
8.22. Analysis.
Comparison 8 Sevelamer versus calcium, Outcome 22 eGFR.
8.23. Analysis.
Comparison 8 Sevelamer versus calcium, Outcome 23 Serum FGF23.
8.24. Analysis.
Comparison 8 Sevelamer versus calcium, Outcome 24 Soluble Klotho.
Lanthanum versus calcium
The major outcomes for the comparison of lanthanum with calcium are shown in the Table 6.
Nearly all studies evaluated therapy in patients with CKD G5D treated with peritoneal dialysis or haemodialysis. None of the studies were designed to evaluate treatment effects on death or cardiovascular endpoints. Death (all causes) was reported in six studies. Of these, zero events were reported in two studies (D'Haese 2003; Shigematsu 2008), and seven events were reported among the remaining four studies (Ohtake 2013; Spasovski 2006; Toussaint 2009; Wada 2014) at between 6 and 18 months of therapy. In low certainty evidence, the effect of lanthanum treatment on death (all causes) was uncertain (6 studies, 5050 participants: RR 0.76, 95% CI 0.18 to 3.11; I2 = 0%) (Analysis 9.1). Endpoints for cardiovascular death, myocardial infarction, and stroke were not reported in any of the studies. Based on two studies, there was no evidence of a clinically‐important effect of lanthanum on hospitalisation (2 studies, 88 participants: RR 0.80, 95% CI 0.34 to 1.93; I2 = 0%) (Analysis 9.2). Block 2009 reported not differences between lanthanum and calcium for fracture (Analysis 9.3) and pruritus (Analysis 9.4). Ohtake 2013 reported no difference between the two treatments on coronary artery calcium score (Analysis 9.11).
9.1. Analysis.
Comparison 9 Lanthanum versus calcium, Outcome 1 Death (all causes).
9.2. Analysis.
Comparison 9 Lanthanum versus calcium, Outcome 2 Hospitalisation.
9.3. Analysis.
Comparison 9 Lanthanum versus calcium, Outcome 3 Fracture.
9.4. Analysis.
Comparison 9 Lanthanum versus calcium, Outcome 4 Pruritus.
9.11. Analysis.
Comparison 9 Lanthanum versus calcium, Outcome 11 Coronary artery calcium score.
Evidence for treatment adverse effects was low‐ or very low‐certainty. Lanthanum may lead to nausea (5 studies, 1191 participants: RR 1.65, 95% CI 0.95 to 2.89; I2 = 20%), although the estimate included the possibility of no difference (Analysis 9.5). Lanthanum had uncertain effects on vomiting (2 studies, 1058 participants: RR 3.88, 95% CI 0.48 to 31.74; I2 = 77%) with important statistical heterogeneity in the analysis (Analysis 9.6). There was no evidence of different effects for lanthanum and calcium on abdominal pain (2 studies, 137 participants: RR 0.24, 95% CI 0.03 to 1.94; I2 = 0%) (Analysis 9.7), constipation (5 studies, 1213 participants: RR 0.79, 95% CI 0.50 to 1.26; I2 = 0%) (Analysis 9.8), or diarrhoea (2 studies, 858 participants: RR 2.44, 95% CI 0.34 to 17.35; I2 = 56%) (Analysis 9.9). Shigematsu 2008 reported no differences in abdominal bloating between the two groups (Analysis 9.10).
9.5. Analysis.
Comparison 9 Lanthanum versus calcium, Outcome 5 Nausea.
9.6. Analysis.
Comparison 9 Lanthanum versus calcium, Outcome 6 Vomiting.
9.7. Analysis.
Comparison 9 Lanthanum versus calcium, Outcome 7 Abdominal pain.
9.8. Analysis.
Comparison 9 Lanthanum versus calcium, Outcome 8 Constipation.
9.9. Analysis.
Comparison 9 Lanthanum versus calcium, Outcome 9 Diarrhoea.
9.10. Analysis.
Comparison 9 Lanthanum versus calcium, Outcome 10 Abdominal bloating.
In very low certainty evidence with important statistical heterogeneity in the analysis, lanthanum may result in markedly less hypercalcaemia compared with calcium‐based binders (8 studies, 1347 participants: RR 0.16, 95% CI 0.06 to 0.43; I2 = 59%) (Analysis 9.12).
9.12. Analysis.
Comparison 9 Lanthanum versus calcium, Outcome 12 Hypercalcaemia.
Lanthanum and calcium‐based binders had clinically similar effects on serum phosphate (9 studies, 400 participants: MD ‐0.02 mg/dL (0.006 mmol/L), 95% CI ‐0.45 to 0.41 (‐0.15 to 0.13 pmol/L); I2 = 76%), in an analysis with marked statistical heterogeneity (Analysis 9.13). Lanthanum treatment may have a small clinical effect on serum calcium levels, although the estimated effect included the possibility of no difference (8 studies, 350 participants: MD ‐0.28 mg/dL (‐0.07 mmol/L), 95% CI ‐0.59 to 0.02 mg/dL (‐0.15 to 0.005 mmol/L); I2 = 81%), in an analysis with important statistical heterogeneity (Analysis 9.14). Lanthanum may have reduced the serum calcium‐by‐phosphate product (5 studies, 1007 participants: MD ‐2.67 mg2/dL2, 95% CI ‐5.01 to ‐0.34; I2 = 26%) (Analysis 9.15). There was no evidence of clinical differences in end of treatment serum PTH (8 studies, 597 participants: MD 33.78 pg/mL(3.85 pmol/L), 95% CI ‐9.03 to 76.60 pg/mL (‐1.03 to 8.73 pmol/L); I2 = 73%) (Analysis 9.16) or serum alkaline phosphatase (3 studies, 856 participants: MD 20.03 IU/L, 95% CI ‐3.69 to 43.75; I2 = 88%) (Analysis 9.17). Soriano 2013 reported a higher eGFR at the end of treatment with lanthanum (Analysis 9.18). Lanthanum had uncertain effects on serum FGF23 levels compared with calcium‐based binders (2 studies, 116 participants: SMD ‐0.85, 95% CI ‐2.33 to 0.63; I2 = 90%) (Analysis 9.19).
9.13. Analysis.
Comparison 9 Lanthanum versus calcium, Outcome 13 Serum phosphate.
9.14. Analysis.
Comparison 9 Lanthanum versus calcium, Outcome 14 Serum calcium.
9.15. Analysis.
Comparison 9 Lanthanum versus calcium, Outcome 15 Serum calcium‐by‐phosphate product.
9.16. Analysis.
Comparison 9 Lanthanum versus calcium, Outcome 16 Serum iPTH.
9.17. Analysis.
Comparison 9 Lanthanum versus calcium, Outcome 17 Serum alkaline phosphatase.
9.18. Analysis.
Comparison 9 Lanthanum versus calcium, Outcome 18 eGFR.
9.19. Analysis.
Comparison 9 Lanthanum versus calcium, Outcome 19 Serum FGF23.
Iron versus calcium
No studies were identified that provided a head‐to‐head comparison of iron‐ versus calcium‐based binders.
Magnesium versus calcium
Spiegel 2007 reported no differences in hospitalisation (Analysis 10.1), constipation (Analysis 10.2), and diarrhoea (Analysis 10.3) between magnesium and calcium‐based binders.
10.1. Analysis.
Comparison 10 Magnesium versus calcium, Outcome 1 Hospitalisation.
10.2. Analysis.
Comparison 10 Magnesium versus calcium, Outcome 2 Constipation.
10.3. Analysis.
Comparison 10 Magnesium versus calcium, Outcome 3 Diarrhoea.
Aluminium versus calcium
Two studies evaluated aluminium compared with calcium (Janssen 1996; Jespersen 1991), however data could not be extracted from Jespersen 1991. Janssen 1996 reported lower serum alkaline phosphatase with calcium‐based binders (Analysis 11.1).
11.1. Analysis.
Comparison 11 Aluminium versus calcium, Outcome 1 Serum alkaline phosphatase.
Magnesium plus calcium versus calcium
Combined magnesium and calcium‐based binders were compared with calcium alone in four studies (Delmez 1996; Deuber 2004; Evsanaa 2015; Tzanakis 2014). The studies were not designed to evaluate death or cardiovascular endpoints. Tzanakis 2014 reported no difference between the two groups for death as a reason for drop‐out from the study during follow‐up (Analysis 12.1).
12.1. Analysis.
Comparison 12 Magnesium plus calcium versus calcium, Outcome 1 Death (all causes).
The clinical effects of magnesium plus calcium compared with calcium alone on serum phosphate levels (2 studies, 109 participants: MD ‐1.26 mg/dL (‐0.41 mmol/L), 95% CI ‐3.52 to 1.00 mg/dL (‐1.14 to 0.32 mmol/L), I2 = 93%) (Analysis 12.2) and serum calcium levels (2 studies, 109 participants: MD ‐0.92 mg/dL (‐0.23 mmol/L), 95% CI ‐2.39 to 0.55 mg/dL (‐0.60 to 0.14 mmol/L); I2 = 96%) (Analysis 12.3) were uncertain in analyses with important statistical heterogeneity. Tzanakis 2014 reported no differences in serum calcium‐by‐phosphate product (Analysis 12.4) or iPTH (Analysis 12.5) between the two groups.
12.2. Analysis.
Comparison 12 Magnesium plus calcium versus calcium, Outcome 2 Serum phosphate.
12.3. Analysis.
Comparison 12 Magnesium plus calcium versus calcium, Outcome 3 Serum calcium.
12.4. Analysis.
Comparison 12 Magnesium plus calcium versus calcium, Outcome 4 Serum calcium‐by‐phosphate product.
12.5. Analysis.
Comparison 12 Magnesium plus calcium versus calcium, Outcome 5 Serum iPTH.
Sevelamer versus lanthanum
Clinical endpoints for the comparison of sevelamer versus lanthanum were reported in two groups of a four‐arm study (Block 2009). Block 2009 reported no difference between the two groups for myocardial infarction (Analysis 13.1), stroke (Analysis 13.2), fracture (Analysis 13.3), pruritis (Analysis 13.4), nausea (Analysis 13.5), vomiting (Analysis 13.6), abdominal pain (Analysis 13.7), constipation (Analysis 13.8), diarrhoea (Analysis 13.9), abdominal bloating (Analysis 13.10), and hypercalcaemia (Analysis 13.11). Data from two other studies could not be extracted for meta‐analysis (Kasai 2012; Pratt 2007).
13.1. Analysis.
Comparison 13 Sevelamer versus lanthanum, Outcome 1 Myocardial infarction.
13.2. Analysis.
Comparison 13 Sevelamer versus lanthanum, Outcome 2 Stroke.
13.3. Analysis.
Comparison 13 Sevelamer versus lanthanum, Outcome 3 Fracture.
13.4. Analysis.
Comparison 13 Sevelamer versus lanthanum, Outcome 4 Pruritus.
13.5. Analysis.
Comparison 13 Sevelamer versus lanthanum, Outcome 5 Nausea.
13.6. Analysis.
Comparison 13 Sevelamer versus lanthanum, Outcome 6 Vomiting.
13.7. Analysis.
Comparison 13 Sevelamer versus lanthanum, Outcome 7 Abdominal pain.
13.8. Analysis.
Comparison 13 Sevelamer versus lanthanum, Outcome 8 Constipation.
13.9. Analysis.
Comparison 13 Sevelamer versus lanthanum, Outcome 9 Diarrhoea.
13.10. Analysis.
Comparison 13 Sevelamer versus lanthanum, Outcome 10 Abdominal bloating.
13.11. Analysis.
Comparison 13 Sevelamer versus lanthanum, Outcome 11 Hypercalcaemia.
Sevelamer versus iron
Sevelamer was compared with iron‐based binders in four studies that reported outcomes during three to six months of follow‐up (Chen 2011b; Floege 2014; Koiwa 2017; Yokoyama 2014). In three of the four studies, participants were treated with haemodialysis or peritoneal dialysis. The studies were not designed to evaluate death or cardiovascular endpoints. Deaths were reported as a reason for drop‐out from follow‐up or as an adverse event in two studies. In very‐low certainty evidence, sevelamer had uncertain effects on the risk of death (all causes) (4 studies, 1683 participants: RR 1.07, 95% CI 0.38 to 2.98; I2 = 0%) (Analysis 14.1). Chen 2011b reported no differences between the groups for the risk of cardiovascular death (Analysis 14.2), myocardial infarction (Analysis 14.3), and fractures (Analysis 14.4).
14.1. Analysis.
Comparison 14 Sevelamer versus iron, Outcome 1 Death (all causes).
14.2. Analysis.
Comparison 14 Sevelamer versus iron, Outcome 2 Cardiovascular death.
14.3. Analysis.
Comparison 14 Sevelamer versus iron, Outcome 3 Myocardial infarction.
14.4. Analysis.
Comparison 14 Sevelamer versus iron, Outcome 4 Fracture.
Compared with iron‐based binders, the risk of nausea (2 studies, 1257 participants: RR 3.86, 95% CI 0.33 to 44.86; I2 = 68%) (Analysis 14.5), abdominal pain (2 studies, 431 participants: RR 0.42, 95% CI 0.02 to 9.01; I2 = 79%) (Analysis 14.6), constipation (4 studies, 1699 participants: RR 4.96, 95% CI 1.96 to 12.55; I2 = 71%) (Analysis 14.7), and diarrhoea (4 studies, 1699 participants: RR 0.28, 95% CI 0.15 to 0.54; I2 = 51%) (Analysis 14.8) with sevelamer was uncertain in analyses with important statistical heterogeneity.
14.5. Analysis.
Comparison 14 Sevelamer versus iron, Outcome 5 Nausea.
14.6. Analysis.
Comparison 14 Sevelamer versus iron, Outcome 6 Abdominal pain.
14.7. Analysis.
Comparison 14 Sevelamer versus iron, Outcome 7 Constipation.
14.8. Analysis.
Comparison 14 Sevelamer versus iron, Outcome 8 Diarrhoea.
Based on two studies, whether sevelamer had different effects on serum phosphate levels compared with iron‐based binders was uncertain in an analysis within substantial statistical heterogeneity (2 studies, 417 participants: MD 0.19 mg/dL (0.06 mmol/L), 95% CI ‐0.06 to 0.43 mg/dL (‐0.02 to 0.14 mmol/L); I2 = 28%) (Analysis 14.9). Sevelamer may slightly decrease serum calcium (2 studies, 417 participants: MD ‐0.16 mg/dL (‐0.04 mmol/L, 95% CI ‐0.29 to ‐0.04 mg/dL (‐0.07 to ‐0.01 mmol/L); I2 = 0%) compared with iron (Analysis 14.10). Yokoyama 2014a reported serum bicarbonate levels were lower in the sevelamer group (Analysis 14.11).
14.9. Analysis.
Comparison 14 Sevelamer versus iron, Outcome 9 Serum phosphate.
14.10. Analysis.
Comparison 14 Sevelamer versus iron, Outcome 10 Serum calcium.
14.11. Analysis.
Comparison 14 Sevelamer versus iron, Outcome 11 Serum bicarbonate.
Sevelamer versus bixalomer
Akizawa 2014a reported no differences between sevelamer and bixalomer for death (Analysis 15.1), fracture (Analysis 15.2), pruritis (Analysis 15.3), nausea (Analysis 15.4), vomiting (Analysis 15.5), abdominal pain (Analysis 15.6), constipation (Analysis 15.7), abdominal bloating (Analysis 15.8), serum phosphate (Analysis 15.9), serum calcium (Analysis 15.10), and serum calcium‐by‐phosphate product (Analysis 15.11). Akizawa 2014a reported serum iPTH (Analysis 15.12) and serum bicarbonate (Analysis 15.13) were lower in the sevelamer group.
15.1. Analysis.
Comparison 15 Sevelamer versus bixalomer, Outcome 1 Death (all causes).
15.2. Analysis.
Comparison 15 Sevelamer versus bixalomer, Outcome 2 Fracture.
15.3. Analysis.
Comparison 15 Sevelamer versus bixalomer, Outcome 3 Pruritus.
15.4. Analysis.
Comparison 15 Sevelamer versus bixalomer, Outcome 4 Nausea.
15.5. Analysis.
Comparison 15 Sevelamer versus bixalomer, Outcome 5 Vomiting.
15.6. Analysis.
Comparison 15 Sevelamer versus bixalomer, Outcome 6 Abdominal pain.
15.7. Analysis.
Comparison 15 Sevelamer versus bixalomer, Outcome 7 Constipation.
15.8. Analysis.
Comparison 15 Sevelamer versus bixalomer, Outcome 8 Abdominal bloating.
15.9. Analysis.
Comparison 15 Sevelamer versus bixalomer, Outcome 9 Serum phosphate.
15.10. Analysis.
Comparison 15 Sevelamer versus bixalomer, Outcome 10 Serum calcium.
15.11. Analysis.
Comparison 15 Sevelamer versus bixalomer, Outcome 11 Serum calcium‐by‐phosphate product.
15.12. Analysis.
Comparison 15 Sevelamer versus bixalomer, Outcome 12 Serum iPTH.
15.13. Analysis.
Comparison 15 Sevelamer versus bixalomer, Outcome 13 Serum bicarbonate.
Sevelamer versus nicotinamide
NICOREN 2017 reported no differences between sevelamer and nicotinamide for death (Analysis 16.1), stroke (Analysis 16.2), vomiting (Analysis 16.3), serum calcium (Analysis 16.4), serum iPTH (Analysis 16.5), and serum alkaline phosphatase Analysis 16.6).
16.1. Analysis.
Comparison 16 Sevelamer versus nicotinamide, Outcome 1 Death (all causes).
16.2. Analysis.
Comparison 16 Sevelamer versus nicotinamide, Outcome 2 Stroke.
16.3. Analysis.
Comparison 16 Sevelamer versus nicotinamide, Outcome 3 Vomiting.
16.4. Analysis.
Comparison 16 Sevelamer versus nicotinamide, Outcome 4 Serum calcium.
16.5. Analysis.
Comparison 16 Sevelamer versus nicotinamide, Outcome 5 Serum iPTH.
16.6. Analysis.
Comparison 16 Sevelamer versus nicotinamide, Outcome 6 Serum alkaline phosphatase.
Sevelamer versus colestilan
Clinical outcomes for the comparison of sevelamer versus colestilan were reported in three studies (Itoh 2008; Locatelli 2014; NCT00542815). In moderate certainty evidence, sevelamer may reduce death (all causes) compared with colestilan (2 studies, 536 participants: RR 0.30, 95% CI 0.10 to 0.96; I2 = 0%) during follow‐up ranging from 1.9 to 12 months (Analysis 17.1). NCT00542815 reported no differences between sevelamer and colestilan for cardiovascular death (Analysis 17.2), myocardial infarction (Analysis 17.3), stroke (Analysis 17.4), pruritis (Analysis 17.5), nausea (Analysis 17.6), vomiting (Analysis 17.7), abdominal pain (Analysis 17.8), constipation (Analysis 17.9), and diarrhoea (Analysis 17.10). Itoh 2008 reported no differences between the groups for serum phosphate (Analysis 17.11), serum calcium (Analysis 17.12), and serum calcium‐by‐phosphate product (Analysis 17.13). Itoh 2008 reported serum iPTH (Analysis 17.14) and serum alkaline phosphatase (Analysis 17.15) were lower in the sevelamer group.
17.1. Analysis.
Comparison 17 Sevelamer versus colestilan, Outcome 1 Death (all causes).
17.2. Analysis.
Comparison 17 Sevelamer versus colestilan, Outcome 2 Cardiovascular death.
17.3. Analysis.
Comparison 17 Sevelamer versus colestilan, Outcome 3 Myocardial infarction.
17.4. Analysis.
Comparison 17 Sevelamer versus colestilan, Outcome 4 Stroke.
17.5. Analysis.
Comparison 17 Sevelamer versus colestilan, Outcome 5 Pruritus.
17.6. Analysis.
Comparison 17 Sevelamer versus colestilan, Outcome 6 Nausea.
17.7. Analysis.
Comparison 17 Sevelamer versus colestilan, Outcome 7 Vomiting.
17.8. Analysis.
Comparison 17 Sevelamer versus colestilan, Outcome 8 Abdominal pain.
17.9. Analysis.
Comparison 17 Sevelamer versus colestilan, Outcome 9 Constipation.
17.10. Analysis.
Comparison 17 Sevelamer versus colestilan, Outcome 10 Diarrhoea.
17.11. Analysis.
Comparison 17 Sevelamer versus colestilan, Outcome 11 Serum phosphate.
17.12. Analysis.
Comparison 17 Sevelamer versus colestilan, Outcome 12 Serum calcium.
17.13. Analysis.
Comparison 17 Sevelamer versus colestilan, Outcome 13 Serum calcium‐by‐phosphate product.
17.14. Analysis.
Comparison 17 Sevelamer versus colestilan, Outcome 14 Serum iPTH.
17.15. Analysis.
Comparison 17 Sevelamer versus colestilan, Outcome 15 Serum alkaline phosphatase.
Sevelamer versus aluminium
Katopodis 2006 reported no differences between sevelamer and aluminium for nausea (Analysis 18.1), constipation (Analysis 18.2), serum phosphate (Analysis 18.3), serum calcium (Analysis 18.4), and serum iPTH (Analysis 18.5).
18.1. Analysis.
Comparison 18 Sevelamer versus aluminium, Outcome 1 Nausea.
18.2. Analysis.
Comparison 18 Sevelamer versus aluminium, Outcome 2 Constipation.
18.3. Analysis.
Comparison 18 Sevelamer versus aluminium, Outcome 3 Serum phosphate.
18.4. Analysis.
Comparison 18 Sevelamer versus aluminium, Outcome 4 Serum calcium.
18.5. Analysis.
Comparison 18 Sevelamer versus aluminium, Outcome 5 Serum iPTH.
Sevelamer versus magnesium
Zwiech 2011 reported serum phosphate (Analysis 19.1) and serum calcium‐by‐phosphate product (Analysis 19.3) were lower with magnesium; serum calcium (Analysis 19.2) was lower with sevelamer; and there was no difference between the groups for iPTH (Analysis 19.4).
19.1. Analysis.
Comparison 19 Sevelamer versus magnesium, Outcome 1 Serum phosphate.
19.3. Analysis.
Comparison 19 Sevelamer versus magnesium, Outcome 3 Serum calcium‐by‐phosphate product.
19.2. Analysis.
Comparison 19 Sevelamer versus magnesium, Outcome 2 Serum calcium.
19.4. Analysis.
Comparison 19 Sevelamer versus magnesium, Outcome 4 Serum iPTH.
Sevelamer versus sevelamer plus calcium
Chertow 1999 reported no differences between sevelamer and combination sevelamer plus calcium‐based binders for hypercalcaemia (Analysis 20.1) and serum calcium‐by‐phosphate product (Analysis 20.2).
20.1. Analysis.
Comparison 20 Sevelamer versus sevelamer + calcium, Outcome 1 Hypercalcaemia.
20.2. Analysis.
Comparison 20 Sevelamer versus sevelamer + calcium, Outcome 2 Serum calcium‐by‐phosphate product.
Sevelamer versus calcium plus magnesium
CALMAG 2010 reported no differences between sevelamer and combination calcium plus magnesium for serum phosphate (Analysis 21.1), serum calcium (Analysis 21.2), and serum iPTH (Analysis 21.3). Serum alkaline phosphate was reported to be lower with calcium plus magnesium (Analysis 21.4), and serum bicarbonate was reported to be lower with sevelamer (Analysis 21.5).
21.1. Analysis.
Comparison 21 Sevelamer versus calcium + magnesium, Outcome 1 Serum phosphate.
21.2. Analysis.
Comparison 21 Sevelamer versus calcium + magnesium, Outcome 2 Serum calcium.
21.3. Analysis.
Comparison 21 Sevelamer versus calcium + magnesium, Outcome 3 Serum iPTH.
21.4. Analysis.
Comparison 21 Sevelamer versus calcium + magnesium, Outcome 4 Serum alkaline phosphatase.
21.5. Analysis.
Comparison 21 Sevelamer versus calcium + magnesium, Outcome 5 Serum bicarbonate.
Lanthanum versus iron
Fujimori 2017 compared lanthanum to ferric citrate however data could not be extracted.
Sevelamer hydrochloride versus sevelamer carbonate
Fishbane 2010 reported no differences between sevelamer hydrochloride and sevelamer carbonate for death (Analysis 22.1), nausea (Analysis 22.2), vomiting (Analysis 22.3), constipation (Analysis 22.4), and diarrhoea (Analysis 22.5).
22.1. Analysis.
Comparison 22 Sevelamer hydrochloride versus sevelamer carbonate, Outcome 1 Death (all causes).
22.2. Analysis.
Comparison 22 Sevelamer hydrochloride versus sevelamer carbonate, Outcome 2 Nausea.
22.3. Analysis.
Comparison 22 Sevelamer hydrochloride versus sevelamer carbonate, Outcome 3 Vomiting.
22.4. Analysis.
Comparison 22 Sevelamer hydrochloride versus sevelamer carbonate, Outcome 4 Constipation.
22.5. Analysis.
Comparison 22 Sevelamer hydrochloride versus sevelamer carbonate, Outcome 5 Diarrhoea.
Calcium acetate versus calcium carbonate
Data for the comparison of calcium acetate compared with calcium carbonate were reported in four studies (Almirall 1994; Caravaca 1992; Foraster 1998; Janssen 1996). The studies were not designed to evaluate death or cardiovascular endpoints. It was uncertain whether calcium acetate prevents death because the certainty of the evidence was very low (2 studies, 74 participants: RR 1.13, 95% CI 0.07 to 17.30; I2 = 0%) (Analysis 23.1). Calcium acetate may lower the risk of hypercalcaemia compared with calcium carbonate (2 studies, 92 participants: RR 0.66, 95% CI 0.45 to 0.97; I2 = 0%) (Analysis 23.2). Adverse events for the treatment comparison could not be extracted for meta‐analysis.
23.1. Analysis.
Comparison 23 Calcium acetate versus calcium carbonate, Outcome 1 Death (all causes).
23.2. Analysis.
Comparison 23 Calcium acetate versus calcium carbonate, Outcome 2 Hypercalcaemia.
Calcium acetate may make little or no difference to serum phosphate levels (3 studies, 98 participants: MD ‐0.24 mg/dL (‐0.08 mmol/L), 95% CI ‐0.74 to 0.26 mg/dL (‐0.24 to 0.08 mmol/L); I2 = 0%) (Analysis 23.3), serum calcium (3 studies, 98 participants: MD ‐0.21 mg/dL (‐0.05 mmol/L), 95% CI ‐0.45 to 0.04 mg/dL (‐0.11 to 0.01 mmol/L); I2 = 0%) (Analysis 23.4), or serum alkaline phosphatase (2 studies, 35 participants: MD 1.77 IU/L, 95% CI ‐8.80 to 12.35; I2 = 0%) (Analysis 23.7). Almirall 1994 reported no difference between the groups for calcium‐by‐phosphate product (Analysis 23.5) and Foraster 1998 reported no difference in serum iPTH (Analysis 23.6).
23.3. Analysis.
Comparison 23 Calcium acetate versus calcium carbonate, Outcome 3 Serum phosphate.
23.4. Analysis.
Comparison 23 Calcium acetate versus calcium carbonate, Outcome 4 Serum calcium.
23.7. Analysis.
Comparison 23 Calcium acetate versus calcium carbonate, Outcome 7 Serum alkaline phosphatase.
23.5. Analysis.
Comparison 23 Calcium acetate versus calcium carbonate, Outcome 5 Serum calcium‐by‐phosphate product.
23.6. Analysis.
Comparison 23 Calcium acetate versus calcium carbonate, Outcome 6 Serum iPTH.
Investigation for sources of heterogeneity
Subgroup analysis
We pre‐planned subgroup analysis by age (greater or less than 60 years old), CKD GFR categories (G2 to G5 or G5D), baseline serum phosphate level (above or below 4.5 mg/dL (1.5 mmol/L)), study duration (above and below 12 months), and methodological quality (low risk of bias for allocation concealment and high or unclear risk of bias). There was no evidence of different treatment effects based on these factors (Analysis 24.1; Analysis 24.2; Analysis 24.3; Analysis 24.4; Analysis 24.5). Subgroup analyses based on different serum phosphate levels at baseline were not possible. Subgroup analyses based on CKD GFR category were limited in statistical power as placebo or usual care controlled studies primarily involved participants with CKD G2 to G5, and those comparing calcium‐free with calcium‐based binders involved participants with GFR G5D.
24.1. Analysis.
Comparison 24 Subgroup: sevelamer versus calcium, Outcome 1 Death (all causes): age.
24.2. Analysis.
Comparison 24 Subgroup: sevelamer versus calcium, Outcome 2 Death (all causes): CKD GFR category.
24.3. Analysis.
Comparison 24 Subgroup: sevelamer versus calcium, Outcome 3 Cardiovascular death: CKD GFR category.
24.4. Analysis.
Comparison 24 Subgroup: sevelamer versus calcium, Outcome 4 Death (all causes): study duration.
24.5. Analysis.
Comparison 24 Subgroup: sevelamer versus calcium, Outcome 5 Death (all causes): random sequence generation and allocation concealment.
Sensitivity analysis
Due to the low certainty of the comparison of sevelamer versus calcium on death (all causes) because of study limitations and evidence of important statistical heterogeneity, we did a sensitivity analysis restricting the comparison to studies with a low risk of selection bias. Limiting analysis to include the six studies at low risk of bias for this treatment comparison (Block 2005; BRiC 2005; CARE 2004; Chertow 2002; INDEPENDENT‐CKD 2012; Kakuta 2011) resulted in evidence of decreased death (all causes) with sevelamer compared with calcium‐based binders in an analysis without evidence of important statistical heterogeneity (RR 0.58, 95% CI 0.36 to 0.94; I2 = 7%; high certainty evidence).
Discussion
Summary of main results
In this updated review, 69 new studies have been added to the 2011 Cochrane review and 23 were removed to provide a total of 104 studies involving 13,744 adults. Studies comparing phosphate binders (sevelamer, lanthanum, calcium, and ferric citrate) to placebo or usual care without binder administration were largely limited to adult patients with CKD G2 to G5 not requiring dialysis (15/25 studies involving 1467 participants), Head‐to‐head studies including those comparing non‐calcium‐ and calcium‐based binders were predominantly conducted among participants with CKD G5D treated with dialysis (74/81 studies involving 10,364 participants).
Overall, the superiority of phosphate binders to placebo has not been demonstrated across the range of GFR categories. The addition of new studies has led to the updated conclusion that sevelamer may decrease death (all causes) in studies involving people with CKD G5D when compared with calcium‐based binders. When restricted to higher quality studies, high certainty evidence suggested that sevelamer lead to lower death (all causes) when compared to calcium‐based binders. Despite over one hundred studies eligible for this review, only three were designed to examine non‐fatal cardiovascular events and all‐cause and cardiovascular death as primary or important secondary outcomes. Currently, the evidence for effects of phosphate binders on cardiovascular events and cardiovascular death is uncertain due to a paucity of data. The effects of treatment on fracture and rare outcomes such as calciphylaxis were very uncertain because of a lack of studies reporting these outcomes.
Phosphate binders versus placebo or usual care
Placebo‐ or usual care‐controlled studies predominantly involved participants who had moderate CKD (CKD G2 to G5 not requiring dialysis) and were of short duration (generally three months or less). These studies generally involved few participants, with nearly all involving < 200 adults. All but two placebo‐controlled studies had been published since 2008.
No placebo‐controlled study was designed to evaluate treatment effects on death (all causes) or individual major cardiovascular outcomes, such as stroke or myocardial infarction. Based on a limited number of short‐term studies, whether phosphate binders prevented all‐cause or cardiovascular death in adults with CKD G2 to G5 was uncertain. There is currently no high‐certainty evidence that phosphate binders prevent myocardial infarction or stroke when compared with placebo or usual care. Sevelamer may incur nausea while lanthanum may lead to nausea and constipation, and iron‐based binders may lead to diarrhoea or constipation.
We were uncertain whether phosphate binders impacted on coronary artery calcium scores, fracture risk, or calciphylaxis when compared to placebo in adults with CKD G2 to 5, although the follow‐up duration was very short. Not unexpectedly, calcium‐based binders incurred substantially increased risks of hypercalcaemia.
Non‐calcium‐based binders versus calcium‐based binders
Unlike placebo‐controlled studies which were conducted in the setting of CKD G2 to 5, active comparator studies evaluating treatment against calcium‐based binders were generally conducted among adults with CKD G5D treated with dialysis. Studies involved generally few participants with the median sample size of 70 adults. Follow‐up ranged between 1.8 and 36 months, with a median of 6 months. Three studies were designed to evaluate all‐cause or cause‐specific death as a pre‐specified primary or secondary outcome.
In low certainty evidence, sevelamer may prevent death (all causes) when compared with calcium‐based binders. This finding was robust when evaluated in an analyses restricted to higher quality studies, leading to higher certainty in the result. It is unclear from this observation whether sevelamer leads to lower death, calcium‐binders cause excess death, or both these observations are true.
It was uncertain whether lanthanum decreased death (all causes) compared with calcium‐based binders, and comparative data for iron‐based binders were absent. There was no evidence that non‐calcium phosphate binders improved fracture, pruritus, calciphylaxis, or coronary artery calcification. Sevelamer and lanthanum may have similar risks of nausea, vomiting or constipation compared with calcium‐based binders. Not unexpectedly, sevelamer and lanthanum may incur less hypercalcaemia than calcium‐based binders. There was no evidence that non‐calcium and calcium‐based binders had different effects on serum phosphate levels.
Non‐calcium‐based binder versus non‐calcium‐based binder
Head‐to‐head studies of sevelamer, lanthanum, iron, and other non‐calcium phosphate binders were extremely limited. No available studies were designed to evaluate death or cardiovascular events. The effects of treatment on other outcomes were obscured by the paucity of data including for adverse treatment events.
Overall, there was insufficient evidence to conduct subgroup analyses based on CKD GFR category and to assess individual phosphate binder agents within drug classes.
Overall completeness and applicability of evidence
This review included evidence from 104 RCTs from 29 different countries or global regions, to evaluate the effects of phosphate binders versus placebo or usual care or other phosphate binder. In general, placebo‐ and usual care studies were more recently published and involved adults with CKD who do not require dialysis therapy. Active comparator studies were mostly conducted among dialysis patients. Therefore, there is a paucity of placebo‐controlled studies in the dialysis setting.
In general, study follow‐up was short and very few studies were designed to evaluate death endpoints, specifically for lanthanum and iron‐based binders compared with calcium‐based agents for dialysis patients. An ongoing study (LANDMARK 2017) of lanthanum carbonate compared with calcium carbonate has completed recruitment of 2309 participants treated with haemodialysis and is due to report in July 2018. The primary outcome of the LANDMARK 2017 is survival free from a composite of cardiovascular death and nonfatal cardiovascular events, and may provide new information relevant to death outcomes for phosphate binders in CKD G5D. A further placebo‐controlled study of lanthanum among 278 participants with an eGFR between 15 to 44 mL/ min/1.73m2 is due to complete follow‐up in December 2018 (IMPROVE‐CKD 2012) with the primary outcome of arterial compliance. This may provide additional data for surrogate outcomes in CKD G2 to G5 not requiring dialysis.
A key limitation in the evidence is the lack of standardisation of outcome reporting in the available studies. As a result, many outcomes, such as cardiovascular events, hospitalisation, itch, calciphylaxis, and fracture were reported in few studies. For many of these outcomes, the data were available on the study registry database rather than reporting within primary journal publication. In future phosphate binder studies, standardisation of outcome reporting, as prioritised by the Standardised Outcomes in Nephrology (SONG) by patients, caregivers and health professionals may assist to improve the evidence base. In the haemodialysis setting, this would include the compulsory reporting of endpoints for fatigue, cardiovascular disease, vascular access, and death (SONG‐HD). Based on SONG‐HD, additional core outcomes for studies of phosphate binders might include mobility, pain, hospitalisation, bone health, calcium, itching, nausea/vomiting, serum phosphate levels, restless legs syndrome, and financial impact.
Complications from phosphate binders reported in the included studies were principally gastrointestinal adverse events. However, as the event rates in available studies were often low, we could not be certain whether there were between‐group differences for many of the adverse outcomes. Potential adverse events such as severe bowel complications, or fractures related to suppressed bone turnover (from calcium‐based binders) and microfracture accumulation are not well understood based on existing studies.
Based on epidemiological data, there is evidence that higher serum phosphate levels are consistently associated with death for people with CKD (Block 1998; Block 2004; Palmer 2011). This evidence generates the biological plausibility for use of phosphate binders to improve clinical outcomes, and generates the ongoing clinical equipoise needed for the further conduct of RCTs with sufficient power to detect patient‐level outcomes. Based on the data in this review, evidence for outcomes such as death, cardiovascular events, fracture, pain, and health‐related quality of life are required to support decision‐making for phosphate binder uses in CKD G2 to G5, and data for cardiovascular events and skeletal symptoms would assist decision‐making for patients with CKD 5D, particularly for regimens restricting the use of calcium‐based binders and less stringent serum phosphate control.
Quality of the evidence
The overall certainty of the evidence for most outcomes was low or very low, meaning that future research is likely to have an important impact on our knowledge of the benefits and harms of phosphate binders according to the GRADE approach (GRADE 2008). Key methodological limitations included attrition from follow‐up due to events that may have been related to the clinical outcomes of interest, differences between treatment groups, or relatively larger proportions of randomised participants. Methods for random sequence generation and allocation concealment were insufficiently reported in most studies, preventing judgement of the risks of bias for these parameters. Empirical evidence suggests that treatment effects may be exaggerated when allocation concealment and blinding are not reported within studies, although this is particularly relevant for subjective outcomes including symptoms and adverse events (Wood 2008). Study limitations led to the downgrading of all evidence by one level (from high to moderate). Minimisation of selection and detection bias in future research studies would increase the certainty of treatment benefits and harms.
The relative impact of sevelamer and calcium‐based binders on death was downgraded due to important statistical heterogeneity (I2 = 74%), leading to low certainty in the evidence. This heterogeneity could not be explained by pre‐specified subgroup analyses including subgroups based on age, stage of CKD, duration or follow‐up or study risk of bias. When this analysis was restricted to the six studies (1053 participants) at low risk of bias for random sequence generation or allocation concealment, we found that there was moderate‐to‐high certainty of lower death with sevelamer compared with calcium‐based binders (RR 0.55, 95% CI 0.36 to 0.82; I2 = 4%). This meta‐analysis that was restricted to lower risk studies provided a similar magnitude of effect as the full meta‐analysis of all available studies, and had no important statistical heterogeneity.
Evidence for adverse events was frequently low or very low certainty, due to substantial imprecision in treatment estimates and study limitations including selective reporting of outcomes.
Potential biases in the review process
This review was carried out using standard Cochrane methods. Each step was completed independently by at least two authors including selection of studies, data management, and risk of bias assessment, thus reducing the risks of errors in identification of eligible studies and adjudication of evidence certainty. A highly sensitive search of the Cochrane Kidney Transplant Specialised Registry was completed without language restriction in November 2017, with a final search undertaken in just prior to publication in July 2018. The Registry contains hand‐searched literature and conference proceedings, maximising the inclusion of grey literature in this review. Most studies did not report key outcomes in a format available for meta‐analysis. This potentially introduced bias in our review and may have been a source of publication bias. We identified three studies (NCT00317694; NCT00560300; NCT01968759) that had completed based on study registry information but for which we could not obtain results despite attempted contact with investigators. These studies may be a potential source of bias. Formal assessment for publication bias through visualisation of asymmetry in funnel plots was precluded for many treatments and outcomes because of few studies.
Agreements and disagreements with other studies or reviews
Numerous systematic reviews with meta‐analysis of RCTs investigating phosphate binders in CKD have been published including our own (Palmer 2016), and others (Bravo‐Soto 2017; Burke 2003; Habbous 2017; Jamal 2009; Jamal 2013; Manns 2004; Patel 2016; Sekercioglu 2016; Sekercioglu 2017; Tonelli 2007; Wang 2015; Zhang 2010). Most existing reviews have focused on the comparison between calcium‐based and non‐calcium‐based phosphate binders because of the concern that excess exogenous calcium may accelerate vascular calcification and cardiovascular complications and calciphylaxis, and due to emerging evidence of higher death with calcium‐based treatments (Jamal 2009). Essentially the current Cochrane review is consistent with the findings of earlier reviews that have identified lower death for sevelamer treatment compared with calcium‐based binders although few existing analyses have incorporated judgement of evidence certainty. The reported relative risk for death (all causes) with sevelamer compared with calcium‐based phosphate binders have ranged between 0.54 and 0.78. In the review by Bravo‐Soto 2017 including studies available in existing systematic reviews, the authors used the GRADE process. They downgraded evidence certainty for death by three grades to very low due to risks of bias (two downgrades) and inconsistency between studies.
The present Cochrane review update is consistent with existing systematic reviews demonstrating there is little or no evidence for beneficial treatment effects on cardiovascular death for non‐calcium versus calcium‐based binders, a marked reduction in risks of hypercalcaemia with non‐calcium binders, and variable hazards of gastrointestinal adverse effects with specific agents.
A previous review has focused on the available evidence with respect to coronary artery calcification (Zhang 2010). The findings of that review are broadly consistent with ours that it is not possible to establish whether or not specific phosphate binders alter progression of coronary artery calcification scores.
Notably in our and other reviews, robust long‐term study data for lanthanum or iron‐based binders compared with either placebo or calcium‐based binders on death outcomes and adverse events are lacking.
The findings of this updated review are consistent with the Kidney Disease Improving Global Outcomes (KDIGO) 2017 Clinical Practice Guideline Update for the evaluation, prevention and treatment of CKD‐MBD (KDIGO 2017) that suggest that the dose of calcium‐based phosphate binders is restricted among adult patients receiving phosphate‐lowering treatment. This updated guideline removes the more restrictive qualifier present in the earlier 2009 KDIGO guideline that calcium‐based phosphate‐binders be avoided in patients with hypercalcaemia, known arterial calcification, adynamic bone disease, or low serum PTH levels (KDIGO 2009), and is updated based on the additional death data available from three new studies (Block 2009; INDEPENDENT‐CKD 2012; INDEPENDENT‐HD 2009). It should be noted that current evidence does not allow us to discern whether the increased possible hazard for death with calcium‐based binders compared with sevelamer is caused by calcium‐containing medications. A placebo‐controlled study of calcium‐based phosphate binders could address this question but such a study is unlikely to be conducted.
Authors' conclusions
Implications for practice.
The superiority of phosphate binders over placebo has not been demonstrated across the range of GFR categories. The current evidence for phosphate binders supports the use of sevelamer compared with calcium‐based agents based on lower death (all causes) with sevelamer for adults with CKD G5D. Whether this finding is due to avoidance of calcium loading from calcium‐based binders, or a direct beneficial effect of sevelamer on lowering phosphate balance or both is not known. It is not possible to definitively establish whether this possible benefit of sevelamer on death (all causes) when compared with calcium‐based binders extends to other non‐calcium‐based binders including lanthanum and iron‐based binders as studies for these agents have not evaluated death and cardiovascular outcomes. However, the LANDMARK 2017 is near to reporting. The impact of sevelamer or other non‐calcium‐based binders on cardiovascular events and death, bone symptoms, or vascular calcification is uncertain. There is very limited evidence for phosphate binders compared with placebo or usual care in the dialysis setting. As such, the superiority of phosphate‐binding therapies over placebo has not been demonstrated across the range of CKD GFR categories.
For patients with CKD G2 to G5 not requiring dialysis, there is very limited evidence for phosphate binders compared with placebo or usual care. The impact of phosphate binder therapy on cardiovascular complications and bone and skeletal symptoms is uncertain for this group of patients.
Overall, there are very few data for the comparative effects of individual phosphate binders including iron‐based binders and sevelamer hydrochloride versus sevelamer bicarbonate.
Patients across the range of GFR categories should be informed about the low‐ to very‐low certainty evidence for use of phosphate binders with respect to death and cardiovascular outcomes and of the potential for phosphate binders to cause harm. Patients in CKD GFR categories G2 to G5 not treated with dialysis may reasonably choose not to receive or limit phosphate binder therapy based on the lack of clear evidence for improved clinical outcomes and potential side‐effects. Patients who are on dialysis should be informed of the balance between the potential benefits and adverse effects of phosphate binders, including possible differences in these benefits and adverse events between binder classes as well as the lack of evidence of phosphate binders compared with placebo. Patients treated with dialysis may reasonably wish to avoid or to limit calcium‐based binders due to the potential for higher treatment‐related death and may reasonably choose not to receive or limit phosphate binder therapy due to the low or very low certainty evidence.
Implications for research.
Based on limitations in existing studies and a paucity of evidence for specific clinical questions, further research is likely to change the estimated effects of different phosphate binders in CKD and increase our certainty in the evidence.
Current research does not provide high‐quality evidence for the long‐term benefits of lanthanum or iron‐based binders compared with either placebo or calcium‐based treatment. The LANDMARK 2017 comparing lanthanum carbonate versus calcium carbonate among >2300 patients is due to report and may offer higher certainty for the effects of lanthanum carbonate for people with ESKD treated with dialysis. It will be important to update this Cochrane review when the LANDMARK study results are reported. A similar study of an iron‐based binder such as ferric citrate or sucroferric oxyhydroxide compared with a calcium‐based binder or placebo and designed to evaluate death and cardiovascular events would inform contemporary clinical decision‐making.
The present body of evidence for phosphate binders includes over 100 studies involving over 13,000 patients. Despite this, evidence for the use of phosphate binders is low or very low certainty because of the dominance of small studies, the short duration of follow‐up for many studies, and the incomplete reporting of core outcomes that are most relevant to clinical care. Future phosphate binder studies should be designed to evaluate patient‐centred core outcomes based on SONG‐HD together with systematic reporting of adverse events and specific outcomes related to CKD‐MBD, such as bone pain, inability to participate in life and work, health‐related quality of life, and impaired mobility. It would be very informative if future studies could incorporate cost‐effectiveness analyses as part of the study design.
Studies comparing non‐calcium phosphate binders with calcium binders are principally in patients treated with dialysis. Future large‐scale placebo‐controlled studies of sevelamer, lanthanum, or iron‐based binders particularly involving patients treated with dialysis are critical to informing clinical across the range of CKD GFR categories would inform clinical care.
What's new
| Date | Event | Description |
|---|---|---|
| 12 July 2018 | New citation required and conclusions have changed | New studies included |
| 12 July 2018 | New search has been performed | Review updated. Conclusions changed. |
Acknowledgements
We thank Narelle Willis, Ruth Mitchell (Trials Search Coordinator) and Cochrane Kidney and Transplant for assistance with preparation of the first published version of this review in 2011. We thank Fiona Russell, Gail Higgins, and Narelle Willis from Cochrane Kidney and Transplant for support during the preparation of this 2018 update. We thank the reviewers and editors in the review process for both versions of the review. We also acknowledge the work of Dr Sankar D. Navaneethan who was the first author on the 2011 review. We also thank Dr Pooja Chaukiyal (PC) who contributed to the protocol development stage for the 2011 review. We thank all the authors who provided additional details of their studies.
Appendices
Appendix 1. Electronic search strategies
| Database | Search terms |
| CENTRAL |
|
| MEDLINE |
|
| EMBASE |
|
Appendix 2. Risk of bias assessment tool
| Potential source of bias | Assessment criteria |
|
Random sequence generation Selection bias (biased allocation to interventions) due to inadequate generation of a randomised sequence |
Low risk of bias: Random number table; computer random number generator; coin tossing; shuffling cards or envelopes; throwing dice; drawing of lots; minimisation (minimisation may be implemented without a random element, and this is considered to be equivalent to being random). |
| High risk of bias: Sequence generated by odd or even date of birth; date (or day) of admission; sequence generated by hospital or clinic record number; allocation by judgement of the clinician; by preference of the participant; based on the results of a laboratory test or a series of tests; by availability of the intervention. | |
| Unclear: Insufficient information about the sequence generation process to permit judgement. | |
|
Allocation concealment Selection bias (biased allocation to interventions) due to inadequate concealment of allocations prior to assignment |
Low risk of bias: Randomisation method described that would not allow investigator/participant to know or influence intervention group before eligible participant entered in the study (e.g. central allocation, including telephone, web‐based, and pharmacy‐controlled, randomisation; sequentially numbered drug containers of identical appearance; sequentially numbered, opaque, sealed envelopes). |
| High risk of bias: Using an open random allocation schedule (e.g. a list of random numbers); assignment envelopes were used without appropriate safeguards (e.g. if envelopes were unsealed or non‐opaque or not sequentially numbered); alternation or rotation; date of birth; case record number; any other explicitly unconcealed procedure. | |
| Unclear: Randomisation stated but no information on method used is available. | |
|
Blinding of participants and personnel Performance bias due to knowledge of the allocated interventions by participants and personnel during the study |
Low risk of bias: No blinding or incomplete blinding, but the review authors judge that the outcome is not likely to be influenced by lack of blinding; blinding of participants and key study personnel ensured, and unlikely that the blinding could have been broken. |
| High risk of bias: No blinding or incomplete blinding, and the outcome is likely to be influenced by lack of blinding; blinding of key study participants and personnel attempted, but likely that the blinding could have been broken, and the outcome is likely to be influenced by lack of blinding. | |
| Unclear: Insufficient information to permit judgement | |
|
Blinding of outcome assessment Detection bias due to knowledge of the allocated interventions by outcome assessors. |
Low risk of bias: No blinding of outcome assessment, but the review authors judge that the outcome measurement is not likely to be influenced by lack of blinding; blinding of outcome assessment ensured, and unlikely that the blinding could have been broken. |
| High risk of bias: No blinding of outcome assessment, and the outcome measurement is likely to be influenced by lack of blinding; blinding of outcome assessment, but likely that the blinding could have been broken, and the outcome measurement is likely to be influenced by lack of blinding. | |
| Unclear: Insufficient information to permit judgement | |
|
Incomplete outcome data Attrition bias due to amount, nature or handling of incomplete outcome data. |
Low risk of bias: No missing outcome data; reasons for missing outcome data unlikely to be related to true outcome (for survival data, censoring unlikely to be introducing bias); missing outcome data balanced in numbers across intervention groups, with similar reasons for missing data across groups; for dichotomous outcome data, the proportion of missing outcomes compared with observed event risk not enough to have a clinically relevant impact on the intervention effect estimate; for continuous outcome data, plausible effect size (difference in means or standardised difference in means) among missing outcomes not enough to have a clinically relevant impact on observed effect size; missing data have been imputed using appropriate methods. |
| High risk of bias: Reason for missing outcome data likely to be related to true outcome, with either imbalance in numbers or reasons for missing data across intervention groups; for dichotomous outcome data, the proportion of missing outcomes compared with observed event risk enough to induce clinically relevant bias in intervention effect estimate; for continuous outcome data, plausible effect size (difference in means or standardized difference in means) among missing outcomes enough to induce clinically relevant bias in observed effect size; ‘as‐treated’ analysis done with substantial departure of the intervention received from that assigned at randomisation; potentially inappropriate application of simple imputation. | |
| Unclear: Insufficient information to permit judgement | |
|
Selective reporting Reporting bias due to selective outcome reporting |
Low risk of bias: The study protocol is available and all of the study’s pre‐specified (primary and secondary) outcomes that are of interest in the review have been reported in the pre‐specified way; the study protocol is not available but it is clear that the published reports include all expected outcomes, including those that were pre‐specified (convincing text of this nature may be uncommon). |
| High risk of bias: Not all of the study’s pre‐specified primary outcomes have been reported; one or more primary outcomes is reported using measurements, analysis methods or subsets of the data (e.g. sub‐scales) that were not pre‐specified; one or more reported primary outcomes were not pre‐specified (unless clear justification for their reporting is provided, such as an unexpected adverse effect); one or more outcomes of interest in the review are reported incompletely so that they cannot be entered in a meta‐analysis; the study report fails to include results for a key outcome that would be expected to have been reported for such a study. | |
| Unclear: Insufficient information to permit judgement | |
|
Other bias Bias due to problems not covered elsewhere in the table |
Low risk of bias: The study appears to be free of other sources of bias. |
| High risk of bias: Had a potential source of bias related to the specific study design used; stopped early due to some data‐dependent process (including a formal‐stopping rule); had extreme baseline imbalance; has been claimed to have been fraudulent; had some other problem. | |
| Unclear: Insufficient information to assess whether an important risk of bias exists; insufficient rationale or evidence that an identified problem will introduce bias. |
Data and analyses
Comparison 1. Sevelamer versus placebo or usual care.
| Outcome or subgroup title | No. of studies | No. of participants | Statistical method | Effect size |
|---|---|---|---|---|
| 1 Death (all causes) | 3 | 248 | Risk Ratio (IV, Random, 95% CI) | 2.16 [0.20, 22.84] |
| 2 Myocardial infarction | 3 | 205 | Risk Ratio (IV, Random, 95% CI) | 1.00 [0.11, 9.35] |
| 3 Stroke | 1 | Risk Ratio (IV, Random, 95% CI) | Totals not selected | |
| 4 Hospitalisation | 1 | Risk Ratio (IV, Random, 95% CI) | Totals not selected | |
| 5 Fracture | 1 | Risk Ratio (IV, Random, 95% CI) | Totals not selected | |
| 6 Pruritus | 1 | Risk Ratio (IV, Random, 95% CI) | Totals not selected | |
| 7 Nausea | 3 | 370 | Risk Ratio (IV, Random, 95% CI) | 1.27 [0.07, 22.42] |
| 8 Vomiting | 2 | 165 | Risk Ratio (IV, Random, 95% CI) | 2.09 [0.26, 16.57] |
| 9 Abdominal pain | 3 | 370 | Risk Ratio (IV, Random, 95% CI) | 0.38 [0.13, 1.14] |
| 10 Constipation | 4 | 430 | Risk Ratio (IV, Random, 95% CI) | 6.92 [2.24, 21.38] |
| 11 Diarrhoea | 2 | 165 | Risk Ratio (IV, Random, 95% CI) | 2.02 [0.13, 31.62] |
| 12 Abdominal bloating | 1 | Risk Ratio (IV, Random, 95% CI) | Totals not selected | |
| 13 End‐stage kidney disease | 2 | 139 | Risk Ratio (IV, Random, 95% CI) | 1.51 [0.52, 4.36] |
| 14 Coronary artery calcium score | 2 | 115 | Mean Difference (IV, Random, 95% CI) | ‐70.19 [‐362.44, 222.06] |
| 15 Serum phosphate | 5 | 483 | Mean Difference (IV, Random, 95% CI) | ‐0.28 [‐0.94, 0.39] |
| 16 Serum calcium | 5 | 366 | Mean Difference (IV, Random, 95% CI) | 0.03 [‐0.08, 0.14] |
| 17 Hypercalcaemia | 1 | Risk Ratio (IV, Random, 95% CI) | Totals not selected | |
| 18 Serum calcium‐by‐phosphate product | 2 | 265 | Mean Difference (IV, Random, 95% CI) | ‐4.23 [‐26.52, 18.05] |
| 19 Serum iPTH | 2 | 120 | Mean Difference (IV, Random, 95% CI) | ‐6.55 [‐21.16, 8.07] |
| 20 Serum alkaline phosphatase | 1 | Mean Difference (IV, Random, 95% CI) | Totals not selected | |
| 21 Serum bicarbonate | 6 | 571 | Mean Difference (IV, Random, 95% CI) | 0.12 [‐1.30, 1.54] |
| 22 eGFR | 4 | 306 | Mean Difference (IV, Random, 95% CI) | ‐0.45 [‐4.74, 3.85] |
| 23 Bone mineral density: lumbar spine | 1 | Mean Difference (IV, Random, 95% CI) | Totals not selected | |
| 24 Bone mineral density: hip | 1 | Mean Difference (IV, Random, 95% CI) | Totals not selected | |
| 25 Klotho | 1 | Mean Difference (IV, Random, 95% CI) | Totals not selected |
Comparison 2. Lanthanum versus placebo or usual care.
| Outcome or subgroup title | No. of studies | No. of participants | Statistical method | Effect size |
|---|---|---|---|---|
| 1 Death (all causes) | 3 | 214 | Risk Ratio (IV, Random, 95% CI) | 1.63 [0.07, 37.12] |
| 2 Myocardial infarction | 3 | 239 | Risk Ratio (IV, Random, 95% CI) | 1.61 [0.17, 14.97] |
| 3 Stroke | 1 | Risk Ratio (IV, Random, 95% CI) | Totals not selected | |
| 4 Hospitalisation | 1 | Risk Ratio (IV, Random, 95% CI) | Totals not selected | |
| 5 Fracture | 1 | Risk Ratio (IV, Random, 95% CI) | Totals not selected | |
| 6 Pruritus | 3 | 345 | Risk Ratio (IV, Random, 95% CI) | 1.09 [0.14, 8.45] |
| 7 Pruritus | 1 | Mean Difference (IV, Random, 95% CI) | Totals not selected | |
| 8 Nausea | 4 | 383 | Risk Ratio (IV, Random, 95% CI) | 3.72 [1.36, 10.18] |
| 9 Vomiting | 3 | 261 | Risk Ratio (IV, Random, 95% CI) | 2.76 [0.41, 18.63] |
| 10 Abdominal pain | 2 | 120 | Risk Ratio (IV, Random, 95% CI) | 0.23 [0.03, 1.96] |
| 11 Constipation | 4 | 299 | Risk Ratio (IV, Random, 95% CI) | 2.98 [1.21, 7.30] |
| 12 Diarrhoea | 3 | 261 | Risk Ratio (IV, Random, 95% CI) | 0.68 [0.13, 3.68] |
| 13 End‐stage kidney disease | 1 | Risk Ratio (IV, Random, 95% CI) | Totals not selected | |
| 14 Coronary artery calcification score | 1 | Mean Difference (IV, Random, 95% CI) | Totals not selected | |
| 15 Vascular calcification score | 1 | Mean Difference (IV, Random, 95% CI) | Totals not selected | |
| 16 Serum phosphate | 4 | 271 | Mean Difference (IV, Random, 95% CI) | ‐0.48 [‐0.90, ‐0.05] |
| 17 Serum calcium | 2 | 91 | Mean Difference (IV, Random, 95% CI) | 0.03 [‐0.18, 0.23] |
| 18 Hypercalcaemia | 1 | Risk Ratio (IV, Random, 95% CI) | Totals not selected | |
| 19 Serum calcium‐by‐phosphate product | 2 | 194 | Mean Difference (IV, Random, 95% CI) | ‐4.36 [‐9.96, 1.24] |
| 20 Serum iPTH | 4 | 253 | Mean Difference (IV, Random, 95% CI) | 10.07 [‐10.69, 30.83] |
| 21 eGFR | 2 | 128 | Mean Difference (IV, Random, 95% CI) | 0.13 [‐1.80, 2.07] |
| 22 Bone mineral density: lumbar spine | 1 | Mean Difference (IV, Random, 95% CI) | Totals not selected | |
| 23 Serum FGF23 | 2 | 50 | Std. Mean Difference (IV, Random, 95% CI) | 0.32 [‐0.81, 1.45] |
2.9. Analysis.
Comparison 2 Lanthanum versus placebo or usual care, Outcome 9 Vomiting.
2.16. Analysis.
Comparison 2 Lanthanum versus placebo or usual care, Outcome 16 Serum phosphate.
Comparison 3. Iron versus placebo or usual care.
| Outcome or subgroup title | No. of studies | No. of participants | Statistical method | Effect size |
|---|---|---|---|---|
| 1 Death (all causes) | 2 | 239 | Risk Ratio (IV, Random, 95% CI) | 0.52 [0.06, 4.65] |
| 2 Fracture | 1 | Risk Ratio (IV, Random, 95% CI) | Totals not selected | |
| 3 Pruritus | 1 | Risk Ratio (IV, Random, 95% CI) | Totals not selected | |
| 4 Nausea | 1 | Risk Ratio (IV, Random, 95% CI) | Totals not selected | |
| 5 Constipation | 3 | 422 | Risk Ratio (IV, Random, 95% CI) | 2.66 [1.15, 6.12] |
| 6 Diarrhoea | 3 | 422 | Risk Ratio (IV, Random, 95% CI) | 2.81 [1.18, 6.68] |
| 7 Abdominal pain | 2 | 332 | Risk Ratio (IV, Random, 95% CI) | 1.20 [0.34, 4.27] |
| 8 Serum phosphate | 3 | 301 | Mean Difference (IV, Random, 95% CI) | ‐1.33 [‐2.25, ‐0.41] |
| 9 Serum calcium | 3 | 301 | Mean Difference (IV, Random, 95% CI) | 0.21 [0.09, 0.33] |
| 10 Serum calcium‐by‐phosphate product | 1 | Mean Difference (IV, Random, 95% CI) | Totals not selected | |
| 11 Serum alkaline phosphatase | 1 | Mean Difference (IV, Random, 95% CI) | Totals not selected | |
| 12 Serum bicarbonate | 1 | Mean Difference (IV, Random, 95% CI) | Totals not selected | |
| 13 eGFR | 2 | 239 | Mean Difference (IV, Random, 95% CI) | ‐0.67 [‐2.97, 1.64] |
Comparison 4. Calcium versus placebo or usual care.
| Outcome or subgroup title | No. of studies | No. of participants | Statistical method | Effect size |
|---|---|---|---|---|
| 1 Death (all causes) | 1 | Risk Ratio (IV, Random, 95% CI) | Totals not selected | |
| 2 Myocardial infarction | 2 | 147 | Risk Ratio (IV, Random, 95% CI) | 1.36 [0.09, 21.71] |
| 3 Stroke | 2 | 197 | Risk Ratio (IV, Random, 95% CI) | 4.15 [0.17, 99.62] |
| 4 Fracture | 1 | Risk Ratio (IV, Random, 95% CI) | Totals not selected | |
| 5 Pruritus | 2 | 197 | Risk Ratio (IV, Random, 95% CI) | 1.19 [0.29, 4.81] |
| 6 Nausea | 2 | 197 | Risk Ratio (IV, Random, 95% CI) | 0.58 [0.15, 2.18] |
| 7 Vomiting | 1 | Risk Ratio (IV, Random, 95% CI) | Totals not selected | |
| 8 Abdominal pain | 2 | 197 | Risk Ratio (IV, Random, 95% CI) | 0.66 [0.13, 3.34] |
| 9 Constipation | 2 | 197 | Risk Ratio (IV, Random, 95% CI) | 2.44 [0.32, 18.42] |
| 10 Diarrhoea | 2 | 197 | Risk Ratio (IV, Random, 95% CI) | 0.94 [0.39, 2.28] |
| 11 Coronary artery calcification score | 1 | Mean Difference (IV, Random, 95% CI) | Totals not selected | |
| 12 Serum phosphate | 3 | 151 | Mean Difference (IV, Random, 95% CI) | ‐0.18 [‐1.30, 0.95] |
| 13 Serum calcium | 3 | 151 | Mean Difference (IV, Random, 95% CI) | 0.33 [‐0.26, 0.92] |
| 14 Hypercalcaemia | 3 | 215 | Risk Ratio (IV, Random, 95% CI) | 7.28 [1.64, 32.29] |
| 15 Serum calcium‐by‐phosphate product | 1 | Mean Difference (IV, Random, 95% CI) | Totals not selected | |
| 16 Serum iPTH | 2 | 133 | Mean Difference (IV, Random, 95% CI) | ‐80.15 [‐305.46, 145.16] |
| 17 Serum alkaline phosphatase | 2 | 78 | Mean Difference (IV, Random, 95% CI) | 34.86 [‐21.47, 91.20] |
| 18 Serum bicarbonate | 2 | 138 | Mean Difference (IV, Random, 95% CI) | ‐1.85 [‐3.12, ‐0.59] |
| 19 eGFR | 1 | Mean Difference (IV, Random, 95% CI) | Totals not selected |
Comparison 5. Bixalomer versus placebo or usual care.
| Outcome or subgroup title | No. of studies | No. of participants | Statistical method | Effect size |
|---|---|---|---|---|
| 1 Death (all causes) | 1 | Risk Ratio (IV, Random, 95% CI) | Totals not selected | |
| 2 End‐stage kidney disease | 1 | Risk Ratio (IV, Random, 95% CI) | Totals not selected | |
| 3 Nausea | 1 | Risk Ratio (IV, Random, 95% CI) | Totals not selected | |
| 4 Abdominal pain | 1 | Risk Ratio (IV, Random, 95% CI) | Totals not selected | |
| 5 Constipation | 1 | Risk Ratio (IV, Random, 95% CI) | Totals not selected | |
| 6 Diarrhoea | 1 | Risk Ratio (IV, Random, 95% CI) | Totals not selected |
Comparison 6. Nicotinamide versus placebo or usual care.
| Outcome or subgroup title | No. of studies | No. of participants | Statistical method | Effect size |
|---|---|---|---|---|
| 1 Death (all causes) | 1 | Risk Ratio (IV, Random, 95% CI) | Totals not selected | |
| 2 Pruritus | 1 | Risk Ratio (IV, Random, 95% CI) | Totals not selected | |
| 3 Constipation | 1 | Risk Ratio (IV, Random, 95% CI) | Totals not selected | |
| 4 Diarrhoea | 2 | 73 | Risk Ratio (IV, Random, 95% CI) | 1.61 [0.06, 40.36] |
| 5 Serum phosphate | 3 | 98 | Mean Difference (IV, Random, 95% CI) | ‐0.56 [‐1.24, 0.12] |
| 6 Serum calcium | 3 | 98 | Mean Difference (IV, Random, 95% CI) | 0.07 [‐0.30, 0.44] |
| 7 Serum iPTH | 1 | Mean Difference (IV, Random, 95% CI) | Totals not selected | |
| 8 Serum calcium‐by‐phosphate product | 2 | 74 | Mean Difference (IV, Random, 95% CI) | ‐7.81 [‐13.36, ‐2.25] |
Comparison 7. Colestilan versus placebo or usual care.
| Outcome or subgroup title | No. of studies | No. of participants | Statistical method | Effect size |
|---|---|---|---|---|
| 1 Death (all causes) | 1 | Risk Ratio (IV, Random, 95% CI) | Totals not selected | |
| 2 Nausea | 1 | Risk Ratio (IV, Random, 95% CI) | Totals not selected | |
| 3 Abdominal pain | 1 | Risk Ratio (IV, Random, 95% CI) | Totals not selected | |
| 4 Diarrhoea | 1 | Risk Ratio (IV, Random, 95% CI) | Totals not selected | |
| 5 Constipation | 1 | Risk Ratio (IV, Random, 95% CI) | Totals not selected |
Comparison 8. Sevelamer versus calcium.
| Outcome or subgroup title | No. of studies | No. of participants | Statistical method | Effect size |
|---|---|---|---|---|
| 1 Death (all causes) | 16 | 4266 | Risk Ratio (IV, Random, 95% CI) | 0.53 [0.30, 0.91] |
| 2 Cardiovascular death | 6 | 2904 | Risk Ratio (IV, Random, 95% CI) | 0.45 [0.11, 1.77] |
| 3 Myocardial infarction | 2 | 177 | Risk Ratio (IV, Random, 95% CI) | 1.02 [0.11, 9.59] |
| 4 Stroke | 2 | 102 | Risk Ratio (IV, Random, 95% CI) | 3.0 [0.32, 27.90] |
| 5 Hospitalisation | 2 | 242 | Risk Ratio (IV, Random, 95% CI) | 0.78 [0.56, 1.08] |
| 6 Fracture | 1 | Risk Ratio (IV, Random, 95% CI) | Totals not selected | |
| 7 Nausea | 4 | 365 | Risk Ratio (IV, Random, 95% CI) | 0.98 [0.56, 1.71] |
| 8 Vomiting | 2 | 263 | Risk Ratio (IV, Random, 95% CI) | 0.95 [0.54, 1.69] |
| 9 Abdominal pain | 4 | 363 | Risk Ratio (IV, Random, 95% CI) | 1.77 [0.68, 4.63] |
| 10 Constipation | 6 | 2652 | Risk Ratio (IV, Random, 95% CI) | 1.35 [0.71, 2.57] |
| 11 Diarrhoea | 3 | 315 | Risk Ratio (IV, Random, 95% CI) | 0.98 [0.55, 1.75] |
| 12 Abdominal bloating | 2 | 112 | Risk Ratio (IV, Random, 95% CI) | 4.85 [0.87, 27.03] |
| 13 Hypercalcaemia | 19 | 4084 | Risk Ratio (IV, Random, 95% CI) | 0.30 [0.20, 0.43] |
| 14 Calciphylaxis | 1 | Risk Ratio (IV, Random, 95% CI) | Totals not selected | |
| 15 Coronary artery calcium score | 4 | 517 | Mean Difference (IV, Random, 95% CI) | ‐24.89 [‐75.66, 25.88] |
| 16 Serum phosphate | 23 | 4360 | Mean Difference (IV, Random, 95% CI) | 0.06 [‐0.11, 0.23] |
| 17 Serum calcium | 22 | 4313 | Mean Difference (IV, Random, 95% CI) | ‐0.38 [‐0.54, ‐0.21] |
| 18 Serum calcium‐by‐phosphate product | 13 | 2983 | Mean Difference (IV, Random, 95% CI) | 0.36 [‐0.57, 1.28] |
| 19 Serum iPTH | 16 | 1420 | Mean Difference (IV, Random, 95% CI) | 44.24 [10.93, 77.55] |
| 20 Serum alkaline phosphatase | 7 | 611 | Mean Difference (IV, Random, 95% CI) | 17.64 [‐0.16, 35.43] |
| 21 Serum bicarbonate | 7 | 695 | Mean Difference (IV, Random, 95% CI) | ‐1.57 [‐2.15, 1.00] |
| 22 eGFR | 1 | Mean Difference (IV, Random, 95% CI) | Totals not selected | |
| 23 Serum FGF23 | 1 | Mean Difference (IV, Random, 95% CI) | Totals not selected | |
| 24 Soluble Klotho | 1 | Mean Difference (IV, Random, 95% CI) | Totals not selected |
Comparison 9. Lanthanum versus calcium.
| Outcome or subgroup title | No. of studies | No. of participants | Statistical method | Effect size |
|---|---|---|---|---|
| 1 Death (all causes) | 6 | 505 | Risk Ratio (IV, Random, 95% CI) | 0.76 [0.18, 3.11] |
| 2 Hospitalisation | 2 | 88 | Risk Ratio (IV, Random, 95% CI) | 0.80 [0.34, 1.93] |
| 3 Fracture | 1 | Risk Ratio (IV, Random, 95% CI) | Totals not selected | |
| 4 Pruritus | 1 | Risk Ratio (IV, Random, 95% CI) | Totals not selected | |
| 5 Nausea | 5 | 1191 | Risk Ratio (IV, Random, 95% CI) | 1.65 [0.95, 2.89] |
| 6 Vomiting | 2 | 1058 | Risk Ratio (IV, Random, 95% CI) | 3.88 [0.48, 31.74] |
| 7 Abdominal pain | 2 | 137 | Risk Ratio (IV, Random, 95% CI) | 0.24 [0.03, 1.94] |
| 8 Constipation | 5 | 1213 | Risk Ratio (IV, Random, 95% CI) | 0.79 [0.50, 1.26] |
| 9 Diarrhoea | 2 | 858 | Risk Ratio (IV, Random, 95% CI) | 2.44 [0.34, 17.35] |
| 10 Abdominal bloating | 1 | Risk Ratio (IV, Random, 95% CI) | Totals not selected | |
| 11 Coronary artery calcium score | 1 | Mean Difference (IV, Random, 95% CI) | Totals not selected | |
| 12 Hypercalcaemia | 8 | 1347 | Risk Ratio (IV, Random, 95% CI) | 0.16 [0.06, 0.43] |
| 13 Serum phosphate | 9 | 400 | Mean Difference (IV, Random, 95% CI) | 0.01 [‐0.42, 0.43] |
| 14 Serum calcium | 8 | 350 | Mean Difference (IV, Random, 95% CI) | ‐0.28 [‐0.59, 0.02] |
| 15 Serum calcium‐by‐phosphate product | 5 | 1007 | Mean Difference (IV, Random, 95% CI) | ‐2.67 [‐5.01, ‐0.34] |
| 16 Serum iPTH | 8 | 597 | Mean Difference (IV, Random, 95% CI) | 33.78 [‐9.03, 76.60] |
| 17 Serum alkaline phosphatase | 3 | 856 | Mean Difference (IV, Random, 95% CI) | 20.03 [‐3.69, 43.75] |
| 18 eGFR | 1 | Mean Difference (IV, Random, 95% CI) | Totals not selected | |
| 19 Serum FGF23 | 2 | 116 | Std. Mean Difference (IV, Random, 95% CI) | ‐0.85 [‐2.33, 0.63] |
Comparison 10. Magnesium versus calcium.
| Outcome or subgroup title | No. of studies | No. of participants | Statistical method | Effect size |
|---|---|---|---|---|
| 1 Hospitalisation | 1 | Risk Ratio (IV, Random, 95% CI) | Totals not selected | |
| 2 Constipation | 1 | Risk Ratio (IV, Random, 95% CI) | Totals not selected | |
| 3 Diarrhoea | 1 | Risk Ratio (IV, Random, 95% CI) | Totals not selected |
Comparison 11. Aluminium versus calcium.
| Outcome or subgroup title | No. of studies | No. of participants | Statistical method | Effect size |
|---|---|---|---|---|
| 1 Serum alkaline phosphatase | 1 | Mean Difference (IV, Random, 95% CI) | Totals not selected |
Comparison 12. Magnesium plus calcium versus calcium.
| Outcome or subgroup title | No. of studies | No. of participants | Statistical method | Effect size |
|---|---|---|---|---|
| 1 Death (all causes) | 1 | Risk Ratio (IV, Random, 95% CI) | Totals not selected | |
| 2 Serum phosphate | 2 | 109 | Mean Difference (IV, Random, 95% CI) | ‐1.26 [‐3.52, 1.00] |
| 3 Serum calcium | 2 | 109 | Mean Difference (IV, Random, 95% CI) | ‐0.92 [‐2.39, 0.55] |
| 4 Serum calcium‐by‐phosphate product | 1 | Mean Difference (IV, Random, 95% CI) | Totals not selected | |
| 5 Serum iPTH | 1 | Mean Difference (IV, Random, 95% CI) | Totals not selected |
Comparison 13. Sevelamer versus lanthanum.
| Outcome or subgroup title | No. of studies | No. of participants | Statistical method | Effect size |
|---|---|---|---|---|
| 1 Myocardial infarction | 1 | Risk Ratio (IV, Random, 95% CI) | Totals not selected | |
| 2 Stroke | 1 | Risk Ratio (IV, Random, 95% CI) | Totals not selected | |
| 3 Fracture | 1 | Risk Ratio (IV, Random, 95% CI) | Totals not selected | |
| 4 Pruritus | 1 | Risk Ratio (IV, Random, 95% CI) | Totals not selected | |
| 5 Nausea | 1 | Risk Ratio (IV, Random, 95% CI) | Totals not selected | |
| 6 Vomiting | 1 | Risk Ratio (IV, Random, 95% CI) | Totals not selected | |
| 7 Abdominal pain | 1 | Risk Ratio (IV, Random, 95% CI) | Totals not selected | |
| 8 Constipation | 1 | Risk Ratio (IV, Random, 95% CI) | Totals not selected | |
| 9 Diarrhoea | 1 | Risk Ratio (IV, Random, 95% CI) | Totals not selected | |
| 10 Abdominal bloating | 1 | Risk Ratio (IV, Random, 95% CI) | Totals not selected | |
| 11 Hypercalcaemia | 1 | Risk Ratio (IV, Random, 95% CI) | Totals not selected |
Comparison 14. Sevelamer versus iron.
| Outcome or subgroup title | No. of studies | No. of participants | Statistical method | Effect size |
|---|---|---|---|---|
| 1 Death (all causes) | 4 | 1683 | Risk Ratio (IV, Random, 95% CI) | 1.07 [0.38, 2.98] |
| 2 Cardiovascular death | 1 | Risk Ratio (IV, Random, 95% CI) | Totals not selected | |
| 3 Myocardial infarction | 1 | Risk Ratio (IV, Random, 95% CI) | Totals not selected | |
| 4 Fracture | 1 | Risk Ratio (IV, Random, 95% CI) | Totals not selected | |
| 5 Nausea | 2 | 1257 | Risk Ratio (IV, Random, 95% CI) | 3.86 [0.33, 44.86] |
| 6 Abdominal pain | 2 | 431 | Risk Ratio (IV, Random, 95% CI) | 0.42 [0.02, 9.01] |
| 7 Constipation | 4 | 1699 | Risk Ratio (IV, Random, 95% CI) | 4.96 [1.96, 12.55] |
| 8 Diarrhoea | 4 | 1699 | Risk Ratio (IV, Random, 95% CI) | 0.28 [0.15, 0.54] |
| 9 Serum phosphate | 2 | 417 | Mean Difference (IV, Random, 95% CI) | 0.19 [‐0.06, 0.43] |
| 10 Serum calcium | 2 | 417 | Mean Difference (IV, Random, 95% CI) | ‐0.16 [‐0.29, ‐0.04] |
| 11 Serum bicarbonate | 1 | Mean Difference (IV, Random, 95% CI) | Totals not selected |
Comparison 15. Sevelamer versus bixalomer.
| Outcome or subgroup title | No. of studies | No. of participants | Statistical method | Effect size |
|---|---|---|---|---|
| 1 Death (all causes) | 1 | Risk Ratio (IV, Random, 95% CI) | Totals not selected | |
| 2 Fracture | 1 | Risk Ratio (IV, Random, 95% CI) | Totals not selected | |
| 3 Pruritus | 1 | Risk Ratio (IV, Random, 95% CI) | Totals not selected | |
| 4 Nausea | 1 | Risk Ratio (IV, Random, 95% CI) | Totals not selected | |
| 5 Vomiting | 1 | Risk Ratio (IV, Random, 95% CI) | Totals not selected | |
| 6 Abdominal pain | 1 | Risk Ratio (IV, Random, 95% CI) | Totals not selected | |
| 7 Constipation | 1 | Risk Ratio (IV, Random, 95% CI) | Totals not selected | |
| 8 Abdominal bloating | 1 | Risk Ratio (IV, Random, 95% CI) | Totals not selected | |
| 9 Serum phosphate | 1 | Mean Difference (IV, Random, 95% CI) | Totals not selected | |
| 10 Serum calcium | 1 | Mean Difference (IV, Random, 95% CI) | Totals not selected | |
| 11 Serum calcium‐by‐phosphate product | 1 | Mean Difference (IV, Random, 95% CI) | Totals not selected | |
| 12 Serum iPTH | 1 | Mean Difference (IV, Random, 95% CI) | Totals not selected | |
| 13 Serum bicarbonate | 1 | Mean Difference (IV, Random, 95% CI) | Totals not selected |
Comparison 16. Sevelamer versus nicotinamide.
| Outcome or subgroup title | No. of studies | No. of participants | Statistical method | Effect size |
|---|---|---|---|---|
| 1 Death (all causes) | 1 | Risk Ratio (IV, Random, 95% CI) | Totals not selected | |
| 2 Stroke | 1 | Risk Ratio (IV, Random, 95% CI) | Totals not selected | |
| 3 Vomiting | 1 | Risk Ratio (IV, Random, 95% CI) | Totals not selected | |
| 4 Serum calcium | 1 | Mean Difference (IV, Random, 95% CI) | Totals not selected | |
| 5 Serum iPTH | 1 | Mean Difference (IV, Random, 95% CI) | Totals not selected | |
| 6 Serum alkaline phosphatase | 1 | Mean Difference (IV, Random, 95% CI) | Totals not selected |
Comparison 17. Sevelamer versus colestilan.
| Outcome or subgroup title | No. of studies | No. of participants | Statistical method | Effect size |
|---|---|---|---|---|
| 1 Death (all causes) | 2 | 536 | Risk Ratio (IV, Random, 95% CI) | 0.30 [0.10, 0.96] |
| 2 Cardiovascular death | 1 | Risk Ratio (IV, Random, 95% CI) | Totals not selected | |
| 3 Myocardial infarction | 1 | Risk Ratio (IV, Random, 95% CI) | Totals not selected | |
| 4 Stroke | 1 | Risk Ratio (IV, Random, 95% CI) | Totals not selected | |
| 5 Pruritus | 1 | Risk Ratio (IV, Random, 95% CI) | Totals not selected | |
| 6 Nausea | 1 | Risk Ratio (IV, Random, 95% CI) | Totals not selected | |
| 7 Vomiting | 1 | Risk Ratio (IV, Random, 95% CI) | Totals not selected | |
| 8 Abdominal pain | 1 | Risk Ratio (IV, Random, 95% CI) | Totals not selected | |
| 9 Constipation | 1 | Risk Ratio (IV, Random, 95% CI) | Totals not selected | |
| 10 Diarrhoea | 1 | Risk Ratio (IV, Random, 95% CI) | Totals not selected | |
| 11 Serum phosphate | 1 | Mean Difference (IV, Random, 95% CI) | Totals not selected | |
| 12 Serum calcium | 1 | Mean Difference (IV, Random, 95% CI) | Totals not selected | |
| 13 Serum calcium‐by‐phosphate product | 1 | Mean Difference (IV, Random, 95% CI) | Totals not selected | |
| 14 Serum iPTH | 1 | Mean Difference (IV, Random, 95% CI) | Totals not selected | |
| 15 Serum alkaline phosphatase | 1 | Mean Difference (IV, Random, 95% CI) | Totals not selected |
Comparison 18. Sevelamer versus aluminium.
| Outcome or subgroup title | No. of studies | No. of participants | Statistical method | Effect size |
|---|---|---|---|---|
| 1 Nausea | 1 | Risk Ratio (IV, Random, 95% CI) | Totals not selected | |
| 2 Constipation | 1 | Risk Ratio (IV, Random, 95% CI) | Totals not selected | |
| 3 Serum phosphate | 1 | Mean Difference (IV, Random, 95% CI) | Totals not selected | |
| 4 Serum calcium | 1 | Mean Difference (IV, Random, 95% CI) | Totals not selected | |
| 5 Serum iPTH | 1 | Mean Difference (IV, Random, 95% CI) | Totals not selected |
Comparison 19. Sevelamer versus magnesium.
| Outcome or subgroup title | No. of studies | No. of participants | Statistical method | Effect size |
|---|---|---|---|---|
| 1 Serum phosphate | 1 | Mean Difference (IV, Random, 95% CI) | Totals not selected | |
| 2 Serum calcium | 1 | Mean Difference (IV, Random, 95% CI) | Totals not selected | |
| 3 Serum calcium‐by‐phosphate product | 1 | Mean Difference (IV, Random, 95% CI) | Totals not selected | |
| 4 Serum iPTH | 1 | Mean Difference (IV, Random, 95% CI) | Totals not selected |
Comparison 20. Sevelamer versus sevelamer + calcium.
| Outcome or subgroup title | No. of studies | No. of participants | Statistical method | Effect size |
|---|---|---|---|---|
| 1 Hypercalcaemia | 1 | Risk Ratio (IV, Random, 95% CI) | Totals not selected | |
| 2 Serum calcium‐by‐phosphate product | 1 | Mean Difference (IV, Random, 95% CI) | Totals not selected |
Comparison 21. Sevelamer versus calcium + magnesium.
| Outcome or subgroup title | No. of studies | No. of participants | Statistical method | Effect size |
|---|---|---|---|---|
| 1 Serum phosphate | 1 | Mean Difference (IV, Random, 95% CI) | Totals not selected | |
| 2 Serum calcium | 1 | Mean Difference (IV, Random, 95% CI) | Totals not selected | |
| 3 Serum iPTH | 1 | Mean Difference (IV, Random, 95% CI) | Totals not selected | |
| 4 Serum alkaline phosphatase | 1 | Mean Difference (IV, Random, 95% CI) | Totals not selected | |
| 5 Serum bicarbonate | 1 | Mean Difference (IV, Random, 95% CI) | Totals not selected |
Comparison 22. Sevelamer hydrochloride versus sevelamer carbonate.
| Outcome or subgroup title | No. of studies | No. of participants | Statistical method | Effect size |
|---|---|---|---|---|
| 1 Death (all causes) | 1 | Risk Ratio (IV, Random, 95% CI) | Totals not selected | |
| 2 Nausea | 1 | Risk Ratio (IV, Random, 95% CI) | Totals not selected | |
| 3 Vomiting | 1 | Risk Ratio (IV, Random, 95% CI) | Totals not selected | |
| 4 Constipation | 1 | Risk Ratio (IV, Random, 95% CI) | Totals not selected | |
| 5 Diarrhoea | 1 | Risk Ratio (IV, Random, 95% CI) | Totals not selected |
Comparison 23. Calcium acetate versus calcium carbonate.
| Outcome or subgroup title | No. of studies | No. of participants | Statistical method | Effect size |
|---|---|---|---|---|
| 1 Death (all causes) | 2 | 74 | Risk Ratio (M‐H, Random, 95% CI) | 1.13 [0.07, 17.30] |
| 2 Hypercalcaemia | 2 | 92 | Risk Ratio (M‐H, Random, 95% CI) | 0.66 [0.45, 0.97] |
| 3 Serum phosphate | 3 | 98 | Mean Difference (IV, Random, 95% CI) | ‐0.24 [‐0.74, 0.26] |
| 4 Serum calcium | 3 | 98 | Mean Difference (IV, Random, 95% CI) | ‐0.21 [‐0.45, 0.04] |
| 5 Serum calcium‐by‐phosphate product | 1 | Mean Difference (IV, Random, 95% CI) | Totals not selected | |
| 6 Serum iPTH | 1 | Mean Difference (IV, Random, 95% CI) | Totals not selected | |
| 7 Serum alkaline phosphatase | 2 | 35 | Mean Difference (IV, Random, 95% CI) | 1.77 [‐8.80, 12.35] |
Comparison 24. Subgroup: sevelamer versus calcium.
| Outcome or subgroup title | No. of studies | No. of participants | Statistical method | Effect size |
|---|---|---|---|---|
| 1 Death (all causes): age | 16 | 4266 | Risk Ratio (IV, Random, 95% CI) | 0.53 [0.30, 0.91] |
| 1.1 Mean study age above 60 years | 2 | 157 | Risk Ratio (IV, Random, 95% CI) | 1.56 [0.31, 7.74] |
| 1.2 Mean study age 60 years or below | 14 | 4109 | Risk Ratio (IV, Random, 95% CI) | 0.47 [0.26, 0.86] |
| 2 Death (all causes): CKD GFR category | 16 | 4266 | Risk Ratio (IV, Random, 95% CI) | 0.53 [0.30, 0.91] |
| 2.1 Stage 2‐5 | 2 | 356 | Risk Ratio (IV, Random, 95% CI) | 0.64 [0.22, 1.84] |
| 2.2 Stage 5D | 14 | 3910 | Risk Ratio (IV, Random, 95% CI) | 0.50 [0.26, 0.95] |
| 3 Cardiovascular death: CKD GFR category | 6 | 2904 | Risk Ratio (IV, Random, 95% CI) | 0.45 [0.11, 1.77] |
| 3.1 Stage 2 to 5 | 2 | 583 | Risk Ratio (IV, Random, 95% CI) | 0.37 [0.01, 13.78] |
| 3.2 Stage 5D | 4 | 2321 | Risk Ratio (IV, Random, 95% CI) | 0.85 [0.46, 1.57] |
| 4 Death (all causes): study duration | 16 | 4393 | Risk Ratio (IV, Random, 95% CI) | 0.53 [0.32, 0.86] |
| 4.1 Less than 12 months | 6 | 504 | Risk Ratio (IV, Random, 95% CI) | 0.59 [0.34, 1.04] |
| 4.2 Equal to or longer than 12 months | 11 | 3889 | Risk Ratio (IV, Random, 95% CI) | 0.48 [0.26, 0.89] |
| 5 Death (all causes): random sequence generation and allocation concealment | 16 | 4669 | Risk Ratio (IV, Random, 95% CI) | 0.55 [0.34, 0.90] |
| 5.1 Low risk | 6 | 1053 | Risk Ratio (IV, Random, 95% CI) | 0.55 [0.36, 0.82] |
| 5.2 Unclear/high risk | 12 | 3616 | Risk Ratio (IV, Random, 95% CI) | 0.60 [0.27, 1.30] |
Characteristics of studies
Characteristics of included studies [ordered by study ID]
Ahmed 2014.
| Methods |
|
|
| Participants |
|
|
| Interventions | Treatment group 1
Treatment group 2
Cointerventions
|
|
| Outcomes |
|
|
| Notes |
|
|
| Risk of bias | ||
| Bias | Authors' judgement | Support for judgement |
| Random sequence generation (selection bias) | Unclear risk | Insufficient information about sequence generation to permit judgement |
| Allocation concealment (selection bias) | Unclear risk | Insufficient information about allocation concealment to permit judgement. "Randomly divided into two groups" |
| Blinding of participants and personnel (performance bias) All outcomes | High risk | Participants and investigators aware of treatment assignment |
| Blinding of outcome assessment (detection bias) All outcomes | Low risk | Blinding of outcome assessment not mentioned. Outcomes were laboratory measures and unlikely to be influenced by lack of blinding |
| Incomplete outcome data (attrition bias) All outcomes | Unclear risk | Withdrawal/lost to follow‐up was not reported |
| Selective reporting (reporting bias) | High risk | Only laboratory measures were reported. Patient‐level outcomes including adverse events were not reported |
| Other bias | High risk | Differences in mean baseline values of serum calcium and iPTH between treatment groups |
Akizawa 2000.
| Methods |
|
|
| Participants |
|
|
| Interventions | Treatment group 1
Treatment group 2
Co‐interventions
|
|
| Outcomes |
|
|
| Notes |
|
|
| Risk of bias | ||
| Bias | Authors' judgement | Support for judgement |
| Random sequence generation (selection bias) | Unclear risk | Insufficient information about sequence generation to permit judgement |
| Allocation concealment (selection bias) | Unclear risk | Insufficient information about allocation concealment to permit judgement |
| Blinding of participants and personnel (performance bias) All outcomes | High risk | Open label; knowledge of treatment allocation may have influenced patient management |
| Blinding of outcome assessment (detection bias) All outcomes | Low risk | Blinding of outcome assessment was not reported. Outcome measures were laboratory events which were unlikely to be influenced by knowledge of treatment allocation |
| Incomplete outcome data (attrition bias) All outcomes | Unclear risk | Insufficient information about study attrition to permit judgement |
| Selective reporting (reporting bias) | Low risk | Key laboratory measures and adverse events were reported |
| Other bias | Unclear risk | Insufficient information to permit judgement |
Akizawa 2014a.
| Methods |
|
|
| Participants |
|
|
| Interventions | Treatment group 1
Treatment group 2
|
|
| Outcomes |
|
|
| Notes |
|
|
| Risk of bias | ||
| Bias | Authors' judgement | Support for judgement |
| Random sequence generation (selection bias) | Unclear risk | Insufficient information about sequence generation to permit judgement |
| Allocation concealment (selection bias) | Unclear risk | Insufficient information about allocation concealment to permit judgement |
| Blinding of participants and personnel (performance bias) All outcomes | High risk | Participants and investigators aware of treatment assignment. Lack of blinding could affect patient management |
| Blinding of outcome assessment (detection bias) All outcomes | Low risk | No blinding of outcome assessment reported. Most outcomes were objective (laboratory measures) and unlikely to be influenced by lack of blinding. Adverse event reporting may have been influenced by lack of blinding |
| Incomplete outcome data (attrition bias) All outcomes | High risk | 9/55 in bixalomer group (adverse events (3); lack of efficacy (1); withdrawal of consent (3); other reasons (2)) did not complete study follow‐up 7/55 in sevelamer group (adverse events (6); withdrawal of consent (1)) did not complete study follow‐up |
| Selective reporting (reporting bias) | Low risk | All expected laboratory measures were reported. Adverse events were reported systematically |
| Other bias | High risk | Study was funded and authored by Astellas Pharma |
Akizawa 2016.
| Methods |
|
|
| Participants |
|
|
| Interventions | Treatment group
Control group
Co‐interventions
|
|
| Outcomes |
|
|
| Notes |
|
|
| Risk of bias | ||
| Bias | Authors' judgement | Support for judgement |
| Random sequence generation (selection bias) | Unclear risk | The treatment allocation table was managed by the registration centre and drugs were allocated by drug number at the study site |
| Allocation concealment (selection bias) | Unclear risk | Assignment of study drugs was blinded using numbers registered at each study site |
| Blinding of participants and personnel (performance bias) All outcomes | Low risk | All drugs had indistinguishable appearance and packaging |
| Blinding of outcome assessment (detection bias) All outcomes | Low risk | No blinding of outcome assessment was mentioned. Most outcomes were objective (death or laboratory measures) and unlikely to be influenced by lack of blinding. Adverse event reporting may have been influenced by lack of blinding |
| Incomplete outcome data (attrition bias) All outcomes | High risk | 15/66 participants assigned to bixalomer (adverse events (9); prohibited therapies (1), initiation of dialysis (3); other (1)) did not complete study 18/62 participants assigned to placebo (eligibility problems (1); adverse events (5); consent withdrawal (2); lack of efficacy (1); prohibited medication (1); initiation of dialysis (8)) did not complete study |
| Selective reporting (reporting bias) | Low risk | All expected laboratory measures were reported. Death (all causes), adverse events, and cardiovascular death were reported |
| Other bias | High risk | Study funded and authored by Astellas Pharma |
Allam 2012.
| Methods |
|
|
| Participants |
|
|
| Interventions | Treatment group
Control group
Co‐interventions
|
|
| Outcomes |
|
|
| Notes |
|
|
| Risk of bias | ||
| Bias | Authors' judgement | Support for judgement |
| Random sequence generation (selection bias) | Unclear risk | Insufficient information about sequence generation to permit judgement |
| Allocation concealment (selection bias) | Unclear risk | Insufficient information about allocation concealment to permit judgement |
| Blinding of participants and personnel (performance bias) All outcomes | High risk | Participants and investigators aware of treatment assignment. Lack of blinding could affect patient management |
| Blinding of outcome assessment (detection bias) All outcomes | Low risk | No blinding of outcome assessment was reported. Most outcomes were objective (laboratory measures) and unlikely to be influenced by lack of blinding. Adverse event reporting may have been influenced by lack of blinding |
| Incomplete outcome data (attrition bias) All outcomes | High risk | 4/30 participants assigned to nicotinamide were withdrawn (due to adverse events) 0/30 participants assigned to control group were withdrawn |
| Selective reporting (reporting bias) | Low risk | All expected laboratory measures were measured. Adverse events were measured |
| Other bias | Low risk | The study appeared to be free of other sources of bias |
Almirall 1994.
| Methods |
|
|
| Participants |
|
|
| Interventions | Treatment group 1
Treatment group 2
Co‐interventions
|
|
| Outcomes |
|
|
| Notes |
|
|
| Risk of bias | ||
| Bias | Authors' judgement | Support for judgement |
| Random sequence generation (selection bias) | Unclear risk | Insufficient information about sequence generation to permit judgement |
| Allocation concealment (selection bias) | Unclear risk | Insufficient information about allocation concealment to permit judgement |
| Blinding of participants and personnel (performance bias) All outcomes | Unclear risk | Participants and investigators aware of treatment assignment. Lack of blinding could affect patient management |
| Blinding of outcome assessment (detection bias) All outcomes | Low risk | No blinding of outcome assessment was reported. Most outcomes were objective (laboratory measures) and unlikely to be influenced by lack of blinding. Adverse event reporting may have been influenced by lack of blinding |
| Incomplete outcome data (attrition bias) All outcomes | Low risk | 3/10 participants did not complete study (kidney transplant (1); adverse events due to calcium (1); changed address and treatment centre (1)) |
| Selective reporting (reporting bias) | High risk | Cross‐over study and no separate results available for first part of the study so results could not be included in meta‐analyses |
| Other bias | High risk | Doses of calcium were not comparable between groups. There was no washout interval between the two treatment periods. Data were not analysed using methods appropriate for cross‐over study design |
Aramwit 2012.
| Methods |
|
|
| Participants |
|
|
| Interventions | Treatment group
Control group
Co‐interventions
|
|
| Outcomes |
|
|
| Notes |
|
|
| Risk of bias | ||
| Bias | Authors' judgement | Support for judgement |
| Random sequence generation (selection bias) | Unclear risk | Insufficient information about sequence generation to permit judgement |
| Allocation concealment (selection bias) | Unclear risk | Insufficient information about allocation concealment to permit judgement |
| Blinding of participants and personnel (performance bias) All outcomes | Unclear risk | study described as double‐blinded, but the methods for participant and investigator blinding were not described. Lack of blinding may have affected patient management |
| Blinding of outcome assessment (detection bias) All outcomes | Low risk | No blinding of outcome assessment was reported. Most outcomes were objective (death or laboratory measures) and unlikely to be influenced by lack of blinding Adverse event reporting may have been influenced by lack of blinding |
| Incomplete outcome data (attrition bias) All outcomes | Low risk | 2/14 withdrawn from nicotinic acid treatment due to adverse events |
| Selective reporting (reporting bias) | Low risk | All expected laboratory measures were reported. Death (all causes) and adverse events were reported |
| Other bias | High risk | Baseline imbalance in serum PTH levels |
Birck 1999.
| Methods |
|
|
| Participants |
|
|
| Interventions | Treatment group 1
Treatment group 2
Co‐interventions
|
|
| Outcomes |
|
|
| Notes |
|
|
| Risk of bias | ||
| Bias | Authors' judgement | Support for judgement |
| Random sequence generation (selection bias) | Unclear risk | Insufficient information about sequence generation to permit judgement |
| Allocation concealment (selection bias) | Unclear risk | Insufficient information about allocation concealment to permit judgement |
| Blinding of participants and personnel (performance bias) All outcomes | High risk | Participants and investigators aware of treatment assignment. Lack of blinding may have affected patient management |
| Blinding of outcome assessment (detection bias) All outcomes | Low risk | No blinding of outcome assessment was mentioned. Most outcomes were objective (death or laboratory measures) and unlikely to be influenced by lack of blinding |
| Incomplete outcome data (attrition bias) All outcomes | High risk | 4/30 participants withdrew from the study and were not included in analyses (severe intercurrent illness, kidney transplant; lost to follow up; death due to MI). Unclear which treatment phase of the study was associated with patient drop‐out |
| Selective reporting (reporting bias) | High risk | Cross‐over study and no separate results available for first part of the study so results could not be included in meta‐analyses. All expected laboratory measures were recorded. Death outcomes were recorded |
| Other bias | High risk | Data were not analysed using methods appropriate for cross‐over study design |
Bleyer 1999.
| Methods |
|
|
| Participants |
|
|
| Interventions | Treatment group 1
Treatment group 2
Co‐interventions: Calcitriol |
|
| Outcomes |
|
|
| Notes |
|
|
| Risk of bias | ||
| Bias | Authors' judgement | Support for judgement |
| Random sequence generation (selection bias) | Unclear risk | Insufficient information about sequence generation to permit judgement |
| Allocation concealment (selection bias) | Unclear risk | Insufficient information about allocation concealment to permit judgement |
| Blinding of participants and personnel (performance bias) All outcomes | High risk | Participants and investigators aware of treatment assignment. Lack of blinding could have affected patient management |
| Blinding of outcome assessment (detection bias) All outcomes | Low risk | No blinding of outcome assessment was mentioned. Most outcomes were objective (death or laboratory measures) and unlikely to be influenced by lack of blinding. Adverse event reporting may have been influenced by lack of blinding |
| Incomplete outcome data (attrition bias) All outcomes | Low risk | 80/83 participants completed both treatment sequences |
| Selective reporting (reporting bias) | Low risk | Cross‐over study and no separate results available for first part of the study so results could not be included in meta‐analyses. Key laboratory measures reported. Adverse events reported |
| Other bias | High risk | Data were not analysed using methods appropriate for cross‐over study design. Smaller doses of control therapy (calcium acetate) than intervention were used. Baseline characteristics for each treatment group were not provided; funded by GelTex |
Block 2005.
| Methods |
|
|
| Participants |
|
|
| Interventions | Treatment group 1
Treatment group 2
Co‐interventions
|
|
| Outcomes |
|
|
| Notes |
|
|
| Risk of bias | ||
| Bias | Authors' judgement | Support for judgement |
| Random sequence generation (selection bias) | Low risk | "Randomisation to treatment was computer generated in blocks of 10" |
| Allocation concealment (selection bias) | Low risk | "Assigned by the coordinating centre using concealed envelopes". Not stated whether envelopes were sequentially numbered |
| Blinding of participants and personnel (performance bias) All outcomes | High risk | Participants received open label sevelamer or calcium containing phosphate binders. Lack of blinding may have influenced patient management |
| Blinding of outcome assessment (detection bias) All outcomes | Low risk | No blinding of outcome assessment was mentioned. Most outcomes were objective (death or laboratory measures) and unlikely to be influenced by lack of blinding. Adverse event reporting may have been influenced by lack of blinding. CACS scans were read by a single experienced investigator (P.R.) who was blinded to all other patient data |
| Incomplete outcome data (attrition bias) All outcomes | High risk | 19/73 participants allocated to sevelamer were not included in analysis (11 did not have CT at baseline; adverse event (1); transplanted (2); death (1); other (2); transferred to peritoneal dialysis (2)) 20/75 participants allocated to calcium were not included in analysis (8 did not have baseline CT; adverse event (1); transplanted (3); death (1); other (4); lost to follow‐up (1); transfer to PD (2)) |
| Selective reporting (reporting bias) | Low risk | Key laboratory measures, adverse events, and death reported |
| Other bias | Low risk | The study appeared to be free from other sources of bias |
Block 2009.
| Methods |
|
|
| Participants |
|
|
| Interventions | Treatment group 1
Treatment group 2
Treatment group 3
Control group
Co‐interventions
|
|
| Outcomes |
|
|
| Notes |
|
|
| Risk of bias | ||
| Bias | Authors' judgement | Support for judgement |
| Random sequence generation (selection bias) | Low risk | Independent statistician performed randomisation using SAS |
| Allocation concealment (selection bias) | Low risk | Sealed envelopes were opened at the study centre by a staff member not involved in the conduct of the study. Not stated whether opaque or sequentially numbered |
| Blinding of participants and personnel (performance bias) All outcomes | Low risk | All study medication was released by a single unblinded staff member in bottles identified by a unique identification number. The study was double‐blinded with active drug and matching placebo |
| Blinding of outcome assessment (detection bias) All outcomes | Low risk | All clinical personnel, data analysts, and participants remained blinded to study treatment assignment |
| Incomplete outcome data (attrition bias) All outcomes | High risk | 5/30 participants assigned to sevelamer did not complete study (consent withdrawn (1); non‐adherence (2); adverse event (1); other (1)) 12/30 participants assigned to lanthanum did not complete study (not treated (2); consent withdrawn (2); non‐adherence (4); adverse event (1); other (3)) 8/30 participants assigned to calcium did not complete study (non‐adherence (1); adverse event (2); other (2); drug expiration (3)) 17/58 participants assigned to placebo did not complete study (not treated (1); consent withdrawn (2); non‐adherence (5); adverse events (4); other (2); renal replacement (1); drug expiration (2) |
| Selective reporting (reporting bias) | Low risk | Key laboratory measures reported; vascular calcification reported; adverse events reported |
| Other bias | Low risk | The study appeared to be free from other sources of bias |
Block 2015.
| Methods |
|
|
| Participants |
|
|
| Interventions | Treatment group
Control group
Co‐interventions
|
|
| Outcomes |
|
|
| Notes |
|
|
| Risk of bias | ||
| Bias | Authors' judgement | Support for judgement |
| Random sequence generation (selection bias) | Low risk | Randomly assigned patients by a centralised interactive voice‐response system with allocation generated by an independent biostatistician |
| Allocation concealment (selection bias) | Low risk | Randomly assigned patients by a centralised interactive voice‐response system with allocation generated by an independent biostatistician |
| Blinding of participants and personnel (performance bias) All outcomes | Low risk | Keryx Biopharmaceuticals Inc provided active drug and matching placebo |
| Blinding of outcome assessment (detection bias) All outcomes | Low risk | No blinding of outcome assessment was reported. Most outcomes were objective (death or laboratory measures) and unlikely to be influenced by lack of blinding. Adverse event reporting may have been influenced by lack of blinding |
| Incomplete outcome data (attrition bias) All outcomes | Low risk | All except 1 participant were included in safety analysis 14/75 participants assigned to ferric citrate discontinued intervention (treatment failure (1); withdrew consent (6); adverse events (6); other(1)) 24/74 participants assigned to placebo discontinued intervention (treatment failures (11); withdrew consent (5); lost to follow‐up (1); adverse events (3); other (4)) |
| Selective reporting (reporting bias) | Low risk | All the review’s key outcomes were recorded |
| Other bias | Low risk | The study appeared to free from other sources of bias |
BRiC 2005.
| Methods |
|
|
| Participants |
|
|
| Interventions | Treatment group 1
Treatment group 2
Co‐interventions: calcium dialysate concentration; vitamin D treatment. |
|
| Outcomes |
|
|
| Notes |
|
|
| Risk of bias | ||
| Bias | Authors' judgement | Support for judgement |
| Random sequence generation (selection bias) | Low risk | Computer generated |
| Allocation concealment (selection bias) | Low risk | Treatment was assigned by the coordinating centre using concealed envelopes |
| Blinding of participants and personnel (performance bias) All outcomes | High risk | Open label |
| Blinding of outcome assessment (detection bias) All outcomes | Low risk | Coronary artery scores were assessed by an outcome assessor who was blinded to treatment allocation. No blinding of outcome assessment for other outcomes was reported. Most outcomes were objective (death or laboratory measures) and unlikely to be influenced by lack of blinding. Adverse event reporting may have been influenced by lack of blinding |
| Incomplete outcome data (attrition bias) All outcomes | High risk | 11/52 participants allocated to sevelamer did not complete follow‐up (parathyroidectomy (transplanted (6); death (1); other (3)) 19/49 participants allocated to calcium did not complete follow‐up (parathyroidectomy (1); transplanted (6); death (8); other (4)) |
| Selective reporting (reporting bias) | Low risk | Key laboratory measures were reported; adverse events were not reported; death was reported. |
| Other bias | Low risk | The study appeared to be free from other sources of bias |
Bro 1998.
| Methods |
|
|
| Participants |
|
|
| Interventions | Treatment group 1
Treatment group 2
Co‐interventions
|
|
| Outcomes |
|
|
| Notes |
|
|
| Risk of bias | ||
| Bias | Authors' judgement | Support for judgement |
| Random sequence generation (selection bias) | Unclear risk | Insufficient information about sequence generation to permit judgement |
| Allocation concealment (selection bias) | Unclear risk | Insufficient information about allocation concealment to permit judgement |
| Blinding of participants and personnel (performance bias) All outcomes | High risk | Participants and investigators aware of treatment assignment. Lack of blinding likely to influence patient management |
| Blinding of outcome assessment (detection bias) All outcomes | Low risk | No blinding of outcome assessment was reported. Most outcomes were objective (laboratory measures) and unlikely to be influenced by lack of blinding. Adverse event reporting may have been influenced by lack of blinding |
| Incomplete outcome data (attrition bias) All outcomes | High risk | 10/19 participants who were randomised to treatment were not included in analysis; 5/17 patients who started calcium ketoglutarate treatment showed immediate intolerance to ketoglutarate 12 g/d and were withdrawn from the study within 1 to 2 weeks |
| Selective reporting (reporting bias) | Low risk | Cross‐over study and no separate results available for first part of the study so results could not be included in meta‐analyses Key laboratory measures and adverse events were collected |
| Other bias | High risk | The content of elemental calcium was lower in the group assigned to calcium ketoglutarate at the commencement of therapy. Statistical analysis was not specifically appropriate for a cross‐over study design. The baseline characteristics for each treatment group were not provided |
Caglar 2008.
| Methods |
|
|
| Participants |
|
|
| Interventions | Treatment group 1
Treatment group 2
Co‐interventions
|
|
| Outcomes |
|
|
| Notes |
|
|
| Risk of bias | ||
| Bias | Authors' judgement | Support for judgement |
| Random sequence generation (selection bias) | Unclear risk | Insufficient information about sequence generation to permit judgement |
| Allocation concealment (selection bias) | Unclear risk | Insufficient information about allocation concealment to permit judgement |
| Blinding of participants and personnel (performance bias) All outcomes | High risk | Participants and investigators aware of treatment assignment. Lack of blinding likely to influence patient management |
| Blinding of outcome assessment (detection bias) All outcomes | Low risk | Assessment of flow mediated dilatation was conducted by investigators who were unaware of treatment allocation. Blinding of outcome assessment for other outcomes was not reported. Most outcomes were objective (laboratory measures) and unlikely to be influenced by lack of blinding |
| Incomplete outcome data (attrition bias) All outcomes | Low risk | All randomised participants were included in analyses |
| Selective reporting (reporting bias) | High risk | All key laboratory measures were reported. Adverse events and other patient‐level outcomes were not reported |
| Other bias | Low risk | The study appeared to be free from other sources of bias |
CALMAG 2010.
| Methods |
|
|
| Participants |
|
|
| Interventions | Treatment group 1
Treatment group 2
Co‐interventions
|
|
| Outcomes |
|
|
| Notes |
|
|
| Risk of bias | ||
| Bias | Authors' judgement | Support for judgement |
| Random sequence generation (selection bias) | Unclear risk | Insufficient information about sequence generation to permit judgement |
| Allocation concealment (selection bias) | Unclear risk | Insufficient information about allocation concealment to permit judgement |
| Blinding of participants and personnel (performance bias) All outcomes | High risk | Study medication was packed in opaque blister strips and only administered by the study nurse whereby the investigator and other site staff was masked to study medication |
| Blinding of outcome assessment (detection bias) All outcomes | Low risk | The primary efficacy parameter (serum phosphorus) was determined in a central laboratory blinded to treatment allocation as were all other persons involved in the study. GI quality of life index was completed by personnel who were unaware of treatment assignment |
| Incomplete outcome data (attrition bias) All outcomes | High risk | 34/129 participants allocated to sevelamer did not complete intervention (lack of efficacy data (5); withdrawal of consent (14); adverse event (9); transplantation (7); other (4)) 18/126 participants allocated to calcium/magnesium not included in analyses (lack of efficacy data (3); withdrawal of consent (7); adverse event (3); transplantation (6); other (2)) |
| Selective reporting (reporting bias) | Low risk | Key laboratory measures and adverse events were collected |
| Other bias | Low risk | The study appeared to be free from other sources of bias |
Caravaca 1992.
| Methods |
|
|
| Participants |
|
|
| Interventions | Treatment group 1
Treatment group 2
Co‐interventions
|
|
| Outcomes |
|
|
| Notes |
|
|
| Risk of bias | ||
| Bias | Authors' judgement | Support for judgement |
| Random sequence generation (selection bias) | Unclear risk | Insufficient information about sequence generation to permit judgement |
| Allocation concealment (selection bias) | Unclear risk | Insufficient information about allocation concealment to permit judgement |
| Blinding of participants and personnel (performance bias) All outcomes | High risk | Open label. Lack of blinding may have influenced patient management |
| Blinding of outcome assessment (detection bias) All outcomes | Low risk | No blinding of outcome assessment was reported. Outcome measures were laboratory measurements and unlikely to be influenced by lack of blinding |
| Incomplete outcome data (attrition bias) All outcomes | High risk | 5/40 participants allocated to calcium carbonate were not included in analyses 9/40 participants allocated to calcium acetate were not included in analyses Seven patients did not tolerate calcium acetate due to adverse events Two patients did not tolerate calcium carbonate. |
| Selective reporting (reporting bias) | High risk | Not all the review’s pre‐specified outcomes were recorded. Adverse events (other than GI events) and death were not reported |
| Other bias | Low risk | The study appeared to be free from other sources of bias |
CARE 2004.
| Methods |
|
|
| Participants |
|
|
| Interventions | Treatment group 1
Treatment group 2
Co‐intervention
|
|
| Outcomes |
|
|
| Notes |
|
|
| Risk of bias | ||
| Bias | Authors' judgement | Support for judgement |
| Random sequence generation (selection bias) | Unclear risk | Insufficient information about sequence generation to permit judgement |
| Allocation concealment (selection bias) | Unclear risk | Insufficient information about allocation concealment to permit judgement |
| Blinding of participants and personnel (performance bias) All outcomes | Low risk | Study blinding was maintained by packaging calcium acetate in hard gelatin capsules identical to the sevelamer hydrochloride capsules |
| Blinding of outcome assessment (detection bias) All outcomes | Low risk | No blinding of outcome assessment was reported. Outcomes were predominantly laboratory measures and unlikely to be affected by outcome assessment. Adverse events were possibly influenced by an awareness of treatment allocation |
| Incomplete outcome data (attrition bias) All outcomes | High risk | 5/50 participants allocated to sevelamer not included in analyses 2/48 participants allocated to calcium not included in analyses Reasons for withdrawal not provided |
| Selective reporting (reporting bias) | Low risk | Key laboratory measures and adverse events were reported |
| Other bias | High risk | Imbalance in baseline characteristics |
CARE‐2 2008.
| Methods |
|
|
| Participants |
|
|
| Interventions | Treatment group 1
Treatment group 2
Co‐interventions
|
|
| Outcomes |
|
|
| Notes |
|
|
| Risk of bias | ||
| Bias | Authors' judgement | Support for judgement |
| Random sequence generation (selection bias) | Low risk | Randomisation was stratified by centre using computerised lists for each site |
| Allocation concealment (selection bias) | Unclear risk | Insufficient information about allocation concealment to permit judgement |
| Blinding of participants and personnel (performance bias) All outcomes | High risk | Open label |
| Blinding of outcome assessment (detection bias) All outcomes | Low risk | Assessments for coronary artery calcification were forwarded to a single experienced cardiologist who was blinded to treatment assignment, identifying information, and temporal relationship of the scans. Blinding of other outcomes was not reported. Outcome measures were objective (laboratory and radiological) and were unlikely to be influenced by study blinding |
| Incomplete outcome data (attrition bias) All outcomes | High risk | 17/100 participants allocated to sevelamer were unavailable at 12 months (death (1); lost to follow‐up (1); non‐adherence (3); protocol violation (1); withdraw consent (2); adverse event (5); transplant (3); transfer (1)) 15/103 participants allocated to calcium were unavailable at 12 months (death (1); lost to follow‐up (1); non‐adherence (5); protocol violation (1); withdrawal consent (1); adverse event (2); transplant (1); transfer (1)) |
| Selective reporting (reporting bias) | Low risk | All the review’s key outcomes were recorded |
| Other bias | Low risk | The study appeared to be free from other sources of bias |
Chen 2011b.
| Methods |
|
|
| Participants |
|
|
| Interventions | Treatment group 1
Treatment group 2
Co‐interventions
|
|
| Outcomes |
|
|
| Notes |
|
|
| Risk of bias | ||
| Bias | Authors' judgement | Support for judgement |
| Random sequence generation (selection bias) | Unclear risk | Insufficient information about sequence generation to permit judgement |
| Allocation concealment (selection bias) | Unclear risk | Insufficient information about allocation concealment to permit judgement |
| Blinding of participants and personnel (performance bias) All outcomes | High risk | Open label |
| Blinding of outcome assessment (detection bias) All outcomes | Low risk | No blinding of outcome assessment was reported, however most outcomes were objective laboratory or death measures |
| Incomplete outcome data (attrition bias) All outcomes | Low risk | 14/68 participants allocated to sevelamer did not complete study (adverse events (9); abnormal laboratory values (2); withdrawal consent (3)) 16/135 participants allocated to SBR759 did not complete study (adverse events (5); consent withdrawal (10); protocol violation (1)) |
| Selective reporting (reporting bias) | Low risk | All key laboratory outcomes, death, and adverse events were measured |
| Other bias | High risk | Funded by Novartis |
Chen 2014.
| Methods |
|
|
| Participants |
|
|
| Interventions | Treatment group
Control group
Co‐interventions
|
|
| Outcomes |
|
|
| Notes |
|
|
| Risk of bias | ||
| Bias | Authors' judgement | Support for judgement |
| Random sequence generation (selection bias) | Unclear risk | Insufficient information about sequence generation to permit judgement |
| Allocation concealment (selection bias) | Unclear risk | Insufficient information about allocation concealment to permit judgement |
| Blinding of participants and personnel (performance bias) All outcomes | Low risk | Double blinded |
| Blinding of outcome assessment (detection bias) All outcomes | Low risk | No blinding of outcome assessment was reported. Outcomes were primarily laboratory measures and unlikely to be influenced by lack of blinding |
| Incomplete outcome data (attrition bias) All outcomes | Low risk | 7/135 participants allocated to sevelamer did not complete study (adverse events (4); preference to withdraw (3)) 2/70 participants allocated to placebo did not complete study (adverse event (1); consent withdrawal (1)) |
| Selective reporting (reporting bias) | Low risk | Key laboratory measures and adverse events were reported |
| Other bias | High risk | Funded and authored by Genzyme |
Cheng 2008.
| Methods |
|
|
| Participants |
|
|
| Interventions | Treatment group
Control group
Co‐interventions
|
|
| Outcomes |
|
|
| Notes |
|
|
| Risk of bias | ||
| Bias | Authors' judgement | Support for judgement |
| Random sequence generation (selection bias) | Unclear risk | Insufficient information about sequence generation to permit judgement |
| Allocation concealment (selection bias) | Unclear risk | Insufficient information about allocation concealment to permit judgement |
| Blinding of participants and personnel (performance bias) All outcomes | Low risk | Identical capsules containing 250 mg of niacinamide or placebo were manufactured by a research pharmacist; double‐blind |
| Blinding of outcome assessment (detection bias) All outcomes | Low risk | No blinding of outcome assessment was reported. Outcomes were laboratory measures that were unlikely to be influenced by any lack of blinding |
| Incomplete outcome data (attrition bias) All outcomes | Low risk | All randomised participants completed the study |
| Selective reporting (reporting bias) | High risk | Cross‐over study and no separate results available for first part of the study so results could not be included in meta‐analyses. No patient‐centred outcomes including adverse events were provided |
| Other bias | High risk | The study analyses were not conducted appropriately for the cross‐over study design |
Chennasamudram 2013.
| Methods |
|
|
| Participants |
|
|
| Interventions | Treatment group 1
Treatment group 2
Co‐interventions: none reported. |
|
| Outcomes |
|
|
| Notes |
|
|
| Risk of bias | ||
| Bias | Authors' judgement | Support for judgement |
| Random sequence generation (selection bias) | Unclear risk | Insufficient information about sequence generation to permit judgement |
| Allocation concealment (selection bias) | Unclear risk | Insufficient information about allocation concealment to permit judgement |
| Blinding of participants and personnel (performance bias) All outcomes | High risk | Open label. Lack of blinding may have influenced patient management |
| Blinding of outcome assessment (detection bias) All outcomes | Low risk | No blinding of outcome assessment was reported. Outcomes were predominantly objective laboratory or clinical measures and were unlikely to be influenced by lack of blinding |
| Incomplete outcome data (attrition bias) All outcomes | Unclear risk | The number of participants who completed study follow‐up and were included in analyses was not reported |
| Selective reporting (reporting bias) | High risk | Cross‐over study and no separate results available for first part of the study so results could not be included in meta‐analyses. No patient‐centred outcomes including adverse events were provided |
| Other bias | High risk | The study analyses were not conducted appropriately for the cross‐over study design. The baseline characteristics for each treatment group were not reported in sufficient detail to determine whether they were balanced |
Chertow 1999.
| Methods |
|
|
| Participants |
|
|
| Interventions | Treatment group 1
Treatment group 2
Co‐interventions
|
|
| Outcomes |
|
|
| Notes |
|
|
| Risk of bias | ||
| Bias | Authors' judgement | Support for judgement |
| Random sequence generation (selection bias) | Unclear risk | Insufficient information about sequence generation to permit judgement. |
| Allocation concealment (selection bias) | Unclear risk | Insufficient information about allocation concealment to permit judgement |
| Blinding of participants and personnel (performance bias) All outcomes | High risk | Open label. Lack of blinding may have influenced patient management |
| Blinding of outcome assessment (detection bias) All outcomes | Low risk | No blinding of outcome assessment was reported. Outcomes were predominantly objective laboratory or clinical measures and were unlikely to be influenced by lack of blinding |
| Incomplete outcome data (attrition bias) All outcomes | Unclear risk | Not reported in sufficient detail to permit judgement |
| Selective reporting (reporting bias) | High risk | Not all the review’s pre‐specified outcomes were recorded. No patient‐centred outcomes including adverse events were provided |
| Other bias | Low risk | The study appeared to be free from other sources of bias |
Chertow 2002.
| Methods |
|
|
| Participants |
|
|
| Interventions | Treatment group 1
Treatment group 2
Co‐interventions
|
|
| Outcomes |
|
|
| Notes |
|
|
| Risk of bias | ||
| Bias | Authors' judgement | Support for judgement |
| Random sequence generation (selection bias) | Low risk | The randomisation schedule was computer generated |
| Allocation concealment (selection bias) | Unclear risk | Insufficient information about allocation concealment to permit judgement |
| Blinding of participants and personnel (performance bias) All outcomes | High risk | Open label. Lack of blinding may have influenced patient management |
| Blinding of outcome assessment (detection bias) All outcomes | Low risk | Outcome assessment of CACSs was blinded. The blinding of other outcome measures was not reported. Outcomes were predominantly objective laboratory or clinical measures and were unlikely to be influenced by lack of blinding |
| Incomplete outcome data (attrition bias) All outcomes | Unclear risk | Not reported in sufficient detail to permit judgement |
| Selective reporting (reporting bias) | High risk | Not all the review’s pre‐specified outcomes were recorded. No patient‐centred outcomes including adverse events were provided |
| Other bias | Low risk | The study appeared to be free from other sources of bias |
CRIB‐PHOS 2011.
| Methods |
|
|
| Participants |
|
|
| Interventions | Treatment group 1
Treatment group 2
Co‐interventions
|
|
| Outcomes |
|
|
| Notes |
|
|
| Risk of bias | ||
| Bias | Authors' judgement | Support for judgement |
| Random sequence generation (selection bias) | Unclear risk | Insufficient information about sequence generation to permit judgement |
| Allocation concealment (selection bias) | Unclear risk | Insufficient information about allocation concealment to permit judgement |
| Blinding of participants and personnel (performance bias) All outcomes | Low risk | Double blinded |
| Blinding of outcome assessment (detection bias) All outcomes | Low risk | Blinding of outcome assessment was not reported. Outcomes were predominantly objective laboratory or clinical measures and were unlikely to be influenced by lack of blinding |
| Incomplete outcome data (attrition bias) All outcomes | Low risk | 5/55 allocated to sevelamer were withdrawn (hypophosphataemia (3); withdrew consent (1); intolerance (1)) 7/54 allocated to placebo were withdrawn (hypophosphataemia (1); withdrew consent (5); intolerance (1)) |
| Selective reporting (reporting bias) | Low risk | Key laboratory measures and death were reported |
| Other bias | Low risk | The study appeared to be free from other sources of bias |
D'Haese 2003.
| Methods |
|
|
| Participants |
|
|
| Interventions | Treatment group 1
Treatment group 2
Co‐interventions
|
|
| Outcomes |
|
|
| Notes |
|
|
| Risk of bias | ||
| Bias | Authors' judgement | Support for judgement |
| Random sequence generation (selection bias) | Unclear risk | Insufficient information about sequence generation to permit judgement |
| Allocation concealment (selection bias) | Unclear risk | Insufficient information about allocation concealment to permit judgement |
| Blinding of participants and personnel (performance bias) All outcomes | High risk | Open label. Lack of blinding likely to influence patient management |
| Blinding of outcome assessment (detection bias) All outcomes | Low risk | Blinding of outcome assessment was not reported. Outcomes were predominantly objective laboratory or clinical measures and were unlikely to be influenced by lack of blinding |
| Incomplete outcome data (attrition bias) All outcomes | High risk | Withdrawal due to adverse events was lanthanum 24% and calcium 22% |
| Selective reporting (reporting bias) | High risk | Not all the review’s pre‐specified outcomes were recorded. Patient‐centred outcomes including cause‐specific adverse events and death were not reported |
| Other bias | Unclear risk | Insufficient information to permit judgement. The baseline characteristics for each treatment group were not provided to assess for balance |
DCOR 2007.
| Methods |
|
|
| Participants |
|
|
| Interventions | Treatment group 1
Treatment group 2
Co‐interventions
|
|
| Outcomes |
|
|
| Notes |
|
|
| Risk of bias | ||
| Bias | Authors' judgement | Support for judgement |
| Random sequence generation (selection bias) | Unclear risk | Insufficient information about sequence generation to permit judgement |
| Allocation concealment (selection bias) | Unclear risk | Insufficient information about allocation concealment to permit judgement |
| Blinding of participants and personnel (performance bias) All outcomes | High risk | Open label. Lack of blinding may have influenced patient management |
| Blinding of outcome assessment (detection bias) All outcomes | Low risk | Blinding of outcome assessment was not reported. Outcomes were predominantly objective measures and were unlikely to be influenced by lack of blinding |
| Incomplete outcome data (attrition bias) All outcomes | High risk | 502/1053 allocated to sevelamer not included in analyses 533/1050 allocated to placebo not included in analyses |
| Selective reporting (reporting bias) | Low risk | Key patient‐centred outcomes reported |
| Other bias | High risk | Many sites (number not specified) participated in the study until 31 December 2003. This was the originally planned study end date. A more extended follow‐up period was deemed inappropriate because of the anticipated cross‐over to the alternate therapy in those who terminated early, especially in those terminating due to adverse events or investigator decisions. There was a single pre‐specified interim analysis at which a P‐value of 0.006 was required to stop the study and a P‐value of 0.048 was required to achieve statistical significance at the end of the study based on the O’Brien and Fleming sequential testing procedure. A Data Monitoring Committee (DMC) conducted the interim analysis in two stages 1 year after the last patient enrolled. First, the DMC conducted a blinded analysis of aggregated death data. The aggregate death rate was 13.6 per 100 patient‐years, substantially lower than the anticipated 17.8 per 100 patient‐years. The DMC recommendation to extend the treatment by a year, to retain the original power of the study, was followed. Second, the DMC conducted an unblinded analysis on the primary end point data. The death difference was not significant (stopping rule: P<0.006). Results of this second analysis were not shared with the investigators, Genzyme, or anyone else involved with the study |
De Santo 2006.
| Methods |
|
|
| Participants |
|
|
| Interventions | Treatment group 1
Treatment group 2
Co‐interventions
|
|
| Outcomes |
|
|
| Notes |
|
|
| Risk of bias | ||
| Bias | Authors' judgement | Support for judgement |
| Random sequence generation (selection bias) | Unclear risk | Insufficient information about sequence generation to permit judgement |
| Allocation concealment (selection bias) | Unclear risk | Insufficient information about allocation concealment to permit judgement |
| Blinding of participants and personnel (performance bias) All outcomes | High risk | Open label. Lack of blinding may have influenced patient management |
| Blinding of outcome assessment (detection bias) All outcomes | Low risk | Outcome measures predominantly laboratory measures that were unlikely to be influenced by lack of blinding |
| Incomplete outcome data (attrition bias) All outcomes | Unclear risk | Insufficient information about attrition to permit judgement |
| Selective reporting (reporting bias) | High risk | Cross‐over study and no separate results available for first part of the study so results could not be included in meta‐analyses. Key laboratory measures reported. Patient centred outcomes including adverse events not reported |
| Other bias | High risk | The study analysis was not appropriate for the cross‐over study design. There was not reported wash‐out phase between treatment periods. Baseline characteristics for each group were not reported in sufficient detail to assess balance |
Delmez 1996.
| Methods |
|
|
| Participants |
|
|
| Interventions | Treatment group 1
Treatment group 2
Co‐interventions
|
|
| Outcomes |
|
|
| Notes |
|
|
| Risk of bias | ||
| Bias | Authors' judgement | Support for judgement |
| Random sequence generation (selection bias) | Unclear risk | Insufficient information about sequence generation to permit judgement |
| Allocation concealment (selection bias) | Unclear risk | Insufficient information about allocation concealment to permit judgement |
| Blinding of participants and personnel (performance bias) All outcomes | High risk | Open label. Lack of blinding may have influenced patient management |
| Blinding of outcome assessment (detection bias) All outcomes | Low risk | Blinding of outcome assessment was not reported. Outcome measures were laboratory measures and unlikely to be influenced by knowledge of treatment allocation |
| Incomplete outcome data (attrition bias) All outcomes | Unclear risk | Insufficient information about study attrition to permit judgement |
| Selective reporting (reporting bias) | High risk | Cross‐over study and no separate results available for first part of the study so results could not be included in meta‐analyses. No patient‐centred outcomes including adverse events were provided |
| Other bias | High risk | The study analysis methods were not appropriate for the cross‐over study design. Baseline characteristics for each group were not reported in sufficient detail to assess balance |
Delmez 2007.
| Methods |
|
|
| Participants |
|
|
| Interventions | Treatment group 1
Treatment group 2
Co‐interventions
|
|
| Outcomes |
|
|
| Notes |
|
|
| Risk of bias | ||
| Bias | Authors' judgement | Support for judgement |
| Random sequence generation (selection bias) | Unclear risk | Insufficient information about sequence generation to permit judgement |
| Allocation concealment (selection bias) | Unclear risk | Insufficient information about allocation concealment to permit judgement |
| Blinding of participants and personnel (performance bias) All outcomes | High risk | Open label. Lack of blinding may have influenced patient management |
| Blinding of outcome assessment (detection bias) All outcomes | Low risk | Blinding of outcome assessment was not reported. Outcome measures were death and laboratory measures and unlikely to be influenced by knowledge of treatment allocation |
| Incomplete outcome data (attrition bias) All outcomes | Low risk | 4/39 patients allocated to sevelamer hydrochloride not included in analyses (adverse event (4)) 1/40 patients allocated to sevelamer carbonate not included in analyses (never received study medication (1)) |
| Selective reporting (reporting bias) | Low risk | Cross‐over study and no separate results available for first part of the study so results could not be included in meta‐analyses. Key death outcomes and laboratory measures were reported |
| Other bias | High risk | The study analysis methods were not appropriate for the cross‐over study design. Baseline characteristics for each group were not reported in sufficient detail to assess balance |
Deuber 2004.
| Methods |
|
|
| Participants |
|
|
| Interventions | Treatment group 1
Treatment group 2
Co‐interventions
|
|
| Outcomes |
|
|
| Notes |
|
|
| Risk of bias | ||
| Bias | Authors' judgement | Support for judgement |
| Random sequence generation (selection bias) | Unclear risk | Insufficient information about sequence generation to permit judgement |
| Allocation concealment (selection bias) | Unclear risk | Insufficient information about allocation concealment to permit judgement |
| Blinding of participants and personnel (performance bias) All outcomes | High risk | Open label. Lack of blinding may have influenced patient management |
| Blinding of outcome assessment (detection bias) All outcomes | Low risk | Blinding of outcome assessment was not reported. Outcome measures were laboratory measures and unlikely to be influenced by knowledge of treatment allocation |
| Incomplete outcome data (attrition bias) All outcomes | Unclear risk | Insufficient information about outcome assessment to permit judgement |
| Selective reporting (reporting bias) | High risk | Not all the review’s pre‐specified outcomes were recorded. Patient‐centred outcomes not reported |
| Other bias | Low risk | The study appeared to be free from other sources of bias |
Evenepoel 2009.
| Methods |
|
|
| Participants |
|
|
| Interventions | Treatment group 1
Treatment group 2
Co‐interventions
|
|
| Outcomes |
|
|
| Notes |
|
|
| Risk of bias | ||
| Bias | Authors' judgement | Support for judgement |
| Random sequence generation (selection bias) | Unclear risk | Insufficient information about sequence generation to permit judgement |
| Allocation concealment (selection bias) | Unclear risk | Insufficient information about allocation concealment to permit judgement |
| Blinding of participants and personnel (performance bias) All outcomes | High risk | Open label. Lack of blinding may have influenced patient management |
| Blinding of outcome assessment (detection bias) All outcomes | Low risk | Blinding of outcome assessment was not reported. Outcome measures were death and laboratory measures and unlikely to be influenced by knowledge of treatment allocation |
| Incomplete outcome data (attrition bias) All outcomes | High risk | 16/46 participants randomised to calcium acetate not included in analyses 23/97 participants randomised to sevelamer hydrochloride not included in analyses Adverse events were the main reason for premature withdrawal from the study (18% of sevelamer hydrochloride‐treated patients and 28% of calcium acetate‐treated patients). Four patients had no post‐baseline efficacy assessment and so the ITT population consisted of 139 patients (sevelamer hydrochloride (95); calcium acetate (44)). Thirty‐six patients were excluded from the PP analysis, which consisted of 103 patients (sevelamer hydrochloride (72); calcium acetate (31)). The main reasons for exclusion from the PP population were poor compliance (sevelamer hydrochloride (15, 16%); calcium acetate (10, 22%)) and duration on treatment of < 3 weeks (sevelamer hydrochloride (7, 7%); calcium acetate (3, 7%)). Other reasons were proscribed medication usage, inadequate washout duration and randomised treatment not used |
| Selective reporting (reporting bias) | Low risk | Death (all causes), adverse events, and key laboratory measures were recorded |
| Other bias | High risk | Imbalance in baseline characteristics |
Evsanaa 2015.
| Methods |
|
|
| Participants |
|
|
| Interventions | Treatment group 1
Treatment group 2
Co‐interventions
|
|
| Outcomes |
|
|
| Notes |
|
|
| Risk of bias | ||
| Bias | Authors' judgement | Support for judgement |
| Random sequence generation (selection bias) | Unclear risk | Insufficient information about sequence generation to permit judgement |
| Allocation concealment (selection bias) | Unclear risk | Insufficient information about allocation concealment to permit judgement |
| Blinding of participants and personnel (performance bias) All outcomes | Low risk | Investigator blinded |
| Blinding of outcome assessment (detection bias) All outcomes | Low risk | Blinding of outcome assessment was not reported. Outcome measures were death and laboratory measures and unlikely to be influenced by knowledge of treatment allocation |
| Incomplete outcome data (attrition bias) All outcomes | Low risk | 17/20 patients completed the study (transplant (1); died (1); intolerance of medication (1)) |
| Selective reporting (reporting bias) | High risk | Cross‐over study and no separate results available for first part of the study so results could not be included in meta‐analyses. Key patient‐centred outcomes and laboratory measures reported |
| Other bias | High risk | The analysis methods were not appropriate for the cross‐over study design. Baseline characteristics for each study group were not reported in sufficient detail to assess for balance |
Ferreira 2008.
| Methods |
|
|
| Participants |
|
|
| Interventions | Treatment group 1
Treatment group 2
Co‐interventions
|
|
| Outcomes |
|
|
| Notes |
|
|
| Risk of bias | ||
| Bias | Authors' judgement | Support for judgement |
| Random sequence generation (selection bias) | Unclear risk | Insufficient information about sequence generation to permit judgement |
| Allocation concealment (selection bias) | Unclear risk | Insufficient information about allocation concealment to permit judgement |
| Blinding of participants and personnel (performance bias) All outcomes | High risk | Open label. Lack of blinding may have influenced patient management |
| Blinding of outcome assessment (detection bias) All outcomes | Low risk | Blinding of outcome assessment was not reported. Outcome measures were laboratory‐based and unlikely to be influenced by lack of blinding |
| Incomplete outcome data (attrition bias) All outcomes | High risk | 11/44 participants allocated to sevelamer not included in analyses (adverse event (2); withdrew consent (2); kidney transplant (4); other (2)) 12/47 participants allocated to calcium not included in analyses (adverse even (2); non‐adherence (1; withdrew consent (1); kidney transplant (8); other (2)) |
| Selective reporting (reporting bias) | High risk | Not all the review’s pre‐specified outcomes were recorded |
| Other bias | High risk | Imbalance in baseline characteristics. Differential use of co‐interventions |
Fishbane 2010.
| Methods |
|
|
| Participants |
|
|
| Interventions | Treatment group 1
Treatment group 2:
Co‐interventions
|
|
| Outcomes |
|
|
| Notes |
|
|
| Risk of bias | ||
| Bias | Authors' judgement | Support for judgement |
| Random sequence generation (selection bias) | Unclear risk | Insufficient information about sequence generation to permit judgement |
| Allocation concealment (selection bias) | Unclear risk | Insufficient information about allocation concealment to permit judgement |
| Blinding of participants and personnel (performance bias) All outcomes | High risk | Open label. Lacking of blinding may have influenced patient management |
| Blinding of outcome assessment (detection bias) All outcomes | Low risk | Blinding of outcome assessment was not reported. Outcome measures were death or laboratory‐based and unlikely to be influenced by lack of blinding. Adverse events may have been influenced by lack of blinding |
| Incomplete outcome data (attrition bias) All outcomes | High risk | 11/73 participants allocated to sevelamer hydrochloride not included in analyses (adverse event (4); withdrew consent (2); death (2); lost‐to follow‐up (1); other (2)) 51/144 participants allocated to sevelamer carbonate not included in analyses (adverse event (18); withdrew consent (18); did not adhere to protocol (4); death (1); lost to follow‐up (1); other (9)) |
| Selective reporting (reporting bias) | Low risk | Key biochemical outcomes were measured, together with death and adverse events |
| Other bias | High risk | Study funded and authored by Genzyme |
Floege 2014.
| Methods |
|
|
| Participants |
|
|
| Interventions | Treatment group 1
Treatment group 2
Co‐interventions
|
|
| Outcomes |
|
|
| Notes |
|
|
| Risk of bias | ||
| Bias | Authors' judgement | Support for judgement |
| Random sequence generation (selection bias) | Low risk | Interactive voice response system |
| Allocation concealment (selection bias) | Low risk | Interactive voice response system |
| Blinding of participants and personnel (performance bias) All outcomes | High risk | Open label. Lacking of blinding may have influenced patient management |
| Blinding of outcome assessment (detection bias) All outcomes | Low risk | Blinding of outcome assessment was not reported. Outcome measures were laboratory based and death. Knowledge of treatment allocation may have influenced interpretation of adverse event reporting |
| Incomplete outcome data (attrition bias) All outcomes | High risk | 56/349 participants assigned to sevelamer not included in analyses (death (5); adverse event (21); hyperphosphataemia (0); withdraw consent (15); investigator or sponsor decision (5); kidney transplant (7); other (3)) 195/710 participants assigned to PA21 not included in analyses (death (9); adverse event (94); hyperphosphataemia (12); withdrew consent (32); investigator or sponsor decision (10); kidney transplant (16; other (22)) |
| Selective reporting (reporting bias) | Low risk | Key biochemical outcomes were measured, together with death and adverse events |
| Other bias | Low risk | The study appeared to have no other sources of bias |
Foraster 1998.
| Methods |
|
|
| Participants |
|
|
| Interventions | Treatment group 1
Treatment group 2:
Co‐interventions
|
|
| Outcomes |
|
|
| Notes |
|
|
| Risk of bias | ||
| Bias | Authors' judgement | Support for judgement |
| Random sequence generation (selection bias) | Unclear risk | Insufficient information about sequence generation to permit judgement |
| Allocation concealment (selection bias) | Unclear risk | Insufficient information about allocation concealment to permit judgement |
| Blinding of participants and personnel (performance bias) All outcomes | High risk | Open label; knowledge of treatment allocation likely to influence patient management |
| Blinding of outcome assessment (detection bias) All outcomes | Low risk | Blinding of outcome assessment was not reported. Outcome measures were laboratory based and unlikely to be influenced by lack of blinding |
| Incomplete outcome data (attrition bias) All outcomes | Unclear risk | Insufficient information about study attrition to permit judgement |
| Selective reporting (reporting bias) | High risk | Not all the review’s pre‐specified outcomes were recorded |
| Other bias | Unclear risk | Insufficient information to permit judgement |
Fujii 2017.
| Methods |
|
|
| Participants |
|
|
| Interventions | Treatment group 1
Treatment group 2
Co‐interventions
|
|
| Outcomes |
|
|
| Notes |
|
|
| Risk of bias | ||
| Bias | Authors' judgement | Support for judgement |
| Random sequence generation (selection bias) | High risk | Insufficient information about sequence generation to permit judgement. Described as randomised study. Patients were divided into groups based on the treatment of hyperphosphataemia. Unclear whether study design was randomised controlled study |
| Allocation concealment (selection bias) | Unclear risk | Insufficient information about allocation concealment to permit judgement |
| Blinding of participants and personnel (performance bias) All outcomes | High risk | Open label. Patient management may have been influenced by knowledge of treatment allocation |
| Blinding of outcome assessment (detection bias) All outcomes | Low risk | Blinding of outcome assessment was not reported. Outcome measures were laboratory based and unlikely to be influenced by knowledge of treatment allocation. Imaging analysis of echocardiography and coronary artery calcification may have been influenced by knowledge of treatment allocation |
| Incomplete outcome data (attrition bias) All outcomes | Unclear risk | Insufficient information about study attrition to permit judgement |
| Selective reporting (reporting bias) | High risk | Not all the review’s pre‐specified outcomes were recorded |
| Other bias | Unclear risk | Insufficient information to permit judgement |
Fujimori 2017.
| Methods |
|
|
| Participants |
|
|
| Interventions | Treatment group 1
Treatment group 2
|
|
| Outcomes |
|
|
| Notes |
|
|
| Risk of bias | ||
| Bias | Authors' judgement | Support for judgement |
| Random sequence generation (selection bias) | Unclear risk | Insufficient information about sequence generation to permit judgement |
| Allocation concealment (selection bias) | Unclear risk | Insufficient information about allocation concealment to permit judgement |
| Blinding of participants and personnel (performance bias) All outcomes | High risk | Open label; knowledge of treatment allocation may have influenced patient management |
| Blinding of outcome assessment (detection bias) All outcomes | Low risk | Blinding of outcome assessment was not reported. Outcome measures were laboratory measures and unlikely to have been influenced by knowledge of treatment allocation |
| Incomplete outcome data (attrition bias) All outcomes | High risk | 4/9 participants allocated to ferric citrate were not included in analysis (overshoot of Hb (4); GI effects (1)) All participants allocated to lanthanum carbonate were included in analysis |
| Selective reporting (reporting bias) | High risk | Not all the review’s pre‐specified outcomes were recorded |
| Other bias | Unclear risk | Insufficient information to permit judgement |
Gallieni 2005.
| Methods |
|
|
| Participants |
|
|
| Interventions | Treatment group 1
Treatment group 2
Co‐interventions
|
|
| Outcomes |
|
|
| Notes |
|
|
| Risk of bias | ||
| Bias | Authors' judgement | Support for judgement |
| Random sequence generation (selection bias) | Unclear risk | Insufficient information about sequence generation to permit judgement |
| Allocation concealment (selection bias) | Unclear risk | Insufficient information about allocation concealment to permit judgement |
| Blinding of participants and personnel (performance bias) All outcomes | High risk | Open label; knowledge of treatment allocation may have influenced patient management |
| Blinding of outcome assessment (detection bias) All outcomes | Low risk | Blinding of outcome assessment was not reported. Outcome measures were laboratory measures and unlikely to have been influenced by knowledge of treatment allocation |
| Incomplete outcome data (attrition bias) All outcomes | Unclear risk | Insufficient information about study attrition to permit judgement |
| Selective reporting (reporting bias) | Low risk | Key biochemical measures were reported. Adverse events were reported |
| Other bias | Unclear risk | Insufficient information to permit judgement |
Greenberg 1994.
| Methods |
|
|
| Participants |
|
|
| Interventions | Treatment group 1
Treatment group 2
|
|
| Outcomes |
|
|
| Notes |
|
|
| Risk of bias | ||
| Bias | Authors' judgement | Support for judgement |
| Random sequence generation (selection bias) | Low risk | Insufficient information about sequence generation to permit judgement |
| Allocation concealment (selection bias) | Low risk | Insufficient information about allocation concealment to permit judgement |
| Blinding of participants and personnel (performance bias) All outcomes | High risk | Open label; knowledge of treatment allocation may have influenced patient management |
| Blinding of outcome assessment (detection bias) All outcomes | Low risk | Blinding of outcome assessment was not reported. Outcome measures were laboratory measures and unlikely to have been influenced by knowledge of treatment allocation |
| Incomplete outcome data (attrition bias) All outcomes | Unclear risk | Insufficient information about study attrition to permit judgement |
| Selective reporting (reporting bias) | High risk | Cross‐over study and no separate results available for first part of the study so results could not be included in meta‐analyses. No reporting of adverse events or other patient‐centred outcomes |
| Other bias | High risk | Analytical approach not appropriate for study cross‐over design |
Hervas 2003.
| Methods |
|
|
| Participants |
|
|
| Interventions | Treatment group 1
Treatment group 2
Co‐interventions
|
|
| Outcomes |
|
|
| Notes |
|
|
| Risk of bias | ||
| Bias | Authors' judgement | Support for judgement |
| Random sequence generation (selection bias) | Unclear risk | Insufficient information about sequence generation to permit judgement |
| Allocation concealment (selection bias) | Unclear risk | Insufficient information about allocation concealment to permit judgement |
| Blinding of participants and personnel (performance bias) All outcomes | High risk | Open label; knowledge of treatment allocation may have influenced patient management |
| Blinding of outcome assessment (detection bias) All outcomes | Low risk | Blinding of outcome assessment was not reported. Outcome measures were laboratory measures and unlikely to have been influenced by knowledge of treatment allocation |
| Incomplete outcome data (attrition bias) All outcomes | Low risk | 11/51 participants allocated to treatment were not included in analysis (death (4); kidney transplant (2); adverse event (1); lack of adherence (4)) |
| Selective reporting (reporting bias) | High risk | Not all the review’s pre‐specified outcomes were recorded; number of patients in each group not reported |
| Other bias | High risk | The baseline characteristics for each treatment group were not reported in sufficient detail to assess for balance |
Hutchison 2005.
| Methods |
|
|
| Participants |
|
|
| Interventions | Treatment group 1
treatment group 2
Co‐interventions
|
|
| Outcomes |
|
|
| Notes |
|
|
| Risk of bias | ||
| Bias | Authors' judgement | Support for judgement |
| Random sequence generation (selection bias) | Unclear risk | Insufficient information about sequence generation to permit judgement |
| Allocation concealment (selection bias) | Unclear risk | Insufficient information about allocation concealment to permit judgement |
| Blinding of participants and personnel (performance bias) All outcomes | High risk | Open label; knowledge of treatment allocation may have influenced patient management |
| Blinding of outcome assessment (detection bias) All outcomes | Low risk | Blinding of outcome assessment was not reported. Outcome measures were laboratory measures and unlikely to have been influenced by knowledge of treatment allocation. Adverse events may have been influenced by knowledge of treatment allocation |
| Incomplete outcome data (attrition bias) All outcomes | High risk | 23/533 participants allocated to lanthanum not included in analyses 10/267 participants allocated to calcium not included in analyses Efficacy data for 33 patients from a single centre were not included due to unreliability of data. 54.2% of participants who commenced titration with lanthanum carbonate completed titration and maintenance phase. 57.7% of patients receiving calcium carbonate treatment progressed to and completed maintenance phase |
| Selective reporting (reporting bias) | Low risk | Key laboratory measures and adverse events were reported |
| Other bias | Low risk | The study appeared to be free of other sources of bias |
INDEPENDENT‐CKD 2012.
| Methods | Study design: parallel RCT Follow‐up period: 24 months Time frame: Enrolment began in November 2005 |
|
| Participants |
|
|
| Interventions | Treatment group 1
Treatment group 2
|
|
| Outcomes |
|
|
| Notes |
|
|
| Risk of bias | ||
| Bias | Authors' judgement | Support for judgement |
| Random sequence generation (selection bias) | Low risk | A single simple randomisation list was generated by computer |
| Allocation concealment (selection bias) | Low risk | Allocation was concealed with the use of numbered, opaque sealed envelopes that were opened in sequence by the administrative personnel of the coordinating centre not involved in patient care. All participating centres followed the same procedure via a phone call to the coordinating centre |
| Blinding of participants and personnel (performance bias) All outcomes | High risk | Open label; knowledge of treatment allocation may have influenced patient management |
| Blinding of outcome assessment (detection bias) All outcomes | Low risk | Two readers unaware of phosphate binder assignments read the CT scans. Blinding of outcome assessment for other outcomes was not reported. Outcome measures were laboratory measures and death and were unlikely to have been influenced by knowledge of treatment allocation |
| Incomplete outcome data (attrition bias) All outcomes | High risk | 14/121 participants allocated to sevelamer not included in analysis (lost to follow‐up (3); poor quality basal scan (4); change of clinic (4)) 13/118 participants allocated to calcium not included in analysis (lost to follow‐up (4); poor quality basal scan (3); withdrawal of consent (1); change of clinic (5)) |
| Selective reporting (reporting bias) | Low risk | Key death and patient‐centred outcomes reported. Key laboratory outcomes reported |
| Other bias | Low risk | The study appeared to be free of other sources of bias |
INDEPENDENT‐HD 2009.
| Methods |
|
|
| Participants |
|
|
| Interventions | Treatment group 1
Treatment group 2
Co‐interventions
|
|
| Outcomes |
|
|
| Notes |
|
|
| Risk of bias | ||
| Bias | Authors' judgement | Support for judgement |
| Random sequence generation (selection bias) | Unclear risk | Insufficient information about sequence generation to permit judgement |
| Allocation concealment (selection bias) | Unclear risk | To maintain allocation concealment, randomisation was performed centrally |
| Blinding of participants and personnel (performance bias) All outcomes | High risk | Open label; knowledge of treatment allocation may have influenced patient management |
| Blinding of outcome assessment (detection bias) All outcomes | Low risk | Blinding of outcome assessment was not reported. Outcome measures were laboratory measures and death and were unlikely to have been influenced by knowledge of treatment allocation |
| Incomplete outcome data (attrition bias) All outcomes | Low risk | 33/232 participants allocated to sevelamer did not complete follow‐up (poor quality CT scan (6); consent withdrawal (8); change of clinic (19)) 36/234 participants allocated to calcium did not complete follow‐up (poor quality CT scan (7); consent withdrawal (11); change of clinic (18)) |
| Selective reporting (reporting bias) | Low risk | Key death and patient‐centred outcomes reported. Key laboratory outcomes reported |
| Other bias | Low risk | The study appears to be free of other sources of bias. Because a lower than expected overall death rate was observed in the total study population without consideration of group allocation after 12 months of study, an 8‐month extension of the recruitment phase was obtained |
Isakova 2013.
| Methods |
|
|
| Participants |
|
|
| Interventions | Treatment group
Control group
Co‐interventions
|
|
| Outcomes |
|
|
| Notes |
|
|
| Risk of bias | ||
| Bias | Authors' judgement | Support for judgement |
| Random sequence generation (selection bias) | Unclear risk | Insufficient information about sequence generation to permit judgement. Randomisation was conducted by a research pharmacist |
| Allocation concealment (selection bias) | Unclear risk | Treatment allocation was conducted by a research pharmacist |
| Blinding of participants and personnel (performance bias) All outcomes | Low risk | The phosphate binder intervention was double‐blinded |
| Blinding of outcome assessment (detection bias) All outcomes | Low risk | Blinding of outcome assessment was not reported. Outcome measures were laboratory measures and hospitalisation and were unlikely to have been influenced by knowledge of treatment allocation. Adverse event reporting may have been influenced by lack of blinding; however; participants and investigators were unaware of treatment assignment |
| Incomplete outcome data (attrition bias) All outcomes | Low risk | 3/22 participants allocated to lanthanum were not included in analysis 1/21 participants allocated to placebo were not included in analysis |
| Selective reporting (reporting bias) | Low risk | Key adverse events and laboratory measures were reported |
| Other bias | Low risk | The study appeared to be free of other sources of bias |
Itoh 2008.
| Methods |
|
|
| Participants |
|
|
| Interventions | Treatment group 1
Treatment group 2
Co‐interventions
|
|
| Outcomes |
|
|
| Notes |
|
|
| Risk of bias | ||
| Bias | Authors' judgement | Support for judgement |
| Random sequence generation (selection bias) | Unclear risk | Insufficient information about sequence generation to permit judgement |
| Allocation concealment (selection bias) | Unclear risk | Insufficient information about allocation concealment to permit judgement |
| Blinding of participants and personnel (performance bias) All outcomes | High risk | Open label; knowledge of treatment allocation may have influenced patient management |
| Blinding of outcome assessment (detection bias) All outcomes | Low risk | Blinding of outcome assessment was not reported. Outcome measures were laboratory based and unlikely to be influenced by knowledge of treatment assignment |
| Incomplete outcome data (attrition bias) All outcomes | High risk | 35/62 participants withdrew from the study due primarily to GI side‐effects; 18 participants dropped out from the sevelamer group and 17 dropped out from the colestimide group |
| Selective reporting (reporting bias) | High risk | Not all the review’s pre‐specified outcomes were recorded |
| Other bias | Low risk | The study appeared to be free of other sources of bias |
Janssen 1995.
| Methods |
|
|
| Participants |
|
|
| Interventions | Treatment group 1
Treatment group 2
Co‐interventions
|
|
| Outcomes |
|
|
| Notes |
|
|
| Risk of bias | ||
| Bias | Authors' judgement | Support for judgement |
| Random sequence generation (selection bias) | Unclear risk | Insufficient information about sequence generation to permit judgement |
| Allocation concealment (selection bias) | Unclear risk | Insufficient information about allocation concealment to permit judgement |
| Blinding of participants and personnel (performance bias) All outcomes | High risk | Open label; knowledge of treatment allocation may have influenced patient management |
| Blinding of outcome assessment (detection bias) All outcomes | Low risk | Blinding of outcome assessment was not reported. Outcome measures were laboratory based or death and were unlikely to be influenced by knowledge of treatment assignment |
| Incomplete outcome data (attrition bias) All outcomes | High risk | 8/17 participants allocated to calcium carbonate not completed follow‐up 6/16 participants allocated to calcium acetate not completed follow‐up The reasons for loss to follow up in each treatment group was not reported |
| Selective reporting (reporting bias) | Low risk | Key laboratory measures and death were reported |
| Other bias | Unclear risk | Insufficient information to permit judgement |
Janssen 1996.
| Methods |
|
|
| Participants |
|
|
| Interventions | Treatment group 1
Treatment group 2
Treatment group 3
Co‐interventions
|
|
| Outcomes |
|
|
| Notes |
|
|
| Risk of bias | ||
| Bias | Authors' judgement | Support for judgement |
| Random sequence generation (selection bias) | Unclear risk | Insufficient information about sequence generation to permit judgement |
| Allocation concealment (selection bias) | Unclear risk | Insufficient information about allocation concealment to permit judgement |
| Blinding of participants and personnel (performance bias) All outcomes | High risk | Open label; knowledge of treatment allocation may have influenced patient management |
| Blinding of outcome assessment (detection bias) All outcomes | Low risk | Blinding of outcome assessment was not reported. Outcome measures were laboratory based or death and were unlikely to be influenced by knowledge of treatment assignment |
| Incomplete outcome data (attrition bias) All outcomes | High risk | 7/20 participants allocated to calcium carbonate did not complete follow‐up (death (2); change in dialysis therapy (1); hypercalcaemia (1); medication resistance (2); transplantation (1)) 4/18 participants allocated to calcium acetate did not complete follow‐up (change in dialysis treatment (1); other (3)) 5/15 participants allocated to aluminium hydroxide did not complete follow‐up (death (2); hypercalcaemia (1); side effects (1); other (1)) |
| Selective reporting (reporting bias) | Low risk | Key laboratory measures and death were reported |
| Other bias | Unclear risk | Insufficient information to permit judgement |
Jespersen 1991.
| Methods |
|
|
| Participants |
|
|
| Interventions | Treatment group 1
Treatment group 2
Co‐interventions
|
|
| Outcomes |
|
|
| Notes |
|
|
| Risk of bias | ||
| Bias | Authors' judgement | Support for judgement |
| Random sequence generation (selection bias) | Unclear risk | Insufficient information about sequence generation to permit judgement |
| Allocation concealment (selection bias) | Unclear risk | Insufficient information about allocation concealment to permit judgement |
| Blinding of participants and personnel (performance bias) All outcomes | High risk | Open label; knowledge of treatment allocation may have influenced patient management |
| Blinding of outcome assessment (detection bias) All outcomes | Low risk | Blinding of outcome assessment was not reported. Outcome measures were laboratory based and were unlikely to be influenced by knowledge of treatment assignment. Interpretation of bone histomorphometry may have been influenced by knowledge of treatment assignment |
| Incomplete outcome data (attrition bias) All outcomes | High risk | 3/14 did not complete follow‐up |
| Selective reporting (reporting bias) | High risk | Not all the review’s pre‐specified outcomes were recorded. Data were not available for the first period of treatment |
| Other bias | High risk | Data analysis was not appropriate for cross‐over study design |
Kakuta 2011.
| Methods |
|
|
| Participants |
|
|
| Interventions | Treatment group 1
Treatment group 2
Co‐interventions
|
|
| Outcomes |
|
|
| Notes |
|
|
| Risk of bias | ||
| Bias | Authors' judgement | Support for judgement |
| Random sequence generation (selection bias) | Unclear risk | Insufficient information about sequence generation to permit judgement |
| Allocation concealment (selection bias) | Low risk | Investigators were informed of patient allocation using concealed envelopes |
| Blinding of participants and personnel (performance bias) All outcomes | High risk | Open label; knowledge of treatment allocation may have influenced patient management |
| Blinding of outcome assessment (detection bias) All outcomes | Low risk | Outcome assessment of CACS was blinded. Blinding of other outcomes was not reported. Outcome measures were laboratory based or death and were unlikely to be influenced by knowledge of treatment assignment |
| Incomplete outcome data (attrition bias) All outcomes | High risk | 12/91 participants allocated to sevelamer were not included in analysis (change of clinic (1); adverse event (2); consent withdrawn due to constipation (6); protocol violation (3)) 8/92 participants allocated to calcium were not included in analysis (change of clinic (1); adverse event (5); protocol violation (2)) |
| Selective reporting (reporting bias) | Low risk | Key measures of laboratory outcomes, death, and vascular calcification were reported |
| Other bias | Low risk | The study appeared to be free of other sources of bias |
Kasai 2012.
| Methods |
|
|
| Participants |
|
|
| Interventions | Treatment group 1
Treatment group 2
Co‐interventions
|
|
| Outcomes |
|
|
| Notes |
|
|
| Risk of bias | ||
| Bias | Authors' judgement | Support for judgement |
| Random sequence generation (selection bias) | Unclear risk | Insufficient information about sequence generation to permit judgement |
| Allocation concealment (selection bias) | Unclear risk | Insufficient information about allocation concealment to permit judgement |
| Blinding of participants and personnel (performance bias) All outcomes | High risk | Open label; knowledge of treatment allocation may have influenced patient management |
| Blinding of outcome assessment (detection bias) All outcomes | Low risk | Blinding of outcome assessment was not reported. Outcome measures were death and laboratory events which were unlikely to be influenced by knowledge of treatment allocation. Adverse events may have been influenced by knowledge of treatment outcome. Study described as blinded‐endpoint study design |
| Incomplete outcome data (attrition bias) All outcomes | Low risk | 42/42 participants included in safety analysis. Two patients discontinued the study; one died and the other withdrew due to an adverse event |
| Selective reporting (reporting bias) | Low risk | Cross‐over study and no separate results available for first part of the study so results could not be included in meta‐analyses. Key laboratory outcomes and death were reported |
| Other bias | Unclear risk | Insufficient information to permit judgement |
Katopodis 2006.
| Methods |
|
|
| Participants |
|
|
| Interventions | Treatment group 1
Treatment group 2
Co‐interventions
|
|
| Outcomes |
|
|
| Notes |
|
|
| Risk of bias | ||
| Bias | Authors' judgement | Support for judgement |
| Random sequence generation (selection bias) | Low risk | Computer generated random numbers |
| Allocation concealment (selection bias) | Unclear risk | Insufficient information about allocation concealment to permit judgement |
| Blinding of participants and personnel (performance bias) All outcomes | High risk | Open label; knowledge of treatment allocation may have influenced patient management |
| Blinding of outcome assessment (detection bias) All outcomes | Low risk | Blinding of outcome assessment was not reported. Outcome measures laboratory events which were unlikely to be influenced by knowledge of treatment allocation. Adverse events may have been influenced by knowledge of treatment outcome |
| Incomplete outcome data (attrition bias) All outcomes | Unclear risk | Insufficient information about study attrition to permit judgement |
| Selective reporting (reporting bias) | Low risk | Cross‐over study and no separate results available for first part of the study so results could not be included in meta‐analyses. Key laboratory measures and adverse events were reported |
| Other bias | Unclear risk | Insufficient information to permit judgement |
Ko 2010.
| Methods |
|
|
| Participants |
|
|
| Interventions | Treatment group 1
Treatment group 2
Co‐interventions
|
|
| Outcomes |
|
|
| Notes |
|
|
| Risk of bias | ||
| Bias | Authors' judgement | Support for judgement |
| Random sequence generation (selection bias) | Unclear risk | Insufficient information about sequence generation to permit judgement |
| Allocation concealment (selection bias) | Unclear risk | Insufficient information about allocation concealment to permit judgement |
| Blinding of participants and personnel (performance bias) All outcomes | High risk | Open label; knowledge of treatment allocation may have influenced patient management |
| Blinding of outcome assessment (detection bias) All outcomes | Low risk | Blinding of outcome assessment was not reported. Outcome measures were laboratory events which were unlikely to be influenced by knowledge of treatment allocation. Reporting of adverse events may have been influenced by knowledge of treatment allocation |
| Incomplete outcome data (attrition bias) All outcomes | Unclear risk | Insufficient information about study attrition to permit judgement |
| Selective reporting (reporting bias) | Low risk | Key laboratory measures and adverse events were reported |
| Other bias | High risk | Imbalance in baseline characteristics |
Koiwa 2017.
| Methods |
|
|
| Participants |
|
|
| Interventions | Treatment group 1
Treatment group 2
Co‐interventions
|
|
| Outcomes |
|
|
| Notes |
|
|
| Risk of bias | ||
| Bias | Authors' judgement | Support for judgement |
| Random sequence generation (selection bias) | Low risk | Interactive web response system |
| Allocation concealment (selection bias) | Low risk | Interactive web response system |
| Blinding of participants and personnel (performance bias) All outcomes | High risk | Open label; knowledge of treatment allocation may have influenced patient management |
| Blinding of outcome assessment (detection bias) All outcomes | Low risk | Blinding of outcome assessment was not reported. Outcome measures were laboratory events which were unlikely to be influenced by knowledge of treatment allocation. Reporting of adverse events may have been influenced by knowledge of treatment allocation |
| Incomplete outcome data (attrition bias) All outcomes | High risk | 18/105 discontinued therapy in the sevelamer group (adverse event (10); calcium decrease (3); other (5)) 14/108 discontinued therapy in the PA21 group (adverse event (7); calcium decrease (2); ferritin decrease (1); other (6)) |
| Selective reporting (reporting bias) | Low risk | Key laboratory measures and adverse events were reported |
| Other bias | High risk | Imbalance in baseline characteristics |
Lee 2013.
| Methods |
|
|
| Participants |
|
|
| Interventions | Treatment group 1
Treatment group 2
Co‐interventions
|
|
| Outcomes |
|
|
| Notes |
|
|
| Risk of bias | ||
| Bias | Authors' judgement | Support for judgement |
| Random sequence generation (selection bias) | Unclear risk | Insufficient information about sequence generation to permit judgement |
| Allocation concealment (selection bias) | Unclear risk | Insufficient information about allocation concealment to permit judgement |
| Blinding of participants and personnel (performance bias) All outcomes | High risk | Open label; knowledge of treatment allocation may have influenced patient management |
| Blinding of outcome assessment (detection bias) All outcomes | Low risk | Blinding of outcome assessment was not reported. Outcome measures were laboratory events which were unlikely to be influenced by knowledge of treatment allocation. Reporting of adverse events may have been influenced by knowledge of treatment allocation |
| Incomplete outcome data (attrition bias) All outcomes | High risk | 22 patients dropped out (10 patients due to GI trouble, such as nausea, vomiting, constipation, and abdominal discomfort) in the lanthanum carbonate group
3 patients in the lanthanum carbonate group and 5 patients in the calcium carbonate group due to noncompliance 1 patient in the lanthanum carbonate group and 2 patients in the calcium carbonate group for other reasons) |
| Selective reporting (reporting bias) | Low risk | Key laboratory measures and adverse events were reported |
| Other bias | Unclear risk | Insufficient information to permit judgement |
Lee 2015b.
| Methods |
|
|
| Participants |
|
|
| Interventions | Treatment group 1
Treatment group 2
Treatment group 3
Co‐interventions
|
|
| Outcomes |
|
|
| Notes |
|
|
| Risk of bias | ||
| Bias | Authors' judgement | Support for judgement |
| Random sequence generation (selection bias) | Unclear risk | Insufficient information about sequence generation to permit judgement |
| Allocation concealment (selection bias) | Unclear risk | Insufficient information about allocation concealment to permit judgement |
| Blinding of participants and personnel (performance bias) All outcomes | Low risk | Double blinded |
| Blinding of outcome assessment (detection bias) All outcomes | Low risk | Blinding of outcome assessment was not reported. Outcome measures were laboratory events which were unlikely to be influenced by knowledge of treatment allocation. Reporting of adverse events may have been influenced by knowledge of treatment allocation |
| Incomplete outcome data (attrition bias) All outcomes | High risk | 18/72 assigned to ferric citrate 6 g/d did not complete study (adverse event (7); withdrawal (8); TSAT > 55% (3)) 9/75 assigned to ferric citrate 4 g/d did not complete study (adverse event (2); voluntary withdrawal (3); hyperphosphataemia (1); TSAT > 55% (3)) 24/36 assigned to placebo did not complete study (adverse event (3); voluntary withdrawal (17); hyperphosphataemia (1); TSAT > 55% (2); other (1)) |
| Selective reporting (reporting bias) | Low risk | Key laboratory measures and adverse events were reported |
| Other bias | Unclear risk | Insufficient information to permit judgement |
Lemos 2013.
| Methods |
|
|
| Participants |
|
|
| Interventions | Treatment group
Control group
Co‐interventions
|
|
| Outcomes |
|
|
| Notes |
|
|
| Risk of bias | ||
| Bias | Authors' judgement | Support for judgement |
| Random sequence generation (selection bias) | Low risk | Randomisation was computer generated |
| Allocation concealment (selection bias) | Unclear risk | Insufficient information about allocation concealment to permit judgement |
| Blinding of participants and personnel (performance bias) All outcomes | High risk | Open label; knowledge of treatment allocation may have influenced patient management |
| Blinding of outcome assessment (detection bias) All outcomes | Low risk | The CACS images were scored by a single radiologist blinded to clinical and biochemical aspects of the patient. Blinding of outcome assessment for other outcomes was not reported. Outcome measures were laboratory measure, death and dialysis and were unlikely to be influenced by knowledge of treatment allocation |
| Incomplete outcome data (attrition bias) All outcomes | High risk | 12/38 allocated to sevelamer did not complete study (dialysis (7); death (2); no CT imaging (2); other (1)) 12/41 allocated to control did not complete study (dialysis (5); death (1); without CT (3); other (3)) |
| Selective reporting (reporting bias) | Low risk | Key death, vascular calcification, and laboratory outcomes were reported |
| Other bias | Low risk | The study appeared to be free of other sources of bias |
Liabeuf 2017.
| Methods |
|
|
| Participants |
|
|
| Interventions | Treatment group 1
Treatment group 2
Co‐interventions
|
|
| Outcomes |
|
|
| Notes |
|
|
| Risk of bias | ||
| Bias | Authors' judgement | Support for judgement |
| Random sequence generation (selection bias) | Low risk | Centralized randomisation was performed by the clinical research unit at Amiens University Hospital. A data manager configured an interactive web response system (running Ennov Clinical software V6.2; Ennov SA, Paris, France) to randomise patients using a minimization algorithm |
| Allocation concealment (selection bias) | Low risk | Interactive web response system |
| Blinding of participants and personnel (performance bias) All outcomes | Low risk | Double‐blinded |
| Blinding of outcome assessment (detection bias) All outcomes | Low risk | Blinding of outcome assessment was not reported. Outcome measures were unlikely to be influence by knowledge of treatment allocation as they were laboratory measures. Adverse events were unlikely to be influenced by knowledge of treatment allocation as participants and investigators were blinded |
| Incomplete outcome data (attrition bias) All outcomes | High risk | 8/39 participants allocated to sevelamer did not complete follow‐up (adverse event (4); patient request (4)) 6/39 participants allocated to placebo did not complete follow‐up (patient request (4); other (2)) |
| Selective reporting (reporting bias) | Low risk | All key laboratory measures and adverse events were reported |
| Other bias | Low risk | The study appeared to be free of other sources of bias |
Lin 2010.
| Methods |
|
|
| Participants |
|
|
| Interventions | Treatment group 1
Treatment group 2
Co‐interventions
|
|
| Outcomes |
|
|
| Notes |
|
|
| Risk of bias | ||
| Bias | Authors' judgement | Support for judgement |
| Random sequence generation (selection bias) | Unclear risk | Insufficient information about sequence generation to permit judgement |
| Allocation concealment (selection bias) | Unclear risk | Insufficient information about allocation concealment to permit judgement |
| Blinding of participants and personnel (performance bias) All outcomes | High risk | Open label; knowledge of treatment allocation may have influenced patient management |
| Blinding of outcome assessment (detection bias) All outcomes | Low risk | Blinding of outcome assessment was not reported. Outcome measures were laboratory measures and were unlikely to be influenced by knowledge of treatment allocation. Knowledge of treatment allocation may have influenced reporting of adverse events |
| Incomplete outcome data (attrition bias) All outcomes | High risk | 3/26 allocated to sevelamer did not complete follow‐up (tarry stool (1); upper GI bleeding (1); severe itch (1)) 6/26 allocated to calcium did not complete follow‐up (constipation (4); GI upset (1); nausea (1)) |
| Selective reporting (reporting bias) | Low risk | Key laboratory measures and adverse events were reported |
| Other bias | Low risk | The study appeared to be free of other sources of bias |
Lin 2014a.
| Methods |
|
|
| Participants |
|
|
| Interventions | Treatment group 1
Treatment group 2
Co‐interventions
|
|
| Outcomes |
|
|
| Notes |
|
|
| Risk of bias | ||
| Bias | Authors' judgement | Support for judgement |
| Random sequence generation (selection bias) | Unclear risk | The randomisation schedule was generated using a validated system that automates the random assignment of treatment groups to randomised numbers |
| Allocation concealment (selection bias) | Unclear risk | Insufficient information about allocation concealment to permit judgement |
| Blinding of participants and personnel (performance bias) All outcomes | High risk | Open label; knowledge of treatment allocation may have influenced patient management |
| Blinding of outcome assessment (detection bias) All outcomes | Low risk | Blinding of outcome assessment was not reported. Outcome measures were laboratory measures and death and were unlikely to be influenced by knowledge of treatment allocation. Knowledge of treatment allocation may have influenced reporting of adverse events |
| Incomplete outcome data (attrition bias) All outcomes | High risk | 13/36 participants allocated to sevelamer did not complete study (GI upset (8); sepsis (1); transplant (1); loss of follow‐up (1); consent withdrawal (1); gastric cancer (1)) 12/39 participants allocated to calcium carbonate did not complete study (GI upset (7); pneumonia (1); transplant (1); consent withdrawal (3)) |
| Selective reporting (reporting bias) | Low risk | Key death, adverse events, and laboratory measures were reported |
| Other bias | High risk | There was imbalance between study groups for serum phosphorus levels and ALP levels |
Liu 2006.
| Methods |
|
|
| Participants |
|
|
| Interventions | Treatment group 1
Treatment group 2
Co‐interventions
|
|
| Outcomes |
|
|
| Notes |
|
|
| Risk of bias | ||
| Bias | Authors' judgement | Support for judgement |
| Random sequence generation (selection bias) | Unclear risk | Insufficient information about sequence generation to permit judgement |
| Allocation concealment (selection bias) | Unclear risk | Insufficient information about allocation concealment to permit judgement |
| Blinding of participants and personnel (performance bias) All outcomes | High risk | Open label; knowledge of treatment allocation may have influenced patient management |
| Blinding of outcome assessment (detection bias) All outcomes | Low risk | Blinding of outcome assessment was not reported. Outcome measures were laboratory measures and death and were unlikely to be influenced by knowledge of treatment allocation. Knowledge of treatment allocation may have influenced reporting of adverse events |
| Incomplete outcome data (attrition bias) All outcomes | Low risk | 63/73 participants completed the study. The most common reason for discontinuation was withdrawal of consent. In the sevelamer hydrochloride group, four patients discontinued due to consent withdrawal, investigator judgment, or violation of the protocol. In calcium acetate group, six patients discontinued due to consent withdrawal or adverse event. Three patients who did not have post‐baseline efficacy data were excluded from the efficacy analysis. Therefore the intent‐to‐treat population comprised 70 patients: 37 in the sevelamer hydrochloride group and 33 in the calcium acetate group |
| Selective reporting (reporting bias) | Low risk | Key adverse events and laboratory measures were reported |
| Other bias | High risk | The doses of the control medication (calcium acetate) were lower than the intervention |
Locatelli 2013.
| Methods |
|
|
| Participants |
|
|
| Interventions | Treatment group 1
Treatment group 2
Co‐interventions
|
|
| Outcomes |
|
|
| Notes |
|
|
| Risk of bias | ||
| Bias | Authors' judgement | Support for judgement |
| Random sequence generation (selection bias) | Low risk | Randomisation was performed according to a computer‐generated central randomisation code, which was designed within countries to ensure that each site enrolled approximately equal numbers of patients in each treatment group |
| Allocation concealment (selection bias) | Unclear risk | Insufficient information about allocation concealment to permit judgement |
| Blinding of participants and personnel (performance bias) All outcomes | Low risk | Double blinded |
| Blinding of outcome assessment (detection bias) All outcomes | Low risk | Blinding of outcome assessment was not reported. Outcome measures were laboratory measures and death and were unlikely to be influenced by knowledge of treatment allocation. Knowledge of treatment allocation may have influenced reporting of adverse events |
| Incomplete outcome data (attrition bias) All outcomes | High risk | 139/510 participants allocated to colestilan withdrew from treatment (death (4); adverse events (36); withdrawn consent (49); high phosphate (70); low phosphate (4); investigator request (2); other (13); protocol violation (1)) 50/132 participants allocated to placebo withdrew from treatment death (2); adverse event (4); withdrawal consent (7); high phosphate (30); protocol violation (4); other (3)) |
| Selective reporting (reporting bias) | Low risk | Key death, adverse events and laboratory measures were reported |
| Other bias | Low risk | The study appeared to be free from other sources of bias |
Locatelli 2014.
| Methods |
|
|
| Participants |
|
|
| Interventions | Treatment group 1
Treatment group 2
Co‐interventions
|
|
| Outcomes |
|
|
| Notes |
|
|
| Risk of bias | ||
| Bias | Authors' judgement | Support for judgement |
| Random sequence generation (selection bias) | Low risk | Patients were randomised according to a centrally generated randomisation code |
| Allocation concealment (selection bias) | Unclear risk | Insufficient information about allocation concealment to permit judgement |
| Blinding of participants and personnel (performance bias) All outcomes | High risk | Open label; knowledge of treatment allocation may have influenced patient management |
| Blinding of outcome assessment (detection bias) All outcomes | Low risk | Blinding of outcome assessment was not reported. Outcome measures were laboratory measures and death and were unlikely to be influenced by knowledge of treatment allocation. Knowledge of treatment allocation may have influenced reporting of adverse events |
| Incomplete outcome data (attrition bias) All outcomes | High risk | 32/171 participants allocated to sevelamer withdrew from study (adverse events (10); death (1); consent withdrawn (5); protocol violation (3); high serum phosphate (1); randomised in error (3); other (9)) 60/165 participants allocated to colestilan withdrew from study (adverse events (28); death (2); consent withdrawn (16); protocol violation (3); high serum phosphate (8); other (3)) |
| Selective reporting (reporting bias) | Low risk | Key death, adverse events and laboratory measures were reported |
| Other bias | Low risk | Study did not appear to have other sources of bias |
Matsushima 2017.
| Methods |
|
|
| Participants |
|
|
| Interventions | Treatment group 1
Treatment group 2
Co‐interventions
|
|
| Outcomes |
|
|
| Notes |
|
|
| Risk of bias | ||
| Bias | Authors' judgement | Support for judgement |
| Random sequence generation (selection bias) | Unclear risk | Insufficient information about random sequence generation to permit judgement |
| Allocation concealment (selection bias) | Unclear risk | Insufficient information about allocation concealment to permit judgement |
| Blinding of participants and personnel (performance bias) All outcomes | Unclear risk | Insufficient information about blinding to permit judgement |
| Blinding of outcome assessment (detection bias) All outcomes | Low risk | Blinding of outcome assessment was not reported. Outcome measures were laboratory measures and were unlikely to be influenced by knowledge of treatment allocation. Knowledge of treatment allocation may have influenced reporting of adverse events |
| Incomplete outcome data (attrition bias) All outcomes | Unclear risk | Insufficient information about study attrition to permit judgement |
| Selective reporting (reporting bias) | Low risk | Key adverse events and laboratory measures were reported |
| Other bias | Unclear risk | Insufficient information to permit judgement |
Navarro‐Gonzalez 2011.
| Methods |
|
|
| Participants |
|
|
| Interventions | Treatment group 1
Treatment group 2
Co‐interventions
|
|
| Outcomes |
|
|
| Notes |
|
|
| Risk of bias | ||
| Bias | Authors' judgement | Support for judgement |
| Random sequence generation (selection bias) | Low risk | Randomisation was performed by a computer‐generated series of random numbers |
| Allocation concealment (selection bias) | Unclear risk | Insufficient information about allocation concealment to permit judgement |
| Blinding of participants and personnel (performance bias) All outcomes | High risk | Open label; knowledge of treatment assignment may have influenced patient management |
| Blinding of outcome assessment (detection bias) All outcomes | Low risk | All laboratory parameters were determined blinded to treatment allocation |
| Incomplete outcome data (attrition bias) All outcomes | Low risk | 3/33 participants allocated to sevelamer withdrew from study 3/32 participants allocated to calcium withdrew from study |
| Selective reporting (reporting bias) | High risk | Not all the review’s pre‐specified outcomes were recorded |
| Other bias | High risk | The dose of the comparator (calcium acetate) was lower than the dose of sevelamer at baseline |
NCT00542815.
| Methods |
|
|
| Participants |
|
|
| Interventions | Treatment group 1
Treatment group 2
Co‐interventions
|
|
| Outcomes |
|
|
| Notes |
|
|
| Risk of bias | ||
| Bias | Authors' judgement | Support for judgement |
| Random sequence generation (selection bias) | Unclear risk | Insufficient information about random sequence generation to permit judgement |
| Allocation concealment (selection bias) | Unclear risk | Insufficient information about allocation concealment to permit judgement |
| Blinding of participants and personnel (performance bias) All outcomes | High risk | Open label; knowledge of treatment allocation may have influenced patient management |
| Blinding of outcome assessment (detection bias) All outcomes | Low risk | Blinding of outcome assessment was not reported. Outcome measures were death and biochemical parameters and were unlikely to be influenced by knowledge of treatment allocation. Cardiovascular event reporting may have been influenced by knowledge of treatment allocation |
| Incomplete outcome data (attrition bias) All outcomes | High risk | 32/124 participants allocated to sevelamer did not complete study (adverse event (9); death (3); protocol violation (2); withdrawal by subject (8); other reasons (10)) 32/76 participants allocated to colestimide did not complete study (adverse events (6); death (7); lack of efficacy (2); physician decision (1); protocol violation (1); withdrawal (5); other reasons (10)) |
| Selective reporting (reporting bias) | Low risk | Review’s pre‐specified outcomes were recorded |
| Other bias | Unclear risk | Insufficient information to permit judgement |
NICOREN 2017.
| Methods |
|
|
| Participants |
|
|
| Interventions | Treatment group 1
Treatment group 2
Co‐interventions
|
|
| Outcomes |
|
|
| Notes |
|
|
| Risk of bias | ||
| Bias | Authors' judgement | Support for judgement |
| Random sequence generation (selection bias) | Unclear risk | Insufficient information about generation of the random sequence to permit judgement |
| Allocation concealment (selection bias) | Low risk | Randomised to treatment via an interactive system |
| Blinding of participants and personnel (performance bias) All outcomes | High risk | Open label; knowledge of treatment assignment may have influenced patient management |
| Blinding of outcome assessment (detection bias) All outcomes | Low risk | Blinding of outcome assessment was not reported. Outcome measures were death and biochemical parameters and were unlikely to be influenced by knowledge of treatment allocation. Adverse event reporting may have been influenced by knowledge of treatment allocation |
| Incomplete outcome data (attrition bias) All outcomes | High risk | 5/51 participants allocated to sevelamer withdrawn from study (death (1); transplant (1); gastro‐intestinal side‐effects (2); other (1)) 22/49 participants allocated to nicotinamide withdrawn from study (death (2); transplant (3); gastro‐intestinal side‐effects (7); thrombocytopaenia (4); non‐adherence (2); low serum phosphorus (1); other (3)) |
| Selective reporting (reporting bias) | Low risk | Review’s pre‐specified outcomes were recorded |
| Other bias | High risk | Due to technical and financial problems, the study was stopped early. This decision was taken by the steering committee |
Ohtake 2013.
| Methods |
|
|
| Participants |
|
|
| Interventions | Treatment group 1
Treatment group 2
Co‐interventions
|
|
| Outcomes |
|
|
| Notes |
|
|
| Risk of bias | ||
| Bias | Authors' judgement | Support for judgement |
| Random sequence generation (selection bias) | Low risk | Table of random numbers |
| Allocation concealment (selection bias) | Unclear risk | Insufficient information about allocation concealment to permit judgement |
| Blinding of participants and personnel (performance bias) All outcomes | High risk | Open label; knowledge of treatment assignment may have influenced patient management |
| Blinding of outcome assessment (detection bias) All outcomes | Low risk | CACSs blinded. Other outcome measures of death and laboratory measures were unlikely to be influenced by treatment assignment. Reporting of cardiovascular events and adverse events may have been influenced by treatment assignment |
| Incomplete outcome data (attrition bias) All outcomes | High risk | 7/26 assigned to lanthanum did not complete study (adverse events (7)) 3/26 assigned to calcium did not complete study (arrhythmia (2); death (1)) |
| Selective reporting (reporting bias) | Low risk | Review’s pre‐specified outcomes were recorded |
| Other bias | High risk | Imbalance in baseline characteristics and co‐intervention with vitamin D agents |
Pratt 2007.
| Methods |
|
|
| Participants |
|
|
| Interventions | Treatment group 1
Treatment group 2
Co‐interventions
|
|
| Outcomes |
|
|
| Notes |
|
|
| Risk of bias | ||
| Bias | Authors' judgement | Support for judgement |
| Random sequence generation (selection bias) | Unclear risk | Insufficient information about random sequence generation to permit judgement |
| Allocation concealment (selection bias) | Unclear risk | Insufficient information about allocation concealment to permit judgement |
| Blinding of participants and personnel (performance bias) All outcomes | High risk | Open label; knowledge of treatment assignment may have influenced patient management |
| Blinding of outcome assessment (detection bias) All outcomes | Low risk | Blinding of outcome assessment was not reported. Laboratory measures were unlikely to be influenced by treatment assignment. Reporting of adverse events may have been influenced by treatment assignment |
| Incomplete outcome data (attrition bias) All outcomes | Unclear risk | Insufficient information about study attrition to permit judgement |
| Selective reporting (reporting bias) | Low risk | Key laboratory measures and adverse events were reported |
| Other bias | Unclear risk | Insufficient information to permit judgement |
PREFECT 2014.
| Methods |
|
|
| Participants |
|
|
| Interventions | Treatment group 1
Treatment group 2
Co‐interventions
|
|
| Outcomes |
|
|
| Notes |
|
|
| Risk of bias | ||
| Bias | Authors' judgement | Support for judgement |
| Random sequence generation (selection bias) | Unclear risk | Treatment was assigned by a randomisation schedule |
| Allocation concealment (selection bias) | Low risk | Patients were assigned to treatment in the form of code‐break envelopes held at the investigational site |
| Blinding of participants and personnel (performance bias) All outcomes | Low risk | Double blinded |
| Blinding of outcome assessment (detection bias) All outcomes | Low risk | Blinding of outcome assessment was not reported. Other outcome measures of death and laboratory measures were unlikely to be influenced by treatment assignment. Reporting of cardiovascular events and adverse events may have been influenced by treatment assignment |
| Incomplete outcome data (attrition bias) All outcomes | High risk | 6/23 participants allocated to sevelamer were not included in analyses (protocol violation (1); death (1); non‐adherence (2); prohibited medication (1); low serum FGF23 (1)) 0/12 participants allocated to placebo were not included in the analyses |
| Selective reporting (reporting bias) | Low risk | Review’s pre‐specified outcomes were recorded |
| Other bias | High risk | Imbalance in baseline characteristics |
Qunibi 2011.
| Methods |
|
|
| Participants |
|
|
| Interventions | Treatment group 1
Treatment group 2
Co‐interventions
|
|
| Outcomes |
|
|
| Notes |
|
|
| Risk of bias | ||
| Bias | Authors' judgement | Support for judgement |
| Random sequence generation (selection bias) | Unclear risk | Insufficient information about random sequence generation to permit judgement |
| Allocation concealment (selection bias) | Unclear risk | Insufficient information about allocation concealment to permit judgement |
| Blinding of participants and personnel (performance bias) All outcomes | Low risk | Double blinded |
| Blinding of outcome assessment (detection bias) All outcomes | Low risk | Blinding of outcome assessment was not reported. Other outcome measures of death and laboratory measures were unlikely to be influenced by treatment assignment. Reporting of cardiovascular events and adverse events may have been influenced by treatment assignment |
| Incomplete outcome data (attrition bias) All outcomes | High risk | 18/46 participants allocated to calcium acetate did not complete study 44/64 participants allocated to placebo did not complete study |
| Selective reporting (reporting bias) | Low risk | Review’s pre‐specified outcomes were recorded |
| Other bias | High risk | Study was funded and authored by Fresenius |
Riccio 2018.
| Methods |
|
|
| Participants |
|
|
| Interventions | Treatment group 1
Treatment group 2
Co‐interventions
|
|
| Outcomes |
|
|
| Notes |
|
|
| Risk of bias | ||
| Bias | Authors' judgement | Support for judgement |
| Random sequence generation (selection bias) | Low risk | Computer generated |
| Allocation concealment (selection bias) | Low risk | Numbered sealed envelopes opened in sequence by administrative staff personnel not involved in patients care |
| Blinding of participants and personnel (performance bias) All outcomes | Low risk | Double‐blinded |
| Blinding of outcome assessment (detection bias) All outcomes | Low risk | Blinding of outcome assessment was not reported. Other outcome measures of death and laboratory measures were unlikely to be influenced by treatment assignment. Reporting of adverse events may have been influenced by treatment assignment |
| Incomplete outcome data (attrition bias) All outcomes | Low risk | 5/30 participants allocated to sevelamer did not complete study (withdrew consent (1); low phosphate (3); drug intolerance (1) 4/30 participants allocated to placebo did not complete study (withdrew consent (1); low phosphate (2); drug intolerance (1) |
| Selective reporting (reporting bias) | Low risk | Review’s pre‐specified outcomes were recorded |
| Other bias | Low risk | The study appeared to be free of other sources of bias |
Roxe 1989.
| Methods |
|
|
| Participants |
|
|
| Interventions | Treatment group 1
Treatment group 2
Co‐interventions
|
|
| Outcomes |
|
|
| Notes |
|
|
| Risk of bias | ||
| Bias | Authors' judgement | Support for judgement |
| Random sequence generation (selection bias) | Unclear risk | Insufficient information about random sequence generation to permit judgement |
| Allocation concealment (selection bias) | Unclear risk | Insufficient information about allocation concealment to permit judgement |
| Blinding of participants and personnel (performance bias) All outcomes | High risk | Open label; knowledge of treatment assignment may have influenced patient management |
| Blinding of outcome assessment (detection bias) All outcomes | Low risk | Blinding of outcome assessment was not reported. Laboratory measures were unlikely to be influenced by treatment assignment |
| Incomplete outcome data (attrition bias) All outcomes | High risk | 6/27 participants not included in analyses |
| Selective reporting (reporting bias) | High risk | Not all the review’s pre‐specified outcomes were recorded. Data were not available for the first period of treatment |
| Other bias | High risk | Statistical approach did not account for cross‐over study design. Baseline participant characteristics were not reported in sufficient detail to assess for balance between treatment groups |
Rudnicki 1994.
| Methods |
|
|
| Participants |
|
|
| Interventions | Treatment group
Control group
Co‐interventions
|
|
| Outcomes |
|
|
| Notes |
|
|
| Risk of bias | ||
| Bias | Authors' judgement | Support for judgement |
| Random sequence generation (selection bias) | Low risk | Computer‐generated list |
| Allocation concealment (selection bias) | Unclear risk | Insufficient information about allocation concealment to permit judgement |
| Blinding of participants and personnel (performance bias) All outcomes | Low risk | Double blinded |
| Blinding of outcome assessment (detection bias) All outcomes | Low risk | Blinding of outcome assessment was not reported. Laboratory measures were unlikely to be influenced by treatment assignment |
| Incomplete outcome data (attrition bias) All outcomes | Low risk | 2/20 randomised participants did not complete study |
| Selective reporting (reporting bias) | High risk | Not all the review’s pre‐specified outcomes were recorded |
| Other bias | High risk | Imbalance in baseline serum phosphorus |
Russo 2007.
| Methods |
|
|
| Participants |
|
|
| Interventions | Treatment group 1
Treatment group 2
Control group
Co‐interventions
|
|
| Outcomes |
|
|
| Notes |
|
|
| Risk of bias | ||
| Bias | Authors' judgement | Support for judgement |
| Random sequence generation (selection bias) | Unclear risk | Insufficient information about random sequence generation to permit judgement |
| Allocation concealment (selection bias) | Low risk | Randomised by co‐author not aware of clinical or baseline characteristics |
| Blinding of participants and personnel (performance bias) All outcomes | High risk | Open label; knowledge of treatment allocation may influence patient management |
| Blinding of outcome assessment (detection bias) All outcomes | Low risk | CT evaluation was carried out in an institution external to authors’ university. Both initial and final scans were analysed by radiologists who were unaware of both treatment allocation and previous CT reading. Laboratory measures were unlikely to be influenced by treatment assignment |
| Incomplete outcome data (attrition bias) All outcomes | Low risk | 3/30 participants allocated to sevelamer did not complete study (due to cost of drug) 2/30 participants allocated to calcium carbonate did not complete study (lost to follow‐up (2); informed consent (1)) 1/30 participants allocated to control did not complete study (MI (1) |
| Selective reporting (reporting bias) | High risk | Not all the review’s pre‐specified outcomes were recorded |
| Other bias | Low risk | The study appeared to be free of other sources of bias |
Sadek 2003.
| Methods |
|
|
| Participants |
|
|
| Interventions | Treatment group 1
Treatment group 2
Co‐interventions
|
|
| Outcomes |
|
|
| Notes |
|
|
| Risk of bias | ||
| Bias | Authors' judgement | Support for judgement |
| Random sequence generation (selection bias) | Unclear risk | Insufficient information about random sequence generation to permit judgement |
| Allocation concealment (selection bias) | Unclear risk | Insufficient information about allocation concealment to permit judgement |
| Blinding of participants and personnel (performance bias) All outcomes | High risk | Open label; knowledge of treatment allocation may have influenced patient management |
| Blinding of outcome assessment (detection bias) All outcomes | Low risk | Blinding of outcome assessment was not reported. Other outcome measures of death and laboratory measures were unlikely to be influenced by treatment assignment. Reporting of adverse events may have been influenced by treatment assignment |
| Incomplete outcome data (attrition bias) All outcomes | High risk | 6/21 participants allocated to sevelamer not included in analysis (intolerance (5); sudden death (1)) 5/21 participants allocated to calcium not included in analysis (transplant (1); deaths (3); stroke (1)) |
| Selective reporting (reporting bias) | Low risk | Review’s pre‐specified outcomes were recorded |
| Other bias | High risk | Imbalance in use of vitamin D agents as co‐interventions |
Saif 2007.
| Methods |
|
|
| Participants |
|
|
| Interventions | Treatment group 1
Treatment group 2
Co‐interventions
|
|
| Outcomes |
|
|
| Notes |
|
|
| Risk of bias | ||
| Bias | Authors' judgement | Support for judgement |
| Random sequence generation (selection bias) | Unclear risk | Insufficient information about random sequence generation to permit judgement |
| Allocation concealment (selection bias) | Unclear risk | Insufficient information about allocation concealment to permit judgement |
| Blinding of participants and personnel (performance bias) All outcomes | High risk | Open label; knowledge of treatment allocation may influence patient management |
| Blinding of outcome assessment (detection bias) All outcomes | Low risk | Blinding of outcome assessment was not reported. Laboratory measures unlikely to have been influenced by knowledge of treatment allocation |
| Incomplete outcome data (attrition bias) All outcomes | High risk | 23/64 participants not included in analysis |
| Selective reporting (reporting bias) | High risk | Not all the review’s pre‐specified outcomes were recorded |
| Other bias | Unclear risk | Insufficient information to permit judgement |
Seifert 2013.
| Methods |
|
|
| Participants |
|
|
| Interventions | Treatment group
Control group
Co‐interventions
|
|
| Outcomes |
|
|
| Notes |
|
|
| Risk of bias | ||
| Bias | Authors' judgement | Support for judgement |
| Random sequence generation (selection bias) | Low risk | The randomisation and double‐blind strategy was designed and maintained by research pharmacist and statistician |
| Allocation concealment (selection bias) | Unclear risk | Insufficient information about allocation concealment to permit judgement |
| Blinding of participants and personnel (performance bias) All outcomes | Low risk | Double blinded |
| Blinding of outcome assessment (detection bias) All outcomes | Low risk | Cardiac measurements blinded, otherwise outcome assessment blinding not reported. Laboratory measures unlikely to have been influenced by knowledge of treatment allocation |
| Incomplete outcome data (attrition bias) All outcomes | High risk | Three participants (assigned to lanthanum) withdrew from the study |
| Selective reporting (reporting bias) | Low risk | Review’s pre‐specified outcomes were recorded |
| Other bias | Low risk | The study appeared to be free of other sources of bias |
Sezer 2010.
| Methods |
|
|
| Participants |
|
|
| Interventions | Treatment group 1
Treatment group 2
Co‐interventions
|
|
| Outcomes |
|
|
| Notes |
|
|
| Risk of bias | ||
| Bias | Authors' judgement | Support for judgement |
| Random sequence generation (selection bias) | Unclear risk | Insufficient information about random sequence generation to permit judgement |
| Allocation concealment (selection bias) | Unclear risk | Insufficient information about allocation concealment to permit judgement |
| Blinding of participants and personnel (performance bias) All outcomes | Unclear risk | Insufficient information about blinding to permit judgement |
| Blinding of outcome assessment (detection bias) All outcomes | Low risk | Blinding of outcome assessment was not reported. Laboratory measures and death outcomes unlikely to have been influenced by knowledge of treatment allocation |
| Incomplete outcome data (attrition bias) All outcomes | Low risk | All participants evaluated for death |
| Selective reporting (reporting bias) | Low risk | Key laboratory measures and death were reported |
| Other bias | Unclear risk | Insufficient information to permit judgement as the study was published as a conference proceeding only |
Shahbazian 2011.
| Methods |
|
|
| Participants |
|
|
| Interventions | Treatment group 1
Treatment group 2
Co‐interventions
|
|
| Outcomes |
|
|
| Notes |
|
|
| Risk of bias | ||
| Bias | Authors' judgement | Support for judgement |
| Random sequence generation (selection bias) | Unclear risk | Insufficient information about random sequence generation to permit judgement |
| Allocation concealment (selection bias) | Unclear risk | Insufficient information about allocation concealment to permit judgement |
| Blinding of participants and personnel (performance bias) All outcomes | Low risk | Double blinded. Placebo and immediate release nicotinamide tablets (500 mg) were prepared by consultant pharmacist of the study at the industrial laboratory of pharmacy faculty of the university using nicotinamide powder purchased from Saveh Novin Kavosh Company |
| Blinding of outcome assessment (detection bias) All outcomes | Low risk | Blinding of outcome assessment was not reported. Laboratory measures unlikely to have been influenced by knowledge of treatment allocation. Adverse event reporting may have been influenced by awareness of treatment allocation, although patients unaware of treatment assignment |
| Incomplete outcome data (attrition bias) All outcomes | Low risk | 6/24 allocated to nicotinamide did not adhere to study follow‐up 5/24 participants assigned to placebo did not adhere to study follow‐up |
| Selective reporting (reporting bias) | Low risk | Key laboratory measures and adverse events were reported |
| Other bias | Low risk | The study appeared to be free of other sources of bias |
Shaheen 2004.
| Methods |
|
|
| Participants |
|
|
| Interventions | Treatment group 1
Treatment group 2
Co‐interventions
|
|
| Outcomes |
|
|
| Notes |
|
|
| Risk of bias | ||
| Bias | Authors' judgement | Support for judgement |
| Random sequence generation (selection bias) | Unclear risk | Insufficient information about random sequence generation to permit judgement |
| Allocation concealment (selection bias) | Unclear risk | Insufficient information about allocation concealment to permit judgement |
| Blinding of participants and personnel (performance bias) All outcomes | High risk | Open label; knowledge of treatment assignment may have influenced patient management |
| Blinding of outcome assessment (detection bias) All outcomes | Low risk | Blinding of outcome assessment was not reported. Laboratory measures unlikely to have been influenced by knowledge of treatment allocation |
| Incomplete outcome data (attrition bias) All outcomes | Low risk | 1/20 participants did not complete sevelamer treatment phase; 2/20 participants did not complete calcium phase |
| Selective reporting (reporting bias) | High risk | Not all the review’s pre‐specified outcomes were recorded |
| Other bias | High risk | The statistical analysis methods did not account for the cross‐over study design. Baseline characteristics for each study group were not provided for assessment of any imbalance |
Shibata 2007.
| Methods |
|
|
| Participants |
|
|
| Interventions | Treatment group 1
Treatment group 2
Cointerventions
|
|
| Outcomes |
|
|
| Notes |
|
|
| Risk of bias | ||
| Bias | Authors' judgement | Support for judgement |
| Random sequence generation (selection bias) | Unclear risk | Insufficient information about random sequence generation to permit judgement |
| Allocation concealment (selection bias) | Unclear risk | Insufficient information about allocation concealment to permit judgement |
| Blinding of participants and personnel (performance bias) All outcomes | High risk | Open label; knowledge of treatment assignment may have influenced patient management |
| Blinding of outcome assessment (detection bias) All outcomes | Low risk | Blinding of outcome assessment was not reported. Laboratory measures unlikely to have been influenced by knowledge of treatment allocation. Measurement of pulse wave velocity may have been influenced by knowledge of treatment allocation |
| Incomplete outcome data (attrition bias) All outcomes | Unclear risk | Insufficient information about study attrition to permit judgement |
| Selective reporting (reporting bias) | High risk | Not all the review’s pre‐specified outcomes were recorded |
| Other bias | Unclear risk | Insufficient information to permit judgement. The study was reported as a conference proceeding only |
Shigematsu 2008.
| Methods |
|
|
| Participants |
|
|
| Interventions | Treatment group 1
Treatment group 2
Co‐interventions
|
|
| Outcomes |
|
|
| Notes |
|
|
| Risk of bias | ||
| Bias | Authors' judgement | Support for judgement |
| Random sequence generation (selection bias) | Unclear risk | Insufficient information about random sequence generation to permit judgement |
| Allocation concealment (selection bias) | Unclear risk | Insufficient information about allocation concealment to permit judgement |
| Blinding of participants and personnel (performance bias) All outcomes | Low risk | Double blinded |
| Blinding of outcome assessment (detection bias) All outcomes | Low risk | Blinding of outcome assessment was not reported. Laboratory measures unlikely to have been influenced by knowledge of treatment allocation. Reporting of adverse events may have been influenced by knowledge of treatment allocation |
| Incomplete outcome data (attrition bias) All outcomes | Low risk | 14/256 patients were excluded from efficacy analysis as their treatment period was less than 2 weeks’ duration due either to discontinuation or to missing efficacy measurements at given study visits |
| Selective reporting (reporting bias) | Low risk | Key laboratory measures and adverse events were measured |
| Other bias | High risk | Imbalance in baseline characteristics |
SLO‐NIACIN 2013.
| Methods |
|
|
| Participants |
|
|
| Interventions | Treatment group
Control group
Co‐interventions
|
|
| Outcomes |
|
|
| Notes |
|
|
| Risk of bias | ||
| Bias | Authors' judgement | Support for judgement |
| Random sequence generation (selection bias) | Low risk | The computer generated randomisation sequence was also determined offsite by the company which had manufactured the placebo |
| Allocation concealment (selection bias) | Unclear risk | Insufficient information about allocation concealment to permit judgement |
| Blinding of participants and personnel (performance bias) All outcomes | Low risk | Double‐blind. The study medication was packed offsite in identical containers by the company which had manufactured the placebo |
| Blinding of outcome assessment (detection bias) All outcomes | Low risk | Results were analysed in blinded fashion by an offsite investigator who had no contact with the study patients |
| Incomplete outcome data (attrition bias) All outcomes | Low risk | 3/17 participants allocated to nicotinamide did not complete study follow‐up (death (1); side effects (2)) 1/15 participants allocated to placebo did not complete follow‐up (side effects (1)) |
| Selective reporting (reporting bias) | Low risk | Death, adverse events, and laboratory measures were reported |
| Other bias | High risk | The study analysis did not account for the cross‐over study design |
Song 2014.
| Methods |
|
|
| Participants |
|
|
| Interventions | Treatment group 1
Treatment group 2
Co‐interventions
|
|
| Outcomes |
|
|
| Notes |
|
|
| Risk of bias | ||
| Bias | Authors' judgement | Support for judgement |
| Random sequence generation (selection bias) | Low risk | Random number table |
| Allocation concealment (selection bias) | Unclear risk | Insufficient information about allocation concealment to permit judgement |
| Blinding of participants and personnel (performance bias) All outcomes | High risk | Single blinded. Knowledge of treatment allocation may have influenced patient management |
| Blinding of outcome assessment (detection bias) All outcomes | Low risk | Blinding of outcome assessment was not reported. Laboratory measures unlikely to have been influenced by knowledge of treatment allocation |
| Incomplete outcome data (attrition bias) All outcomes | Unclear risk | Insufficient information about study attrition to permit judgement |
| Selective reporting (reporting bias) | High risk | Not all the review’s pre‐specified outcomes were recorded |
| Other bias | Low risk | The study appeared to be free from other sources of bias |
Soriano 2013.
| Methods |
|
|
| Participants |
|
|
| Interventions | Treatment group 1
Treatment group 2
|
|
| Outcomes |
|
|
| Notes |
|
|
| Risk of bias | ||
| Bias | Authors' judgement | Support for judgement |
| Random sequence generation (selection bias) | Unclear risk | Insufficient information about random sequence generation to permit judgement |
| Allocation concealment (selection bias) | Unclear risk | Insufficient information about allocation concealment to permit judgement |
| Blinding of participants and personnel (performance bias) All outcomes | High risk | Open label; knowledge of treatment allocation may have influenced patient management |
| Blinding of outcome assessment (detection bias) All outcomes | Low risk | Blinding of outcome assessment was not reported. Laboratory measures unlikely to have been influenced by knowledge of treatment allocation |
| Incomplete outcome data (attrition bias) All outcomes | Unclear risk | Insufficient information about study attrition to permit judgement |
| Selective reporting (reporting bias) | High risk | Not all the review’s pre‐specified outcomes were recorded |
| Other bias | Low risk | The study appeared to be free of other sources of bias |
Spasovski 2006.
| Methods |
|
|
| Participants |
|
|
| Interventions | Treatment group 1
Treatment group 2
Co‐interventions
|
|
| Outcomes |
|
|
| Notes |
|
|
| Risk of bias | ||
| Bias | Authors' judgement | Support for judgement |
| Random sequence generation (selection bias) | Unclear risk | Insufficient information about random sequence generation to permit judgement |
| Allocation concealment (selection bias) | Unclear risk | Insufficient information about allocation concealment to permit judgement |
| Blinding of participants and personnel (performance bias) All outcomes | High risk | Open label; knowledge of treatment assignment may have influenced patient management |
| Blinding of outcome assessment (detection bias) All outcomes | Low risk | Blinding of outcome assessment was not reported. Laboratory measures unlikely to have been influenced by knowledge of treatment allocation |
| Incomplete outcome data (attrition bias) All outcomes | Low risk | 2/12 participants allocated to lanthanum did not complete follow‐up 2/12 participants allocated to calcium did not complete follow‐up |
| Selective reporting (reporting bias) | Low risk | Key laboratory measures and adverse events were reported |
| Other bias | High risk | Study funded and authored by Shire |
Spiegel 2007.
| Methods |
|
|
| Participants |
|
|
| Interventions | Treatment group 1
Treatment group 2
Co‐interventions
|
|
| Outcomes |
|
|
| Notes |
|
|
| Risk of bias | ||
| Bias | Authors' judgement | Support for judgement |
| Random sequence generation (selection bias) | Unclear risk | Insufficient information about random sequence generation to permit judgement |
| Allocation concealment (selection bias) | Unclear risk | Insufficient information about allocation concealment to permit judgement |
| Blinding of participants and personnel (performance bias) All outcomes | High risk | Open label; knowledge of treatment assignment may have influenced patient management |
| Blinding of outcome assessment (detection bias) All outcomes | Low risk | Blinding of outcome assessment was not reported. Laboratory measures unlikely to have been influenced by knowledge of treatment allocation |
| Incomplete outcome data (attrition bias) All outcomes | High risk | 3/20 participants allocated to magnesium carbonate did not complete study (diarrhoea (3)) 2/10 participants allocated to calcium did not complete study (adverse events (2)) |
| Selective reporting (reporting bias) | High risk | Not all the review’s pre‐specified outcomes were recorded |
| Other bias | Low risk | The study appeared to be free from other sources of bias |
Sprague 2009a.
| Methods |
|
|
| Participants |
|
|
| Interventions | Lanthanum group
Placebo group
Co‐interventions
|
|
| Outcomes |
|
|
| Notes |
|
|
| Risk of bias | ||
| Bias | Authors' judgement | Support for judgement |
| Random sequence generation (selection bias) | Unclear risk | Insufficient information about random sequence generation to permit judgement |
| Allocation concealment (selection bias) | Unclear risk | Insufficient information about allocation concealment to permit judgement |
| Blinding of participants and personnel (performance bias) All outcomes | Low risk | Double blinded |
| Blinding of outcome assessment (detection bias) All outcomes | Low risk | Blinding of outcome assessment was not reported. Laboratory measures unlikely to have been influenced by knowledge of treatment allocation. Reporting of adverse events may have been influenced by knowledge of treatment allocation |
| Incomplete outcome data (attrition bias) All outcomes | High risk | 37/80 participants allocated to lanthanum did not complete study follow‐up 13/43 participants allocated to placebo did not complete study follow‐up |
| Selective reporting (reporting bias) | Low risk | Data for the end of the first period of the cross‐over were not available. Key laboratory measures and adverse events were reported. |
| Other bias | High risk | Study funded and authored by Shire |
Takahara 2014.
| Methods |
|
|
| Participants |
|
|
| Interventions | Treatment group 1
Treatment group 2
Co‐interventions
|
|
| Outcomes |
|
|
| Notes |
|
|
| Risk of bias | ||
| Bias | Authors' judgement | Support for judgement |
| Random sequence generation (selection bias) | Unclear risk | Insufficient information about random sequence generation to permit judgement |
| Allocation concealment (selection bias) | Unclear risk | Insufficient information about allocation concealment to permit judgement |
| Blinding of participants and personnel (performance bias) All outcomes | Low risk | Double‐blinded. Placebo tablets were indistinguishable from lanthanum carbonate tablets |
| Blinding of outcome assessment (detection bias) All outcomes | Low risk | Blinding of outcome assessment was not reported. Laboratory measures and reporting of death unlikely to have been influenced by knowledge of treatment allocation. Reporting of adverse events may have been influenced by knowledge of treatment allocation |
| Incomplete outcome data (attrition bias) All outcomes | High risk | 12/88 participants allocated to lanthanum did not complete study follow‐up 12/55 participants allocated to placebo did not complete study follow‐up |
| Selective reporting (reporting bias) | Low risk | Key laboratory measures and death (all causes) reported |
| Other bias | High risk | Study funded and authored by Bayer Yakuhin |
Tielmans 1990.
| Methods |
|
|
| Participants |
|
|
| Interventions | Treatment group 1
Treatment group 2
Co‐interventions
|
|
| Outcomes |
|
|
| Notes |
|
|
| Risk of bias | ||
| Bias | Authors' judgement | Support for judgement |
| Random sequence generation (selection bias) | Unclear risk | Insufficient information about random sequence generation to permit judgement |
| Allocation concealment (selection bias) | Unclear risk | Insufficient information about allocation concealment to permit judgement |
| Blinding of participants and personnel (performance bias) All outcomes | Low risk | Double‐blinded |
| Blinding of outcome assessment (detection bias) All outcomes | Low risk | Blinding of outcome assessment was not reported. Laboratory measures unlikely to have been influenced by knowledge of treatment allocation. Reporting of adverse events may have been influenced by knowledge of treatment allocation |
| Incomplete outcome data (attrition bias) All outcomes | Unclear risk | Insufficient information about study attrition to permit judgement |
| Selective reporting (reporting bias) | Low risk | Key laboratory measures and adverse events reported |
| Other bias | Unclear risk | The statistical analysis did not account for the cross‐over study design |
Toida 2012.
| Methods |
|
|
| Participants |
|
|
| Interventions | Treatment group 1
Treatment group 2
Co‐interventions
|
|
| Outcomes |
|
|
| Notes |
|
|
| Risk of bias | ||
| Bias | Authors' judgement | Support for judgement |
| Random sequence generation (selection bias) | Low risk | The randomisation process was computer generated |
| Allocation concealment (selection bias) | Unclear risk | Insufficient information about allocation concealment to permit judgement |
| Blinding of participants and personnel (performance bias) All outcomes | High risk | The study was open‐label; knowledge of treatment allocation may have influenced patient management |
| Blinding of outcome assessment (detection bias) All outcomes | Low risk | Outcome assessors were blinded to treatment allocation |
| Incomplete outcome data (attrition bias) All outcomes | High risk | 5/25 participants allocated to lanthanum did not complete study follow‐up (adverse event (2); lung cancer (1); protocol violation (1) 1/25 participants allocated to calcium did not complete study follow‐up (early haemorrhage (1)) |
| Selective reporting (reporting bias) | Low risk | Key laboratory measures and adverse events reported. Data for the end of the first period of the cross‐over were not available |
| Other bias | Low risk | The study appeared to be free from other sources of bias |
Toussaint 2009.
| Methods |
|
|
| Participants |
|
|
| Interventions | Treatment group 1
Treatment group 2
Co‐interventions
|
|
| Outcomes |
|
|
| Notes |
|
|
| Risk of bias | ||
| Bias | Authors' judgement | Support for judgement |
| Random sequence generation (selection bias) | Low risk | Computer‐generated |
| Allocation concealment (selection bias) | Low risk | Sealed envelopes with dispensing of medications by pharmacist |
| Blinding of participants and personnel (performance bias) All outcomes | Low risk | Open label; knowledge of treatment assignment may have influenced patient management |
| Blinding of outcome assessment (detection bias) All outcomes | Low risk | Outcome assessment blinded |
| Incomplete outcome data (attrition bias) All outcomes | High risk | 8/22 participants allocated to lanthanum did not complete study follow‐up (adverse event (3); refusal to follow up (1); transplanted (1); death (1) 11/23 participants allocated to calcium did not complete study follow‐up (commenced sevelamer (1); refused follow up (3); transplanted (5); death (2)) |
| Selective reporting (reporting bias) | Low risk | Review’s pre‐specified outcomes were recorded |
| Other bias | Low risk | The study appeared to be free from other sources of bias |
Tzanakis 2014.
| Methods |
|
|
| Participants |
|
|
| Interventions | Treatment group 1
Treatment group 2
Co‐interventions
|
|
| Outcomes |
|
|
| Notes |
|
|
| Risk of bias | ||
| Bias | Authors' judgement | Support for judgement |
| Random sequence generation (selection bias) | Low risk | The patients’ randomisation in the two groups was performed by using a statistical table of random numbers |
| Allocation concealment (selection bias) | High risk | Four patients did not agree to consume magnesium carbonate but did agree to participate by taking their standard binder of calcium carbonate; we allocated these patients to the calcium carbonate group, whereas the remainder of the patients were randomly allocated with a ratio 1:1 to either the calcium carbonate (21 randomly assigned patients plus 4 = 25 patients) or to the magnesium carbonate (26) group |
| Blinding of participants and personnel (performance bias) All outcomes | Low risk | Double‐blinded |
| Blinding of outcome assessment (detection bias) All outcomes | Low risk | The radiographs were evaluated at the beginning and at the end of the study by the same experienced radiologist who was absolutely blind to any data regarding the treatment regimens. Other outcome measures (death and laboratory measures) were unlikely to be influenced by knowledge of treatment allocation |
| Incomplete outcome data (attrition bias) All outcomes | Low risk | 3/36 participants allocated to magnesium did not complete study follow‐up (non‐adherence (1); adverse events (2)) 4/36 participants allocated to calcium did not complete study follow‐up (transplant (2); death due to pneumonia (1); stroke (1)) |
| Selective reporting (reporting bias) | Low risk | Review’s pre‐specified outcomes were recorded |
| Other bias | Low risk | The study appeared to be free from other sources of bias |
Vlassara 2012.
| Methods |
|
|
| Participants |
|
|
| Interventions | Treatment group 1
Treatment group 2
Co‐interventions
|
|
| Outcomes |
|
|
| Notes |
|
|
| Risk of bias | ||
| Bias | Authors' judgement | Support for judgement |
| Random sequence generation (selection bias) | Unclear risk | Insufficient information about random sequence generation to permit judgement |
| Allocation concealment (selection bias) | Unclear risk | Insufficient information about allocation concealment to permit judgement |
| Blinding of participants and personnel (performance bias) All outcomes | High risk | Single blinded. Knowledge of treatment allocation may have influenced patient management |
| Blinding of outcome assessment (detection bias) All outcomes | Low risk | Laboratory personnel were blinded |
| Incomplete outcome data (attrition bias) All outcomes | High risk | 13/57 participants allocated to sevelamer did not complete study follow‐up 13/60 participants allocated to calcium did not complete follow‐up |
| Selective reporting (reporting bias) | Low risk | Key laboratory measures and adverse events were reported |
| Other bias | Low risk | The study appeared to be free from other sources of bias |
Wada 2014.
| Methods |
|
|
| Participants |
|
|
| Interventions | Treatment group 1
Treatment group 2
Co‐interventions
|
|
| Outcomes |
|
|
| Notes |
|
|
| Risk of bias | ||
| Bias | Authors' judgement | Support for judgement |
| Random sequence generation (selection bias) | Unclear risk | Insufficient information about random sequence generation to permit judgement |
| Allocation concealment (selection bias) | Unclear risk | Insufficient information about allocation concealment to permit judgement |
| Blinding of participants and personnel (performance bias) All outcomes | High risk | Open label; knowledge of treatment allocation may have influenced patient management |
| Blinding of outcome assessment (detection bias) All outcomes | Low risk | Blinding of outcome assessment was not reported. Laboratory measures unlikely to have been influenced by knowledge of treatment allocation. Reporting of adverse events may have been influenced by knowledge of treatment allocation |
| Incomplete outcome data (attrition bias) All outcomes | Low risk | 1/22 participant allocated to lanthanum did not complete study 1/22 participant allocated to calcium did not complete study |
| Selective reporting (reporting bias) | Low risk | Key laboratory measures, vascular calcification, and death events were reported |
| Other bias | Low risk | The study appeared to be free from other sources of bias |
Wang 2015b.
| Methods |
|
|
| Participants |
|
|
| Interventions | Treatment group
Control group
Co‐interventions
|
|
| Outcomes |
|
|
| Notes |
|
|
| Risk of bias | ||
| Bias | Authors' judgement | Support for judgement |
| Random sequence generation (selection bias) | Unclear risk | Insufficient information about random sequence generation to permit judgement |
| Allocation concealment (selection bias) | Unclear risk | Insufficient information about allocation concealment to permit judgement |
| Blinding of participants and personnel (performance bias) All outcomes | High risk | Open label; knowledge of treatment allocation may have influenced patient management |
| Blinding of outcome assessment (detection bias) All outcomes | Low risk | Two experienced and blinded radiologists reviewed and scored the images for vascular calcification, and the two scores were averaged. Laboratory measures unlikely to have been influenced by knowledge of treatment allocation |
| Incomplete outcome data (attrition bias) All outcomes | Low risk | 1/27 participants allocated to lanthanum carbonate withdrew from the study due to adverse events |
| Selective reporting (reporting bias) | High risk | Not all the review’s pre‐specified outcomes were recorded |
| Other bias | Low risk | The study appeared to be free from other sources of bias |
Yokoyama 2014.
| Methods |
|
|
| Participants |
|
|
| Interventions | Treatment group
Control group
Co‐interventions
|
|
| Outcomes |
|
|
| Notes |
|
|
| Risk of bias | ||
| Bias | Authors' judgement | Support for judgement |
| Random sequence generation (selection bias) | Unclear risk | Insufficient information about random sequence generation to permit judgement |
| Allocation concealment (selection bias) | Unclear risk | Insufficient information about allocation concealment to permit judgement |
| Blinding of participants and personnel (performance bias) All outcomes | Low risk | Double blinded. The investigational products, JTT‐751 tablets containing 250 mg JTT‐751 as an anhydride and placebo tablets, were indistinguishable in appearance |
| Blinding of outcome assessment (detection bias) All outcomes | Low risk | Blinding of outcome assessment was not reported. Laboratory measures unlikely to have been influenced by knowledge of treatment allocation. Adverse event reporting may have been influenced by knowledge of treatment assignment |
| Incomplete outcome data (attrition bias) All outcomes | High risk | 14/60 participants allocated to iron did not complete study (adverse events (5); worsening of underlying disease (1); phosphate low (1); patient request (4); ineligible patient (2); investigator decision (1)) 7/30 participants allocated to placebo did not complete study (adverse event (1); worsening of underlying disease (1); patient request (4); investigator decision (1)) |
| Selective reporting (reporting bias) | Low risk | Key laboratory measures and adverse events were reported |
| Other bias | Unclear risk | The study appeared to be free from other sources of bias. The baseline characteristics were not reported for each study arm to enable assessment for any imbalance |
Yokoyama 2014a.
| Methods |
|
|
| Participants |
|
|
| Interventions | Treatment group 1
Treatment group 2
Cointerventions
|
|
| Outcomes |
|
|
| Notes |
|
|
| Risk of bias | ||
| Bias | Authors' judgement | Support for judgement |
| Random sequence generation (selection bias) | Unclear risk | Insufficient information about random sequence generation to permit judgement |
| Allocation concealment (selection bias) | Unclear risk | Insufficient information about allocation concealment to permit judgement |
| Blinding of participants and personnel (performance bias) All outcomes | High risk | Open label; knowledge of treatment allocation may have influenced patient management |
| Blinding of outcome assessment (detection bias) All outcomes | Low risk | Reporting of blinding of outcomes not provided in sufficient detail to permit judgement. Laboratory measures and death outcomes unlikely to have been influenced by knowledge of treatment allocation. Adverse event reporting may have been influenced by knowledge of treatment assignment |
| Incomplete outcome data (attrition bias) All outcomes | High risk | 17/114 participants allocated to sevelamer did not complete study follow‐up (adverse events (3); high phosphate (1); patient request (9); investigator decision (2)) 14/116 participants allocated to iron did not complete follow‐up (adverse events (6); patient request (6); ineligible patients (2)) |
| Selective reporting (reporting bias) | Low risk | Key laboratory measures, adverse events and death (all causes) events reported |
| Other bias | Low risk | The study appeared to be free from other sources of bias |
Young 2009a.
| Methods |
|
|
| Participants |
|
|
| Interventions | Treatment group 1
Treatment group 2
Co‐interventions
|
|
| Outcomes |
|
|
| Notes |
|
|
| Risk of bias | ||
| Bias | Authors' judgement | Support for judgement |
| Random sequence generation (selection bias) | Unclear risk | Insufficient information about random sequence generation to permit judgement |
| Allocation concealment (selection bias) | Unclear risk | The research pharmacist who prepared the study medication and placebo capsules also performed patient randomisation |
| Blinding of participants and personnel (performance bias) All outcomes | Low risk | Double blinded. Niacinamide (250 mg per capsule) and placebo were packaged as identically appearing capsules |
| Blinding of outcome assessment (detection bias) All outcomes | Low risk | Reporting of blinding of outcomes not provided in sufficient detail to permit judgement. Laboratory measures unlikely to have been influenced by knowledge of treatment allocation |
| Incomplete outcome data (attrition bias) All outcomes | Low risk | 1/8 participants allocated to niacinamide did not complete study follow‐up 2/9 participants allocated to placebo did not complete study follow‐up |
| Selective reporting (reporting bias) | High risk | Not all the review’s pre‐specified outcomes were recorded |
| Other bias | High risk | Imbalance in baseline biochemical characteristics |
Zhao 2014.
| Methods |
|
|
| Participants |
|
|
| Interventions | Treatment group 1
Treatment group 2
|
|
| Outcomes |
|
|
| Notes |
|
|
| Risk of bias | ||
| Bias | Authors' judgement | Support for judgement |
| Random sequence generation (selection bias) | Unclear risk | Insufficient information about random sequence generation to permit judgement |
| Allocation concealment (selection bias) | Unclear risk | Insufficient information about allocation concealment to permit judgement |
| Blinding of participants and personnel (performance bias) All outcomes | High risk | Open label; knowledge of treatment assignment may influence patient management |
| Blinding of outcome assessment (detection bias) All outcomes | Low risk | Reporting of blinding of outcomes not provided in sufficient detail to permit judgement. Laboratory measures unlikely to be influenced by knowledge of treatment assignment |
| Incomplete outcome data (attrition bias) All outcomes | Low risk | 4/34 participants allocated to sevelamer did not complete study follow‐up 4/34 participants allocated to calcium did not complete study follow‐up |
| Selective reporting (reporting bias) | Low risk | Key laboratory and adverse events measures were reported |
| Other bias | Low risk | The study appeared to be free of other sources of bias |
Zwiech 2011.
| Methods |
|
|
| Participants |
|
|
| Interventions | Treatment group 1
Treatment group 2
|
|
| Outcomes |
|
|
| Notes |
|
|
| Risk of bias | ||
| Bias | Authors' judgement | Support for judgement |
| Random sequence generation (selection bias) | Unclear risk | Insufficient information about random sequence generation to permit judgement |
| Allocation concealment (selection bias) | Unclear risk | Insufficient information about allocation concealment to permit judgement |
| Blinding of participants and personnel (performance bias) All outcomes | High risk | Open label; knowledge of treatment assignment may influence patient management |
| Blinding of outcome assessment (detection bias) All outcomes | Low risk | Reporting of blinding of outcomes not provided in sufficient detail to permit judgement. Laboratory measures unlikely to be influenced by knowledge of treatment assignment |
| Incomplete outcome data (attrition bias) All outcomes | Unclear risk | Not described in sufficient detail to permit judgement |
| Selective reporting (reporting bias) | High risk | Important clinical outcomes not available |
| Other bias | Unclear risk | Insufficient information to permit judgement |
AKI ‐ acute kidney injury; ALP ‐ alkaline phosphatase; ALT ‐ alanine aminotransferase; APD ‐ automated peritoneal dialysis; ASP ‐ aspartate aminotransferase; BMI ‐ body mass index; BP ‐ blood pressure; ESA ‐ erythropoiesis‐stimulating agent; C x P ‐ calcium by phosphorous; CACS ‐ coronary artery calcification score; CAPD ‐ continuous ambulatory peritoneal dialysis; CKD ‐ chronic kidney disease; CrCl ‐ creatinine clearance; CRP ‐ C‐reactive protein; CT ‐ computed tomography; DM ‐ diabetes mellitus; ECG ‐ electrocardiograph; eGFR ‐ estimated glomerular filtration rate; FGF‐ fibroblast growth factor; GI ‐ gastrointestinal; Hb ‐ haemoglobin; HbA1c ‐ haemoglobin A1c (glycated); HCT ‐ haematocrit; HD ‐ haemodialysis; HIV ‐ human immunodeficiency virus; iPTH ‐ intact parathyroid hormone; IV ‐ intravenous; LDL ‐ low‐density lipoprotein; MDRD ‐ Modification of Diet in Renal Disease; MI ‐ myocardial infarction; NYHA ‐ New York Heart Association; PD ‐ peritoneal dialysis; PTH ‐ parathyroid hormone; RCT ‐ randomised controlled trial; SD ‐ standard deviation; TNF ‐ tumour necrosis factor; TSAT ‐ transferrin saturation; URR ‐ urea reduction ratio
Characteristics of excluded studies [ordered by study ID]
| Study | Reason for exclusion |
|---|---|
| Abraham 2012a | Treatment duration/study follow up was less than 8 weeks |
| Ahmadi 2012 | Treatment duration/study follow up was less than 8 weeks |
| Akizawa 2014 | Treatment duration/study follow up was less than 8 weeks |
| Akizawa 2014b | Treatment duration/study follow up was less than 8 weeks |
| Al‐Baaj 2005 | Treatment duration/study follow up was less than 8 weeks |
| Babarykin 2004 | Wrong intervention: calcium‐enriched bread was used as treatment (not pharmacological phosphate binder) |
| Bigi 2003 | Wrong intervention: evaluating the effects of cheto‐analogues on calcium‐phosphate metabolism |
| Bleskestad 2012 | Treatment duration/study follow up was less than 8 weeks |
| Block 2013 | Treatment duration/study follow up was less than 8 weeks |
| Borrego 2000 | Study design: not clearly stated as randomised allocation to treatment |
| Chertow 1997 | Treatment duration/study follow up was less than 8 weeks |
| Chiang 2005 | Treatment duration/study follow up was less than 8 weeks |
| Chiang 2007 | Treatment duration/study follow up was less than 8 weeks |
| Chow 2007 | Wrong intervention: comparing two different dose approaches to sevelamer treatment |
| d'Almeida Filho 2000 | Treatment duration/study follow up was less than 8 weeks |
| Dwyer 2013 | Treatment duration/study follow up was less than 8 weeks |
| El Borolossy 2016 | Wrong population: study evaluating therapy in children |
| Emmett 1991 | Treatment duration/study follow up was less than 8 weeks |
| Fabrizi 1996 | Wrong intervention: evaluating different dialysate calcium levels |
| Fan 2009 | Treatment duration/study follow up was less than 8 weeks |
| Finn 2004 | Treatment duration/study follow up was less than 8 weeks |
| Fischer 2006 | Wrong intervention: comparing two different dose approaches to sevelamer treatment |
| FORESEE 2008 | Wrong intervention: not comparing two different phosphate binders |
| Friedrich 2006 | Treatment duration/study follow up was less than 8 weeks |
| Fukagawa 2014 | Treatment duration/study follow up was less than 8 weeks |
| Hertel 2015 | Treatment duration/study follow up was less than 8 weeks |
| Hill 2013 | Treatment duration/study follow up was less than 8 weeks |
| How 2011 | Wrong intervention: valuating effect of lanthanum carbonate on oral absorption of ciprofloxacin. Participants were randomised to ciprofloxacin or ciprofloxacin plus lanthanum carbonate. |
| Ibrahim 2013 | Treatment duration/study follow up was less than 8 weeks |
| Isakova 2011 | Treatment duration/study follow up was less than 8 weeks |
| Ittel 1991 | Wrong intervention: comparing two different formulations of calcium carbonate |
| Joy 1999 | Treatment duration/study follow up was less than 8 weeks |
| Joy 2003 | Treatment duration/study follow up was less than 8 weeks |
| Kalil 2012 | Wrong intervention: evaluating lanthanum carbonate versus non‐lanthanum carbonate containing phosphate binders (but comparator intervention not specified) |
| Koiwa 2005 | Treatment duration/study follow up was less than 8 weeks |
| Koiwa 2005a | Treatment duration/study follow up was less than 8 weeks |
| Koiwa 2017a | Treatment duration/study follow up was less than 8 weeks |
| Koontz 2012 | Wrong intervention: comparing lanthanum with non‐lanthanum binders. |
| Kurihara 2005 | Treatment duration/study follow up was less than 8 weeks |
| Lee 2013b | Wrong intervention: comparing calcitriol versus calcitriol with calcium carbonate |
| Locatelli 2010a | Treatment duration/study follow up was less than 8 weeks |
| Mai 1989 | Treatment duration/study follow up was less than 8 weeks |
| Mak 1985 | Study evaluating therapy in children |
| Matuszkiewicz 2004 | Wrong intervention: participants were either randomised to salmon calcitonin or control. Non‐randomised intervention included phosphate binders |
| McIntyre 2009 | Treatment duration/study follow up was less than 8 weeks |
| Messana 1999 | Treatment duration/study follow up was less than 8 weeks |
| Moustafa 2014 | Treatment duration/study follow up was less than 8 weeks |
| Mouzo 2004 | Wrong intervention: participants received sevelamer at different doses based on meal size. Administration was randomly allocated to occur on dialysis or away from dialysis. Treatment duration/study follow up was less than 8 weeks. |
| NCT00018135 | Treatment duration/study follow up was less than 8 weeks |
| NCT00364000 | Study was abandoned due to limited financial resources. Study first posted on www.ClinicalTrials.gov on August 15, 2006. Last update posted: December 22, 2017 |
| NCT00436683 | This was a commercially sponsored study. The sponsor, Ineos, decided to close its medical division before the study could be completed and it was therefore abandoned. The data were owned by the company and were never made available for publication |
| NCT00660530 | Wrong intervention: comparing different formulations of lanthanum carbonate |
| NCT00745589 | Wrong intervention: comparing different doses of sevelamer hydrochloride. |
| NCT01427907 | Treatment duration/study follow up was less than 8 weeks |
| NCT01748396 | Wrong intervention: participants were randomised to calcitriol with or without calcium carbonate |
| NCT02027662 | Wrong intervention: treatment duration/study follow up was less than 8 weeks |
| NCT02492620 | Wrong intervention: comparing ferric citrate versus non‐ferric citrate binder |
| NCT02684643 | Wrong intervention: comparing two different individualised treatment plans for phosphate lowering |
| NCT02688764 | Wrong intervention: comparing nicotinamide with usual phosphate binder |
| NCT03163576 | Wrong intervention: comparing nicotinamide with usual phosphate binder |
| NCT03305471 | Treatment duration/study follow up was less than 8 weeks |
| Nishi 2005 | Wrong intervention: participants were randomised to oral vitamin D sterol, calcitriol, alfacalcidol, with or without calcium carbonate |
| Oliveira 2010 | Treatment duration/study follow up was less than 8 weeks |
| OPTIMA 2008 | Wrong intervention: participants were randomly allocated to receive cinacalcet or standard care in an algorithm which included vitamin D therapy |
| Ouellet 2010 | Wrong intervention: participants were randomly allocated to either sevelamer and calcium carbonate taken together or separately |
| Pai 2008a | Treatment duration/study follow up was less than 8 weeks |
| Pflanz 1994 | Treatment duration/study follow up was less than 8 weeks |
| Phelps 2002 | Wrong intervention: participants were randomly allocated to higher and lower dose of calcium acetate |
| Phelps 2014 | Treatment duration/study follow up was less than 8 weeks |
| Przedlacki 2005 | Wrong intervention: evaluating calcitriol versus placebo |
| Ring 1993 | Treatment duration/study follow up was less than 8 weeks |
| Rudnicki 1993 | Wrong intervention: participants assigned to oral elemental calcium supplementation or placebo (calcium not administered as phosphate binder) |
| Ruff 2008 | Wrong intervention: pharmacokinetic study of interaction between sevelamer and warfarin |
| Salusky 1991 | Study evaluating therapy in children |
| Salusky 2005 | Study evaluating therapy in children |
| Scaria 2009 | Treatment duration/study follow up was less than 8 weeks |
| Schaefer 1990 | Wrong intervention: treatment with calcium acetate and calcitriol |
| Schaefer 1991 | Treatment duration/study follow up was less than 8 weeks |
| Sechet 1998 | Treatment duration/study follow up was less than 8 weeks |
| Sechet 1999 | Wrong intervention: participants treated with omeprazole and calcium carbonate |
| Seferi 2012 | Treatment duration/study follow up was less than 8 weeks |
| Shigematsu 2001 | Wrong intervention: participants treated with combination therapy (vitamin D plus calcium) versus vitamin D therapy alone |
| Shigematsu 2008a | Treatment duration/study follow up was less than 8 weeks |
| Shimoda 1996 | Wrong intervention: participants randomly allocated to niceritrol (vitamin D analogue) |
| Sigrist 2013 | Wrong intervention: participants randomly allocated to different dietary phosphate content |
| SPD405‐307 2004 | Wrong intervention: participants were not randomised to two different specific phosphate binders. Participants were randomly allocated to lanthanum carbonate versus standard therapy (calcium/aluminium salts or sevelamer) |
| Sprague 2009b | Treatment duration/study follow up was less than 8 weeks |
| SUMMER 2011 | Nested cross‐sectional analyses within the "Sevelamer hydrochloride and ultrasound‐measured femoral and carotid intima media thickness progression in end‐stage renal disease (SUMMER) clinical trial". The primary report of the SUMMER study not identified |
| Tzanakis 2008 | Protocol violation: some patients (4) elected to continue their specific phosphate binder and were allocated to that treatment group rather than random allocation |
| Tzanno‐Martins 2014 | Wrong intervention: comparing two different tablet forms of sevelamer |
| Umanath 2013 | Wrong intervention: study did not compare two different specific phosphate binders |
| van den Bergh 1994 | Treatment duration/study follow up was less than 8 weeks |
| Vemuri 2006 | Interim analysis of a subgroup of participants within a previous RCT of lanthanum versus previous phosphate binder therapy |
| Wei 2014 | Wrong intervention: participants randomised to calcitonin (not a phosphate binder) and calcium carbonate versus lanthanum carbonate |
| Wesseling 2004 | Study evaluating therapy in children |
| Wuthrich 2013 | Treatment duration/study follow up was less than 8 weeks |
| Xu 2013 | Treatment duration/study follow up was less than 8 weeks |
| Yang 2002 | Treatment duration/study follow up was less than 8 weeks |
| Yokoyama 2012 | Treatment duration/study follow up was less than 8 weeks |
Characteristics of studies awaiting assessment [ordered by study ID]
NCT00317694.
| Methods | Study design: parallel RCT Time‐frame: March 2006 to June 2007 Follow‐up: not reported |
| Participants | Country: USA and UK Setting: multicentre Inclusion criteria: male or female subjects on active HD, aged 18 years or over; on a stable HD regimen (3 times/wk) for at least 3 months and be unlikely to change their dialysis prescription during the study period; on a stable dose of a phosphate binder for at least 1 month prior to screening; willing to abstain from taking any phosphate binder or oral magnesium, aluminium or iron‐containing products and preparations, other than the study medication; willing to avoid any intentional changes in diet such as fasting, dieting or overeating; willing to maintain their usual type and dose of Vitamin D supplementation. Exclusion criteria: participation in any other clinical study using an investigational product or device within the previous 4 months; significant history of alcohol, drug or solvent abuse in the opinion of the investigator; any disease or condition, physical or psychological, which in the opinion of the investigator would compromise the safety of the subject or increase the likelihood of the subject being withdrawn; clinically significant laboratory findings (for this subject population) in the opinion of the investigator; any malignancy requiring treatment within 5 years of screening with the exception of basal cell carcinoma and Bowen's disease; history of a motility disorder of the intestines, including, but not limited to, gastroparesis, ileus, pseudo‐obstruction, megacolon, or mechanical obstruction; significant illness in the 4 weeks before screening; taking medication prescribed for seizures; history of haemochromatosis; history of high serum ferritin concentration of ≥ 1000ng/mL (excluding transient, treatment‐induced ferritin elevation); history of dysphagia or swallowing disorders that might limit the subject's ability to swallow study medication in the opinion of the investigator; female subjects who are lactating or pregnant; women of childbearing potential (pre‐menopausal and not surgically sterilised) unless they are using a reliable contraceptive method, that is, barrier methods, hormones or intrauterine device; current Hb concentration of < 10.00 g/dL; allergy to the investigational product or its constituents. Number randomised: 111 |
| Interventions | Treatment group 1
Treatment group 2
None reported |
| Outcomes |
|
| Notes | Study start date: March 2006 Primary completion date: June 2007 Last update posted to www.ClinicalTrials.gov: August 10, 2009. A search of the literature has not identified any study results. Study results have not been posted on www.ClinicalTrials.gov. Principal investigator: Simon Roe, Nottingham Renal and Transplant unit, Nottingham City Hospital. Funding sources: Ineos Healthcare Limited. Principal investigator was contacted by email (10 April 2018) to request an update on the study status and results. No reply was received. As the study was completed nearly 10 years ago, it is unlikely the results will be published. |
NCT00560300.
| Methods | Study design: factorial RCT Time‐frame: November 2000 to November 2006 Follow‐up: 8 months |
| Participants | Country: not reported Setting: not reported Inclusion criteria: age 2 to 21 years; stable ESKD treated with continuous cycling peritoneal dialysis; biochemical evidence of secondary hyperparathyroidism (PTH>400 pg/mL) with bone biopsy evidence of high turnover bone disease. Exclusion criteria: history of parathyroidectomy; growth hormone; prednisone, or other immunosuppressant medication within the past year; recent history of medication non‐compliance. |
| Interventions | Treatment group 1
Treatment group 2
Treatment group 3
Treatment group 4
Cointerventions: none |
| Outcomes |
|
| Notes | Study start date: November 2000 Study completion date: November 2006 Principal Investigator: Isidro Salusky, University of California Los Angeles Last update posted to www.ClinicalTrials.gov: January 2010 Funding sources: National Institute of Diabetes and Digestive and Kidney Diseases (NIDDK) Principal Investigator was contacted by email (10 April 2018) to request an update on the study status and results. No reply was received. As the study was completed >10 years ago, it is unlikely the results will be published. |
NCT01968759.
| Methods | Study design: cross‐over RCT Time‐frame: October 2013 to October 2015 Follow‐up: 3 months |
| Participants | Country: Italy Setting: multicentre Inclusion criteria: age > 18 years; eGFR (GFR) by simplified MDRD formula > 15 mL/min/1.73m2; 24‐h urinary protein excretion rate ≥ 0.5 g/24hour; no concomitant treatment with phosphate binders; written informed consent. Exclusion criteria: serum phosphate level < 2.5 or > 5.5 mg/dL; patients with serum PTH levels >250 pg/mL without stable vitamin D (calcitriol or paricalcitol) or calcimimetic therapy from at least three months; serum calcium level < 7.5 or >10.5 mg/dL; history of congestive heart failure, MI, cerebrovascular accident within the last 6 months; cancer and any severe systemic disease or clinical condition that may jeopardize data interpretation or completion of the study; presence of, or predisposition to, intestinal or ileus obstruction or severe GI motility disorder (like severe constipation); previous major GI surgery; previous kidney transplantation; previous parathyroidectomy; concomitant treatment with antacid and phosphate binders with aluminium, magnesium, calcium or lanthanum; pregnancy or breastfeeding; childbearing potential without reliable contraceptive methods during the whole study period; participation in any clinical study using an investigational product or device during the 30 days preceding the first protocol visit; alcohol or drug (excluding tobacco) abuse; inability to comply with the study procedures during the whole study period, legal incapacity. |
| Interventions | Treatment group 1
Treatment group 2
Co‐interventions
|
| Outcomes |
|
| Notes | Study start date: October 2013 Study completion date: October 2015 Principal Investigator: not reported. Last update posted to www.ClinicalTrials.gov: October 2015 Funding sources: Mario Negri Institute for Pharmacological Research No results posted. Unable to contact Principal Investigator. |
Characteristics of ongoing studies [ordered by study ID]
COMBINE 2014.
| Trial name or title | The COMBINE Study: the CKD Optimal Management With BInders and NicotinamidE |
| Methods | Study design: parallel RCT Time frame: March 2015 to June 2018 follow‐up: 12 months |
| Participants | Country: USA Setting: 5 centres Inclusion criteria
Exclusion Criteria:
|
| Interventions | Treatment group 1
Treatment group 2
Treatment group 3
Treatment group 4
|
| Outcomes | Primary outcomes
Secondary:
|
| Starting date | March 2015 (estimated completion date June 2018) |
| Contact information | Principal investigator: Jennifer Gassman, Data Coordinating centre, Cleveland Clinic. Email gassmaj@ccf.org |
| Notes | Funding sources: National Institute of Diabetes and Digestive and Kidney Diseases. study registration: www.ClinicalTrials.gov NCT02258074 |
IMPROVE‐CKD 2012.
| Trial name or title | IMPROVE: IMpact of Phosphate Reduction On Vascular End‐points in Chronic Kidney Disease |
| Methods | Study design: parallel RCT Time frame: Recruitment end date 31 December 2016. Follow‐up end date December 2018 follow‐up: 24 months |
| Participants | Country: Australia and New Zealand Setting: 11 hospitals in Australia and 1 hospital in New Zealand Number randomised: 278 (target for randomisation 488) Inclusion criteria
Exclusion criteria
|
| Interventions | Treatment group 1
Treatment group 2
|
| Outcomes |
|
| Starting date | November 2011 |
| Contact information | nigel.toussaint@monash.edu |
| Notes | Funding sources: SHIRE; NHMRC; Australasian Kidney Trials Network. study registration: ACTRN12610000650099 |
LANDMARK 2017.
| Trial name or title | Outcome study of lanthanum carbonate compared with calcium carbonate on cardiovascular mortality and morbidity in patients with chronic kidney disease on hemodialysis (CKD5D) (LANDMARK study) |
| Methods | Study design: parallel RCT |
| Participants | Country: Japan Setting: not reported Inclusion criteria
Exclusion criteria
|
| Interventions | Treatment group 1
Treatment group 2
|
| Outcomes | Primary
Secondary
|
| Starting date | December 2011 |
| Contact information | Principal investigator: Tadao Akizawa, MD, PhD, Showa University; Division of Nephrology, Department of Medicine, Showa University School of Medicine, Sinagawa‐ku, Tokyo, Japan Hiroaki Ogata, Phone: +81‐45‐949‐7000, Email: pj.ca.u‐awohs.dem@hatago |
| Notes | Funding sources: Translational Research Informatics centre, Kobe, Hyogo, Japan. study registration: www.ClinicalTrials.gov (NCT01578200) and umin.ac.jp (UMIN000006815). |
Differences between protocol and review
During the process of this review update, we identified 21 studies that were included in the 2011 review but did not meet the study review criteria (Al‐Baaj 2005; Borrego 2000; Chertow 1997; Chiang 2005; d'Almeida Filho 2000; Emmett 1991; Fan 2009; Fischer 2006; FORESEE 2008; Ittel 1991; Joy 2003; Koiwa 2005a; Kurihara 2005; McIntyre 2009; Pflanz 1994; Phelps 2002; Ring 1993; Salusky 1991; Schaefer 1991; Sprague 2009b; Tzanakis 2008). The reasons for exclusion are reported in the Characteristics of excluded studies table. We reassigned the study "Deuber 2003a" in the 2011 review as a secondary publication of Deuber 2004. We identified secondary publications of "Finn 2004" of the 2011 review as secondary publications of Finn 2004 and SPD405‐307 2004. We identified the study "Malluche 2008" as a publication of the SPD405‐307 2004.
We added kidney function outcomes to the 2018 update including eGFR and ESKD. We have included Summary of Findings tables for the comparisons of: sevelamer versus placebo or usual care; lanthanum versus placebo or usual care; iron versus placebo or usual care; sevelamer versus calcium; and lanthanum versus calcium. Additional surrogate markers of CKD‐MBD including fibroblast growth factor 23 (FGF23), fetuin‐A, and Klotho have been added to the 2018 review update.
We changed subgroup analyses, adding age and CKD stage and deleting older/newer agents and number of participants.
Contributions of authors
Writing of protocol and review: SN, SCP, MR, PN, JCC, GJE, GFMS
Screening of titles and abstracts: SCP, MR, PN
Assessment for inclusion: SCP, MR, PN
Quality assessment: SCP, MR, PN
Data extraction: SCP, MR
Data entry into RevMan: SCP, MR
Data analysis: SCP, MR
Disagreement resolution: GFMS
Sources of support
Internal sources
No sources of support supplied
External sources
SDN (who was first author for the 2011 review) was supported by Multidisciplinary Clinical Research Career Development Program CTSA KL2 Grant #: RR024990, USA.
-
National Institute for Health Research (NIHR) Systematic Reviews Programme, UK.
This 2018 review update was funded by the NIHR Systematic Reviews Programme, Cochrane Incentive Award Scheme, Project reference 17/62/20. The views expressed are those of the authors and not necessarily those of the NHS, the NIHR, or the Department of Health and Social Care.
Declarations of interest
Nothing to declare
New search for studies and content updated (conclusions changed)
References
References to studies included in this review
Ahmed 2014 {published data only}
- Ahmed W, Rizwan‐Ul‐Hag AM, Khan S, Haider S, Abad‐Ur‐Reham. Comparative efficacy of sevelamer hydrochloride versus calcium acetate on bone biomarkers in patients with end stage renal disease on hemodialysis. Pakistan Journal of Medical & Health Sciences 2014;8(3):769‐71. [EMBASE: 600071132] [Google Scholar]
Akizawa 2000 {published data only}
- Akizawa T, Kinugasa E, Nagai T, Niikura K, Kurihara S, Suzuki M, et al. Effect of sevelamer hydrochloride (PB‐94) on hyperphosphatemia in Japanese hemodialysis (HD) patients [abstract no: A2940]. Journal of the American Society of Nephrology 2000;11(Sept):557A. [CENTRAL: CN‐00550506] [Google Scholar]
- Kinugasa E, Koshikawa S, PB‐94 Study Group. Effects of PB‐94 (sevelamer hydrochloride), a phosphate binder, on the treatment of hyperphosphatemia in hemodialysis patients ‐ a randomized, open label, dose titration study of PB‐94 versus caltan® tablet 500 (calcium carbonate) [abstract]. Journal of the American Society of Nephrology 2001;12(Program & Abstracts):755A. [CENTRAL: CN‐00626049] [Google Scholar]
Akizawa 2014a {published data only}
- Akizawa T, Origasa H, Kameoka C, Kaneko Y, Kawasaki S, Bixalomer Study Group. Randomized controlled trial of bixalomer versus sevelamer hydrochloride in hemodialysis patients with hyperphosphatemia. Therapeutic Apheresis & Dialysis 2014;18(2):122‐31. [MEDLINE: ] [DOI] [PubMed] [Google Scholar]
Akizawa 2016 {published data only}
- Akizawa T, Origasa H, Kameoka C, Tsukada J, Kuroishi K, Yamaguchi Y. Bixalomer in hyperphosphatemic patients with chronic kidney disease not on dialysis: phase 3 randomized trial. Therapeutic Apheresis & Dialysis 2016;20(6):588‐97. [MEDLINE: ] [DOI] [PubMed] [Google Scholar]
Allam 2012 {published data only}
- Allam S, El‐Hamamsy M, El‐Sharkway M. The effect of coadministration of nicotinamide and calcium‐based phosphate binder on hyperphosphatemia in patients undergoing hemodialysis. Advances in Natural Science 2012;5(1):1‐9. [DOI: 10.3968/j.ans.1715787020120501.1001] [DOI] [Google Scholar]
- Allam S, El‐Hamamsy M, El‐Sharkway M. The effect of coadminstration of nicotinamide and calcium‐based phosphate binder on hyperphophatemia in patients undergoing hemodialysis [abstract]. Value in Health 2012;15(4):A152. [EMBASE: 70763798] [Google Scholar]
- ElSharkawy MM, Kamel M, Elhamamsy M, Allam S. Lowdose nicotinamide as an adjunctive therapy to calcium carbonate for control of hyperphosphatemia in hemodialysis patients [abstract]. Nephrology Dialysis Transplantation 2013;28(Suppl 1):i253. [EMBASE: 71075759] [Google Scholar]
Almirall 1994 {published data only}
- Almirall J, Veciana L, Llibre J. Ca acetate versus Ca carbonate for the control of serum phosphate in haemodialysis patients [abstract]. Nephrology Dialysis Transplantation 1993;8(9):976. [CENTRAL: CN‐00260851] [Google Scholar]
- Almirall J, Veciana L, Llibre J. Calcium acetate versus calcium carbonate for the control of serum phosphorus in hemodialysis patients. American Journal of Nephrology 1994;14(3):192‐6. [MEDLINE: ] [DOI] [PubMed] [Google Scholar]
Aramwit 2012 {published data only}
- Aramwit P, Srisawadwong R, Supasyndh O. Effectiveness and safety of extended‐release nicotinic acid for reducing serum phosphorus in hemodialysis patients. Journal of Nephrology 2012;25(3):354‐62. [MEDLINE: ] [DOI] [PubMed] [Google Scholar]
Birck 1999 {published data only}
- Birck R, Zimmermann E, Wassmer S, Nowack R, Woude FJ. Calcium ketoglutarate versus calcium acetate for treatment of hyperphosphataemia in patients on maintenance haemodialysis: a cross‐over study. Nephrology Dialysis Transplantation 1999;14(6):1475‐9. [MEDLINE: ] [DOI] [PubMed] [Google Scholar]
- Birck R, Zimmermann E, Wassmer S, Nowack R, Woude FJ. Calcium‐ketoglutarate vs. calcium‐acetate for treatment of hyperphosphatemia in patients on maintenance hemodialysis [abstract]. Journal of the American Society of Nephrology 1998;9(Program & Abstracts):552A. [CENTRAL: CN‐00444439] [Google Scholar]
Bleyer 1999 {published data only}
- Bleyer AJ, Burke SK, Dillon M, Garrett B, Kant KS, Lynch D, et al. A comparison of the calcium‐free phosphate binder sevelamer hydrochloride with calcium acetate in the treatment of hyperphosphatemia in hemodialysis patients. American Journal of Kidney Diseases 1999;33(4):694‐701. [MEDLINE: ] [DOI] [PubMed] [Google Scholar]
- Bleyer AJ, Garrett B, Kant KS, Lynch D, Rahman N, Schoenfeld P, et al. An open label, cross‐over study of the new phosphate binder renagel in the management of hyperphosphatemia in ESRD patients [abstract]. Journal of the American Society of Nephrology 1997;8(Program & Abstracts):548a. [CENTRAL: CN‐00444452] [Google Scholar]
Block 2005 {published data only}
- Block G, Raggi P, Bellasi A, Ehrlich J, Chonchol M, Spiegel D. Increased mortality associated with coronary artery calcium scores and calcium containing phosphate binders: long term results from a randomized controlled trial in new dialysis patients [abstract no: MO020]. Nephrology Dialysis Transplantation 2006;21(Suppl 4):iv294. [Google Scholar]
- Block GA, Raggi P, Bellasi A, Kooienga L, Spiegel DM. Mortality effect of coronary calcification and phosphate binder choice in incident hemodialysis patients. Kidney International 2007;71(5):438‐41. [MEDLINE: ] [DOI] [PubMed] [Google Scholar]
- Block GA, Spiegel DM, Ehrlich J, Mehta R, Lindbergh J, Dreisbach A, et al. Effects of sevelamer and calcium on coronary artery calcification in patients new to hemodialysis. Kidney International 2005;68(4):1815‐24. [MEDLINE: ] [DOI] [PubMed] [Google Scholar]
- D'Marco LG, Bellasi A, Kim S, Chen Z, Block GA, Raggi P. Epicardial adipose tissue predicts mortality in incident hemodialysis patients: a substudy of the Renagel in New Dialysis trial. Nephrology Dialysis Transplantation 2013;28(10):2586‐95. [MEDLINE: ] [DOI] [PubMed] [Google Scholar]
- Galassi A, Spiegel D, Newbold C, Block G, Raggi P. Accelerated vascular calcification in diabetic patients new to hemodialysis treated with calcium salts as compared to sevelamer [abstract no: SA‐PO818]. Journal of the American Society of Nephrology 2005;16:735A. [CENTRAL: CN‐00583849] [Google Scholar]
- Galassi A, Spiegel DM, Bellasi A, Block GA, Raggi P. Accelerated vascular calcification and relative hypoparathyroidism in incident haemodialysis diabetic patients receiving calcium binders. Nephrology Dialysis Transplantation 2006;21(11):3215‐22. [MEDLINE: ] [DOI] [PubMed] [Google Scholar]
- Ko SM, Zhang C, Chen Z, D'Marco L, Bellasi A, Stillman AE, et al. Epicardial adipose tissue volume increase in hemodialysis patients treated with sevelamer or calcium‐based phosphate binders: a substudy of the Renagel in new dialysis trial. Journal of Nephrology 2016;29(5):683‐90. [MEDLINE: ] [DOI] [PubMed] [Google Scholar]
- Spiegel DM, Raggi P, Mehta R, Lindberg JS, Chonchol M, Ehrlich J, et al. Coronary and aortic calcifications in patients new to dialysis. Hemodialysis International 2004;8(3):265‐72. [EMBASE: 2005331550] [DOI] [PubMed] [Google Scholar]
- Spiegel DM, Raggi P, Smits G, Block GA. Factors associated with mortality in patients new to haemodialysis. Nephrology Dialysis Transplantation 2007;22(12):3568‐72. [MEDLINE: ] [DOI] [PubMed] [Google Scholar]
Block 2009 {published data only}
- Block GA, Persky MS, Ketteler M, Kestenbaum B, Thadhani R, Kooienga L, et al. A randomized double‐blind pilot study of serum phosphorus normalization in chronic kidney disease: a new paradigm for clinical outcomes studies in nephrology. Hemodialysis International 2009;13(3):360‐2. [EMBASE: 2009454718] [DOI] [PubMed] [Google Scholar]
- Block GA, Wheeler DC, Persky MS, Kestenbaum B, Ketteler M, Spiegel DM, et al. Effects of phosphate binders in moderate CKD. Journal of the American Society of Nephrology 2012;23(8):1407‐15. [MEDLINE: ] [DOI] [PMC free article] [PubMed] [Google Scholar]
- Jovanovich A, Isakova T, Block G, Stubbs J, Smits G, Chonchol M, et al. Deoxycholic acid, a metabolite of circulating bile acids, and coronary artery vascular calcification in CKD. American Journal of Kidney Diseases 2018;71(1):27‐34. [MEDLINE: ] [DOI] [PMC free article] [PubMed] [Google Scholar]
- Robinson‐Cohen C, Ix JH, Smits G, Persky M, Chertow GM, Block GA, et al. Estimation of 24‐hour urine phosphate excretion from spot urine collection: development of a predictive equation. Journal of Renal Nutrition 2014;24(3):194‐9. [MEDLINE: ] [DOI] [PubMed] [Google Scholar]
- Weber CI, Duchateau‐Nguyen G, Solier C, Schell‐Steven A, Hermosilla R, Nogoceke E, et al. Cardiovascular risk markers associated with arterial calcification in patients with chronic kidney disease stages 3 and 4. Clinical Kidney Journal 2014;7(2):167‐73. [MEDLINE: ] [DOI] [PMC free article] [PubMed] [Google Scholar]
Block 2015 {published data only}
- Block G, Chertow G, Fishbane S, Rodriguez M, Chen M, Shemesh S, et al. Ferric citrate reduces fibroblast growth factor 23 levels in patients with moderate chronic kidney disease [abstract]. Nephrology Dialysis Transplantation 2014;29(Suppl 3):iii156. [EMBASE: 71491881] [Google Scholar]
- Block G, Fishbane S, Shemesh S, Sharma A, Wolf M, Chertow G. A double‐blind placebo controlled randomized trial of ferric citrate coordination complex for the treatment of iron‐deficiency anemia and reduction of serum phosphate in patients with non‐dialysis dependent chronic kidney disease [abstract]. Nephrology Dialysis Transplantation 2014;29(Suppl 3):iii151. [EMBASE: 71491866] [Google Scholar]
- Block GA, Chertow GM, Fishbane S, Loram LC, Wolf M. Auryxia (ferric citrate) effectively reduces serum phosphate and fibroblast growth factor 23 (FGF23) levels in patients with stages 3‐5 chronic kidney disease (CKD) [abstract]. American Journal of Kidney Diseases 2015;65(4):A23. [EMBASE: 71875026] [Google Scholar]
- Block GA, Fishbane S, Rodriguez M, Smits G, Shemesh S, Pergola PE, et al. A 12‐week, double‐blind, placebo‐controlled trial of ferric citrate for the treatment of iron deficiency anemia and reduction of serum phosphate in patients with CKD stages 3‐5. American Journal of Kidney Diseases 2015;65(5):728‐36. [MEDLINE: ] [DOI] [PubMed] [Google Scholar]
- Block GA, Fishbane S, Shemesh S, Sharma A, Chertow GM. ZerenexTM (ferric citrate) for the treatment of iron‐deficiency anemia and reduction of serum phosphate in non‐dialysis dependent CKD [abstract]. American Journal of Kidney Diseases 2014;63(5):A118. [EMBASE: 71448667] [DOI] [PubMed] [Google Scholar]
- Chertow GM, Block GA, Neylan JF, Pergola PE, Uhlig K, Fishbane S. Safety and efficacy of ferric citrate in patients with nondialysis‐dependent chronic kidney disease. PLoS ONE [Electronic Resource] 2017;12(11):e0188712. [MEDLINE: ] [DOI] [PMC free article] [PubMed] [Google Scholar]
- Fishbane S, Block GA, Loram LC, Chertow GM. Auryxia (ferric citrate), an oral iron‐based phosphate binder significantly improves serum iron measures in patients with stage 3, 4 and 5 chronic kidney disease (CKD) [abstract]. American Journal of Kidney Diseases 2015;65(4):A35. [EMBASE: 71875070] [Google Scholar]
BRiC 2005 {published data only}
- Araujo MJ, Karohl C, Elias RM, Barreto FC, Barreto DV, Canziani ME, et al. The pitfall of treating low bone turnover: effects on cortical porosity. Bone 2016;91:75‐80. [MEDLINE: ] [DOI] [PubMed] [Google Scholar]
- Barreto DV, Barreto FC, Carvalho AB, Cuppari L, Cendoroglo M, Draibe SA, et al. Coronary calcification in hemodialysis patients: the contribution of traditional and uremia‐related risk factors.[Erratum appears in Kidney Int. 2005 May;67(5):2085‐7]. Kidney International 2005;67(4):1576‐82. [MEDLINE: ] [DOI] [PubMed] [Google Scholar]
- Barreto DV, Barreto FC, Carvalho AB, Cuppari L, Draibe SA, Dalboni MA, et al. Association of changes in bone remodeling and coronary calcification in hemodialysis patients: a prospective study.[Erratum appears in Am J Kidney Dis. 2009 Jan;53(1):181]. American Journal of Kidney Diseases 2008;52(6):1139‐50. [MEDLINE: ] [DOI] [PubMed] [Google Scholar]
- Barreto DV, Barreto FC, Carvalho AB, Cuppari L, Draibe SA, Dalboni MA, et al. Phosphate binder impact on bone remodeling and coronary calcification ‐ results from the BRiC study. Nephron 2008;110(4):c273‐83. [MEDLINE: ] [DOI] [PubMed] [Google Scholar]
- Barreto FC, Barreto DV, Moyses RM, Dias CB, Jorgetti V, Draibe SA, et al. Sevelamer and calcium acetate effects on bone histology in hemodialysis patients: one‐year follow‐up [abstract no: SA‐PO831]. Journal of the American Society of Nephrology 2005;16:738A. [CENTRAL: CN‐00676033] [Google Scholar]
- Barreto FC, Barreto DV, Moyses RM, Neves KR, Canziani ME, Draibe SA, et al. K/DOQI‐recommended intact PTH levels do not prevent low‐turnover bone disease in hemodialysis patients. Kidney International 2008;73(6):771‐7. [MEDLINE: ] [DOI] [PubMed] [Google Scholar]
- Cancela AL, Oliveira RB, Graciolli FG, dos Reis LM, Barreto F, Barreto DV, et al. Fibroblast growth factor 23 in hemodialysis patients: effects of phosphate binder, calcitriol and calcium concentration in the dialysate. Nephron 2011;117(1):c74‐82. [MEDLINE: ] [DOI] [PubMed] [Google Scholar]
- Canziani ME, Moyses RM, Baretto DV, Barreto FC, Cendoroglo‐Neto M, Blair A, et al. Bone and the relationship with inflammation and coronary calcification (BRIC) study [abstract no: SU‐PO723]. Journal of the American Society of Nephrology 2003;14(Nov):694A. [CENTRAL: CN‐00677751] [Google Scholar]
- Oliveira RB, Barreto F, Barreto DV, Graciolli FG, Cancela ALE, Cuppari L, et al. Sevelamer (SEV), but not calcium acetate (CA), decreases serum fibroblast growth factor 23 (FGF23) in hemodialysis patients [abstract no: SA‐PO863]. Journal of the American Society of Nephrology 2007;18(Abstracts):532A. [CENTRAL: CN‐00776229] [Google Scholar]
- Peres AT, Dalboni MA, Canziani ME, Manfredi SR, Carvalho JT, Batista MC, et al. Effect of phosphate binders on oxidative stress and inflammation markers in hemodialysis patients. Hemodialysis International 2009;13(3):271‐7. [CENTRAL: CN‐00747277] [DOI] [PubMed] [Google Scholar]
Bro 1998 {published data only}
- Bro S, Rasmussen RA, Handberg J, Olgaard K, Feld‐Rasmussen B. Randomized crossover study comparing the phosphate‐binding efficacy of calcium ketoglutarate versus calcium carbonate in patients on chronic hemodialysis. American Journal of Kidney Diseases 1998;31(2):257‐62. [MEDLINE: ] [DOI] [PubMed] [Google Scholar]
Caglar 2008 {published data only}
- Caglar K, Yilmaz MI, Saglam M, Cakir E, Acikel C, Eyileten T, et al. Short‐term treatment with sevelamer increases serum fetuin‐a concentration and improves endothelial dysfunction in chronic kidney disease stage 4 patients. Clinical Journal of the American Society of Nephrology: CJASN 2008;3(1):61‐8. [MEDLINE: ] [DOI] [PMC free article] [PubMed] [Google Scholar]
- Yilmaz MI, Sonmez A, Saglam M, Yaman H, Kilic S, Eyileten T, et al. Comparison of calcium acetate and sevelamer on vascular function and fibroblast growth factor 23 in CKD patients: a randomized clinical trial. American Journal of Kidney Diseases 2012;59(2):177‐85. [MEDLINE: ] [DOI] [PubMed] [Google Scholar]
CALMAG 2010 {published data only}
- Covic A, Passlick‐Deetjen J, Kroczak M, Buschges‐Seraphin B, Ghenu A, Ponce P, et al. A comparison of calcium acetate/magnesium carbonate and sevelamer‐hydrochloride effects on fibroblast growth factor‐23 and bone markers: post hoc evaluation from a controlled, randomized study. Nephrology Dialysis Transplantation 2013;28(9):2383‐92. [MEDLINE: ] [DOI] [PMC free article] [PubMed] [Google Scholar]
- Pasch A, Francisco ALM, Covic A, Marzell B, Arens HJ, Passlick‐Deetjen J, et al. Serum calcification propensity of HD patients is therapeutically improved by a calcium acetate/ magnesium carbonate containing phosphate binder [abstract]. Nephrology Dialysis Transplantation 2014;29(Suppl 3):iii40. [EMBASE: 71491561] [Google Scholar]
- Francisco AL, Leidig M, Covic AC, Ketteler M, Benedyk‐Lorens E, Mircescu GM, et al. Evaluation of calcium acetate/magnesium carbonate as a phosphate binder compared with sevelamer hydrochloride in haemodialysis patients: a controlled randomized study (CALMAG study) assessing efficacy and tolerability. Nephrology Dialysis Transplantation 2010;25(11):3707‐17. [MEDLINE: ] [DOI] [PMC free article] [PubMed] [Google Scholar]
Caravaca 1992 {published data only}
- Caravaca F, Santos I, Cubero JJ, Esparrago JF, Arrobas M, Pizarro JL, et al. Calcium acetate versus calcium carbonate as phosphate binders in hemodialysis patients. Nephron 1992;60(4):423‐7. [MEDLINE: ] [DOI] [PubMed] [Google Scholar]
- Caravaca F, Santos I, Robles R, Cubero J, Esparrago J, Arrobas M, et al. Calcium acetate versus calcium carbonate as phosphate binders in haemodialysis patients [abstract]. Nephrology Dialysis Transplantation 1990;5(8):729. [CENTRAL: CN‐00260555] [DOI] [PubMed] [Google Scholar]
CARE 2004 {published data only}
- Nolan CR, Hootkins RE, Cleveland MB, Pelham RW, Qunibi WY. Treatment of hyperphosphatemia in dialysis patients: results of the calcium acetate renegel evaluation (CARE Study) [abstract no: F‐PO664]. Journal of the American Society of Nephrology 2003;14(Nov):207A. [Google Scholar]
- Qunibi WY, Hootkins RE, McDowell LL, Meyer MS, Simon M, Garza RO, et al. Treatment of hyperphosphatemia in hemodialysis patients: the Calcium Acetate Renagel Evaluation (CARE Study). Kidney International 2004;65(5):1914‐26. [MEDLINE: ] [DOI] [PubMed] [Google Scholar]
CARE‐2 2008 {published data only}
- Budoff MJ, Kessler P, Gao YL, Qunibi W, Moustafa M, Mao SS. The interscan variation of CT coronary artery calcification score: analysis of the Calcium Acetate Renagel Comparison (CARE)‐2 study. Academic Radiology 2008;15(1):58‐61. [MEDLINE: ] [DOI] [PubMed] [Google Scholar]
- Qunibi W, Horwith G, Kessler P, Moustafa M, CARE‐2 Investigators. Cardiovascular calcification (CVC) in hemodialysis (HD) patients: study design and preliminary mineral data of the calcium acetate sevelamer evaluation‐2 (CARE‐2) study [abstract no: PUB386]. Journal of the American Society of Nephrology 2005;16(Oct Abstracts Issue):866A. [CENTRAL: CN‐00602064] [Google Scholar]
- Qunibi W, Moustafa M, Kessler P, Bortley E, Muenz L, Budoff M. Progression of coronary artery calcification (CAC) in hemodialysis patients (HDP) despite excellent control of LDL cholesterol: the Calcium Acetate Renagel Evaluation‐2 (CARE‐2) study [abstract no: FP386]. Nephrology Dialysis Transplantation 2007;22(Suppl 6):vi148. [CENTRAL: CN‐00691160] [Google Scholar]
- Qunibi W, Moustafa M, Kessler P, Muenz LR, Budoff M. Coronary artery calcification (CAC) in hemodialysis patients (HDP): preliminary results from the calcium acetate renagel evaluation‐2 (CARE‐2) study [abstract no: TH‐PO845]. Journal of the American Society of Nephrology 2006;17(Abstracts):286A. [CENTRAL: CN‐00602067] [Google Scholar]
- Qunibi W, Moustafa M, Muenz LR, He DY, Kessler PD, Diaz‐Buxo JA, et al. A 1‐year randomized trial of calcium acetate versus sevelamer on progression of coronary artery calcification in hemodialysis patients with comparable lipid control: the Calcium Acetate Renagel Evaluation‐2 (CARE‐2) study. American Journal of Kidney Diseases 2008;51(6):952‐65. [MEDLINE: ] [DOI] [PubMed] [Google Scholar]
- Qunibi W, Muenz LR, Diaz‐Buxo JA. The CARE‐2 study results: setting the record straight. Nephrology Dialysis Transplantation 2008;23(12):4081‐2. [MEDLINE: ] [DOI] [PubMed] [Google Scholar]
- Qunibi WY, Moustafa M, Kessler P, Bortey E, Muenz LR, Budoff M. Coronary artery calcification (CAC) progression in hemodialysis patients (HDP) treated with atorvastatin: the calcium acetate renagel evaluation‐2 (CARE‐2) study [abstract no: S‐PO‐0376]. 4th World Congress of Nephrology.19th International Congress of the International Society of Nephrology (ISN); 2007 Apr 21‐25; Rio de Janeiro, Brazil. 2007:150.
- Qunibi WY, Moustafa M, Kessler P, Muenz LR, Diaz‐Buxo J, Budoff M, et al. Progression of aorta calcification (AoC) in hemodialysis patients (HDP) treated with calcium acetate (CaA) or sevelamer (SV) with comparable lipid control: the calcium acetate renegal evaluation‐2 (CARE‐2) study [abstract no: TH‐FC043]. Journal of the American Society of Nephrology 2008;19(Abstracts Issue):10A. [Google Scholar]
Chen 2011b {published data only}
- Chen JB, Chiang SS, Chen HC, Obayashi S, Nagasawa M, Hexham JM, et al. Efficacy and safety of SBR759, a novel calcium‐free, iron(III)‐based phosphate binder, in Asian patients undergoing hemodialysis: a 12‐week, randomized, open‐label, dose‐titration study versus sevelamer hydrochloride. Nephrology 2011;16(8):743‐50. [MEDLINE: ] [DOI] [PubMed] [Google Scholar]
- Chen JB, Chiang SS, Chen HC, Obayashi S, Nagasawa M, Hexham JM, et al. SBR759, a novel phosphate binder, effectively controls hyperphosphatemia in Asian patients on hemodialysis versus sevelamer [abstract no: FP08‐08]. Nephrology 2010;15(Suppl 3):51. [EMBASE: 70467427] [Google Scholar]
- Chen JB, Chiang SS, Hen HC, Obayashi S, Nagasawa M, Hexham JM, et al. SBR759, a novel phosphate binder, is superior to sevelamer HCL in controlling hyperphosphatemia in Asian patients on hemodialysis [abstract no: Sa582]. NDT Plus 2010;3(Suppl 3):iii238. [EMBASE: 70484048] [Google Scholar]
Chen 2014 {published data only}
- Chen N, Wu X, Ding X, Mei C, Fu P, Jiang G, et al. Sevelamer carbonate lowers serum phosphorus effectively in haemodialysis patients: a randomized, double‐blind, placebo‐controlled, dose‐titration study. Nephrology Dialysis Transplantation 2014;29(1):152‐60. [MEDLINE: ] [DOI] [PubMed] [Google Scholar]
Cheng 2008 {published data only}
- Cheng SC, Young DO, Delmez JA, Coyne DW. The effect of oral niacinamide on serum phosphorus levels in hemodialysis patients [abstract no: PUB430]. Journal of the American Society of Nephrology 2007;18(Abstracts):924A. [Google Scholar]
- Cheng SC, Young DO, Huang Y, Delmez JA, Coyne DW. A randomized, double‐blind, placebo‐controlled trial of niacinamide for reduction of phosphorus in hemodialysis patients. Clinical Journal of The American Society of Nephrology: CJASN 2008;3(4):1131‐8. [MEDLINE: ] [DOI] [PMC free article] [PubMed] [Google Scholar]
Chennasamudram 2013 {published data only}
- Chennasamudram SP, Noor T, Vasylyeva TL. Comparison of sevelamer and calcium carbonate on endothelial function and inflammation in patients on peritoneal dialysis. Journal of Renal Care 2013;39(2):82‐9. [MEDLINE: ] [DOI] [PubMed] [Google Scholar]
Chertow 1999 {published data only}
- Chertow GM, Dillon M, Burke SK, Steg M, Bleyer AJ, Garrett BN, et al. A randomized trial of sevelamer hydrochloride (RenaGel) with and without supplemental calcium. Strategies for the control of hyperphosphatemia and hyperparathyroidism in hemodialysis patients. Clinical Nephrology 1999;51(1):18‐26. [MEDLINE: ] [PubMed] [Google Scholar]
Chertow 2002 {published data only}
- Asmus HG, Braun J, Krause R, Brunkhorst R, Holzer H, Schulz W, et al. Two year comparison of sevelamer and calcium carbonate effects on cardiovascular calcification and bone density. Nephrology Dialysis Transplantation 2005;20(8):1653‐61. [MEDLINE: ] [DOI] [PubMed] [Google Scholar]
- Bommer J, Asmus G, Braun J, Brunkhorst R, Holzer H, Krause R, et al. Sevelamer is more effective than calcium in the management of mineral metabolism and arterial calcification [abstract no: O106]. Nephrology Dialysis Transplantation 2002;17(Suppl 1):32. [CENTRAL: CN‐00509096] [Google Scholar]
- Bommer J, European Renagel Investigators Group. Lipid lowering effect of renagel, a novel phosphate binder [abstract]. Nephrology Dialysis Transplantation 2001;16(6):A122. [CENTRAL: CN‐00444477] [Google Scholar]
- Braun J, Asmus HG, Holzer H, Brunkhorst R, Krause R, Schulz W, et al. Long‐term comparison of a calcium‐free phosphate binder and calcium carbonate‐‐phosphorus metabolism and cardiovascular calcification. Clinical Nephrology 2004;62(2):104‐15. [MEDLINE: ] [DOI] [PubMed] [Google Scholar]
- Chertow GM, Burke SK, Raggi P, Treat to Goal Working Group. Sevelamer attenuates the progression of coronary and aortic calcification in hemodialysis patients. Kidney International 2002;62(1):245‐52. [MEDLINE: ] [DOI] [PubMed] [Google Scholar]
- Chertow GM, Chasan‐Taber S, Raggi P. The "tip of the iceberg" matters: exposure to high normal serum calcium concentration leads to accelerated coronary artery and aortic calcification in hemodialysis patients treated with calcium‐based phosphate binders [abstract]. Journal of the American Society of Nephrology 2002;13(September, Program & Abstracts):433a. [CENTRAL: CN‐00444789] [Google Scholar]
- Chertow GM, Dillon MA, Amin N, Bommer J, Burke SK. Sevelamer is more effective at controlling disorders of mineral metabolism than calcium‐based phosphate binders in hemodialysis patients [abstract]. Journal of the American Society of Nephrology 2001;12(Program & Abstracts):195‐6A. [CENTRAL: CN‐00444790] [Google Scholar]
- Chertow GM, Goodman WG, Toto RD, Raggi P. In hemodialysis patients, sevelamer (renagel) attenuates coronary artery and aortic calcification and reduces LDL‐C, APO‐B, and HS‐CRP compared with calcium acetate (PHOSLO) [abstract no: SA‐PO603]. Journal of the American Society of Nephrology 2002;13(Sept, Program & Abstracts):386a. [CENTRAL: CN‐00444791] [Google Scholar]
- Chertow GM, Raggi P, Chasan‐Taber S, Bommer J, Holzer H, Burke SK. Determinants of progressive vascular calcification in haemodialysis patients. Nephrology Dialysis Transplantation 2004;19(6):1489‐96. [MEDLINE: ] [DOI] [PubMed] [Google Scholar]
- Chertow GM, Raggi P, McCarthy JT, Schulman G, Silberzweig J, Kuhlik A, et al. The effects of sevelamer and calcium acetate on proxies of atherosclerotic and arteriosclerotic vascular disease in hemodialysis patients. American Journal of Nephrology 2003;23(5):307‐14. [MEDLINE: ] [DOI] [PubMed] [Google Scholar]
- Ferramosca E, Burke S, Chasan‐Taber S, Ratti C, Chertow GM, Raggi P. Potential antiatherogenic and anti‐inflammatory properties of sevelamer in maintenance hemodialysis patients. American Heart Journal 2005;149(5):820‐5. [MEDLINE: ] [DOI] [PubMed] [Google Scholar]
- Garg JP, Chasan‐Taber S, Blair A, Plone M, Bommer J, Raggi P, et al. Effects of sevelamer and calcium‐based phosphate binders on uric acid concentrations in patients undergoing hemodialysis: a randomized clinical trial. Arthritis & Rheumatism 2005;52(1):290‐5. [MEDLINE: ] [DOI] [PubMed] [Google Scholar]
- James G, Raggi P, Boulay A, Burke S, Chasan‐Taber S, Chertow G, et al. Thoracic vertebral bone density increases with renagel and decreases with calcium‐based phosphate binder therapy ‐ a two year study [abstract no: W423]. Nephrology Dialysis Transplantation 2003;18(Suppl 4):681. [CENTRAL: CN‐00445894] [Google Scholar]
- Raggi P, Bommer J, Chertow GM. Valvular calcification in hemodialysis patients randomized to calcium‐based phosphorus binders or sevelamer. Journal of Heart Valve Disease 2004;13(1):134‐41. [MEDLINE: ] [PubMed] [Google Scholar]
- Raggi P, Burke S, Chasen‐Taber S, Chertow G, Holzer H, Bommer J. Sevelamer preserves trabecular bone mineral density [abstract]. 41st Congress. European Renal Association. European Dialysis and Transplantation Association; 2004 May 15‐18; Lisbon, Portugal. 2004:103‐4. [CENTRAL: CN‐00509430]
- Raggi P, Burke SK, Chasen‐Taber S, Chertow GM, Holzer H, Bommer J. Sevelamer preserves and calcium reduces trabecular bone mineral density [abstract no: SA‐PO924]. Journal of the American Society of Nephrology 2003;14(Nov):502A. [CENTRAL: CN‐00583411] [Google Scholar]
- Raggi P, Burke SK, Dillon MA, Amin N, Bommer J, Chertow GM. Sevelamer attenuates the progression of coronary and aortic calcification compared with calcium‐based phosphate binders [abstract]. Journal of the American Society of Nephrology 2001;12(Program & Abstracts):239A. [CENTRAL: CN‐00447325] [Google Scholar]
- Raggi P, James G, Burke SK, Bommer S, Chasan‐Taber S, Holzer H, et al. Decrease in thoracic vertebral bone attenuation with calcium‐based phosphate binders in hemodialysis. Journal of Bone & Mineral Research 2005;20(5):764‐72. [MEDLINE: ] [DOI] [PubMed] [Google Scholar]
CRIB‐PHOS 2011 {published data only}
- Chue CD, Townend JN, Moody WE, Zehnder D, Wall NA, Harper L, et al. Cardiovascular effects of sevelamer in stage 3 CKD. Journal of the American Society of Nephrology 2013;24(5):842‐52. [MEDLINE: ] [DOI] [PMC free article] [PubMed] [Google Scholar]
- Chue CD, Townend JN, Steeds RP, Ferro CJ. Evaluating the effects of sevelamer carbonate on cardiovascular structure and function in chronic renal impairment in Birmingham: the CRIB‐PHOS randomised controlled trial. Trials [Electronic Resource] 2011;12(1):30. [MEDLINE: ] [DOI] [PMC free article] [PubMed] [Google Scholar]
D'Haese 2003 {published data only}
- D'Haese PC, Spasovski GB, Sikole A, Hutchinson A, Freemont TJ, Sulkova S, et al. A multicenter study on the effects of lanthanum carbonate (Fosrenol) and calcium carbonate on renal bone disease in dialysis patients. Kidney International ‐ Supplement 2003;85:S73‐8. [MEDLINE: ] [DOI] [PubMed] [Google Scholar]
- D'Haese PC, Spasovski GB, Sikole A, Hutchinson A, Freemont TJ, Sulkova S, et al. Multi‐centre study on the effects of lanthanum carbonate (FosrenolTM) and calcium carbonate on renal bone disease in dialysis patients [abstract no: PS1‐15]. Nephrology 2003;8(Suppl 1):A28. [DOI] [PubMed] [Google Scholar]
- Broe ME, D'Haese PC, Freemont TJ, Webster I, Gill M, Spasovski GB. Comparative effects of lanthanum carbonate (fosrenol) and calcium carbonate on renal bone disease in dialysis patients: results from a large, long‐term clinical trial [abstract]. Nephrology Dialysis Transplantation 2003;18(Suppl 4):682. [CENTRAL: CN‐00445015] [Google Scholar]
- Freemont A. The effects of lanthanum carbonate and calcium carbonate on bone in patients with chronic kidney disease [abstract no: 33]. American Journal of Kidney Diseases 2004;43(4):A23. [CENTRAL: CN‐00644282] [Google Scholar]
- Freemont A, Jones C. The effects of the phosphate binders lanthanum carbonate and calcium carbonate on bone: a comparative study in patients with chronic kidney disease [abstract no:SP270]. 41st Congress. European Renal Association. European Dialysis and Transplantation Association; 2004 May 15‐18; Lisbon, Portugal. 2004:106. [CENTRAL: CN‐00509202]
- Freemont AJ, Hoyland JA, Denton J, Lanthanum Carbonate SPD405‐303 Study Group. The effects of lanthanum carbonate and calcium carbonate on bone abnormalities in patients with end‐stage renal disease. Clinical Nephrology 2005;64(6):428‐37. [MEDLINE: ] [PubMed] [Google Scholar]
- Freemont T, Malluche HH. Utilization of bone histomorphometry in renal osteodystrophy: demonstration of a new approach using data from a prospective study of lanthanum carbonate. Clinical Nephrology 2005;63(2):138‐45. [MEDLINE: ] [DOI] [PubMed] [Google Scholar]
- Torres A, Broe ME, D'Haese PC, Hutchison A, Jones C. One‐year, randomized, open‐label study comparing the safety and efficacy of lanthanum carbonate (Fosrenol®) and calcium carbonate in dialysis patients [abstract no: SU‐PO1041]. Journal of the American Society of Nephrology 2003;14(Nov):764A. [CENTRAL: CN‐00583261] [Google Scholar]
- Webster I. Lanthanum carbonate, a novel phosphate binder, has similar efficacy and tolerability to calcium carbonate over one year of treatment [abstract]. Nephrology Nursing Journal 2004;31(2):146. [Google Scholar]
- Wilson R. Spica Consultants Ltd. Personal communication 2005.
- Wilson R, Copley JB, Poole L. Lower serum phosphorus can be attained by increasing the dose of lanthanum carbonate [abstract]. Nephrology Dialysis Transplantation 2012;27(Suppl 2):ii496. [EMBASE: 70766788] [Google Scholar]
DCOR 2007 {published data only}
- Peter W, Liu J, Fan Q, Weinhandl E, Chronic Disease Research Group. DCOR Study: assessing impact of sevelamer vs calcium binders on hospitalization and morbidity in hemodialysis patients using CMS data [abstract no: TH‐PO846]. Journal of the American Society of Nephrology 2006;17(Abstracts):287A. [CENTRAL: CN‐00602069] [Google Scholar]
- Peter WL, Fan Q, Weinhandl E, Liu J. Economic evaluation of sevelamer versus calcium‐based phosphate binders in hemodialysis patients: a secondary analysis using centers for Medicare & Medicaid services data. Clinical Journal of the American Society of Nephrology: CJASN 2009;4(12):1954‐61. [MEDLINE: ] [DOI] [PMC free article] [PubMed] [Google Scholar]
- Peter WL, Liu J, Weinhandl E, Fan Q. A comparison of sevelamer and calcium‐based phosphate binders on mortality, hospitalization, and morbidity in hemodialysis: a secondary analysis of the Dialysis Clinical Outcomes Revisited (DCOR) randomized trial using claims data. American Journal of Kidney Diseases 2008;51(3):445‐54. [MEDLINE: ] [DOI] [PubMed] [Google Scholar]
- Peter WL, Liu J, Weinhandl ED, Fan Q. Linking Centers for Medicare & Medicaid Services data with prospective DCOR trial data: methods and data comparison results. Hemodialysis International 2008;12(4):480‐91. [MEDLINE: ] [DOI] [PubMed] [Google Scholar]
- St.Peter W, Liu J, Fan Q, Weinhandl E, Chronic Disease Research Group. DCOR Study: assessing economic impact of sevelamer vs calcium binders on hospitalization and morbidity in hemodialysis patients using CMS data [abstract no: TH‐PO847]. Journal of the American Society of Nephrology 2006;17(Abstracts):287A. [CENTRAL: CN‐00602068] [Google Scholar]
- Suki W, Zabaneh R, Cangiano J, Reed J, Fischer D, Garrett L, et al. A prospective, randomized trial assessing the impact on outcomes of sevelamer in dialysis patients ‐ the DCOR trial [abstract no: SP392]. Nephrology Dialysis Transplantation 2006;21(Suppl 4):iv145. [CENTRAL: CN‐00602070] [Google Scholar]
- Suki WN, Zabaneh R, Cangiano J, Reed J, Swan S, Fischer D, et al. The DCOR trial ‐ a prospective, randomized trial assessing the impact on outcomes of sevelamer in dialysis patients [abstract no: TH‐PO745]. Journal of the American Society of Nephrology 2005;16:281A. [Google Scholar]
- Suki WN, Zabaneh R, Cangiano JL, Reed J, Fischer D, Garrett L, et al. Effects of sevelamer and calcium‐based phosphate binders on mortality in hemodialysis patients. Kidney International 2007;72(9):1130‐7. [MEDLINE: ] [DOI] [PubMed] [Google Scholar]
- Suki WN, Dialysis Clinical Outcomes Revisited Investigators. Effects of sevelamer and calcium‐based phosphate binders on mortality in hemodialysis patients: results of a randomized clinical trial. Journal of Renal Nutrition 2008;18(1):91‐8. [MEDLINE: ] [DOI] [PubMed] [Google Scholar]
Delmez 1996 {published data only}
- Delmez JA, Kelber J, Norwood KY, Giles KS, Slatopolsky E. The clinical evaluation of magnesium carbonate (MgCo3) as a phosphorous (P) binder in the suppression of secondary hyperparathyroidism [abstract]. ISN XIII International Congress of Nephrology; 1995 Jul 2‐6; Madrid, Spain. 1995:416.
- Delmez JA, Kelber J, Norword KY, Giles KS, Slatopolsky E. Magnesium carbonate as a phosphorus binder: a prospective, controlled, crossover study. Kidney International 1996;49(1):163‐7. [MEDLINE: ] [DOI] [PubMed] [Google Scholar]
Delmez 2007 {published data only}
- Delmez J, Block G, Bleyer A, Robertson J, Chasan‐Taber S, Dillon M, et al. A randomized, double‐blind cross‐over design study of sevelamer hydrochloride (SH, Renegel®) and sevelamer carbonate (SC) in chronic kidney disease patients on hemodialysis [abstract no: 48]. American Journal of Kidney Diseases 2007;49(4):A36. [CENTRAL: CN‐00671791] [DOI] [PubMed] [Google Scholar]
- Delmez J, Block G, Bleyer A, Robertson J, Chasan‐Taber S, Dillon M, et al. Results of a randomized, double‐blind, cross‐over design study of sevelamer hydrochloride (Renagel®) and sevelamer carbonate in chronic kidney disease patients on hemodialysis [abstract no: SaP377]. Nephrology Dialysis Transplantation 2007;22(Suppl 6):vi361. [CENTRAL: CN‐00671790] [DOI] [PubMed] [Google Scholar]
- Delmez J, Block G, Robertson J, Chasan‐Taber S, Blair A, Dillon M, et al. A randomized, double‐blind, crossover design study of sevelamer hydrochloride and sevelamer carbonate in patients on hemodialysis. Clinical Nephrology 2007;68(6):386‐91. [MEDLINE: ] [DOI] [PubMed] [Google Scholar]
De Santo 2006 {published data only}
- Santo NG, Frangiosa A, Anastasio P, Marino A, Correale G, Perna A, et al. Sevelamer worsens metabolic acidosis in hemodialysis patients. Journal of Nephrology 2006;19 Suppl 9:S108‐14. [MEDLINE: ] [PubMed] [Google Scholar]
Deuber 2004 {published data only}
- Deuber H. Effective reduction of serum phosphate by a calcium and magnesium containing phosphate binder without induction of hypermagnesemia [abstract no: W422]. Nephrology Dialysis Transplantation 2003;18(Suppl 4):680‐1. [CENTRAL: CN‐00445085] [Google Scholar]
- Deuber HJ. Combined use of calcium acetate and magnesium carbonate as phosphate binder [Kombinierter einsatz von kalziumazetat und magnesiumkarbonat als orale phosphatbinder]. Nieren und Hochdruckkrankheiten 2004;33(8):403‐8. [EMBASE: 39150178] [Google Scholar]
Evenepoel 2009 {published data only}
- Evenepoel P, Selgas R, Caputo F, Foggensteiner L, Heaf JG, Ortiz A, et al. Efficacy and safety of sevelamer hydrochloride and calcium acetate in patients on peritoneal dialysis. Nephrology Dialysis Transplantation 2009;24(1):278‐85. [MEDLINE: ] [DOI] [PubMed] [Google Scholar]
- Evenepoel P, Selgas R, Duggal A, Kelly A, Fan SL. Effects of sevelamer hydrochloride (Renagel®) and calcium acetate on controlling serum phosphorus in peritoneal dialysis patients [abstract no: MP580]. Nephrology Dialysis Transplantation 2006;21(Suppl 4):iv496. [CENTRAL: CN‐00671825] [Google Scholar]
- Evenepoel P, Selgas R, Duggal A, Kelly AL, Fan SL. Comparative effects of sevelamer hydrochloride (Renagel®) and calcium acetate on markers of mineral metabolism in peritoneal dialysis patients [abstract no: TH‐PO778]. Journal of the American Society of Nephrology 2006;17(Abstracts):272A. [CENTRAL: CN‐00671824] [Google Scholar]
Evsanaa 2015 {published data only}
- Evsanaa B, Liu I, Aliazardeh B, Mahdavi S, Bajwa G, Gula J, et al. MgCaCO3 versus CaCO3 in peritoneal dialysis patients‐‐a cross‐over pilot trial. Peritoneal Dialysis International 2015;35(1):31‐4. [MEDLINE: ] [DOI] [PMC free article] [PubMed] [Google Scholar]
Ferreira 2008 {published data only}
- Ferreira A, Frazão JM, Monier‐Faugere MC, Gil C, Galvao J, Oliveira C, et al. Effects of sevelamer hydrochloride and calcium carbonate on renal osteodystrophy in hemodialysis patients. Journal of the American Society of Nephrology 2008;19(2):405‐12. [MEDLINE: ] [DOI] [PMC free article] [PubMed] [Google Scholar]
Fishbane 2010 {published data only}
- Fishbane S, Delmez J, Suki W, Hariachar S, Moe S, Heaton J. Sevelamer carbonate powder dosed once per day and sevelamer hydrochloride tablets dosed three times per day: a randomized, parallel, open‐label study in chronic kidney disease patients on hemodialysis [abstract no: M621]. World Congress of Nephrology; 2009 May 22‐26; Milan, Italy. 2009.
- Fishbane S, Delmez J, Suki WN, Hariachar S, Moe S. A randomized, parallel, open‐label study to compare once per day sevelamer carbonate powder dosing with three times per day sevelamer hydrochloride tablet dosing in chronic kidney disease patients on hemodialysis [abstract no: PUB556]. Journal of the American Society of Nephrology 2008;19(Abstracts Issue):936A. [CENTRAL: CN‐00747271] [DOI] [PubMed] [Google Scholar]
- Fishbane S, Delmez J, Suki WN, Hariachar SK, Heaton J, Chasan‐Taber S, et al. A randomized, parallel, open‐label study to compare once‐daily sevelamer carbonate powder dosing with thrice‐daily sevelamer hydrochloride tablet dosing in CKD patients on hemodialysis. American Journal of Kidney Diseases 2010;55(2):307‐15. [MEDLINE: ] [DOI] [PubMed] [Google Scholar]
Floege 2014 {published data only}
- Covic A, Ketteler M, Rastogi A, Spinowitz B, Sprague SM, Botha J, et al. Comparison of safety profiles of PA21 and sevelamer carbonate in a post hoc analysis of a phase 3 study [abstract]. Nephrology Dialysis Transplantation 2014;29(Suppl 3):iii153. [EMBASE: 71491873] [Google Scholar]
- Covic A, Ketteler M, Rastogi A, Spinowitz B, Sprague SM, Botha J, et al. Efficacy and safety of PA21 and sevelamer carbonate in haemodialysis patients with or without diabetes: a post hoc analysis of a phase 3 study [abstract]. Nephrology Dialysis Transplantation 2014;29(Suppl 3):iii152. [EMBASE: 71491869] [Google Scholar]
- Covic AC, Floege J, Ketteler M, Sprague SM, Lisk L, Rakov V, et al. Iron‐related parameters in dialysis patients treated with sucroferric oxyhydroxide. Nephrology Dialysis Transplantation 2017;32(8):1330‐8. [MEDLINE: ] [DOI] [PMC free article] [PubMed] [Google Scholar]
- Floege J, Botha J, Chong E, Sprague SM. PA21 does not interact with oral vitamin D receptor agonists: a post hoc analysis of a phase 3 study [abstract]. Nephrology Dialysis Transplantation 2014;29(Suppl 3):iii157. [EMBASE: 71491885] [Google Scholar]
- Floege J, Covic A, Ketteler M, Rastogi A, Chong E, Lisk L, et al. Regional analysis of baseline characteristics in a phase 3 study of PA21, a novel iron‐based phosphate binder [abstract]. Nephrology Dialysis Transplantation 2013;28(Suppl 1):i155. [EMBASE: 71075446] [Google Scholar]
- Floege J, Covic AC, Ketteler M, Mann J, Rastogi A, Spinowitz B, et al. One‐year efficacy and safety of the iron‐based phosphate binder sucroferric oxyhydroxide in patients on peritoneal dialysis. Nephrology Dialysis Transplantation 2017;32(11):1918‐26. [MEDLINE: ] [DOI] [PubMed] [Google Scholar]
- Floege J, Covic AC, Ketteler M, Mann JF, Rastogi A, Spinowitz B, et al. Long‐term effects of the iron‐based phosphate binder, sucroferric oxyhydroxide, in dialysis patients. Nephrology Dialysis Transplantation 2015;30(6):1037‐46. [MEDLINE: ] [DOI] [PMC free article] [PubMed] [Google Scholar]
- Floege J, Covic AC, Ketteler M, Rastogi A, Chong EM, Gaillard S, et al. A phase III study of the efficacy and safety of a novel iron‐based phosphate binder in dialysis patients. Kidney International 2014;86(3):638‐47. [MEDLINE: ] [DOI] [PMC free article] [PubMed] [Google Scholar]
- Floege J, Ketteler M, Rastogi A, Spinowitz B, Sprague SM, Botha J, et al. Post hoc analysis of safety profiles by patient age in a phase 3 study of PA21 and sevelamer carbonate [abstract]. Nephrology Dialysis Transplantation 2014;29(Suppl 3):iii152. [EMBASE: 71491870] [Google Scholar]
- Floege J, Sprague S, Covic A, Rastogi A, Spinowitz B, Larroque S, et al. Sucroferric oxyhydroxide does not impact the iPTH‐lowering effects of oral vdras or cinacalcet: a post hoc analysis of a phase 3 study [abstract]. Nephrology Dialysis Transplantation 2016;31(Suppl 1):i461. [EMBASE: 72327216] [Google Scholar]
- Floege J, Sprague S, Rastogi A, Ketteler M, Covic A, Rakov V, et al. Characteristics of responders and non‐responders to treatment with sucroferric oxyhydroxide: a post hoc analysis of a phase 3 study [abstract]. Nephrology Dialysis Transplantation 2016;31(Suppl 1):i466. [EMBASE: 72327232] [Google Scholar]
- Ketteler M, Floege J, Rastogi A, Sprague S, Gaillard S, Lopfe M, et al. PA21, a novel iron‐based phosphate binder, showed no interaction with fat‐soluble vitamins in a phase 3 study [abstract]. Nephrology Dialysis Transplantation 2013;28(Suppl 1):i155‐6. [EMBASE: 71075447] [Google Scholar]
- Rastogi A, Covic A, Floege J, Ketteler M, Chong E, Gaillard S, et al. PA21 ‐ a novel iron‐based phosphate binder with a low pill burden: tolerance in dialysis patients [abstract]. American Journal of Kidney Diseases 2013;61(4):A81. [EMBASE: 71024085] [Google Scholar]
- Rastogi A, Covic A, Floege J, Ketteler M, Spinowitz B, Botha J, et al. No clinically relevant changes in vitamin D concentrations with PA21, a novel iron‐based phosphate binder, over 52 weeks [abstract]. American Journal of Kidney Diseases 2014;63(5):A94. [EMBASE: 71448568] [Google Scholar]
- Sprague SM, Covic A, Floege J, Ketteler M, Spinowitz B, Gaillard S, et al. Concomitant intravenous iron use drives changes in iron indices in a phase 3 study of PA21 [abstract]. American Journal of Kidney Diseases 2014;63(5):A105. [EMBASE: 71448614] [Google Scholar]
- Sprague SM, Covic A, Floege J, Ketteler M, Spinowitz B, Rakov V, et al. Post HOC analysis of antianemic agent use over 1 year in a phase 3 study of sucroferric oxyhydroxide [abstract]. American Journal of Kidney Diseases 2015;65(4):A80. [EMBASE: 71875231] [Google Scholar]
- Sprague SM, Covic AC, Floege J, Ketteler M, Botha J, Chong EM, et al. Pharmacodynamic effects of sucroferric oxyhydroxide and sevelamer carbonate on vitamin D receptor agonist bioactivity in dialysis patients. American Journal of Nephrology 2016;44(2):104‐12. [MEDLINE: ] [DOI] [PubMed] [Google Scholar]
- Sprague SM, Rastogi A, Ketteler M, Covic A, Floege J, Rakov V, et al. 1‐year efficacy and safety of sucroferric oxyhydroxide in a sub‐population of African American dialysis patients [abstract]. American Journal of Kidney Diseases 2016;67(5):A104. [EMBASE: 72313644] [Google Scholar]
- Sprague SM, Rastogi A, Ketteler M, Covic A, Floege J, Rakov V, et al. FGF‐23 and CKD‐MBD indices after 1 year of treatment with sucroferric oxyhydroxide in African American dialysis patients [abstract]. American Journal of Kidney Diseases 2016;67(5):A104. [EMBASE: 72313645] [Google Scholar]
- Tumlin J, Chong E, Gaillard S, Floege J. Evaluating the management of hyperphosphatemia with PA21 in dialysis patients‐rationale and design of an open‐label, randomised, active‐controlled phase 3 study [abstract]. Blood Purification 2012;33(1‐3):212‐3. [EMBASE: 70723735] [Google Scholar]
Foraster 1998 {published data only}
- Foraster A, Gonzalez MT, Carreras J, Prieto ML, Sampietro J, Bonnin R, et al. Calcium acetate. A good alternative to calcium carbonate for treating hyperphosphoremia in chronic hemodialysis patients with high risk of hypercalcemia [Acetato calcico. Una buena alternativa al carbonato calcico, como quelante del fosforo, en los pacientes en hemodialisis con riesgo de hipercalcemia]. Nefrologia 1998;18(4):296‐301. [EMBASE: 1998302471] [Google Scholar]
Fujii 2017 {published data only}
- Fujii H, Kono K, Goto S, Nakai K, Watanabe S, Watanabe K, et al. Effect of lanthanum carbonate on cardiac abnormalities in patients new to hemodialysis [abstract]. Nephrology Dialysis Transplantation 2017;32(Suppl 3):iii645. [EMBASE: 617289957] [Google Scholar]
- Fujii H, Nakai K, Kono K, Goto S, Kitamura K, Yonekura Y, et al. Effect of lanthanum carbonate on coronary artery calcification during the early period after the initiation of haemodialysis [abstract]. Nephrology Dialysis Transplantation 2016;31(Suppl 1):i252. [EMBASE: 72326579] [Google Scholar]
Fujimori 2017 {published data only}
- Fujimori A, Ohkawa S, Okada S, Mizobuchi N, Sakai M, Hasuike Y, et al. Comparison of the suppressive effects on fibroblast growth factor 23 between ferric citrate and lanthanum carbonate [abstract]. Nephrology Dialysis Transplantation 2017;32(Suppl 3):iii244‐5. [EMBASE: 617291229] [Google Scholar]
Gallieni 2005 {published data only}
- Gallieni M, Cicchetti T, Salvadori M, Sorba G, Stalteri A, Tarchini R, et al. Comparison of sevelamer HCL and calcium carbonate in the treatment of hyperphosphatemia in dialysis patients: a randomized clinical trial ‐ Calcium Carbonate Sevelamer Evaluation (CaCSE) study [abstract]. Journal of the American Society of Nephrology 2005;16:746A. [CENTRAL: CN‐00583853] [Google Scholar]
Greenberg 1994 {published data only}
- Greenberg S, Shapiro W, Poruch JG. Calcium acetate (aa) vs calcium carbonate (caco) as a phosphorus (p) binder (b) in CAPD patients (pts) [abstract]. ISN XIII International Congress of Nephrology; 1995 Jul 2‐6; Madrid, Spain. 1995:472. [CENTRAL: CN‐00509217]
- Greenberg S, Shapiro W, Porush JG. Calcium acetate (caa) vs calcium carbonate (caco) as a phosphorus (p) binder (b) in CAPD patients (pts) [abstract]. Journal of the American Society of Nephrology 1994;5(3):492. [Google Scholar]
Hervas 2003 {published data only}
- Hervas JG, Prados D, Cerezo S. Treatment of hyperphosphatemia with sevelamer hydrochloride in hemodialysis patients: a comparison with calcium acetate. Kidney International ‐ Supplement 2003;85:69‐72. [MEDLINE: ] [DOI] [PubMed] [Google Scholar]
Hutchison 2005 {published data only}
- Gill M, Webster I, Segars L. Efficacy and safety of lanthanum carbonate, the novel phosphate binder, in Chinese patients with chronic kidney disease [abstract]. Nephrology Nursing Journal 2004;31(2):141. [Google Scholar]
- Hutchison A, Lanthanum Study Group. Analysis of haematology data from over 2000 dialysis patients participating in clinical trials on the new phosphate binder, lanthanum carbonate [abstract no: SP219]. Nephrology Dialysis Transplantation 2005;20(Suppl 5):v92‐3. [Google Scholar]
- Hutchison A, Lanthanum Study Group. No adverse effects of haematological parameters during lanthanum carbonate treatment in over 2000 patients [abstract no: W‐PO40068]. Nephrology 2005;10(Suppl):A297. [Google Scholar]
- Hutchison A, SPD405‐301 Lanthanum Study Group. Long‐term safety, efficacy, and tolerability of lanthanum carbonate: results from a 3.5‐year study [abstract no: W‐PO40065]. Nephrology 2005;10(Suppl 1):A297. [Google Scholar]
- Hutchison A, Webster I. Lanthanum carbonate versus calcium carbonate: effect on parathyroid hormone (PTH) levels [abstract no: F‐PO656]. Journal of the American Society of Nephrology 2003;14(Nov):205A. [Google Scholar]
- Hutchison A, Webster I. Maintained safety, tolerability and efficacy of lanthanum carbonate (Fosrenal®) during long‐term therapy in hemodialysis patients. [abstract no: SU‐PO1039]. Journal of the American Society of Nephrology 2003;14(Nov):764A. [Google Scholar]
- Hutchison A, Webster I. Safety and efficacy data for lanthanum carbonate: a summary from three studies [abstract]. 41st Congress. European Renal Association. European Dialysis and Transplantation Association; 2004 May 15‐18; Lisbon, Portugal. 2004:107.
- Hutchison A, Webster I, Gill M, Schmieder R. Safety and tolerability of lanthanum carbonate in haemodialysis patients: a 12‐month study [abstract no: W431]. Nephrology Dialysis Transplantation 2003;18(Suppl 4):684. [Google Scholar]
- Hutchison A, Lanthanum Study Group. No evidence of hepatoxicity with lanthanum carbonate ‐ clinical trial data from 2000 dialysis patients [abstract no: W‐PO40069]. Nephrology 2005;10(Suppl):A298. [Google Scholar]
- Hutchison AJ. Lanthanum carbonate (FosrenolTM), a novel, nonaluminum, noncalcium phosphate binder, is effective and well tolerated in hyperphosphatemia [abstract no: PS1‐22]. Nephrology 2003;8(Suppl 1):A29. [Google Scholar]
- Hutchison AJ, Gill M. A demographic analysis of lanthanum carbonate phase II and III studies [abstract no: 271]. 41st Congress. European Renal Association. European Dialysis and Transplantation Association; 2004 May 15‐18; Lisbon, Portugal. 2004:106‐7. [CENTRAL: CN‐00509244]
- Hutchison AJ, Maes B, Vanwalleghem J, Asmus G, Mohamed E, Schmieder R, et al. Efficacy, tolerability, and safety of lanthanum carbonate in hyperphosphatemia: A 6‐month, randomized, comparative trial versus calcium carbonate. Nephron 2005;100(1):c8‐19. [MEDLINE: ] [DOI] [PubMed] [Google Scholar]
- Hutchison AJ, Maes B, Vanwalleghem J, Asmus G, Mohamed E, Schmieder R, et al. Long‐term efficacy and tolerability of lanthanum carbonate: results from a 3‐year study. Nephron 2006;102(2):c61‐71. [MEDLINE: ] [DOI] [PubMed] [Google Scholar]
- Hutchison AJ, Lanthanum Study Group. The novel, non‐aluminium, non‐calcium phosphate binder, fosrenol, is an effective treatment for hyperphosphataemia and has a good safety profile [abstract no: SA‐PO599]. Journal of the American Society of Nephrology 2002;13(September, Program & Abstracts):385A‐6A. [CENTRAL: CN‐00445823] [Google Scholar]
- Speake M, Hutchison AJ, Webster I. Lanthanum carbonate, a novel, non‐aluminum, non‐calcium phosphate binder, is effective and well tolerated in hyperphosphatemia [abstract]. Nephrology Nursing Journal 2003;30(2):149. [CENTRAL: CN‐00644297] [Google Scholar]
- Speake M, Webster I. Long‐term safety, tolerability, and efficacy of lanthanum carbonate therapy [abstract]. Nephrology Nursing Journal 2004;31(2):143. [CENTRAL: CN‐00644295] [Google Scholar]
- Webster I. Lanthanum carbonate, a novel phosphate binder, has similar efficacy and tolerability to calcium carbonate over one year of treatment [abstract]. Nephrology Nursing Journal 2004;31(2):146. [Google Scholar]
- Webster I, Gill M. Lanthanum carbonate, a new phosphate binder, is well tolerated over a 3 year period in dialysis patients [abstract no: SP267]. 41st Congress. European Renal Association. European Dialysis and Transplantation Association; 2004 May 15‐18; Lisbon, Portugal. 2004:105. [CENTRAL: CN‐00509557]
INDEPENDENT‐CKD 2012 {published data only}
- Iorio B, Bellasi A, Pota A, Russo L, Russo D. Effect of phosphate binder therapy on mortality in pre‐dialysis patients [abstract]. Nephrology Dialysis Transplantation 2012;27(Suppl 2):ii127. [EMBASE: 70765659] [Google Scholar]
- Iorio B, Bellasi A, Russo D, INDEPENDENT Study Investigators. Mortality in kidney disease patients treated with phosphate binders: a randomized study.[Erratum appears in Clin J Am Soc Nephrol. 2012 Aug;7(8):1370‐1]. Clinical Journal of The American Society of Nephrology: CJASN 2012;7(3):487‐83. [MEDLINE: ] [DOI] [PubMed] [Google Scholar]
- Ruggeri M, Cipriani F, Bellasi A, Russo D, Iorio B. Sevelamer is cost‐saving vs. calcium carbonate in non‐dialysis‐dependent CKD patients in Italy: a patient‐level cost‐effectiveness analysis of the INDEPENDENT study. Blood Purification 2014;37(4):316‐24. [MEDLINE: ] [DOI] [PubMed] [Google Scholar]
- Russo D, Bellasi A, Pota A, Russo L, Iorio B. Effects of phosphorus‐restricted diet and phosphate‐binding therapy on outcomes in patients with chronic kidney disease. Journal of Nephrology 2015;28(1):73‐80. [MEDLINE: ] [DOI] [PubMed] [Google Scholar]
- Thompson M, Bartko‐Winters S, Bernard L, Fenton A, Hutchison C, Iorio B. Economic evaluation of sevelamer for the treatment of hyperphosphatemia in chronic kidney disease patients not on dialysis in the United Kingdom. Journal of Medical Economics 2013;16(6):744‐55. [MEDLINE: ] [DOI] [PubMed] [Google Scholar]
- Pino MD, Pons R, Rodriguez‐Carmona A, Rubio LM, Subira R. Cost‐effectiveness of sevelamer versus calcium carbonate in non‐dialysis dependent chronic kidney disease patients in Spain [Analisis coste‐efectividad de sevelamero frente a carbonato calcico en pacientes con enfermedad renal cronica no dependientes de dialisis en Espana]. Pharmacoeconomics ‐ Spanish Research Articles 2016;13(2):49‐56. [EMBASE: 610467965] [Google Scholar]
INDEPENDENT‐HD 2009 {published data only}
- Bellasi A, Cozzolino M, Russo D, Molony D, Iorio B. Cinacalcet but not vitamin D use modulates the survival benefit associated with sevelamer in the INDEPENDENT study. Clinical Nephrology 2016;86(9):113‐24. [MEDLINE: ] [DOI] [PubMed] [Google Scholar]
- Bellasi A, Cozzolino M, Russo D, Molony DA, Iorio B. Cinacalcet but not vitamin D use modulates the survival benefit associated with sevelamer in the INDEPENDENT study [abstract]. Nephrology Dialysis Transplantation 2015;30(Suppl 3):iii588. [EMBASE: 72207961] [DOI] [PubMed] [Google Scholar]
- Iorio B. In reply to 'The change history of the INDEPENDENT Study in the ClinicalTrials.gov database'. American Journal of Kidney Diseases 2014;63(1):164‐5. [MEDLINE: ] [DOI] [PubMed] [Google Scholar]
- Iorio B, Molony D, Bell C, Cucciniello E, Bellizzi V, Russo D, et al. Sevelamer versus calcium carbonate in incident hemodialysis patients: results of an open‐label 24‐month randomized clinical trial. American Journal of Kidney Diseases 2013;62(4):771‐8. [MEDLINE: ] [DOI] [PubMed] [Google Scholar]
- Iorio BR, Cucciniello E, Bellizzi V. Vascular calcification and QT interval in incident hemodialysis patients.[Erratum appears in J Nephrol. 2010 Jan‐Feb;23(1):124], [Erratum appears in J Nephrol. 2013 Mar‐Apr;26(2):419]. Journal of Nephrology 2009;22(6):694‐8. [MEDLINE: ] [PubMed] [Google Scholar]
- Molony D, Bellasi A, Bellizzi V, Russo D, Iorio B. Sevelamer attenuates CV mortality in incident hemodialysis patients: open label, randomized clinical trial of efficacy and safety (INDEPENDENT study) [abstract]. Nephrology Dialysis Transplantation 2012;27(Suppl 2):ii54. [EMBASE: 70765453] [Google Scholar]
- Obi Y, Hamano T. The change history of the INDEPENDENT Study in the ClinicalTrials.gov database. American Journal of Kidney Diseases 2014;63(1):164. [MEDLINE: ] [DOI] [PubMed] [Google Scholar]
- Ruggeri M, Bellasi A, Cipriani F, Molony D, Bell C, Russo D, et al. Erratum to: Sevelamer is cost effective versus calcium carbonate for the first‐line treatment of hyperphosphatemia in new patients to hemodialysis: a patient‐level economic evaluation of the INDEPENDENT‐HD study.[Erratum for J Nephrol. 2015 Oct;28(5):593‐602; PMID: 25027030]. Journal of Nephrology 2014;27(6):717. [MEDLINE: ] [DOI] [PubMed] [Google Scholar]
- Ruggeri M, Bellasi A, Cipriani F, Molony D, Bell C, Russo D, et al. Sevelamer is cost effective versus calcium carbonate for the first‐line treatment of hyperphosphatemia in new patients to hemodialysis: a patient‐level economic evaluation of the INDEPENDENT‐HD study.[Erratum appears in J Nephrol. 2014 Dec;27(6):717; PMID: 25098354]. Journal of Nephrology 2015;28(5):593‐602. [MEDLINE: ] [DOI] [PubMed] [Google Scholar]
Isakova 2013 {published data only}
- Isakova T, Barchi‐Chung A, Enfield G, Smith K, Vargas G, Houston J, et al. Effects of dietary phosphate restriction and phosphate binders on FGF23 Levels in CKD. Clinical Journal of The American Society of Nephrology: CJASN 2013;8(6):1009‐18. [MEDLINE: ] [DOI] [PMC free article] [PubMed] [Google Scholar]
- Isakova T, Barchi‐Chung A, Enfield G, Smith KT, Vargas GS, Houston J, et al. Effects of dietary phosphate restriction and lanthanum carbonate on fibroblast growth factor 23 in chronic kidney disease [abstract no: FR‐OR068]. Journal of the American Society of Nephrology 2012;23:45A. [Google Scholar]
Itoh 2008 {published data only}
- Itoh K, Tanaka M, Hashiguchi J, Funakoshi S, Nakano H, Kubo H, et al. Comparison of sevelamer hydrochloride with colestimide, administered alone or in combination with calcium carbonate, in patients on hemodialysis. Therapeutic Apheresis & Dialysis 2008;12(2):126‐32. [MEDLINE: ] [DOI] [PubMed] [Google Scholar]
Janssen 1995 {published data only}
- Janssen MJ, Kuy A, ter Wee PM, Boven WP. Calcium acetate versus calcium carbonate and erythropoietin dosages in haemodialysis patients. Nephrology Dialysis Transplantation 1995;10(12):2321‐4. [MEDLINE: ] [DOI] [PubMed] [Google Scholar]
Janssen 1996 {published data only}
- Janssen MJ, Kuy A, ter Wee PM, Boven WP. Aluminum hydroxide, calcium carbonate and calcium acetate in chronic intermittent hemodialysis patients. Clinical Nephrology 1996;45(2):111‐9. [MEDLINE: ] [PubMed] [Google Scholar]
Jespersen 1991 {published data only}
- Jespersen B, Jensen JD, Nielsen HK, Lauridsen IN, Andersen MJ, Poulsen JH, et al. Comparison of calcium carbonate and aluminium hydroxide as phosphate binders on biochemical bone markers, PTH(1‐84), and bone mineral content in dialysis patients. Nephrology Dialysis Transplantation 1991;6(2):98‐104. [MEDLINE: ] [DOI] [PubMed] [Google Scholar]
Kakuta 2011 {published data only}
- Kakuta T, Hyodo T, Tanaka R, Miyamoto Y, Kanai G, Suzuki H, et al. Sevelamer attenuates the progression of coronary calcification and serum pentosidine content (an AGE) by HPLC assay in haemodialysis patients [abstract no: SU‐PO569]. Journal of the American Society of Nephrology 2007;18(Abstracts Issue):708A. [Google Scholar]
- Kakuta T, Tanaka R, Hyodo T, Suzuki H, Kanai G, Nagaoka M, et al. Effect of sevelamer and calcium‐based phosphate binders on coronary artery calcification and accumulation of circulating advanced glycation end products in hemodialysis patients.[Erratum appears in Am J Kidney Dis. 2011 May;57(5):804]. American Journal of Kidney Diseases 2011;57(3):422‐31. [MEDLINE: ] [DOI] [PubMed] [Google Scholar]
Kasai 2012 {published data only}
- Kasai S, Sato K, Murata Y, Kinoshita Y. Randomized crossover study of the efficacy and safety of sevelamer hydrochloride and lanthanum carbonate in Japanese patients undergoing hemodialysis. Therapeutic Apheresis & Dialysis 2012;16(4):341‐9. [EMBASE: 2012432570] [DOI] [PubMed] [Google Scholar]
Katopodis 2006 {published data only}
- Katopodis KP, Andrikos EK, Gouva CD, Bairaktari ET, Nikolopoulos PM, Takouli LK, et al. Sevelamer hydrochloride versus aluminum hydroxide: Effect on serum phosphorus and lipids in CAPD patients. Peritoneal Dialysis International 2006;26(3):320‐7. [MEDLINE: ] [PubMed] [Google Scholar]
Ko 2010 {published data only}
- Ko YS, Ryu JW, Lee JH, Yi JH, Han SW, Kim HJ. Efficacy of lanthanum carbonate and calcium carbonate in Korean dialysis patients. Korean Journal of Nephrology 2010;29(1):64‐72. [CENTRAL: CN‐01045527] [Google Scholar]
Koiwa 2017 {published data only}
- Koiwa F, Yokoyama K, Fukagawa M, Terao A, Akizawa T. Efficacy and safety of sucroferric oxyhydroxide compared with sevelamer hydrochloride in Japanese haemodialysis patients with hyperphosphataemia: a randomized, open‐label, multicentre, 12‐week phase III study. Nephrology 2017;22(4):293‐300. [MEDLINE: ] [DOI] [PMC free article] [PubMed] [Google Scholar]
Lee 2013 {published data only}
- Lee YK, Choi HY, Shin SK, Lee HY. Effect of lanthanum carbonate on phosphate control in continuous ambulatory peritoneal dialysis patients in Korea: a randomized prospective study. Clinical Nephrology 2013;79(2):136‐42. [MEDLINE: ] [DOI] [PubMed] [Google Scholar]
Lee 2015b {published data only}
- Lee CT, Wu IW, Chiang SS, Peng YS, Shu KH, Wu MJ, et al. Effect of oral ferric citrate on serum phosphorus in hemodialysis patients: multicenter, randomized, double‐blind, placebo‐controlled study. Journal of Nephrology 2015;28(1):105‐13. [EMBASE: 2015735302] [DOI] [PubMed] [Google Scholar]
Lemos 2013 {published data only}
- Lemos MM, Watanabe R, Carvalho AB, Jancikic AD, Sanches FM, Christofalo DM, et al. Effect of rosuvastatin and sevelamer on the progression of coronary artery calcification in chronic kidney disease: a pilot study. Clinical Nephrology 2013;80(1):1‐8. [MEDLINE: ] [DOI] [PubMed] [Google Scholar]
Liabeuf 2017 {published data only}
- Liabeuf S, Bennis Y, Romezin J, Ryckelynck J, Esper N, Urena P, et al. The impact of sevelamer on gut derived uremic toxins levels: results from a multicenter, double blind, randomized, placebo controlled clinical trial [abstract]. Nephrology Dialysis Transplantation 2017;32(Suppl 3):iii199. [EMBASE: 617290697] [Google Scholar]
- Liabeuf S, Ryckelynck JP, Esper N, Urena P, Combe C, Dussol B, et al. Randomized clinical trial of sevelamer carbonate on serum klotho and fibroblast growth factor 23 in CKD. Clinical Journal of The American Society of Nephrology: CJASN 2017;12(12):1930‐40. [MEDLINE: ] [DOI] [PMC free article] [PubMed] [Google Scholar]
Lin 2010 {published data only}
- Lin YF, Chen YM, Hung KY, Chu TS, Kan WC, Huang CY, et al. Benefits of sevelamer on markers of bone turnover in Taiwanese hemodialysis patients. Journal of the Formosan Medical Association 2010;109(9):663‐72. [MEDLINE: ] [DOI] [PubMed] [Google Scholar]
- Lin YF, Chien CT, Kan WC, Chen YM, Chu TS, Hung KY, et al. Pleiotropic effects of sevelamer beyond phosphate binding in end‐stage renal disease patients: a randomized, open‐label, parallel‐group study. Clinical Drug Investigation 2011;31(4):257‐67. [MEDLINE: ] [DOI] [PubMed] [Google Scholar]
Lin 2014a {published data only}
- Lin HH, Liou HH, Wu MS, Huang CC. Factors associated with serum fetuin‐A concentrations after long‐term use of different phosphate binders in hemodialysis patients. BMC Nephrology 2016;17:33. [MEDLINE: ] [DOI] [PMC free article] [PubMed] [Google Scholar]
- Lin HH, Liou HH, Wu MS, Lin CY, Huang CC. Long‐term sevelamer treatment lowers serum fibroblast growth factor 23 accompanied with increasing serum Klotho levels in chronic haemodialysis patients. Nephrology 2014;19(11):672‐8. [MEDLINE: ] [DOI] [PubMed] [Google Scholar]
Liu 2006 {published data only}
- Huang C, Yu C, Liu Y. Effect of sevelamer on homocysteinemia and lipid profile in patients undergoing maintenance hemodialysis ‐ a randomized clinical trial [abstract no: F‐PO610]. Journal of the American Society of Nephrology 2005;16:467A. [CENTRAL: CN‐00756400] [Google Scholar]
- Liu YL, Lin HH, Yu CC, Kuo HL, Yang YF, Chou CY, et al. A comparison of sevelamer hydrochloride with calcium acetate on biomarkers of bone turnover in hemodialysis patients. Renal Failure 2006;28(8):701‐7. [MEDLINE: ] [DOI] [PubMed] [Google Scholar]
Locatelli 2013 {published data only}
- Dimkovic N. A multi‐centre, double‐blind, randomised, placebo‐controlled, multiple fixed‐dose study of colestilan (MCI‐196) versus placebo in chronic kidney disease stage 5 subjects on dialysis (CKD 5D) with hyperphosphataemia and dyslipidaemia (DL): safety results [abstract no: SAP575]. Nephrology Dialysis Transplantation 2012;27(Suppl 2):ii503‐4. [EMBASE: 70766811] [Google Scholar]
- Locatelli F, Dimkovic N, Spasovski G. Evaluation of colestilan in chronic kidney disease dialysis patients with hyperphosphataemia and dyslipidaemia: a randomized, placebo‐controlled, multiple fixed‐dose trial. Nephrology Dialysis Transplantation 2013;28(7):1874‐88. [MEDLINE: ] [DOI] [PubMed] [Google Scholar]
Locatelli 2014 {published data only}
- Locatelli F, Spasovski G, Dimkovic N, Wanner C, Dellanna F, Pontoriero G. The effects of colestilan versus placebo and sevelamer in patients with CKD 5D and hyperphosphataemia: a 1‐year prospective randomized study. Nephrology Dialysis Transplantation 2014;29(5):1061‐73. [MEDLINE: ] [DOI] [PMC free article] [PubMed] [Google Scholar]
Matsushima 2017 {published data only}
- Matsushima H, Yasuda T, Oyama A, Miyata M. Efficacy and safety of iron‐based phosphate binders, ferric citrate hydrate versus sucroferric oxyhydroxide, on hyperphosphatemia in chronic hemodialysis patients [abstract]. Nephrology Dialysis Transplantation 2017;32(Suppl 3):iii679. [EMBASE: 617290946] [Google Scholar]
Navarro‐Gonzalez 2011 {published data only}
- Navarro‐Gonzalez JF, Mora‐Fernandez C, Muros de Fuentes M, Donate‐Correa J, Cazana‐Perez V, Garcia‐Perez J. Effect of phosphate binders on serum inflammatory profile, soluble CD14, and endotoxin levels in hemodialysis patients. Clinical Journal of The American Society of Nephrology: CJASN 2011;6(9):2272‐9. [MEDLINE: ] [DOI] [PMC free article] [PubMed] [Google Scholar]
NCT00542815 {published data only}
- NCT00542815. A study of MCI‐196 in chronic kidney disease stage V subjects on dialysis with hyperphosphatemia. ClinicalTrials.gov/show/NCT00542815 (first received 12 October 2007).
NICOREN 2017 {published data only}
- Lenglet A, Liabeuf S, Esper N, Brisset S, Mansour J, Lemaire‐Hurtel AS, et al. Efficacy and safety of nicotinamide in haemodialysis patients: the NICOREN study. Nephrology Dialysis Transplantation 2017;32(5):870‐9. [MEDLINE: ] [DOI] [PubMed] [Google Scholar]
Ohtake 2013 {published data only}
- Ohtake T, Furuya R, Iwagami M, Tsutsumi D, Mochida Y, Ishioka K, et al. Lanthanum carbonate delays the progression of coronary artery calcification compared with calcium‐based phosphate binder in patients on hemodialysis [abstract]. Nephrology Dialysis Transplantation 2012;27(Suppl 2):ii229. [EMBASE: 70765964] [DOI] [PubMed] [Google Scholar]
- Ohtake T, Kobayashi S, Oka M, Furuya R, Iwagami M, Tsutsumi D, et al. Lanthanum carbonate delays progression of coronary artery calcification compared with calcium‐based phosphate binders in patients on hemodialysis: a pilot study. Journal of Cardiovascular Pharmacology & Therapeutics 2013;18(5):439‐46. [MEDLINE: ] [DOI] [PubMed] [Google Scholar]
Pratt 2007 {published data only}
- Pratt R, Smyth M. Effective reduction of serum phosphorus using carbonate, with fewer tablets than sevelamer hydrochloride [abstract no: FP486]. Nephrology Dialysis Transplantation 2007;22(Suppl 6):vi183. [Google Scholar]
PREFECT 2014 {published data only}
- Ureña‐Torres P, Prié D, Keddad K, Preston P, Wilde P, Wan H, et al. Changes in fibroblast growth factor 23 levels in normophosphatemic patients with chronic kidney disease stage 3 treated with lanthanum carbonate: results of the PREFECT study, a phase 2a, double blind, randomized, placebo‐controlled trial. BMC Nephrology 2014;15:71. [MEDLINE: ] [DOI] [PMC free article] [PubMed] [Google Scholar]
Qunibi 2011 {published data only}
- Qunibi W, Winkelmayer WC, Solomon R, Moustafa M, Kessler P, Ho CH, et al. A randomized, double‐blind, placebo‐controlled trial of calcium acetate on serum phosphorus concentrations in patients with advanced non‐dialysis‐dependent chronic kidney disease. BMC Nephrology 2011;12:9. [MEDLINE: ] [DOI] [PMC free article] [PubMed] [Google Scholar]
Riccio 2018 {published data only}
- Riccio E, Sabbatini M, Bruzzese D, Grumetto L, Marchetiello C, Amicone M, et al. Plasma p‐cresol lowering effect of sevelamer in non‐dialysis CKD patients: evidence from a randomized controlled trial. Clinical & Experimental Nephrology 2018;22(3):529‐38. [MEDLINE: ] [DOI] [PubMed] [Google Scholar]
Roxe 1989 {published data only}
- Roxe DM, Mistovich M, Barch DH. Phosphate‐binding effects of sucralfate in patients with chronic renal failure. American Journal of Kidney Diseases 1989;13(3):194‐9. [MEDLINE: ] [DOI] [PubMed] [Google Scholar]
Rudnicki 1994 {published data only}
- Rudnicki M, Hyldstrup L, Petersen LJ, Hojsted J, Tranbol I. Effect of oral calcium on noninvasive indices of bone formation and bone mass in hemodialysis patients: a randomized double‐blind placebo‐controlled study. Mineral & Electrolyte Metabolism 1994;20(3):130‐4. [MEDLINE: ] [PubMed] [Google Scholar]
Russo 2007 {published data only}
- Russo D, Miranda I, Ruocco C, Battaglia Y, Buonanno E, Manzi S, et al. The progression of coronary artery calcification in predialysis patients on calcium carbonate or sevelamer. Kidney International 2007;72(10):1255‐61. [MEDLINE: ] [DOI] [PubMed] [Google Scholar]
Sadek 2003 {published data only}
- Sadek T, Mazouz H, Bahlou H, Oprisiu R, Esper N, Esper I, et al. Sevelamer hydrochloride with or without alphacalcidol or higher dialysate calcium vs calcium carbonate in dialysis patients: an open‐label, randomized study. Nephrology Dialysis Transplantation 2003;18(3):582‐9. [MEDLINE: ] [DOI] [PubMed] [Google Scholar]
Saif 2007 {published data only}
- Saif I, Halim A, Altaf A, Saif M, Khalid M, Ahmad D, et al. Comparison of calcium acetate with calcium carbonate as phosphate binder in patients on maintenance haemodialysis. Journal of Ayub Medical College, Abbottabad: JAMC 2007;19(4):26‐8. [MEDLINE: ] [PubMed] [Google Scholar]
Seifert 2013 {published data only}
- Seifert ME, las Fuentes L, Davila‐Roman VG, Hruska KA. Early intervention in the CKD‐MDB affects vascular function [abstract no: LB‐PO3163]. Journal of the American Society of Nephrology 2011;22(Abstracts):7B. [Google Scholar]
- Seifert ME, las Fuentes L, Rothstein M, Dietzen DJ, Bierhals AJ, Cheng SC, et al. Effects of phosphate binder therapy on vascular stiffness in early‐stage chronic kidney disease. American Journal of Nephrology 2013;38(2):158‐67. [MEDLINE: ] [DOI] [PMC free article] [PubMed] [Google Scholar]
Sezer 2010 {published data only}
- Sezer S, Karakan S, Acar NO. Sevelamer improves serum electrolyte profile, metabolic and cardiovascular markers and survival in ESRD patients on hemodialysis treatment [abstract no: Sa473]. NDT Plus 2010;3(Suppl 3):iii196. [EMBASE: 70483939] [Google Scholar]
Shahbazian 2011 {published data only}
- Shahbazian H, Zafar MA, Ghorbani A, Abbaspour MR, Belladi Musavi SS, Hayati F, et al. Oral nicotinamide reduces serum phosphorus, increases HDL, and induces thrombocytopenia in hemodialysis patients: a double‐blind randomized clinical trial. Nefrologia 2011;31(1):58‐65. [MEDLINE: ] [DOI] [PubMed] [Google Scholar]
Shaheen 2004 {published data only}
- Shaheen A, Akeel NM, Badawi LS, Souqiyyeh MZ. Efficacy and safety of sevelamer: comparison with calcium carbonate in the treatment of hyperphosphatemia in hemodialysis patients. Saudi Medical Journal 2004;25(6):785‐91. [MEDLINE: ] [PubMed] [Google Scholar]
Shibata 2007 {published data only}
- Shibata K, Iwamoto T, Murakami T, Hirawa S, Yasuda G, Toya Y, et al. A comparative study of the effects on pulse wave velocity (PWV) in hemodialysis (HD) patients treated by sevelamer with low dose calcium carbonate or calcium carbonate alone [abstract no: SAP245]. Nephrology Dialysis Transplantation 2007;22(Suppl 6):vi245. [Google Scholar]
- Shibata K, Iwamoto T, Ono S, Murakami T, Yanagi M, Koguchi N, et al. A comparative study of the effects on pulse wave velocity (PWV) in hemodialysis (HD) patients treated by sevelamer with low dose calcium carbonate or calcium carbonate alone. Three‐years follow up [abstract no: SU500]. World Congress of Nephrology; 2009 May 22‐26; Milan, Italy. 2009.
Shigematsu 2008 {published data only}
- Shigematsu T, Lanthanum Carbonate Group. Multicenter prospective randomized, double‐blind comparative study between lanthanum carbonate and calcium carbonate as phosphate binders in Japanese hemodialysis patients with hyperphosphatemia. Clinical Nephrology 2008;70(5):404‐10. [MEDLINE: ] [DOI] [PubMed] [Google Scholar]
SLO‐NIACIN 2013 {published data only}
- Tan K, Vardesh D, Raman P, Petrie J. The SLO‐NIACIN trial: a double‐blind placebo controlled trial of low dose slow‐release niacin to lower phosphate in haemodialysis patients [abstract no: 010]. Nephrology 2013;18(Suppl 1):17. [Google Scholar]
Song 2014 {published data only}
- Song FR, Cheng H, Zhao DM, Yu J, Gao Y. Effects of lanthanum carbonate on serum calcium and phosphorus of CAPD patients with chronic renal failure receiving calcitriol pulse therapy due to secondary hyperparathyroidism. Chinese Journal of Evidence‐Based Medicine 2014;14(6):651‐4. [EMBASE: 2014574871] [Google Scholar]
Soriano 2013 {published data only}
- Soriano S, Ojeda R, Rodriguez M, Almaden Y, Rodriguez M, Martin‐Malo A, et al. The effect of phosphate binders, calcium and lanthanum carbonate on FGF23 levels in chronic kidney disease patients. Clinical Nephrology 2013;80(1):17‐22. [MEDLINE: ] [DOI] [PubMed] [Google Scholar]
Spasovski 2006 {published data only}
- Sikole A, Spasovski G, Gelev S, Amitov V, Stojcev N, Grozdanovski R. Lanthanum carbonate ‐ a novel phosphate binder in maintenance dialysis patients [abstract no: SP228]. Nephrology Dialysis Transplantation 2005;20(Suppl 5):v95‐6. [Google Scholar]
- Sikole A, Spasovski G, Gelev S, Grozdanovski R, Amitov V, D'Haese P, et al. The use of lanthanum carbonate as a novel phosphate binder in maintenance dialysis patients [abstract no: M63]. Nephrology Dialysis Transplantation 2002;17(Suppl 12):67. [CENTRAL: CN‐00509481] [Google Scholar]
- Spasovski G, Sikole A, Gelev S, Grozdanovski R, Amitov V, D'Haese P, et al. The impact of lanthanum carbonate and calcium carbonate on renal bone disease in dialysis patients ‐ single center experience [abstract no: w436]. Nephrology Dialysis Transplantation 2003;18(Suppl 4):685‐6. [CENTRAL: CN‐00447817] [Google Scholar]
- Spasovski G, Sikole A, Gelev S, Grozdanovski R, Amitov V, D'Haese PC, et al. The beneficial effect of lanthanum carbonate on low turnover bone disease in dialysis patients [abstract no: P40]. International Journal of Artificial Organs 2003;26(7):630. [CENTRAL: CN‐00583691] [Google Scholar]
- Spasovski G, Sikole A, Gelev S, Masin J, Freemont T, Webster I, et al. The evolution of renal bone disease in dialysis patients ‐ comparative effects of lanthanum carbonate and calcium carbonate treatment [abstract]. 41st Congress. European Renal Association. European Dialysis and Transplantation Association; 2004 May 15‐18; Lisbon, Portugal. 2004:105‐6. [CENTRAL: CN‐00509488]
- Spasovski G, Sikole A, Gelev S, Masin‐Spasovska J, Freemont T, Grozdanovski R, et al. Comparative, bone biopsy‐based, 3 years follow‐up study in dialysis patients during and after 1 year treatment with lanthanum carbonate [abstract no: TO14]. Nephrology Dialysis Transplantation 2005;20(6 Suppl):v376. [CENTRAL: CN‐00583693] [Google Scholar]
- Spasovski G, Sikole A, Gelev S, Masin‐Spasovska J, Polenakovic B, Webster I, et al. The evolution of renal osteodystrophy in dialysis patients: comparative effects of lanthanum carbonate and calcium carbonate [abstract no: SA‐PO842]. Journal of the American Society of Nephrology 2005;16(Oct):741A. [CENTRAL: CN‐00583697] [Google Scholar]
- Spasovski GB, Sikole A, Gelev S, Grozdanovski R, Amitov V, D'Haese PC, et al. Lanthanum carbonate in the management of renal osteodystrophy in dialysis patients [abstract]. Hemodialysis International 2003;7(1):87. [CENTRAL: CN‐00461778] [Google Scholar]
- Spasovski GB, Sikole A, Gelev S, Masin‐Spasovska J, Freemont T, Webster I, et al. Evolution of bone and plasma concentration of lanthanum in dialysis patients before, during 1 year of treatment with lanthanum carbonate and after 2 years of follow‐up. Nephrology Dialysis Transplantation 2006;21(8):2217‐24. [MEDLINE: ] [DOI] [PubMed] [Google Scholar]
Spiegel 2007 {published data only}
- Spiegel DM, Farmer B. Long‐term effects of magnesium carbonate on coronary artery calcification and bone mineral density in hemodialysis patients: a pilot study. Hemodialysis International 2009;13(4):453‐9. [MEDLINE: ] [DOI] [PubMed] [Google Scholar]
- Spiegel DM, Farmer B, Chonchol M. Magnesium carbonate ‐ an effective phosphate binder [abstract no: 152]. American Journal of Kidney Diseases 2006;47(4):A56. [CENTRAL: CN‐00653706] [DOI] [PubMed] [Google Scholar]
- Spiegel DM, Farmer B, Smits G, Chonchol M. Magnesium carbonate is an effective phosphate binder for chronic hemodialysis patients: a pilot study. Journal of Renal Nutrition 2007;17(6):416‐22. [MEDLINE: ] [DOI] [PubMed] [Google Scholar]
Sprague 2009a {published data only}
- Sprague S, Finn W, Abboud H, Qiu P, SPD405‐206 Study Investigators. Lanthanum carbonate reduces phosphate burden in patients with CKD stages 3 and 4: results from a randomized multicenter trial [abstract no: 252]. American Journal of Kidney Diseases 2008;51(4):A90. [CENTRAL: CN‐00757113] [Google Scholar]
- Sprague SM, Abboud H, Qui P, Dauphin M, Zhang P, Finn W. Lanthanum carbonate reduces phosphorus burden in patients with CKD stages 3 and 4: a randomized trial. Clinical Journal of The American Society of Nephrology: CJASN 2009;4(1):178‐85. [MEDLINE: ] [DOI] [PMC free article] [PubMed] [Google Scholar]
- Sprague SM, Finn WF, Qiu P, Study 206 Investigators. Hyperphosphatemia in chronic kidney disease stages 3 and 4: findings from a randomized, multi‐center trial [abstract no: PUB442]. Journal of the American Society of Nephrology 2007;18(Abstracts Issue):927A. [CENTRAL: CN‐00756891] [Google Scholar]
Takahara 2014 {published data only}
- Takahara Y, Matsuda Y, Takahashi S, Shigematsu T, Lanthanum Carbonate Study Group. Efficacy and safety of lanthanum carbonate in pre‐dialysis CKD patients with hyperphosphatemia: a randomized trial. Clinical Nephrology 2014;82(3):181‐90. [MEDLINE: ] [DOI] [PubMed] [Google Scholar]
Tielmans 1990 {published data only}
- Tielmans C, Knoop C, Doutrelepont JM, Timmermans D, Even‐Adin D, Vanherweghem JL. Superiority of calcium acetate (ACET) over carbonate (CARB) to bind phosphorus (P) in hemodialysis patients (HDP) [abstract]. 11th International Congress of Nephrology; 1990 Jul 15‐20; Tokyo, Japan. 1990:219A.
Toida 2012 {published data only}
- Toida T, Fukudome K, Fujimoto S, Yamada K, Sato Y, Chiyotanda S, et al. Effect of lanthanum carbonate vs. calcium carbonate on serum calcium in hemodialysis patients: a crossover study. Clinical Nephrology 2012;78(3):216‐23. [MEDLINE: ] [DOI] [PubMed] [Google Scholar]
Toussaint 2009 {published data only}
- Toussaint N, Lau K, Polkinghorne K, Kerr P. Attenuation of aortic calcification with lanthanum carbonate vs calcium‐based phosphate binders in haemodialysis ‐ a randomized controlled trial [abstract no: 167]. Nephrology 2010;15(Suppl 4):70. [DOI] [PubMed] [Google Scholar]
- Toussaint ND, Lau KK, Polkinghorne KR, Kerr PG. Attenuation of aortic calcification with lanthanum carbonate versus calcium‐based phosphate binders in haemodialysis: a pilot randomized controlled trial. Nephrology 2011;16(3):290‐8. [MEDLINE: ] [DOI] [PubMed] [Google Scholar]
- Toussaint ND, Lau KK, Strauss BJ, Polkinghorne KR, Kerr PG. Determination and validation of aortic calcification measurement from lateral bone densitometry in dialysis patients. Clinical Journal of The American Society of Nephrology: CJASN 2009;4(1):119‐27. [MEDLINE: ] [DOI] [PMC free article] [PubMed] [Google Scholar]
Tzanakis 2014 {published data only}
- Tzanakis IP, Stamataki EE, Papadaki AN, Giannakis N, Damianakis NE, Oreopoulos DG. Magnesium retards the progress of the arterial calcifications in hemodialysis patients: a pilot study. International Urology & Nephrology 2014;46(11):2199‐205. [MEDLINE: ] [DOI] [PubMed] [Google Scholar]
Vlassara 2012 {published data only}
- Vlassara H, Uribarri J, Cai W, Goodman S, Pyzik R, Post J, et al. Effects of sevelamer on HbA1c, inflammation, and advanced glycation end products in diabetic kidney disease. Clinical Journal of The American Society of Nephrology: CJASN 2012;7(6):934‐42. [MEDLINE: ] [DOI] [PMC free article] [PubMed] [Google Scholar]
- Yubero‐Serrano EM, Woodward M, Poretsky L, Vlassara H, Striker GE. Effects of sevelamer carbonate on advanced glycation end products and antioxidant/pro‐oxidant status in patients with diabetic kidney disease. Clinical Journal of The American Society of Nephrology: CJASN 2015;10(5):759‐66. [MEDLINE: ] [DOI] [PMC free article] [PubMed] [Google Scholar]
Wada 2014 {published data only}
- Wada K, Wada Y. Evaluation of aortic calcification with lanthanum carbonate vs. calcium‐based phosphate binders in maintenance hemodialysis patients with type 2 diabetes mellitus: an open‐label randomized controlled trial. Therapeutic Apheresis & Dialysis 2014;18(4):353‐60. [MEDLINE: ] [DOI] [PubMed] [Google Scholar]
Wang 2015b {published data only}
- Wang XH, Zhang X, Mu CJ, He Y, Peng QP, Yang GS, et al. Effects of lanthanum carbonate on vascular calcification in elderly maintenance hemodialysis patients. Journal of Huazhong University of Science and Technology. Medical Sciences 2015;35(4):508‐13. [MEDLINE: ] [DOI] [PubMed] [Google Scholar]
Yokoyama 2014 {published data only}
- Yokoyama K, Hirakata H, Akiba T, Fukagawa M, Nakayama M, Sawada K, et al. Ferric citrate hydrate for the treatment of hyperphosphatemia in nondialysis‐dependent CKD. Clinical Journal of The American Society of Nephrology: CJASN 2014;9(3):543‐52. [MEDLINE: ] [DOI] [PMC free article] [PubMed] [Google Scholar]
Yokoyama 2014a {published data only}
- Yokoyama K, Akiba T, Fukagawa M, Nakayama M, Sawada K, Kumagai Y, et al. A randomized trial of JTT‐751 versus sevelamer hydrochloride in patients on hemodialysis. Nephrology Dialysis Transplantation 2014;29(5):1053‐60. [MEDLINE: ] [DOI] [PubMed] [Google Scholar]
Young 2009a {published data only}
- Young DO, Cheng SC, Delmez JA, Coyne DW. The effect of oral niacinamide on plasma phosphorus levels in peritoneal dialysis patients. Peritoneal Dialysis International 2009;29(5):562‐7. [MEDLINE: ] [PubMed] [Google Scholar]
Zhao 2014 {published data only}
- Zhao H, Wang J, Zhao DM, Dong YM, Gao Y. Efficacy of sevelamer carbonate for hyperphosphatemia in patients with end‐stage renal disease: a randomized controlled trial. Chinese Journal of Evidence‐Based Medicine 2014;14(11):1293‐8. [EMBASE: 2014948885] [Google Scholar]
Zwiech 2011 {published data only}
- Zwiech R, Dryja P, Lacina D, Kroliczak V, Chrul S, Kacprzyk F. The influence of short‐term magnesium carbonate treatment on calcium‐phosphorus balance in dialysis patients [Wplyw krotkoterminowego leczenia weglanem magnezu na gospodarke wapniowo‐fosforanowa u chorych przewlekle hemodializowanych]. Wiadomosci Lekarskie 2011;64(1):9‐14. [MEDLINE: ] [PubMed] [Google Scholar]
References to studies excluded from this review
Abraham 2012a {published data only}
- Abraham G, Kher V, Saxena S, Jayakumar M, Chafekar D, Pargaonkar P, et al. Sevelamer carbonate experience in Indian end stage renal disease patients. Indian Journal of Nephrology 2012;22(3):189‐92. [EMBASE: 2012450093] [DOI] [PMC free article] [PubMed] [Google Scholar]
Ahmadi 2012 {published data only}
- Ahmadi F, Shamekhi F, Lessan‐Pezeshki M, Khatami MR. Comparison of efficacy of the phosphate binders nicotinic acid and sevelamer hydrochloride in hemodialysis patients. Saudi Journal of Kidney Diseases & Transplantation 2012;23(5):934‐8. [MEDLINE: ] [DOI] [PubMed] [Google Scholar]
Akizawa 2014 {published data only}
- Akizawa T, Origasa H, Kameoka C, Kaneko Y, Kanoh H. Dose‐finding study of bixalomer in patients with chronic kidney disease on hemodialysis with hyperphosphatemia: a double‐blind, randomized, placebo‐controlled and sevelamer hydrochloride‐controlled open‐label, parallel group study. Therapeutic Apheresis & Dialysis 2014;18 Suppl 2:24‐32. [MEDLINE: ] [DOI] [PubMed] [Google Scholar]
Akizawa 2014b {published data only}
- Akizawa T, Tsuruta Y, Okada Y, Miyauchi Y, Suda A, Kasahara H, et al. Effect of chitosan chewing gum on reducing serum phosphorus in hemodialysis patients: a multi‐center, randomized, double‐blind, placebo‐controlled trial. BMC Nephrology 2014;15:98. [MEDLINE: ] [DOI] [PMC free article] [PubMed] [Google Scholar]
Al‐Baaj 2005 {published data only}
- Al‐Baaj F, Hutchison AJ, UK Lanthanum Study Group. Lanthanum carbonate: a novel non‐calcaemic phosphate binder in dialysis patients [abstract]. Journal of the American Society of Nephrology 2000;11(Sept):557A. [Google Scholar]
- Al‐Baaj F, Speake M, Hutchinson J. Control of serum phosphate by oral lanthanum carbonate in patients undergoing haemodialysis and continuous ambulatory peritoneal dialysis in a short‐term, placebo‐controlled study. Nephrology Dialysis Transplantation 2005;20(4):775‐82. [MEDLINE: ] [DOI] [PubMed] [Google Scholar]
- Hutchison AJ, Gill M, Copley JB, Poole L, Wilson RJ. Lanthanum carbonate versus placebo for management of hyperphosphatemia in patients undergoing peritoneal dialysis: a subgroup analysis of a phase 2 randomized controlled study of dialysis patients. BMC Nephrology 2013;14:40. [MEDLINE: ] [DOI] [PMC free article] [PubMed] [Google Scholar]
- Hutchison AJ, UK Lanthanum Study Group. Lanthanum carbonate: a novel non‐calcaemic phosphate binder in dialysis patients. [abstract]. Nephrology Dialysis Transplantation 2000;15(9):A113. [CENTRAL: CN‐00550562] [Google Scholar]
Babarykin 2004 {published data only}
- Babarykin D, Adamsone I, Amerika D, Spudass A, Moisejev V, Berzina N, et al. Calcium‐enriched bread for treatment of uremic hyperphosphatemia. Journal of Renal Nutrition 2004;14(3):149‐56. [MEDLINE: ] [DOI] [PubMed] [Google Scholar]
Bigi 2003 {published data only}
- Bigi MC, Andrulli S, Pozzoni P, Locatelli F. Role of chetoanalogues on calcium‐phosphate metabolism and anemia of haemodialysis patients: a pilot controlled randomized study [abstract]. Nephrology Dialysis Transplantation 2003;18(Suppl 4):680. [CENTRAL: CN‐00444433] [Google Scholar]
Bleskestad 2012 {published data only}
- Bleskestad IH, Bergrem H, Hartmann A, Godang K, Goransson LG. Fibroblast growth factor 23 and parathyroid hormone after treatment with active vitamin D and sevelamer carbonate in patients with chronic kidney disease stage 3b, a randomized crossover trial. BMC Nephrology 2012;13:49. [MEDLINE: ] [DOI] [PMC free article] [PubMed] [Google Scholar]
Block 2013 {published data only}
- Block GA, Persky MS, Shamblin BM, Baltazar MF, Comelli MC. Effect of chitosan loaded chewing gum on serum phosphate in CKD [abstract]. Nephrology Dialysis Transplantation 2013;28(Suppl 1):i156. [EMBASE: 71075449] [Google Scholar]
- Block GA, Persky MS, Shamblin BM, Baltazar MF, Singh B, Sharma A, et al. Effect of salivary phosphate‐binding chewing gum on serum phosphate in chronic kidney disease. Nephron 2013;123(1‐2):93‐101. [MEDLINE: ] [DOI] [PubMed] [Google Scholar]
Borrego 2000 {published data only}
- Borrego J, Perez del Barrio P, Serrano P, Garcia Cortes MJ, Sanchez Perales MC, Borrego FJ, et al. A comparison of phosphorus‐chelating effect of calcium carbonate versus calcium acetate before dialysis [Comparacion del efecto quelante del fosforo de carbonato vs acetato calcico en predialisis]. Nefrologia 2000;20(4):348‐54. [MEDLINE: ] [PubMed] [Google Scholar]
Chertow 1997 {published data only}
- Chertow GM, Burke SK, Lazarus MJ, Stenzel KH, Wombolt D, Goldberg D, et al. Poly(allylamine hydrochloride) (RenaGel): a noncalcemic phosphate binder for the treatment of hyperphosphatemia in chronic renal failure. American Journal of Kidney Diseases 1997;29(1):66‐71. [MEDLINE: ] [DOI] [PubMed] [Google Scholar]
Chiang 2005 {published data only}
- Chiang SS, Chen JB, Yang WC. Lanthanum carbonate (Fosrenol) efficacy and tolerability in the treatment of hyperphosphatemic patients with end‐stage renal disease. Clinical Nephrology 2005;63(6):461‐70. [MEDLINE: ] [DOI] [PubMed] [Google Scholar]
- Webster I, Loo B. The novel phosphate binder lanthanum carbonate is preferred to conventional agents in a Chinese population [abstract]. Nephrology Nursing Journal 2004;31(2):142. [Google Scholar]
- Yang W, Chiang S, Chen J. Efficacy and safety of lanthanum carbonate in the treatment of hyperphosphatemia in Chinese chronic renal failure patients [abstract no: F‐PO652]. Journal of the American Society of Nephrology 2003;14(Nov):204A. [CENTRAL: CN‐00583787] [Google Scholar]
Chiang 2007 {published data only}
- Chiang S, Chen S. A randomized, double‐blind, placebo‐controlled, dose‐ranging study of the effects of ferric citrate in patients undergoing hemodialysis [abstract no: SaP381]. Nephrology Dialysis Transplantation 2007;22(Suppl 6):vi362. [CENTRAL: CN‐00747288] [Google Scholar]
Chow 2007 {published data only}
- Chow KM, Szeto CC, Kwan BC, Leung CB, Li PK. Sevelamer treatment strategy in peritoneal dialysis patients: conventional dose does not make best use of resources. Journal of Nephrology 2007;20(6):674‐82. [MEDLINE: ] [PubMed] [Google Scholar]
d'Almeida Filho 2000 {published data only}
- d'Almeida Filho EJ, Cruz EA, Hoette M, Ruzany F, Keen LN, Lugon JR. Calcium acetate versus calcium carbonate in the control of hyperphosphatemia in hemodialysis patients. Revista Paulista de Medicina [Sao Paulo Medical Journal] 2000;118(6):179‐84. [MEDLINE: ] [DOI] [PMC free article] [PubMed] [Google Scholar]
Dwyer 2013 {published data only}
- Dwyer JP, Sika M, Schulman G, Chang IJ, Anger M, Smith M, et al. Dose‐response and efficacy of ferric citrate to treat hyperphosphatemia in hemodialysis patients: a short‐term randomized trial. American Journal of Kidney Diseases 2013;61(5):759‐66. [MEDLINE: ] [DOI] [PubMed] [Google Scholar]
El Borolossy 2016 {published data only}
- Borolossy R, Wakeel LM, Hakim I, Sabri N. Efficacy and safety of nicotinamide in the management of hyperphosphatemia in pediatric patients on regular hemodialysis. Pediatric Nephrology 2016;31(2):289‐96. [MEDLINE: ] [DOI] [PubMed] [Google Scholar]
Emmett 1991 {published data only}
- Emmett M, Sirmon MD, Kirkpatrick GW, Nolan C, Schmitt GW, Cleveland MB. Calcium acetate control of serum phosphorus in hemodialysis patients. American Journal of Kidney Diseases 1991;17(5):544‐50. [MEDLINE: ] [DOI] [PubMed] [Google Scholar]
- Emmett M, Sirmon MD, Kirkpatrick WG, Nolan CR, Schmitt GW, Cleveland MB. Calcium acetate control of serum phosphorus in hemodialysis patients [abstract]. Kidney International 1990;37(1):449. [CENTRAL: CN‐00583353] [DOI] [PubMed] [Google Scholar]
Fabrizi 1996 {published data only}
- Fabrizi F, Bacchini G, Filippo S, Pontoriero G, Locatelli F. Intradialytic calcium balances with different calcium dialysate levels. Effects on cardiovascular stability and parathyroid function. Nephron 1996;72(4):530‐5. [MEDLINE: ] [DOI] [PubMed] [Google Scholar]
Fan 2009 {published data only}
- Fan S, Ross C, Mitra S, Kalra P, Heaton J, Hunter J, et al. A randomized, crossover design study of sevelamer carbonate powder and sevelamer hydrochloride tablets in chronic kidney disease patients on haemodialysis. Nephrology Dialysis Transplantation 2009;24(12):3794‐9. [MEDLINE: ] [DOI] [PMC free article] [PubMed] [Google Scholar]
Finn 2004 {published data only}
- Finn WF, Joy MS. Lanthanum carbonate (FosrenolTM) significantly reduces serum phosphorus levels and calcium X phosphorus product values in a dose‐ranging study [abstract no: PS1‐20]. Nephrology 2003;8(Suppl 1):A29. [Google Scholar]
- Finn WF, Joy MS, Hladik G, Lanthanum Study Group. Efficacy and safety of lanthanum carbonate for reduction of serum phosphorus in patients with chronic renal failure receiving hemodialysis. Clinical Nephrology 2004;62(3):193‐201. [MEDLINE: ] [DOI] [PubMed] [Google Scholar]
- Finn WF, Joy MS, Webster I, Gill M. Long‐term treatment with lanthanum carbonate (Fosrenol) is safe and effective in haemodialysis patients [abstract no:W434]. Nephrology Dialysis Transplantation 2003;18(Suppl 4):685. [Google Scholar]
- Finn WF, Joy MS, LAM‐308 Study Group. A long‐term, open‐label extension study on the safety of treatment with lanthanum carbonate, a new phosphate binder, in patients receiving hemodialysis. Current Medical Research & Opinion 2005;21(5):657‐64. [MEDLINE: ] [DOI] [PubMed] [Google Scholar]
Fischer 2006 {published data only}
- Fischer D, Cline K, Plone M, Dillon M, Burke S, Blair A. A randomized, cross‐over study to compare once a day with three times per day sevelamer dosing [abstract no: SP221]. Nephrology Dialysis Transplantation 2005;20(Suppl 5):v93. [Google Scholar]
- Fischer D, Cline K, Plone MA, Dillon M, Burke SK, Blair AT. Results of a randomized crossover study comparing once daily and thrice‐daily sevelamer dosing. American Journal of Kidney Diseases 2006;48(3):437‐44. [MEDLINE: ] [DOI] [PubMed] [Google Scholar]
FORESEE 2008 {published data only}
- Mehrotra R. A new formulation of lanthanum carbonate is preferred by patients and physicians [abstract no: SP396]. Nephrology Dialysis Transplantation 2006;21(Suppl 4):iv147. [CENTRAL: CN‐00653769] [Google Scholar]
- Mehrotra R. Efficacy and safety of higher‐strength lanthanum carbonate [abstract no: F‐PO095]. Journal of the American Society of Nephrology 2006;17(Abstracts):356A. [CENTRAL: CN‐00653768] [Google Scholar]
- Mehrotra R. Patient and physician preference and satisfaction with a new formulation of lanthanum carbonate (LC) [abstract no: SA‐PO803]. Journal of the American Society of Nephrology 2005;16:732A. [CENTRAL: CN‐00653767] [Google Scholar]
- Mehrotra R. Preference and satisfaction with reformulated higher‐dosage strength lanthanum carbonate [abstract no: F‐PO094]. Journal of the American Society of Nephrology 2006;17(Abstracts):356A. [CENTRAL: CN‐00653770] [Google Scholar]
- Mehrotra R, Martin KJ, Fishbane S, Sprague SM, Zeig S, Anger M, et al. Higher strength lanthanum carbonate provides serum phosphorus control with a low tablet burden and is preferred by patients and physicians: a multicenter study. Clinical Journal of the American Society of Nephrology: CJASN 2008;3(5):1437‐45. [MEDLINE: ] [DOI] [PMC free article] [PubMed] [Google Scholar]
Friedrich 2006 {published data only}
- Friedrich B, Lang F, Risler T, Jahn MH. Efficacy of aluminum hydrochloride and aluminum hydroxide of lowering plasma phosphate concentrations in patients with chronic renal insufficiency. Nieren und Hochdruckkrankheiten 2006;35(4):127‐31. [EMBASE: 2006210954] [Google Scholar]
Fukagawa 2014 {published data only}
- Fukagawa M, Kasuga H, Joseph D, Sawata H, Junge G, Moore A, et al. Efficacy and safety of SBR759, a novel calcium‐free, iron (III)‐based phosphate binder, versus placebo in chronic kidney disease stage v Japanese patients on maintenance renal replacement therapy. Clinical & Experimental Nephrology 2014;18(1):135‐43. [MEDLINE: ] [DOI] [PubMed] [Google Scholar]
- Junge G, Akiba T, Balfour A, Bock AH, Schwende H, Fukagawa M. A double‐blind, randomized, placebo‐controlled multicenter trial to compare the phosphate lowering efficacy of different doses of the iron‐based phosphate binder SBR759 to placebo [abstract no: LB‐PO3152]. Journal of the American Society of Nephrology 2011;22(Abstracts):4B. [Google Scholar]
Hertel 2015 {published data only}
- Hertel J, Locatelli F, Spasovski G, Dimkovic N, Wanner C. Randomized, double‐blind, placebo‐controlled, withdrawal study of colestilan after dose titration in chronic kidney disease dialysis patients with hyperphosphatemia. Nephron 2015;130(4):229‐38. [MEDLINE: ] [DOI] [PubMed] [Google Scholar]
Hill 2013 {published data only}
- Hill KM, Martin BR, Wastney ME, McCabe GP, Moe SM, Weaver CM, et al. Oral calcium carbonate affects calcium but not phosphorus balance in stage 3‐4 chronic kidney disease. Kidney International 2013;83(5):959‐66. [MEDLINE: ] [DOI] [PMC free article] [PubMed] [Google Scholar]
How 2011 {published data only}
- How PP, Anattiwong P, Mason DL, Arruda JA, Lau AH. Phosphate‐binding efficacy of crushed vs. chewed lanthanum carbonate in hemodialysis patients. Hemodialysis International 2011;15(1):95‐9. [EMBASE: 2011063917] [DOI] [PubMed] [Google Scholar]
Ibrahim 2013 {published data only}
- Ibrahim FH, Fadhlina NZ, Ng EK, Thong KM, Goh BL, Sulaiman DM, et al. A randomized, open‐label, crossover design study to compare the safety and efficacy of sevelamer carbonate versus calcium carbonate in the treatment of hyperphosphataemia in patients with chronic kidney disease on dialysis [abstract]. Nephrology Dialysis Transplantation 2013;28(Suppl 1):i470. [EMBASE: 71076459] [Google Scholar]
Isakova 2011 {published data only}
- Isakova T, Gutierrez O, Smith K, Epstein M, Patel N, Juppner H, et al. Short‐term effect of dietary phosphorus restriction and lanthanum carbonate on FGF23 in chronic kidney disease patients [abstract no: 137]. American Journal of Kidney Diseases 2010;55(4):B66. [Google Scholar]
- Isakova T, Gutierrez OM, Smith K, Epstein M, Keating LK, Juppner H, et al. Pilot study of dietary phosphorus restriction and phosphorus binders to target fibroblast growth factor 23 in patients with chronic kidney disease. Nephrology Dialysis Transplantation 2011;26(2):584‐91. [MEDLINE: ] [DOI] [PMC free article] [PubMed] [Google Scholar]
Ittel 1991 {published data only}
- Ittel TH, Schfer C, Schmitt H, Gladziwa U, Sieberth HG. Calcium carbonate as a phosphate binder in dialysis patients: evaluation of an enteric‐coated preparation and effect of additional Aluminium hydroxide on hyperaluminaemia. Klinische Wochenschrift 1991;69(2):59‐67. [MEDLINE: ] [DOI] [PubMed] [Google Scholar]
Joy 1999 {published data only}
- Finn W, Joy M, Webster I, Gill M. Lanthanum carbonate (fosrenol) causes significant reductions in serum phosphorus and ca x p product in a dose‐ranging, placebo‐controlled study [abstract no: w437]. Nephrology Dialysis Transplantation 2003;18(Suppl 4):686. [CENTRAL: CN‐00445339] [Google Scholar]
- Finn WF, Joy MS, Hladik GA, Lanthanum Study Group. Results of a randomized dose‐ranging, placebo controlled study of lanthanum carbonate for reduction of serum phosphate in chronic renal failure patients receiving hemodialysis [abstract]. Journal of the American Society of Nephrology 1999;10(Program & Abstracts):261A. [CENTRAL: CN‐00550727] [Google Scholar]
- Joy MS, Hladik GA, Finn WF, Lanthanum Study Group. Safety of an investigational phosphate binder (lanthanum carbonate) in hemodialysis patients [abstract]. Journal of the American Society of Nephrology 1999;10(Program & Abstracts):263A. [CENTRAL: CN‐00583642] [Google Scholar]
Joy 2003 {published data only}
- Finn WF, Joy MS, Webster I. Efficacy and tolerability of lanthanum carbonate, a new phosphate binder for the treatment of hyperphosphatemia [abstract]. Nephrology Nursing Journal 2003;30(2):150. [DOI] [PubMed] [Google Scholar]
- Finn WF, Joy MS, Webster I. Lanthanum carbonate, a novel phosphate binder, is effective and has a good safety profile in the long‐term treatment of hyperphosphatemia in end‐stage renal disease [abstract]. Nephrology Nursing Journal 2003;30(2):151. [Google Scholar]
- Finn WF, Joy MS, LAM‐308 Study Group. A long‐term, open‐label extension study on the safety of treatment with lanthanum carbonate, a new phosphate binder, in patients receiving hemodialysis. Current Medical Research & Opinion 2005;21(5):657‐64. [MEDLINE: ] [DOI] [PubMed] [Google Scholar]
- Joy MS, Finn WF, LAM‐302 Study Group. Randomized, double‐blind, placebo‐controlled, dose‐titration, phase III study assessing the efficacy and tolerability of lanthanum carbonate: a new phosphate binder for the treatment of hyperphosphatemia. American Journal of Kidney Diseases 2003;42(1):96‐107. [MEDLINE: ] [DOI] [PubMed] [Google Scholar]
Kalil 2012 {published data only}
- Kalil RS, Flanigan M, Stanford W, Haynes WG. Dissociation between progression of coronary artery calcification and endothelial function in hemodialysis patients: a prospective pilot study. Clinical Nephrology 2012;78(1):1‐9. [MEDLINE: ] [DOI] [PMC free article] [PubMed] [Google Scholar]
Koiwa 2005 {published data only}
- Koiwa F, Kazama JJ, Tokumoto A, Onoda N, Kato H, Okada T, et al. Sevelamer hydrochloride and calcium bicarbonate reduce serum fibroblast growth factor 23 levels in dialysis patients. Therapeutic Apheresis & Dialysis 2005;9(4):336‐9. [DOI] [PubMed] [Google Scholar]
Koiwa 2005a {published data only}
- Koiwa F, Onoda N, Kato H, Tokumoto A, Okada T, Fukagawa M, et al. Prospective randomized multicenter trial of sevelamer hydrochloride and calcium carbonate for the treatment of hyperphosphatemia in hemodialysis patients in Japan. Therapeutic Apheresis & Dialysis 2005;9(4):340‐6. [MEDLINE: ] [DOI] [PubMed] [Google Scholar]
Koiwa 2017a {published data only}
- Koiwa F, Terao A. Dose‐response efficacy and safety of PA21 in Japanese hemodialysis patients with hyperphosphatemia: a randomized, placebo‐controlled, double‐blind, Phase II study.[Erratum appears in Clin Exp Nephrol. 2017 Jun;21(3):523; PMID: 27832343]. Clinical & Experimental Nephrology 2017;21(3):513‐22. [MEDLINE: ] [DOI] [PMC free article] [PubMed] [Google Scholar]
Koontz 2012 {published data only}
- Koontz T, Balikian S, Bross R, Lee ML, Rattanasompattikul M, Hatamizadeh P, et al. Fosrenol for enhancing dietary protein intake in hypoalbuminemic dialysis patients (FREDI) study [abstract]. Kidney Research & Clinical Practice 2012;31(2):A68. [EMBASE: 70814912] [Google Scholar]
Kurihara 2005 {published data only}
- Kurihara S, Tsuruta Y, Akizawa T. Effect of MCI‐196 (colestilan) as a phosphate binder on hyperphosphataemia in haemodialysis patients: a double‐blind, placebo‐controlled, short‐term trial. Nephrology Dialysis Transplantation 2005;20(2):424‐30. [MEDLINE: ] [DOI] [PubMed] [Google Scholar]
- Kurihara S, Tsuruta Y, Akizawa T. Effect of MCI‐196 (colestilan) on hyperphosphatemia in hemodialysis patients [abstract no: F‐PO662]. Journal of the American Society of Nephrology 2003;14(Nov):206A. [CENTRAL: CN‐00626036] [Google Scholar]
Lee 2013b {published data only}
- Lee GH, Han N, Hong SH, Kim YS, Shin WG, Oh JM. Changes in serum fibroblast growth factor 23 during the use of calcium carbonate concurrent with calcitriol in stage 3 CKD patients [abstract no: 341]. Pharmacotherapy 2013;33(10):e284. [EMBASE: 71764412] [Google Scholar]
Locatelli 2010a {published data only}
- Locatelli F, Dimkovic N, Manning A, Chambard A, Sano H, Nakajima S. MCI‐196, a new phosphate binder, has an additional effect on dyslipidemia and uric acid in patients with hyperphosphatemia on hemodialysis [abstract no: F‐PO952]. Journal of the American Society of Nephrology 2004;15(Oct):272A. [CENTRAL: CN‐00765636] [Google Scholar]
- Locatelli F, Dimkovic N, Manning A, Verho M, Sano H, Nakajima S. MCI‐196, a new phosphate binder, reduces hyperphosphatemia in hemodialysis patients: a phase II, dose‐finding study [abstract no: F‐PO953]. Journal of the American Society of Nephrology 2004;15(Oct):272A. [CENTRAL: CN‐00765638] [Google Scholar]
- Locatelli F, Dimkovic N, Pontoriero G, Spasovski G, Pljesa S, Kostic S, et al. Effect of MCI‐196 on serum phosphate and cholesterol levels in haemodialysis patients with hyperphosphataemia: a double‐blind, randomized, placebo‐controlled study. Nephrology Dialysis Transplantation 2010;25(2):574‐81. [MEDLINE: ] [DOI] [PubMed] [Google Scholar]
- Locatelli F, Pontoriero G, Dimkovic N, Chambard A, Manning A, Nakajima S, et al. MCI‐196, a new phosphate binder, reduces hyperphosphataemia and lipid levels in patients on regular hemodialysis [abstract no: SO08]. Nephrology Dialysis Transplantation 2005;20(Suppl 5):v5. [CENTRAL: CN‐00765637] [Google Scholar]
Mai 1989 {published data only}
- Mai ML, Emmett M, Sheikh MS, Santa Ana C, Fordtran JS. Calcium acetate (CaAc), an effective binder of dietary phosphorus (P) in patients with chronic renal failure (CRF) [abstract]. Kidney International 1989;35(1):384. [CENTRAL: CN‐00626015] [DOI] [PubMed] [Google Scholar]
- Mai ML, Emmett M, Sheikh MS, Santa Ana CA, Schiller L, Fordtran JS. Calcium acetate, an effective phosphorus binder in patients with renal failure. Kidney International 1989;36(4):690‐5. [MEDLINE: ] [DOI] [PubMed] [Google Scholar]
Mak 1985 {published data only}
- Mak RH, Turner C, Thompson T, Powell H, Haycock GB, Chantler C. Suppression of secondary hyperparathyroidism in children with chronic renal failure by high dose phosphate binders: calcium carbonate versus aluminium hydroxide. British Medical Journal Clinical Research Ed 1985;291(6496):623‐7. [MEDLINE: ] [DOI] [PMC free article] [PubMed] [Google Scholar]
Matuszkiewicz 2004 {published data only}
- Matuszkiewicz‐Rowinska J, Niemczyk S, Przedlacki J, Puka J, Switalski M, Ostrowski K. Effect of salmon calcitonin on bone mineral density and calcium‐phosphate metabolism in chronic hemodialysis patients with secondary hyperparathyroidism [Wplyw lososiowej kalcytoniny na gestosc mineralna kosci oraz metabolizm wapnia i fosforu u chorych z wtorna nadczynnoscia przytarczyc przewlekle hemodializowanych]. Polskie Archiwum Medycyny Wewnetrznej 2004;112(1):797‐803. [MEDLINE: ] [PubMed] [Google Scholar]
McIntyre 2009 {published data only}
- McIntyre C, Pai P, Warwick G, Wilkie M, Toft A, Hutchinson A. Iron‐magnesium hydroxycarbonate (alpharen): a novel non calcium containing phosphate binder for the treatment of hyperphosphataemia in chronic haemodialysis patients [abstract no: FP452]. Nephrology Dialysis Transplantation 2007;22(Suppl 6):vi171. [CENTRAL: CN‐00690654] [DOI] [PMC free article] [PubMed] [Google Scholar]
- McIntyre CW, Pai P, Warwick G, Wilkie M, Toft A. Alpharen is a novel effective non calcium containing phosphate binder for the treatment of hyperphosphataemia in chronic haemodialysis patients [abstract no: F‐PO108]. Journal of the American Society of Nephrology 2006;17(Abstracts):359A. [CENTRAL: CN‐00688970] [DOI] [PMC free article] [PubMed] [Google Scholar]
- McIntyre CW, Pai P, Warwick G, Wilkie M, Toft AJ, Hutchison AJ. Iron‐magnesium hydroxycarbonate (alpharen): a novel non calcium containing phosphate binder for the treatment of hyperphosphataemia in chronic haemodialysis patients [abstract no: 142]. American Journal of Kidney Diseases 2007;49(4):A60. [DOI] [PMC free article] [PubMed] [Google Scholar]
- McIntyre CW, Pai P, Warwick G, Wilkie M, Toft AJ, Hutchison AJ. Iron‐magnesium hydroxycarbonate (fermagate): a novel non‐calcium‐containing phosphate binder for the treatment of hyperphosphatemia in chronic hemodialysis patients. Clinical Journal of The American Society of Nephrology: CJASN 2009;4(2):401‐9. [MEDLINE: ] [DOI] [PMC free article] [PubMed] [Google Scholar]
Messana 1999 {published data only}
- Messana JM, Hsu C, Young E, Swartz RD. Ferric citrate (FC), an alternate phosphorous (PHS)‐binder in ESRD patients on hemodialysis (HD) [abstract no: A3098]. Journal of the American Society of Nephrology 1999;10(Program & Abstracts):612A. [Google Scholar]
Moustafa 2014 {published data only}
- Moustafa M, Lehrner L, Al‐Saghir F, Smith M, Goyal S, Dillon M, et al. A randomized, double‐blind, placebo‐controlled, dose‐ranging study using Genz‐644470 and sevelamer carbonate in hyperphosphatemic chronic kidney disease patients on hemodialysis. International Journal of Nephrology & Renovascular Disease 2014;7:141‐52. [MEDLINE: ] [DOI] [PMC free article] [PubMed] [Google Scholar]
- Moustafa M, Lehrner L, Al‐Saghir F, Smith M, Goyal S, Dillon M, et al. A randomized, double‐blind, placebo‐controlled, dose‐ranging study using Genz‐644470 and sevelamer carbonate in hyperphosphatemic chronic kidney disease patients on hemodialysis [abstract no: Sa578]. NDT Plus 2010;3(Suppl 3):iii236. [DOI] [PMC free article] [PubMed] [Google Scholar]
- Striker G, Uribarri J, Vlassara H. Dose dependent reduction of cytotoxic advanced glycation endproducts by sevelamer carbonate [abstract]. Nephrology Dialysis Transplantation 2012;27(Suppl 2):ii176‐7. [EMBASE: 70765813] [Google Scholar]
- Striker G, Yubero‐Serrano E, Uribarri J, Vlassara H. Methylglyoxal (MG) levels are markedly higher in diabetic hemodialysis (HD) patients than non‐diabetic HD patients, which may contribute to increased morbidity and mortality in diabetics [abstract no: MP599]. Nephrology Dialysis Transplantation 2013;28(Suppl 1):i488. [EMBASE: 71076510] [Google Scholar]
Mouzo 2004 {published data only}
- Mouzo R, Sierra FG, Lombardi V, Rodriguez J, Castro P, Alvarez A, et al. Effectiveness of sevelamer (SEV) administration according to Hispanic dietary habits and phosphate food content in hemodialysis chronic (HD) patients [abstract]. 41st Congress. European Renal Association. European Dialysis and Transplantation Association; 2004 May 15‐18; Lisbon, Portugal. 2004:104. [CENTRAL: CN‐00509368]
NCT00018135 {published data only}
- NCT00018135. Parathyroid hormone levels in relation to the phosphorus content of meals. www.clinicaltrials.gov/ct2/show/NCT00018135 (first received 5 July 2001).
NCT00364000 {published data only}
- Covic A, Mircescu G. Arterial stiffness and calcifications in haemodialysis patients on sevelamer or calcium acetate. www.clinicalTrials.gov/show/NCT00364000 (first received 15 August 2006).
NCT00436683 {published data only}
- Taal M. Dose ranging study of magnesium iron hydroxycarbonate in haemodialysis subjects with hyperphosphataemia. www.clinicalTrials.gov/show/NCT00436683 (first received 19 February 2007).
NCT00660530 {published data only}
- Lau A. Chewed vs. crushed lanthanum carbonate in hemodialysis patients. www.clinicalTrials.gov/show/NCT00660530 (first received 17 April 2008).
NCT00745589 {published data only}
- Wang A. Sevelamer hydrochloride in peritoneal dialysis patients. www.clinicaltrials.gov/show/NCT00745589 (first received 3 September 2008).
NCT01427907 {published data only}
- Katanko P. Equivalence of calcium acetate oral solution and sevelamer carbonate tablets in hemodialysis patients. www.clinicaltrials.gov/show/NCT01427907 (first received 2 September 2011).
NCT01748396 {published data only}
- Kim YS. Effect of phosphate binders on FGF‐23 with concurrent calcitriol. www.clinicaltrials.gov/show/NCT01748396 (first received 12 December 2012).
NCT02027662 {published data only}
- Floege J. Therapeutic equivalence of OsvaRen® tablets and OsvaRen® granules. www.clinicaltrials.gov/show/NCT02027662 (first received 6 January 2014).
NCT02492620 {published data only}
- Block GA. A two‐arm, open‐label, standard of care control evaluation of ferric citrate for the transition from chronic kidney disease stage 4/5 to chronic kidney stage 5D. www.clinicaltrials.gov/show/NCT02492620 (first received 8 July 2015).
NCT02684643 {published data only}
- Chen J. Study of individualized therapy on hyperphosphatemia in maintenance hemodialysis patients. www.clinicaltrials.gov/show/NCT02684643 (first received 18 February 2016).
NCT02688764 {published data only}
- Greenbaum LA. An open‐label, randomised, active‐controlled, parallel group, multicentre, phase 3 study to investigate the safety and efficacy of PA21 (Velphoro®) and calcium acetate (phoslyra®) in paediatric and adolescent CKD patients with hyperphosphataemia. www.clinicaltrials.gov/show/NCT02688764 (first received 23 February 2016).
NCT03163576 {published data only}
- NCT03163576. The efficacy and safety of niacin on hyperphosphatemia in end stage renal disease patients undergoing haemodialysis. www.clinicaltrials.gov/show/NCT03163576 (first received 23 May 2017).
NCT03305471 {published data only}
- Sankyo D. A phase 1b study, to assess the safety, tolerability, pharmacodynamics, and pharmacokinetics of repeated doses of DS‐2330b alone and when co‐administered with sevelamer in patients on chronic hemodialysis. www.clinicaltrials.gov/show/NCT03305471 (first received 10 October 2017).
Nishi 2005 {published data only}
- Nishi H, Sato T, Kurihara T, Kurosawa T, Fukagawa M. Control of parathyroid function in patients with a short history of hemodialysis. Therapeutic Apheresis & Dialysis 2005;9(1):39‐43. [MEDLINE: ] [DOI] [PubMed] [Google Scholar]
Oliveira 2010 {published data only}
- Oliveira RB, Cancela AL, Graciolli FG, Dos Reis LM, Draibe SA, Cuppari L, et al. Early control of PTH and FGF23 in normophosphatemic CKD patients: a new target in CKD‐MBD therapy?. Clinical Journal of The American Society of Nephrology: CJASN 2010;5(2):286‐91. [MEDLINE: ] [DOI] [PMC free article] [PubMed] [Google Scholar]
- Oliveira RB, Cancela ALE, Graciolli FG, Draibe SA, Cuppari L, Carvalho AB, et al. Sevelamer (SEV), but not calcium acetate (CA), lowers fibroblast growth factor 23 (FGF23) in chronic kidney disease (CKD) patients [abstract no: SA‐PO862]. Journal of the American Society of Nephrology 2007;18(Abstracts):532A. [Google Scholar]
- Oliveira RB, Graciolli FG, dos Reis LM, Cancela AL, Cuppari L, Canziani ME, et al. Disturbances of Wnt/beta‐catenin pathway and energy metabolism in early CKD: effect of phosphate binders. Nephrology Dialysis Transplantation 2013;28(10):2510‐7. [MEDLINE: ] [DOI] [PubMed] [Google Scholar]
OPTIMA 2008 {published data only}
- Messa P, Macário F, Yaqoob M, Bouman K, Braun J, Albertini B, et al. The OPTIMA study: assessing a new cinacalcet (Sensipar/Mimpara) treatment algorithm for secondary hyperparathyroidism. Clinical Journal of The American Society of Nephrology: CJASN 2008;3(1):36‐45. [MEDLINE: ] [DOI] [PMC free article] [PubMed] [Google Scholar]
Ouellet 2010 {published data only}
- Ouellet G, Cardinal H, Mailhot M, Ste‐Marie L, Roy L. Does simultaneous administration of sevelamer and calcium carbonate decrease phosphate‐binding capacity? [abstract no: PUB429]. Journal of the American Society of Nephrology 2007;18(Abstracts):924A. [Google Scholar]
- Ouellet G, Cardinal H, Mailhot M, Ste‐Marie LG, Roy L. Does concomitant administration of sevelamer and calcium carbonate modify the control of phosphatemia?. Therapeutic Apheresis & Dialysis 2010;14(2):172‐7. [MEDLINE: ] [DOI] [PubMed] [Google Scholar]
Pai 2008a {published data only}
- Pai P, Ross C, Wilkie M, Warwick G, Chapman A, McIntyre C, et al. Fermagate (Alpharen) provides long term effective control of serum phosphate combined with good tolerability [abstract no: SU609]. World Congress of Nephrology; 2009 May 22‐26; Milan, Italy. 2009.
- Pai P, Toft A, Tumlin J, Ross C, Roe S, Chapman A, et al. Fermagate (AlpharenT): a novel anion exchange compound, effectively controls hyperphosphatemia in patients on hemodialysis [abstract no: SA‐PO2751]. Journal of the American Society of Nephrology 2008;19(Abstracts Issue):732A. [Google Scholar]
Pflanz 1994 {published data only}
- Pflanz S, Henderson IS, McElduff N, Jones MC. Calcium acetate versus calcium carbonate as phosphate‐binding agents in chronic haemodialysis. Nephrology Dialysis Transplantation 1994;9(8):1121‐4. [MEDLINE: ] [DOI] [PubMed] [Google Scholar]
- Pflanz S, Henderson IS, McElduff N, Jones MC. Calcium acetate versus calcium carbonate as phosphate‐binding agents in chronic haemodialysis [abstract]. Nephrology Dialysis Transplantation 1993;8(11):1301. [CENTRAL: CN‐00447209] [DOI] [PubMed] [Google Scholar]
Phelps 2002 {published data only}
- Phelps KR, Stern M, Slingerland A, Heravi M, Strogatz DS, Haqqie SS. Metabolic and skeletal effects of low and high doses of calcium acetate in patients with preterminal chronic renal failure. American Journal of Nephrology 2002;22(5‐6):445‐54. [MEDLINE: ] [DOI] [PubMed] [Google Scholar]
Phelps 2014 {published data only}
- Phelps KR, Stote KS, Mason D. Use of sevelamer to examine the role of intraluminal phosphate in the pathogenesis of secondary hyperparathyroidism. Clinical Nephrology 2014;82(3):191‐201. [MEDLINE: ] [DOI] [PubMed] [Google Scholar]
Przedlacki 2005 {published data only}
- Przedlacki J, Matuszkiewicz‐Rowinska J, Trebicka J, Jedras M. Alfacalcidol is essential for bone mineral density in chronic renal failure [abstract no: SP184]. Nephrology Dialysis Transplantation 2005;20(Suppl 5):v80. [Google Scholar]
Ring 1993 {published data only}
- Ring T, Nielsen C, Andersen SP, Behrens JK, Sodemann B, Kornerup HJ. Calcium acetate versus calcium carbonate as phosphorus binders in patients on chronic haemodialysis: a controlled study. Nephrology Dialysis Transplantation 1993;8(4):341‐6. [MEDLINE: ] [PubMed] [Google Scholar]
Rudnicki 1993 {published data only}
- Rudnicki M, Hojsted J, Petersen LJ, Sorensen HA, Hyldstrup L, Transbol I. Oral calcium effectively reduces parathyroid hormone levels in hemodialysis patients: a randomized double‐blind placebo‐controlled study. Nephron 1993;65(3):369‐74. [MEDLINE: ] [DOI] [PubMed] [Google Scholar]
Ruff 2008 {published data only}
- Ruff A, Heaton J. Randomzied, open‐label, cross‐over study to assess the potential pharmacokinetic interaction of warfarin and sevelamer carbonate [abstract no: PUB555]. Journal of the American Society of Nephrology 2008;19(Abstracts Issue):936A. [Google Scholar]
Salusky 1991 {published data only}
- Goodman WG, Coburn JW, Foley J, Salusky IB. Prospective assessment of aluminum retention in dialyzed patients given calcium carbonate or aluminum hydroxide [abstract]. Kidney International 1990;37(1):328. [CENTRAL: CN‐00626083] [Google Scholar]
- Salusky IB, Coburn JW, Foley J, Slatopolsky E, Goodman WG. Prospective trial of calcium carbonate versus aluminum hydroxide with oral calcitriol therapy in renal osteodystrophy [abstract]. Kidney International 1990;37(1):451. [Google Scholar]
- Salusky IB, Foley J, Goodman WG. Calcium carbonate versus aluminum hydroxide with oral calcitriol therapy in pediatric renal osteodystrophy [abstract]. 11th International Congress of Nephrology; 1990 Jul 15‐20; Tokyo, Japan. 1990:416A.
- Salusky IB, Foley J, Nelson P, Goodman WG. Aluminum accumulation during treatment with aluminum hydroxide and dialysis in children and young adults with chronic renal disease. New England Journal of Medicine 1991;324(8):527‐31. [MEDLINE: ] [DOI] [PubMed] [Google Scholar]
Salusky 2005 {published data only}
- Pereira RC, Hernandez JD, Wesseling K, Gales B, Jueppner HW, Salusky IB. Differential effect of doxercalciferol and calcitriol on skeletal lesions of secondary hyperparathyroidism [abstract no: TH‐PO133]. Journal of the American Society of Nephrology 2006;17(Abstracts):134A. [CENTRAL: CN‐00740590] [Google Scholar]
- Salusky I, Jueppner H, Gales B, Elashoff R, Goodman WG. Skeletal response to the treatment of secondary hyperparathyroidism: a comparison between calcitriol and 1‐Alpha‐D2 [abstract no: F‐PO643]. Journal of the American Society of Nephrology 2003;14(Nov):202A. [Google Scholar]
- Salusky IB, Goodman WG, Elashoff R, Gales B, Shaney S, Jueppner H. Prospective comparison of calcium‐based binder versus sevelamer HCL on the control of the skeletal lesions of secondary hyperparathyroidism [abstract no: F‐PO989]. Journal of the American Society of Nephrology 2004;15(Oct):281A. [Google Scholar]
- Salusky IB, Goodman WG, Sahney S, Gales B, Perilloux A, Wang HJ, et al. Sevelamer controls parathyroid hormone‐induced bone disease as efficiently as calcium carbonate without increasing serum calcium levels during therapy with active vitamin D sterols. Journal of the American Society of Nephrology 2005;16(8):2501‐8. [MEDLINE: ] [DOI] [PubMed] [Google Scholar]
- Salusky IB, Jueppner H, Gales B, Elashoff R, Goodman WG. A prospective assessment of sevelamer hydrochloride versus calcium carbonate in dialyzed children [abstract no: F‐PO661]. Journal of the American Society of Nephrology 2003;14(Nov):206A. [Google Scholar]
- Wesseling K, Juppner H, Gales B, Wang H, Elsahoff R, Goodman WG, et al. Effects of vitamin D therapy on FGF‐23, PTH and the skeletal lesions of secondary hyperparathyroidism [abstract no: TH‐PO132]. Journal of the American Society of Nephrology 2006;17(Abstracts):134A. [CENTRAL: CN‐00740591] [Google Scholar]
- Wesseling‐Perry K, Harkins GC, Wang HJ, Sahney S, Gales B, Elashoff RM, et al. Response of different PTH assays to therapy with sevelamer or CaCO3 and active vitamin D sterols. Pediatric Nephrology 2009;24(7):1355‐61. [MEDLINE: ] [DOI] [PMC free article] [PubMed] [Google Scholar]
- Wesseling‐Perry K, Pereira RC, Sahney S, Gales B, Wang HJ, Elashoff R, et al. Calcitriol and doxercalciferol are equivalent in controlling bone turnover, suppressing parathyroid hormone, and increasing fibroblast growth factor‐23 in secondary hyperparathyroidism. Kidney International 2011;79(1):112‐9. [MEDLINE: ] [DOI] [PubMed] [Google Scholar]
Scaria 2009 {published data only}
- Scaria PT, Gangadhar R, Pisharody R. Effect of lanthanum carbonate and calcium acetate in the treatment of hyperphosphatemia in patients of chronic kidney disease. Indian Journal of Pharmacology 2009;41(4):187‐91. [MEDLINE: ] [DOI] [PMC free article] [PubMed] [Google Scholar]
Schaefer 1990 {published data only}
- Schaefer K, Scheer J, Asmus G, Herrath D, Sperachneider H, Gunther K, et al. The effect of calcium acetate and calcitriol on the calcium and phosphorus metabolism in haemodialysis patients [abstract]. Nephrology Dialysis Transplantation 1990;5(8):734‐5. [CENTRAL: CN‐00260557] [Google Scholar]
Schaefer 1991 {published data only}
- Schaefer K, Scheer J, Asmus G, Umlauf E, Hagemann J, Herrath D. The treatment of uraemic hyperphosphataemia with calcium acetate and calcium carbonate: a comparative study. Nephrology Dialysis Transplantation 1991;6(3):170‐5. [MEDLINE: ] [DOI] [PubMed] [Google Scholar]
Sechet 1998 {published data only}
- Sechet A, Abi Ghanem O, Said S, Rasombolobna M, Oualim Z, Moriniere P, et al. Role of administration schedule in relation to meal on CaCO3 efficiency in controlling hyperphosphatemia in dialysis patients [abstract]. 35th Congress. European Renal Association. European Dialysis and Transplantation Association; 1998 Jun 6‐9; Rimini, Italy. 1998:38. [CENTRAL: CN‐00485788]
- Sechet A, Abighanem O, Said S, Rasombololona M, Moriniere P, Brazier M, et al. Role of the time of administration of calcium carbonate (before or during mealtime) in the control of hyperphosphatemia in patients on maintenance hemodialysis [Role du moment d'administration du carbonate de calcium (avant ou pendant les repas) sur le controle de l'hyperphosphoremie des patients hemodialyses chroniques]. Nephrologie 1999;20(4):209‐12. [MEDLINE: ] [PubMed] [Google Scholar]
- Sechet A, Hardy P, Hottelart C, Rasombololona M, Abighanem O, Oualim Z, et al. Role of calcium carbonate administration timing in relation to food intake on its efficiency in controlling hyperphosphatemia in patients on maintenance dialysis. Artificial Organs 1998;22(7):564‐8. [MEDLINE: ] [DOI] [PubMed] [Google Scholar]
Sechet 1999 {published data only}
- Sechet A, Abighanem O, Said S, Rasombololona M, Moriniere P, Brazier M, et al. Inhibition of gastric secretion by omeprazole and efficacy of calcium carbonate in the control of hyperphosphatemia in patients on maintenance hemodialysis [Inhibition de la secretion gastrique par l'omeprazole et efficacite du carbonate de calcium sur le controle de l'hyperphosphoremie des patients hemodialyses chroniques]. Nephrologie 1999;20(4):213‐6. [MEDLINE: ] [PubMed] [Google Scholar]
Seferi 2012 {published data only}
- Seferi S, Rroji M, Thereska N. Is sevelamer hydrocloride as effective as calcium carbonate for reduction of serum phosphorus in hemodialysis patients? [abstract]. Hemodialysis International 2012;16(1):140‐1. [EMBASE: 70725376] [Google Scholar]
Shigematsu 2001 {published data only}
- Shigematsu T, Terawaki H, Hasegawa T, Kato N, Yamamoto H, Yokoyama K, et al. The vitamin D therapy alone should be selected in pre‐dialysis renal failure patients with secondary hyperparathyroidism, instead of the combination therapy with vitamin D and calcium [abstract]. Journal of the American Society of Nephrology 2001;12(Program & Abstracts):772A‐3A. [Google Scholar]
Shigematsu 2008a {published data only}
- Shigematsu T. Lanthanum carbonate is effective enough to control serum P level in line with K/DOQI target without Ca load in Japanese CKD5 patients undergoing hemodialysis [abstract no: PUB337]. Journal of the American Society of Nephrology 2006;17(Abstracts):887A. [Google Scholar]
- Shigematsu T, Lanthanum Carbonate Research Group. Lanthanum carbonate effectively controls serum phosphate without affecting serum calcium levels in patients undergoing hemodialysis. Therapeutic Apheresis & Dialysis 2008;12(1):55‐61. [MEDLINE: ] [DOI] [PubMed] [Google Scholar]
Shimoda 1996 {published data only}
- Shimoda K, Akiba T, Matsushima T, Rai T, Hoshino M. Niceritrol decreases serum phosphate levels in hemodialysis patients ‐ a randomized, double blind, crossover study [abstract no: A2803]. Journal of the American Society of Nephrology 1996;7(9):1807. [CENTRAL: CN‐00447715] [Google Scholar]
Sigrist 2013 {published data only}
- Sigrist M, Tang M, Beaulieu M, Espino‐Hernandez G, Er L, Djurdjev O, et al. Responsiveness of FGF‐23 and mineral metabolism to altered dietary phosphate intake in chronic kidney disease (CKD): results of a randomized trial. Nephrology Dialysis Transplantation 2013;28(1):161‐9. [MEDLINE: ] [DOI] [PubMed] [Google Scholar]
SPD405‐307 2004 {published data only}
- Altmann P, Barnett ME, Finn WF, SPD405‐307 Lanthanum Carbonate Study Group. Cognitive function in Stage 5 chronic kidney disease patients on hemodialysis: no adverse effects of lanthanum carbonate compared with standard phosphate‐binder therapy. Kidney International. 2007;71(3):252‐9. [MEDLINE: ] [DOI] [PubMed] [Google Scholar]
- Altmann P, Finn WF. Lanthanum carbonate has shown no negative effects on cognitive function compared with standard therapy: results from a 2‐year study [abstract no: F‐PO950]. Journal of the American Society of Nephrology 2004;15:272A. [Google Scholar]
- Finn W. 25‐hydroxyvitamin D and 1,25‐dihydroxyvitamin D deficiency in stage V chronic kidney disease patients on hemodialysis [abstract no: SP201]. Nephrology Dialysis Transplantation 2005;20(Suppl 5):v86. [Google Scholar]
- Finn W. Lanthanum carbonate versus standard therapy: effects on hematological and biochemical parameters [abstract no: SA‐PO951]. Journal of the American Society of Nephrology 2005;16:765A. [Google Scholar]
- Finn W. No evidence for hepatotoxicity after 2 years of lanthanum carbonate therapy [abstract no: SA‐PO950]. Journal of the American Society of Nephrology 2005;16:764A‐5A. [CENTRAL: CN‐00644346] [Google Scholar]
- Finn WF, Joy MS. Lanthanum carbonate (FosrenolTM), a novel phosphate binder, is safe and effective in the long term treatment of hyperphosphatemia in end‐stage renal disease [abstract no: PS1‐21]. Nephrology 2003;8(Suppl 1):A29. [Google Scholar]
- Finn WF, Joy MS. The new phosphate‐binding agent lanthanum carbonate: further evidence of long‐term (2‐year) efficacy and safety [abstract no: PUB006]. Journal of the American Society of Nephrology 2004;15(Oct):763A. [CENTRAL: CN‐00644348] [Google Scholar]
- Finn WF, Joy MS, Webster I. Lanthanum carbonate vs. standard therapy in hyperphosphatemia: interim findings from a 2‐year safety and outcomes study [abstract no: SU‐PO1040]. Journal of the American Society of Nephrology 2003;14(Nov):764A. [Google Scholar]
- Finn WF, Joy MS, Webster I, Gill M, Lanthanum Study Group. A long‐term (2‐year) assessment of the safety and efficacy of lanthanum carbonate (fosrenol), a non‐calcium, non‐aluminium phosphate binder for the treatment of hyperphosphataemia [abstract no: W438]. Nephrology Dialysis Transplantation 2003;18(Suppl 4):686. [CENTRAL: CN‐00583347] [Google Scholar]
- Finn WF, SPD 405‐307 Lanthanum Study Group. Lanthanum carbonate versus standard therapy for the treatment of hyperphosphatemia: safety and efficacy in chronic maintenance hemodialysis patients. Clinical Nephrology 2006;65(3):191‐202. [MEDLINE: ] [DOI] [PubMed] [Google Scholar]
- Malluche H, SPD405‐307 Study Group. A 2‐year randomized, comparator‐controlled trial investigating the effect of lanthanum carbonate on bone [abstract no: W‐PO40066]. Nephrology 2005;10(Suppl 1):A297. [CENTRAL: CN‐00583171] [Google Scholar]
- Malluche HH, Faugere M, Wang G, Finn WF. Lanthanum carbonate and bone: no adverse effects observed after 1 year of treatment in a randomized, comparator‐controlled trial [abstract no: F‐PO945]. Journal of the American Society of Nephrology 2004;15(Oct):271A. [CENTRAL: CN‐00583212] [Google Scholar]
- Malluche HH, Pratt RD. Lanthanum carbonate vs standard phosphate binder therapy: evolution of renal osteodystrophy over 1 and 2 years of treatment [abstract no: 133]. American Journal of Kidney Diseases 2007;49(4):A58. [CENTRAL: CN‐00690682] [Google Scholar]
- Malluche HH, Pratt RD. Renal osteodystrophy: comparison of evolution over 1 and 2 years during treatment with lanthanum carbonate or standard phosphate binders [abstract no: F‐PO107]. Journal of the American Society of Nephrology 2006;17(Abstracts):359A. [CENTRAL: CN‐00691366] [Google Scholar]
- Malluche HH, Siami GA, Swanepoel C, Wang GH, Mawad H, Confer S, et al. Improvements in renal osteodystrophy in patients treated with lanthanum carbonate for two years. Clinical Nephrology 2008;70(4):284‐95. [MEDLINE: ] [PubMed] [Google Scholar]
- Pratt R, Smyth M. Is 1 year sufficient to observe changes in renal osteodystrophy? Evaluation of serial bone biopsies [abstract no: FP450]. Nephrology Dialysis Transplantation 2007;22(Suppl 6):vi171. [Google Scholar]
- Wilson R, Zhang P, Pratt R. Retrospective outcomes analyses of a 2‐year comparative study of lanthanum carbonate vs standard therapy [abstract no: TH‐PO928]. Journal of the American Society of Nephrology 2008;19(Abstracts Issue):320A. [CENTRAL: CN‐00757927] [Google Scholar]
- Wilson R, Zhang P, Smyth M, Pratt R. Assessment of survival in a 2‐year comparative study of lanthanum carbonate versus standard therapy. Current Medical Research & Opinion 2009;25(12):3021‐8. [MEDLINE: ] [DOI] [PubMed] [Google Scholar]
Sprague 2009b {published data only}
- Krause R, Sprague S, Zhang P, Qiu P, Ross E. Lanthanum carbonate provides greater phosphate reduction than sevelamer hydrochloride over a 4 week treatment period in patients on dialysis [abstract no: SU579]. World Congress of Nephrology; 2009 May 22‐26; Milan, Italy. 2009.
- Sprague SM, Ross EA, Nath SD, Zhang P, Pratt RD, Krause R. Lanthanum carbonate vs sevelamer hydrochloride for the reduction of serum phosphorus in hemodialysis patients: a crossover study. Clinical Nephrology 2009;72(4):252‐8. [MEDLINE: ] [DOI] [PubMed] [Google Scholar]
SUMMER 2011 {published data only}
- Boaz M, Biro A, Katzir Z, Shtendik L, Weinstein T. Nested cross‐sectional analysis of baseline date from the Sevelamer hydrochloride and Ultrasound‐Measured femoral and carotid intima Media thickness progression in End stage Renal disease: SUMMER [abstract no: SA‐PO2704]. Journal of the American Society of Nephrology 2008;19(Abstracts Issue):721A. [Google Scholar]
- Boaz M, Chernin G, Schwartz I, Katzir Z, Schwartz D, Agbaria A, et al. C‐reactive protein and carotid and femoral intima media thickness: predicting inflammation. Clinical Nephrology 2013;80(6):449‐55. [MEDLINE: ] [DOI] [PubMed] [Google Scholar]
- Boaz M, Katzir Z, Schwartz D, Gafter U, Biro A, Shtendik L, et al. Effect of sevelamer hydrochloride exposure on carotid intima media thickness in hemodialysis patients. Nephron 2011;117(2):c83‐8. [MEDLINE: ] [DOI] [PubMed] [Google Scholar]
Tzanakis 2008 {published data only}
- Tzanakis IP, Papadaki AN, Wei M, Kagia S, Spadidakis VV, Kallivretakis NE, et al. Magnesium carbonate for phosphate control in patients on hemodialysis. A randomized controlled trial. International Urology & Nephrology 2008;40(1):193‐201. [MEDLINE: ] [DOI] [PMC free article] [PubMed] [Google Scholar]
Tzanno‐Martins 2014 {published data only}
- Tzanno‐Martins C, Biavo BM, Ferreira‐Filho O, Ribeiro‐Junior E, Joao‐Luiz MV, Degaspari S, et al. Clinical efficacy, safety and anti‐inflammatory activity of two sevelamer tablet forms in patients on low‐flux hemodialysis. International Journal of Immunopathology & Pharmacology 2014;27(1):25‐35. [MEDLINE: ] [DOI] [PubMed] [Google Scholar]
Umanath 2013 {published data only}
- Jalal D, McFadden M, Dwyer JP, Umanath K, Aguilar E, Yagil Y, et al. Adherence rates to ferric citrate as compared to active control in patients with end stage kidney disease on dialysis. Hemodialysis International 2017;21(2):243‐9. [MEDLINE: ] [DOI] [PubMed] [Google Scholar]
- Jalal D, McFaden M, Dwyer J, Umanath K, Aguilar E, Yagil Y, et al. Adherence rates and predictors of adherence to ferric citrate as compared to active control in end stage kidney disease [abstract]. American Journal of Kidney Diseases 2015;65(4):A45. [EMBASE: 71875104] [Google Scholar]
- Lewis J, Dwyer JP, Koury M, Sika M, Schulman G, Smith MT, et al. Ferric citrate binds phosphorus, delivers iron, and reduces IV iron and erythropoietic stimulating agent use in end‐stage renal disease [abstract no: SA‐PO542]. Journal of the American Society of Nephrology 2013;24(Abstracts):751‐2A. [Google Scholar]
- Lewis JB, Sika M, Koury MJ, Chuang P, Schulman G, Smith MT, et al. Ferric citrate controls phosphorus and delivers iron in patients on dialysis. Journal of the American Society of Nephrology 2015;26(2):493‐503. [MEDLINE: ] [DOI] [PMC free article] [PubMed] [Google Scholar]
- Niecestro R, Chan K, Town W. Ferric citrate (phosphate binder): effects on serum iron and other parameters in ESRD patients [abstract no: PUB306]. Journal of the American Society of Nephrology 2006;17(Abstracts):880A. [Google Scholar]
- Niecestro RM. Ferric citrate for the treatment of hyperphosphatemia in ESRD [abstract no: S‐PO‐0416]. 4th World Congress of Nephrology.19th International Congress of the International Society of Nephrology (ISN); 2007 Apr 21‐25; Rio de Janeiro, Brazil. 2007:161.
- Rodby R, Umanath K, Niecestro R, Jackson J, Dwyer J, Lewis J. Phosphorus binding with ferric citrate is associated with fewer hospitalizations and reduced hospitalization costs [abstract]. American Journal of Kidney Diseases 2014;63(5):A118. [EMBASE: 71448666] [DOI] [PubMed] [Google Scholar]
- Rodby R, Umanath K, Niecestro R, Jackson JH, Sika M, Lewis JB, et al. Phosphorus binding with ferric citrate is associated with fewer hospitalizations and reduced hospitalization costs. Expert Review of Pharmacoeconomics & Outcomes Research 2015;15(3):545‐50. [MEDLINE: ] [DOI] [PubMed] [Google Scholar]
- Rodby RA, Umanath K, Niecestro R, Bond TC, Sika M, Lewis J, et al. Ferric citrate, an iron‐based phosphate binder, reduces health care costs in patients on dialysis based on randomized clinical trial data. Drugs in R & D 2015;15(3):271‐9. [MEDLINE: ] [DOI] [PMC free article] [PubMed] [Google Scholar]
- Sika M, Kabani S, Chen M, Dwyer J, Lewis J, Niecestro R, et al. Oral ferric citrate (FC) eliminates the need for intravenous (IV) iron in dialysis patients [abstract]. American Journal of Kidney Diseases 2014;63(5):A102. [EMBASE: 71448601] [Google Scholar]
- Sika M, Koury MJ, Niecestro R, Dwyer JP, Lewis JB. Iron stores are increased within the first 24 weeks and maintained for 80 additional weeks with longterm use of oral ferric citrate (FC) as a phosphate binder [abstract]. American Journal of Kidney Diseases 2015;65(4):A78. [EMBASE: 71875225] [Google Scholar]
- Sika M, Umanath K, Goral S, Arfeen SS, Bowline IG, Chernin G, et al. Ferric citrate as a phosphate binder has a safety profile similar to sevelamer carbonate and calcium acetate [abstract no: SA‐PO540]. Journal of the American Society of Nephrology 2013;24(Abstracts):751A. [Google Scholar]
- Umanath K, Blumenthal S, Sika M, Greco B, Jalal DI, Reisin E, et al. Ferric citrate as a phosphate binder reduces IV iron and erythropoietin stimulating agent (ESA) use [abstract no: TH‐PO521]. Journal of the American Society of Nephrology 2013;24(Abstracts):221a. [Google Scholar]
- Umanath K, Greco B, Jalal DI, McFadden M, Sika M, Koury MJ, et al. The safety of achieved iron stores and their effect on IV iron and ESA use: post‐hoc results from a randomized trial of ferric citrate as a phosphate binder in dialysis. Clinical Nephrology 2017;87(3):124‐33. [MEDLINE: ] [DOI] [PubMed] [Google Scholar]
- Umanath K, Jalal DI, Greco BA, Umeukeje EM, Reisin E, Manley J, et al. Ferric citrate reduces intravenous iron and erythropoiesis‐stimulating agent use in ESRD. Journal of the American Society of Nephrology 2015;26(10):2578‐87. [MEDLINE: ] [DOI] [PMC free article] [PubMed] [Google Scholar]
- Umanath K, Sika M, Koury M, Dwyer JP, Lewis J, The Collaborative Study Group. Achieved iron stores and clinical outcomes in a trial of ferric citrate as a phosphate binder [abstract no: SA‐PO382]. Journal of the American Society of Nephrology 2013;24(Abstracts):713A. [Google Scholar]
- Umanath K, Sika M, Niecestro R, Connelly C, Schulman G, Koury MJ, et al. Rationale and study design of a three‐period, 58‐week trial of ferric citrate as a phosphate binder in patients with ESRD on dialysis. Hemodialysis International 2013;17(1):67‐74. [MEDLINE: ] [DOI] [PubMed] [Google Scholar]
- Buren PN, Lewis JB, Dwyer JP, Greene T, Middleton J, Sika M, et al. The phosphate binder ferric citrate and mineral metabolism and inflammatory markers in maintenance dialysis patients: results from prespecified analyses of a randomized clinical trial. American Journal of Kidney Diseases 2015;66(3):479‐88. [MEDLINE: ] [DOI] [PMC free article] [PubMed] [Google Scholar]
van den Bergh 1994 {published data only}
- Bergh JP, Kaufmann BG, Riet GJ, Bottger WM, Verstappen VM. Comparison of three formulations of calcium acetate tablets to evaluate tolerance and control of hyperphosphatemia in patients with chronic renal failure. Nephron 1994;68(4):505‐6. [MEDLINE: ] [DOI] [PubMed] [Google Scholar]
Vemuri 2006 {published data only}
- Vemuri N. Lanthanum carbonate allows for a lower tablet burden to control serum phosphorus levels [abstract no: 167]. American Journal of Kidney Diseases 2006;47(4):A60. [Google Scholar]
Wei 2014 {published data only}
- Wei Y, Kong XL, Li WB, Wang ZS. Effect of calcium carbonate combined with calcitonin on hypercalcemia in hemodialysis patients. Therapeutic Apheresis & Dialysis 2014;18(6):618‐22. [MEDLINE: ] [DOI] [PubMed] [Google Scholar]
Wesseling 2004 {published data only}
- Hernandez J, Wesseling K, Jueppner H, Goodman WG, Gales B, Elashoff R, et al. Skeletal response to phosphate binders and intermittent oral vitamin D in dialyzed children with secondary hyperparathyroidism [abstract no: F‐FC044]. Journal of the American Society of Nephrology 2005;16:47A. [Google Scholar]
- Salusky IB, Wesseling K, Hernandez J, Lavigne JR, Zahranik RJ, Gales B, et al. Comparison between first and second generation PTH assays as predictors of bone turnover during treatment of secondary hyperparathyroidism in dialyzed children [abstract no: SA‐PO833]. Journal of the American Society of Nephrology 2005;16:739A. [Google Scholar]
- Wesseling K, Jueppner H, Goodman WG, Gales B, Elasoff R, Wang H, et al. Similar predictive value of bone turnover by first and second generation PTH assays during treatment of secondary hyperparthyroidism in dialyzed children [abstract no: F‐PO980]. Journal of the American Society of Nephrology 2004;15(Oct):279A. [Google Scholar]
Wuthrich 2013 {published data only}
- Chonchol M, Wuthrich RP, Rakov V, Gaillard S, Tumlin JA. Iron‐based phosphate binder PA21: Effective and well tolerated in CKD hemodialysis patients [abstract]. American Journal of Kidney Diseases 2012;59(4):A27. [EMBASE: 71074665] [Google Scholar]
- Wuthrich RP, Chonchol M, Covic A, Gaillard S, Chong E, Tumlin JA. Randomized clinical trial of the iron‐based phosphate binder PA21 in hemodialysis patients. Clinical Journal of The American Society of Nephrology: CJASN 2013;8(2):280‐9. [MEDLINE: ] [DOI] [PMC free article] [PubMed] [Google Scholar]
- Wuthrich RP, Chong E, Gaillard S. The effect of PA21, an oral iron based phosphate binder, on the reduction of hyperphosphatemia in hemodialysis‐dependent chronic kidney disease (HD‐CKD) patients [abstract no: Sa563]. NDT Plus 2010;3(Suppl 3):iii230. [EMBASE: 70484029] [Google Scholar]
- Wuthrich RP, Covic A, Gaillard S, Rakov V. PA21: An effective and well tolerated iron‐based phosphate binder for haemodialysis patients, including those with diabetes [abstract]. Nephrology Dialysis Transplantation 2012;27(Suppl 2):ii153. [EMBASE: 70765738] [Google Scholar]
Xu 2013 {published data only}
- Xu J, Zhang YX, Yu XQ, Liu ZH, Wang LN, Chen JH, et al. Lanthanum carbonate for the treatment of hyperphosphatemia in CKD 5D: multicenter, double blind, randomized, controlled trial in mainland China. BMC Nephrology 2013;14:29. [MEDLINE: ] [DOI] [PMC free article] [PubMed] [Google Scholar]
Yang 2002 {published data only}
- Yang WC, Yang CS, Hou CC, Wu TH, Cheng YR, Young EW, et al. An open‐label, crossover study of a new phosphate binding agent in hemodialysis patients: ferric citrate [abstract]. 8th Asian Pacific Congress of Nephrology; 2000 Mar 26‐30; Taipei, Taiwan. 2000:187. [CENTRAL: CN‐00462027]
- Yang WC, Yang CS, Hou CC, Wu TH, Young EW, Hsu CH. An open‐label, crossover study of a new phosphate‐binding agent in haemodialysis patients: ferric citrate. Nephrology Dialysis Transplantation 2002;17(2):265‐70. [MEDLINE: ] [DOI] [PubMed] [Google Scholar]
Yokoyama 2012 {published data only}
- Yokoyama K, Hirakata H, Akiba T, Sawada K, Kumagai Y. Effect of oral JTT‐751 (ferric citrate) on hyperphosphatemia in hemodialysis patients: results of a randomized, double‐blind, placebo‐controlled trial. American Journal of Nephrology 2012;36(5):478‐87. [MEDLINE: ] [DOI] [PubMed] [Google Scholar]
References to studies awaiting assessment
NCT00317694 {published data only}
- Roe S. Efficacy and safety study of magnesium iron hydroxycarbonate for the reduction of high blood phosphate in hemodialysis patients. www.clinicalTrials.gov/show/NCT00317694 (first received 25 April 2006).
NCT00560300 {published data only}
- Salusky IB. Regulation of bone formation in renal osteodystrophy. www.clinicaltrials.gov/show/NCT00560300 (first received 19 November 2007).
NCT01968759 {published data only}
- NCT01968759. Sevelamer in proteinuric CKD. www.clinicalTrials.gov/show/NCT01968759 (first received 24 October 2013).
References to ongoing studies
COMBINE 2014 {published data only}
- Gassman JJ. The COMBINE Study: the CKD optimal management with BInders and NicotinamidE. www.clinicaltrials.gov/show/NCT02258074 (first received 7 October 2014).
IMPROVE‐CKD 2012 {published data only}
- Toussaint ND, Pedagogos E. IMPROVE: IMpact of Phosphate Reduction On Vascular End‐points in chronic kidney disease. www.anzctr.org.au/trial_view aspx?id=335812 (first received 10 August 2010).
LANDMARK 2017 {published data only}
- Ogata H, Fugakawa M, Hideki H, Kaneda H, Kagimura T, Akizawa T, et al. Design and baseline characteristics of the LANDMARK study. Clinical & Experimental Nephrology 2017;21(3):531‐7. [MEDLINE: ] [DOI] [PMC free article] [PubMed] [Google Scholar]
Additional references
Block 1998
- Block GA, Hulbert‐Shearon TE, Levin NW, Port FK. Association of serum phosphorus and calcium x phosphate product with mortality risk in chronic hemodialysis patients: a national study. American Journal of Kidney Diseases 1998;31(4):607‐17. [MEDLINE: ] [DOI] [PubMed] [Google Scholar]
Block 2004
- Block GA, Klassen PS, Lazarus JM, Ofsthun N, Lowrie EG, Chertow GM. Mineral metabolism, mortality, and morbidity in maintenance hemodialysis. Journal of the American Society of Nephrology 2004;15(8):2208‐18. [MEDLINE: ] [DOI] [PubMed] [Google Scholar]
Bravo‐Soto 2017
- Bravo‐Soto G, Madrid T. Sevelamer versus calcium‐based phosphate binders for chronic kidney disease? [Sevelamer comparado con quelantes de fosforo en base a calcio para la insuficiencia renal cronica]. Medwave 2017;17(Suppl 2):e6942. [MEDLINE: ] [DOI] [PubMed] [Google Scholar]
Burke 2003
- Burke SK, Dillon MA, Hemken DE, Rezabek MS, Balwit JM. Meta‐analysis of the effect of sevelamer on phosphorus, calcium, PTH, and serum lipids in dialysis patients. Advances in Renal Replacement Therapy 2003;10(2):133‐45. [MEDLINE: ] [DOI] [PubMed] [Google Scholar]
Cozzolino 2005
- Cozzolino M, Brancaccio D, Gallieni M, Slatopolsky E. Pathogenesis of vascular calcification in chronic kidney disease. Kidney International 2005;68(2):429‐36. [MEDLINE: ] [DOI] [PubMed] [Google Scholar]
GRADE 2008
- Guyatt GH, Oxman AD, Vist GE, Kunz R, Falck‐Ytter Y, Alonso‐Coello P, et al. GRADE: an emerging consensus on rating quality of evidence and strength of recommendations. BMJ 2008;336(7650):924‐6. [MEDLINE: ] [DOI] [PMC free article] [PubMed] [Google Scholar]
GRADE 2011
- Guyatt G, Oxman A D, Akl E A, Kunz R, Vist G, Brozek J, et al. GRADE guidelines: 1. Introduction‐GRADE evidence profiles and summary of findings tables. Journal of Clinical Epidemiology 2011;64:383‐94. [MEDLINE: ] [DOI] [PubMed] [Google Scholar]
Gray 2011
- Gray NA, Krishnasamy R, Vardesh DL, Hollett PR, Anstey CM. Impact of non‐traditional phosphate binders and cinacalcet on haemodialysis patient biochemistry, pill burden and cost. Nephrology 2011;16(8):688‐96. [MEDLINE: ] [DOI] [PubMed] [Google Scholar]
Guerin 2001
- Guerin AP, Blacher J, Pannier B, Marchais SJ, Safar ME, London GM. Impact of aortic stiffness attenuation on survival of patients in end‐stage renal failure. Circulation 2001;103(7):987‐92. [MEDLINE: ] [DOI] [PubMed] [Google Scholar]
Gutiérrez 2005
- Gutiérrez O, Isakova T, Rhee E, Shah A, Holmes J, Collerone G, et al. Fibroblast growth factor‐23 mitigates hyperphosphatemia but accentuates calcitriol deficiency in chronic kidney disease. Journal of the American Society of Nephrology 2005;16(7):2205‐15. [MEDLINE: ] [DOI] [PubMed] [Google Scholar]
Gutiérrez 2008
- Gutiérrez OM, Mannstadt M, Isakova T, Rauh‐Hain JA, Tamez H, Shah A, et al. Fibroblast growth factor 23 and mortality among patients undergoing hemodialysis. New England Journal of Medicine 2008;359(6):584‐92. [MEDLINE: ] [DOI] [PMC free article] [PubMed] [Google Scholar]
Habbous 2017
- Habbous S, Przech S, Acedillo R, Sarma S, Garg AX. The efficacy and safety of sevelamer and lanthanum versus calcium‐containing and iron‐based binders in treating hyperphosphatemia in patients with chronic kidney disease: a systematic review and meta‐analysis. Nephrology Dialysis Transplantation 2017;32(1):111‐25. [MEDLINE: ] [DOI] [PubMed] [Google Scholar]
Hahn 2015
- Hahn D, Hodson EM, Craig JC. Interventions for metabolic bone disease in children with chronic kidney disease. Cochrane Database of Systematic Reviews 2015, Issue 11. [DOI: 10.1002/14651858.CD008327.pub2] [DOI] [PMC free article] [PubMed] [Google Scholar]
Higgins 2003
- Higgins JP, Thompson SG, Deeks JJ, Altman DG. Measuring inconsistency in meta‐analyses. BMJ 2003;327(7414):557‐60. [MEDLINE: ] [DOI] [PMC free article] [PubMed] [Google Scholar]
Higgins 2011
- Higgins JP, Green S (editors). Cochrane Handbook for Systematic Reviews of Interventions Version 5.1.0 [updated March 2011]. The Cochrane Collaboration, 2011. Available from www.cochrane‐handbook.org.
Hruska 2008
- Hruska KA, Mathew S, Lund R, Qiu P, Pratt R. Hyperphosphatemia of chronic kidney disease. Kidney International 2008;74(2):148‐57. [MEDLINE: ] [DOI] [PMC free article] [PubMed] [Google Scholar]
Jamal 2009
- Jamal SA, Fitchett D, Lok CE, Mendelssohn DC, Tsuyuki RT. The effects of calcium‐based versus non‐calcium‐based phosphate binders on mortality among patients with chronic kidney disease: a meta‐analysis. Nephrology Dialysis Transplantation 2009;24(10):3168‐74. [MEDLINE: ] [DOI] [PubMed] [Google Scholar]
Jamal 2013
- Jamal SA, Vandermeer B, Raggi P, Mendelssohn DC, Chatterley T, Dorgan M, et al. Effect of calcium‐based versus non‐calcium‐based phosphate binders on mortality in patients with chronic kidney disease: an updated systematic review and meta‐analysis. Lancet 2013;382(9900):1268‐77. [MEDLINE: ] [DOI] [PubMed] [Google Scholar]
K/DOQI 2003
- National Kidney Foundation. K/DOQI clinical practice guidelines for bone metabolism and disease in chronic kidney disease. American Journal of Kidney Diseases 2003;42(4 Suppl 3):70‐7. [MEDLINE: ] [PubMed] [Google Scholar]
KDIGO 2009
- Kidney Disease: Improving Global Outcomes (KDIGO) CKD‐MBD Work Group. KDIGO clinical practice guideline for the diagnosis, evaluation, prevention, and treatment of chronic kidney disease‐mineral and bone disorder (CKD‐MBD). Kidney International ‐ Supplement 209;76(113):S1‐130. [MEDLINE: ] [DOI] [PubMed] [Google Scholar]
KDIGO 2012
- Kidney Disease: Improving Global Outcomes (KDIGO) CKD Work Group. KDIGO 2012 clinical practice guideline for the evaluation and management of chronic kidney disease. Kidney International ‐ Supplement 2013;3(1):1‐150. [EMBASE: 369856107] [Google Scholar]
KDIGO 2017
- Kidney Disease: Improving Glogal Outcomes (KDIGO) CKD‐MBD Update Work Group. KDIGO 2017 Clinical Practice Guideline Update for the Diagnosis, Evaluation, Prevention, and Treatment of Chronic Kidney Disease‐Mineral and Bone Disorder (CKD‐MBD). Kidney International ‐ Supplement 2017;7(3):1‐59. [EMBASE: 617012703] [DOI] [PMC free article] [PubMed] [Google Scholar]
Kumar 2011
- Kumar R, Thompson JR. The regulation of parathyroid hormone secretion and synthesis. Journal of the American Society of Nephrology 2011;22(2):216‐24. [MEDLINE: ] [DOI] [PMC free article] [PubMed] [Google Scholar]
Levin 2007
- Levin A, Bakris GL, Molitch M, Smulders M, Tian J, Williams LA, et al. Prevalence of abnormal serum vitamin D, PTH, calcium, and phosphorus in patients with chronic kidney disease: results of the study to evaluate early kidney disease.[Erratum appears in Kidney Int. 2009 Jun;75(11):1237]. Kidney International 2007;71(1):31‐8. [MEDLINE: ] [DOI] [PubMed] [Google Scholar]
Manns 2004
- Manns B, Stevens L, Miskulin D, Owen WF Jr, Winkelmayer WC, Tonelli M. A systematic review of sevelamer in ESRD and an analysis of its potential economic impact in Canada and the United States. Kidney International 2004;66(3):1239‐47. [MEDLINE: ] [DOI] [PubMed] [Google Scholar]
Palmer 2007
- Palmer SC, McGregor DO, Strippoli GF. Interventions for preventing bone disease in kidney transplant recipients. Cochrane Database of Systematic Reviews 2007, Issue 3. [DOI: 10.1002/14651858.CD005015.pub3] [DOI] [PubMed] [Google Scholar]
Palmer 2011
- Palmer SC, Hayen A, Macaskill P, Pellegrini F, Craig JC, Elder GJ, et al. Serum levels of phosphorus, parathyroid hormone, and calcium and risks of death and cardiovascular disease in individuals with chronic kidney disease: a systematic review and meta‐analysis. JAMA 2011;305(11):1119‐27. [MEDLINE: ] [DOI] [PubMed] [Google Scholar]
Palmer 2016
- Palmer SC, Gardner S, Tonelli M, Mavridis D, Johnson DW, Craig JC, et al. Phosphate‐binding agents in adults with CKD: a network meta‐analysis of randomized controlled trials.[Erratum appears in Am J Kidney Dis. 2017 Sep;70(3):452; PMID: 28676197]. American Journal of Kidney Diseases 2016;68(5):691‐702. [MEDLINE: ] [DOI] [PubMed] [Google Scholar]
Patel 2016
- Patel L, Bernard LM, Elder GJ. Sevelamer versus calcium‐based binders for treatment of hyperphosphatemia in CKD: a meta‐analysis of randomized controlled trials. Clinical Journal of The American Society of Nephrology: CJASN 2016;11(2):232‐44. [MEDLINE: ] [DOI] [PMC free article] [PubMed] [Google Scholar]
Salusky 2006
- Salusky IB. A new era in phosphate binder therapy: what are the options?. Kidney International ‐ Supplement 2006, (105):S10‐5. [MEDLINE: ] [DOI] [PubMed] [Google Scholar]
Schünemann 2011a
- Schünemann HJ, Oxman AD, Higgins JP, Vist GE, Glasziou P, Guyatt GH. Chapter 11: Presenting results and 'Summary of findings' tables. In: Higgins JP, Green S (editors). Cochrane Handbook for Systematic Reviews of Interventions Version 5.1.0 [updated March 2011]. The Cochrane Collaboration, 2011. Available from www.cochrane‐handbook.org.
Schünemann 2011b
- Schünemann HJ, Oxman AD, Higgins JP, Deeks JJ, Glasziou P, Guyatt GH. Chapter 12: Interpreting results and drawing conclusions. In: Higgins JP, Green S (editors). Cochrane Handbook for Systematic Reviews of Interventions Version 5.1.0 [updated March 2011]. The Cochrane Collaboration, 2011. Available from www.cochrane‐handbook.org.
Sekercioglu 2016
- Sekercioglu N, Thabane L, Díaz Martínez JP, Nesrallah G, Longo CJ, Busse JW, et al. Comparative effectiveness of phosphate binders in patients with chronic kidney disease: a systematic review and network meta‐analysis. PLoS ONE (Electronic Resource] 2016;11(6):e0156891. [MEDLINE: ] [DOI] [PMC free article] [PubMed] [Google Scholar]
Sekercioglu 2017
- Sekercioglu N, Angeliki Veroniki A, Thabane L, Busse JW, Akhtar‐Danesh N, Iorio A, et al. Effects of different phosphate lowering strategies in patients with CKD on laboratory outcomes: A systematic review and NMA. PLoS ONE (Electronic Resource] 2017;12(3):e0171028. [MEDLINE: ] [DOI] [PMC free article] [PubMed] [Google Scholar]
Silver 2005
- Silver J, Levi R. Cellular and molecular mechanisms of secondary hyperparathyroidism. Clinical Nephrology 2005;63(2):119‐26. [MEDLINE: ] [DOI] [PubMed] [Google Scholar]
St Peter 2008
- Peter WL, Liu J, Weinhandl E, Fan Q. A comparison of sevelamer and calcium‐based phosphate binders on mortality, hospitalization, and morbidity in hemodialysis: a secondary analysis of the Dialysis Clinical Outcomes Revisited (DCOR) randomized trial using claims data. American Journal of Kidney Diseases 2008;51(3):445‐54. [MEDLINE: ] [DOI] [PubMed] [Google Scholar]
St Peter 2009
- Peter W, Fan Q, Weinhandl E, Liu J. Economic evaluation of sevelamer versus calcium‐based phosphate binders in hemodialysis patients: a secondary analysis using centers for Medicare & Medicaid services data. Clinical Journal of the American Society of Nephrology: CJASN 2009;4(12):1954‐61. [MEDLINE: ] [DOI] [PMC free article] [PubMed] [Google Scholar]
St. Peter 2018
- Peter WL, Wazny LD, Weinhandl ED. Phosphate‐binder use in US dialysis patients: prevalence, costs, evidence, and policies. American Journal of Kidney Diseases 2018;71(2):246‐53. [MEDLINE: ] [DOI] [PubMed] [Google Scholar]
Stevens 2004
- Stevens LA, Djurdjev O, Cardew S, Cameron EC, Levin A. Calcium, phosphate, and parathyroid hormone levels in combination and as a function of dialysis duration predict mortality: evidence for the complexity of the association between mineral metabolism and outcomes. Journal of the American Society of Nephrology 2004;15(3):770‐9. [MEDLINE: ] [DOI] [PubMed] [Google Scholar]
Tentori 2008
- Tentori F, Blayney MJ, Albert JM, Gillespie BW, Kerr PG, Bommer J, et al. Mortality risk for dialysis patients with different levels of serum calcium, phosphorus, and PTH: the Dialysis Outcomes and Practice Patterns Study (DOPPS). American Journal of Kidney Diseases 2008;52(3):519‐30. [MEDLINE: ] [DOI] [PubMed] [Google Scholar]
Tonelli 2007
- Tonelli M, Wiebe N, Culleton B, Lee H, Klarenbach S, Shrive F, et al. Systematic review of the clinical efficacy and safety of sevelamer in dialysis patients. Nephrology Dialysis Transplantation 2007;22(10):2856‐66. [MEDLINE: ] [DOI] [PubMed] [Google Scholar]
USRDS 2009
- United States Renal Data System (USRDS). Costs of ESRD. www.usrds.org/2009/pdf/V2_11_09.pdf (accessed July 2018).
Wang 2015
- Wang C, Liu X, Zhou Y, Li S, Chen Y, Wang Y, et al. New conclusions regarding comparison of sevelamer and calcium‐based phosphate binders in coronary‐artery calcification for dialysis patients: a meta‐analysis of randomized controlled trials. PLoS ONE (Electronic Resource] 2015;10(7):e0133938. [MEDLINE: ] [DOI] [PMC free article] [PubMed] [Google Scholar]
Wood 2008
- Wood L, Egger M, Gluud LL, Schulz KF, Jüni P, Altman DG, et al. Empirical evidence of bias in treatment effect estimates in controlled trials with different interventions and outcomes: meta‐epidemiological study. BMJ 2008;336(7644):601‐5. [MEDLINE: ] [DOI] [PMC free article] [PubMed] [Google Scholar]
Zhang 2010
- Zhang Q, Li M, Lu Y, Li H, Gu Y, Hao C, et al. Meta‐analysis comparing sevelamer and calcium‐based phosphate binders on cardiovascular calcification in hemodialysis patients. Nephron 2010;115(4):c259‐67. [MEDLINE: ] [DOI] [PubMed] [Google Scholar]
References to other published versions of this review
Navaneethan 2006
- Navaneethan SD, Palmer SC, Vecchio M, Craig JC, Elder G, Strippoli GF. Phosphate binders for preventing and treating bone disease in chronic kidney disease patients. Cochrane Database of Systematic Reviews 2006, Issue 2. [DOI: 10.1002/14651858.CD006023] [DOI] [PubMed] [Google Scholar]
Navaneethan 2011
- Navaneethan SD, Palmer SC, Vecchio M, Craig JC, Elder GJ, Strippoli GF. Phosphate binders for preventing and treating bone disease in chronic kidney disease patients. Cochrane Database of Systematic Reviews 2011, Issue 2. [DOI: 10.1002/14651858.CD006023.pub2] [DOI] [PubMed] [Google Scholar]