

Abstract
Background
Diabetes is the commonest cause of chronic kidney disease (CKD). Both conditions commonly co‐exist. Glucometabolic changes and concurrent dialysis in diabetes and CKD make glucose‐lowering challenging, increasing the risk of hypoglycaemia. Glucose‐lowering agents have been mainly studied in people with near‐normal kidney function. It is important to characterise existing knowledge of glucose‐lowering agents in CKD to guide treatment.
Objectives
To examine the efficacy and safety of insulin and other pharmacological interventions for lowering glucose levels in people with diabetes and CKD.
Search methods
We searched the Cochrane Kidney and Transplant Register of Studies up to 12 February 2018 through contact with the Information Specialist using search terms relevant to this review. Studies in the Register are identified through searches of CENTRAL, MEDLINE, and EMBASE, conference proceedings, the International Clinical Trials Register (ICTRP) Search Portal and ClinicalTrials.gov.
Selection criteria
All randomised controlled trials (RCTs) and quasi‐RCTs looking at head‐to‐head comparisons of active regimens of glucose‐lowering therapy or active regimen compared with placebo/standard care in people with diabetes and CKD (estimated glomerular filtration rate (eGFR) < 60 mL/min/1.73 m2) were eligible.
Data collection and analysis
Four authors independently assessed study eligibility, risk of bias, and quality of data and performed data extraction. Continuous outcomes were expressed as post‐treatment mean differences (MD). Adverse events were expressed as post‐treatment absolute risk differences (RD). Dichotomous clinical outcomes were presented as risk ratios (RR) with 95% confidence intervals (CI).
Main results
Forty‐four studies (128 records, 13,036 participants) were included. Nine studies compared sodium glucose co‐transporter‐2 (SGLT2) inhibitors to placebo; 13 studies compared dipeptidyl peptidase‐4 (DPP‐4) inhibitors to placebo; 2 studies compared glucagon‐like peptide‐1 (GLP‐1) agonists to placebo; 8 studies compared glitazones to no glitazone treatment; 1 study compared glinide to no glinide treatment; and 4 studies compared different types, doses or modes of administration of insulin. In addition, 2 studies compared sitagliptin to glipizide; and 1 study compared each of sitagliptin to insulin, glitazars to pioglitazone, vildagliptin to sitagliptin, linagliptin to voglibose, and albiglutide to sitagliptin. Most studies had a high risk of bias due to funding and attrition bias, and an unclear risk of detection bias.
Compared to placebo, SGLT2 inhibitors probably reduce HbA1c (7 studies, 1092 participants: MD ‐0.29%, ‐0.38 to ‐0.19 (‐3.2 mmol/mol, ‐4.2 to ‐2.2); I2 = 0%), fasting blood glucose (FBG) (5 studies, 855 participants: MD ‐0.48 mmol/L, ‐0.78 to ‐0.19; I2 = 0%), systolic blood pressure (BP) (7 studies, 1198 participants: MD ‐4.68 mmHg, ‐6.69 to ‐2.68; I2 = 40%), diastolic BP (6 studies, 1142 participants: MD ‐1.72 mmHg, ‐2.77 to ‐0.66; I2 = 0%), heart failure (3 studies, 2519 participants: RR 0.59, 0.41 to 0.87; I2 = 0%), and hyperkalaemia (4 studies, 2788 participants: RR 0.58, 0.42 to 0.81; I2 = 0%); but probably increase genital infections (7 studies, 3086 participants: RR 2.50, 1.52 to 4.11; I2 = 0%), and creatinine (4 studies, 848 participants: MD 3.82 μmol/L, 1.45 to 6.19; I2 = 16%) (all effects of moderate certainty evidence). SGLT2 inhibitors may reduce weight (5 studies, 1029 participants: MD ‐1.41 kg, ‐1.8 to ‐1.02; I2 = 28%) and albuminuria (MD ‐8.14 mg/mmol creatinine, ‐14.51 to ‐1.77; I2 = 11%; low certainty evidence). SGLT2 inhibitors may have little or no effect on the risk of cardiovascular death, hypoglycaemia, acute kidney injury (AKI), and urinary tract infection (low certainty evidence). It is uncertain whether SGLT2 inhibitors have any effect on death, end‐stage kidney disease (ESKD), hypovolaemia, fractures, diabetic ketoacidosis, or discontinuation due to adverse effects (very low certainty evidence).
Compared to placebo, DPP‐4 inhibitors may reduce HbA1c (7 studies, 867 participants: MD ‐0.62%, ‐0.85 to ‐0.39 (‐6.8 mmol/mol, ‐9.3 to ‐4.3); I2 = 59%) but may have little or no effect on FBG (low certainty evidence). DPP‐4 inhibitors probably have little or no effect on cardiovascular death (2 studies, 5897 participants: RR 0.93, 0.77 to 1.11; I2 = 0%) and weight (2 studies, 210 participants: MD 0.16 kg, ‐0.58 to 0.90; I2 = 29%; moderate certainty evidence). Compared to placebo, DPP‐4 inhibitors may have little or no effect on heart failure, upper respiratory tract infections, and liver impairment (low certainty evidence). Compared to placebo, it is uncertain whether DPP‐4 inhibitors have any effect on eGFR, hypoglycaemia, pancreatitis, pancreatic cancer, or discontinuation due to adverse effects (very low certainty evidence).
Compared to placebo, GLP‐1 agonists probably reduce HbA1c (7 studies, 867 participants: MD ‐0.53%, ‐1.01 to ‐0.06 (‐5.8 mmol/mol, ‐11.0 to ‐0.7); I2 = 41%; moderate certainty evidence) and may reduce weight (low certainty evidence). GLP‐1 agonists may have little or no effect on eGFR, hypoglycaemia, or discontinuation due to adverse effects (low certainty evidence). It is uncertain whether GLP‐1 agonists reduce FBG, increase gastrointestinal symptoms, or affect the risk of pancreatitis (very low certainty evidence).
Compared to placebo, it is uncertain whether glitazones have any effect on HbA1c, FBG, death, weight, and risk of hypoglycaemia (very low certainty evidence).
Compared to glipizide, sitagliptin probably reduces hypoglycaemia (2 studies, 551 participants: RR 0.40, 0.23 to 0.69; I2 = 0%; moderate certainty evidence). Compared to glipizide, sitagliptin may have had little or no effect on HbA1c, FBG, weight, and eGFR (low certainty evidence). Compared to glipizide, it is uncertain if sitagliptin has any effect on death or discontinuation due to adverse effects (very low certainty).
For types, dosages or modes of administration of insulin and other head‐to‐head comparisons only individual studies were available so no conclusions could be made.
Authors' conclusions
Evidence concerning the efficacy and safety of glucose‐lowering agents in diabetes and CKD is limited. SGLT2 inhibitors and GLP‐1 agonists are probably efficacious for glucose‐lowering and DPP‐4 inhibitors may be efficacious for glucose‐lowering. Additionally, SGLT2 inhibitors probably reduce BP, heart failure, and hyperkalaemia but increase genital infections, and slightly increase creatinine. The safety profile for GLP‐1 agonists is uncertain. No further conclusions could be made for the other classes of glucose‐lowering agents including insulin. More high quality studies are required to help guide therapeutic choice for glucose‐lowering in diabetes and CKD.
Plain language summary
Glucose‐lowering medications to treat diabetes and chronic kidney disease
What is the issue? Diabetes is the commonest cause of chronic kidney disease (CKD). Due to decreased kidney function and changes in the clearance of medications and glucose, treating people with diabetes and CKD is challenging. There is an increased risk of hypoglycaemia (low blood sugar). However, most glucose‐lowering medications have been studied in people with near normal kidney function. The aim of this review is to determine the effectiveness and safety of glucose‐lowering medication in people with diabetes and CKD.
What did we do? We looked at studies comparing different medications with each other or to no medications in people with diabetes and CKD.
What did we find?
We included 44 studies involving 13,036 people. Most studies compared different medication types ‐ sodium glucose co‐transporter‐2 (SGLT2) inhibitors, dipeptidyl peptidase‐4 (DPP‐4) inhibitors, glucagon‐like peptide‐1 (GLP‐1) agonists, and glitazones to no treatment. Two studies compared the medications sitagliptin to glipizide.
SGLT2 inhibitors probably reduce glucose levels, blood pressure, heart failure and high potassium levels but increase genital infections and slightly reduce kidney function. SGLT2 inhibitors may reduce weight. Their effect on the risk of death, hypoglycaemia, acute kidney injury, urinary tract infection, end‐stage kidney disease, low blood volume, bone fractures, diabetic ketoacidosis is uncertain.
DPP‐4 inhibitors may reduce glucose levels. Their effect on the risk of death due to heart attacks and strokes, heart failure, upper respiratory tract infections, liver problems, kidney function, hypoglycaemia, pancreatitis and pancreatic cancer is uncertain.
GLP‐1 agonists probably reduce glucose levels and may reduce weight. Their effect on kidney function, hypoglycaemia, gastrointestinal symptoms and pancreatitis is uncertain.
Compared to glipizide, sitagliptin probably has a lower risk of hypoglycaemia.
No conclusions could be made regarding other glucose‐lowering medications when compared to another medication or no treatment because of the lack of studies.
Conclusions
Evidence concerning the efficacy and safety of glucose‐lowering agents for people with diabetes and CKD is limited. SGLT2 inhibitors and GLP‐1 agonists are probably efficacious for lowering glucose levels. Other potential effects of SGLT2 inhibitors include lower BP, lower potassium levels and a reduced risk of heart failure but an increased risk of genital infections. The safety of GLP‐1 agonists is uncertain.
The benefits and safety of other classes of glucose‐lowering agents are uncertain.
More studies are required to help guide which glucose‐lowering medications are most suitable in people with both diabetes and CKD.
Summary of findings
Background
Description of the condition
Diabetes is a highly prevalent condition, affecting 8.2% of adults or 382 million people globally. The incidence is increasing with an estimated global prevalence of 592 million people by 2035 (IDF 2013).
Chronic kidney disease (CKD), defined as the sustained loss of kidney function over an extended period of time or the presence of albuminuria or other markers of kidney damage, has been estimated to affect 16% of the general population in screening studies (Chadban 2003; Coresh 2003; Perkovic 2007). CKD prevalence is increasing in the USA and other countries (Chadban 2003). Progression to end‐stage kidney disease (ESKD) leads to significant morbidity and mortality with people requiring permanent renal replacement therapy (RRT) either as dialysis or kidney transplantation. The prognosis of people with ESKD is poor, with a 6% to 20% annual mortality rate for all people on dialysis (Collins 2008).
Diabetes is the commonest cause of CKD, and accounts for up to 50% of people who develop ESKD (Collins 2007; ANZDATA 2008). The increasing incidence of diabetes is a likely contributor to the escalating incidence of CKD, with one third of the increase in ESKD cases from 1978 to 1991 in the USA attributable to diabetes. Diabetes is also a common comorbidity in people with non‐diabetic kidney disease (ANZDATA 2008). Both diabetes and CKD are associated with an increased risk of cardiovascular disease, with the risk being additive for people with both conditions, and increasing with CKD progression (Radbill 2008).
Observational studies reporting on the relationship between glucose control and clinical outcomes in diabetes and CKD are conflicting with some showing a clear positive association (Morioka 2001; Oomichi 2006; Wu 1997), others showing no relationship (Shurraw 2010; Williams 2006), and some a U‐shaped association (Shurraw 2011). This discrepancy results from inherent limitations of observational studies, differences in the characteristics of study populations, and differences in glucose control measurements. Additionally, most considered glucose control as a single predictor of clinical outcomes rather than a component of a multifaceted treatment regimen including the control of blood pressure (BP), cholesterol and weight (Feldt‐Rasmussen 2006).
Description of the intervention
Pharmacological interventions used to improve glucose control include both oral glucose‐lowering agents and injectables including glucose‐like peptide type 1 analogues (GLP‐1) and insulin. In type 2 diabetes, these agents are used as single or combination therapy, with pharmacological agent choice and combination tailored to the patient being treated. Pharmacotherapy is typically introduced in a stepwise fashion beginning with oral agents followed by the introduction of injectables such as GLP‐1 analogues and insulin (ADA 2017; Inzucchi 2012). In type 1 diabetes, insulins are the mainstay of therapy (ADA 2017).
Apart from insulins, the choice of available pharmacological interventions to lower high glucose levels has expanded rapidly over the past decade. Commonly prescribed classes of glucose‐lowering medications include biguanides, thiazolidinediones (glitazones), second generation sulphonylureas, ɑ‐glucosidase inhibitors, glucagon‐like peptide‐1 analogues, dipeptidyl peptidase‐4 (DPP‐4) inhibitors, sodium glucose co‐transporter 2 (SGLT2) inhibitors, and insulins. Newer or emerging classes of glucose‐lowering medications are dual peroxisome proliferator‐activated receptor (PPAR) agonists, amylin analogues, bromocriptine and GPR40 or free fatty acid receptor 1 (FFAR1) agonists.
To date, the efficacy and safety of these therapies have not been well documented in people with diabetes and CKD.
How the intervention might work
Large scale studies conducted in people with diabetes and preserved kidney function provide evidence that intensive glucose‐lowering reduces the incidence and progression of microvascular outcomes (ADVANCE Group 2008; CONTROL Group 2009; DCCT Group 1993; DCCT Group 1995; Duckworth 2009; Holman 2008; Ismail‐Beigi 2010Nathan 2005; UKPDS 33 1998; UKPDS 34 1998). Additionally, several large studies and meta‐analysis have shown that intensive glucose‐lowering reduces the progression of kidney disease (ADVANCE Group 2008; DCCT Group 1995; Duckworth 2009; Ismail‐Beigi 2010; Levin 2000; Ohkubo 1995; UKPDS 33 1998; Zoungas 2017), with both the ADVANCE (ADVANCE Group 2008) and ACCORD (Ismail‐Beigi 2010) studies showing that progression of both microalbuminuria and macroalbuminuria were reduced, and the ADVANCE study showing a reduction in the development of ESKD (Perkovic 2013).
Given that diabetes is the leading cause of CKD worldwide, optimal glucose control in people with kidney disease has been proposed to reduce adverse kidney and cardiovascular events. However, existing studies have mainly studied participants without CKD. Consequently, it is unknown whether these benefits would be observed in people with established CKD, especially with more advanced CKD (stages 3 to 5).
Why it is important to do this review
Achieving near normal glucose levels in people with diabetes and CKD poses a challenging task. The development and progression of CKD results in glucometabolic changes (increased hepatic glucose output, reduced glucose disposal and greater insulin resistance), that increase blood glucose levels. Simultaneously, reduced insulin and drug clearance increase the risk of hypoglycaemia (Moen 2009). Moreover, the commencement of dialysis improves insulin sensitivity (Kobayashi 2000) and increases the risk of hypoglycaemia (Jackson 2000; Loipl 2005).
Past studies of intensive glucose control have failed to include meaningful numbers of people with CKD (that is, reduced glomerular filtration rate (GFR)) with much of the evidence coming from studies involving people with diabetes in the general population or those with earlier stages of kidney disease. Based on currently available evidence, international guidelines (Chadban 2010; KDOQI 2012) continue to advocate the achievement of optimal glucose control as part of a comprehensive treatment approach for people with diabetes and CKD.
Given the current uncertainty regarding the effectiveness and safety of contemporary glucose‐lowering strategies, a critical review is urgently needed to inform clinical practice and highlight areas requiring further research.
Originally, this review was to be part of a larger review examining glucose‐lowering therapies in CKD and kidney transplantation ("Glucose‐lowering therapies for chronic kidney disease and kidney transplantation") (Jun 2012). However, as the specific challenges of managing blood glucose levels were deemed different in kidney transplant recipients compared with other people with CKD, we decided to examine the efficacy and safety of contemporary glucose‐lowering in these different populations in separate reviews. This review examined glucose‐lowering in people with diabetes and CKD. The accompanying review "Glucose‐lowering agents for treating pre‐existing and new onset diabetes in kidney transplant recipients" (Lo 2017) was published in February 2017.
Objectives
To examine the efficacy and safety of insulin and other pharmacological interventions for lowering glucose levels in people with diabetes and CKD.
Methods
Criteria for considering studies for this review
Types of studies
All randomised controlled trials (RCTs)
Quasi‐RCTs (RCTs in which allocation to treatment was obtained by alternation, use of alternate medical records, date of birth or other predictable methods)
Cross‐over studies (first phase considered only).
Types of participants
Inclusion criteria
Adults and children with diabetes and CKD. The definition of CKD will be limited to an eGFR < 60 mL/min/1.73 m2 or The Kidney Disease Improving Global Outcomes (KDIGO) GFR stages 3 to 5 (KDIGO 2011; KDOQI 2002).
Exclusion criteria
Transplant recipients (kidney, pancreas and islet cell).
Types of interventions
Head‐to‐head comparisons of active regimens (including comparisons of monotherapy or combination therapy with two or more pharmacological glucose‐lowering interventions, comparisons of different doses and durations of the same intervention) or active regimen compared with placebo, control or standard care.
Metformin
Insulin
Sulphonylurea (excluding first generation)
Glinides
Glitazones
ɑ‐glucosidase inhibitors
Glucagon‐like peptide‐1 agonists
DPP‐4 inhibitors
SGLT2 inhibitors
Amylin analogues
Bromocriptine.
Types of outcome measures
Efficacy
Safety.
Primary outcomes
Glycated haemoglobin A1c (HbA1c)
Fasting blood glucose (FBG)
Secondary outcomes
Kidney function (creatinine, estimated GFR (eGFR), albuminuria)
Systolic and diastolic BP
Lipids (total cholesterol, HDL, LDL, triglyceride)
Body weight
Death (all causes)
Macrovascular events (cardiovascular death, non‐fatal myocardial infarction, non‐fatal stroke)
Microvascular events (new or worsening kidney disease, or retinopathy)
-
Safety
Hypoglycaemia
Discontinuation of medication due to adverse events
Other adverse events as described by the authors.
Search methods for identification of studies
Electronic searches
We searched the Cochrane Kidney and Transplant Specialised Register to 12 February 2018 through contact with the Information Specialist using search terms relevant to this review. The Specialised Register contains studies identified from the following sources.
Monthly searches of the Cochrane Central Register of Controlled Trials (CENTRAL)
Weekly searches of MEDLINE OVID SP
Hand searching of kidney‐related journals and the proceedings of major kidney conferences
Searching of the current year of EMBASE OVID SP
Weekly current awareness alerts for selected kidney and transplant journals
Searches of the International Clinical Trials Register (ICTRP) Search Portal and ClinicalTrials.gov.
Studies contained in the Specialised Register are identified through search strategies for CENTRAL, MEDLINE, and EMBASE based on the scope of Cochrane Kidney and Transplant. Details of these strategies, as well as a list of handsearched journals, conference proceedings and current awareness alerts, are available in the Specialised Register section of information about Cochrane Kidney and Transplant.
See Appendix 1 for search terms used in strategies for this review.
Searching other resources
Reference lists of review articles, relevant studies and clinical practice guidelines.
Letters seeking information about unpublished or incomplete studies to investigators known to be involved in previous studies.
Data collection and analysis
Selection of studies
The search strategy described was used to obtain titles and abstracts of all possible studies relevant to the review. The titles and abstracts were screened independently by two authors, who discarded studies that were not applicable. However, studies and reviews that might include relevant data or information on studies were retained initially. Two authors independently assessed retrieved abstracts, and if necessary the full text, of these studies to determine which satisfied the inclusion criteria. Two other independent authors assessed studies written in Chinese.
Data extraction and management
Data extraction was carried out independently by two authors using standard data extraction forms for English studies, and two other authors independently extracted data for relevant studies in Chinese. Where more than one publication of one study existed, reports were grouped together and relevant data from each report were used in the analyses. Where relevant outcomes were only published in earlier versions these data were used. Any discrepancies between published versions were highlighted. The following data were extracted ‐ participant characteristics (including demographic information and comorbidities), interventions (including concomitant medications and interventions), and the previously specified primary and secondary outcomes (Types of outcome measures). Any disagreements were resolved by a fifth author.
Assessment of risk of bias in included studies
The following items were independently assessed by four authors (two for studies in English and two for studies in Chinese) using the risk of bias assessment tool (Higgins 2011) (see Appendix 2).
Was there adequate sequence generation (selection bias)?
Was allocation adequately concealed (selection bias)?
-
Was knowledge of the allocated interventions adequately prevented during the study?
Participants and personnel (performance bias)
Outcome assessors (detection bias)
Were incomplete outcome data adequately addressed (attrition bias)?
Are reports of the study free of suggestion of selective outcome reporting (reporting bias)?
Was the study apparently free of other problems that could put it at a risk of bias?
Any disagreements were resolved by a fifth author.
Measures of treatment effect
For dichotomous outcomes (all‐cause mortality, macrovascular events, microvascular events) results were expressed as risk ratios (RR) with 95% confidence intervals (CI). Where continuous scales of measurement were used to assess the effects of treatment (HbA1c, FBG, BP, lipids, body weight), the mean difference (MD) was expressed, or the standardised mean difference (SMD) if different scales had been used.
For adverse events, results were expressed as post treatment absolute risk differences.
Unit of analysis issues
All units for analysis were converted to SI units and % for HbA1c.
Dealing with missing data
Any additional information required from the original authors were requested by written correspondence (e.g. emailing corresponding author) and any relevant information obtained was included in the review. Evaluation of important numerical data such as screened and randomised people as well as intention‐to‐treat, as‐treated and per‐protocol populations were carefully performed. Attrition rates, for example drop‐outs, losses to follow‐up and withdrawals were investigated. Issues of missing data and imputation methods (for example, last‐observation‐carried‐forward) were critically appraised (Higgins 2011).
Assessment of heterogeneity
Heterogeneity was first assessed by visual inspection of the forest plot before being analysed using a Chi2 test on N‐1 degrees of freedom, with an alpha of 0.05 used for statistical significance and with the I2 test (Higgins 2003).
The interpretation of I2 values is as follows:
0% to 40%: might not be important;
30% to 60%: may represent moderate heterogeneity;
50% to 90%: may represent substantial heterogeneity;
75% to 100%: considerable heterogeneity
The importance of the observed value of I2 depends on the magnitude and direction of treatment effects and the strength of evidence for heterogeneity (e.g. P‐value from the Chi2 test, or a confidence interval for I2; Higgins 2011).
Assessment of reporting biases
If sufficient RCTs were identified, funnel plots were used to assess for the potential existence of small study bias (Higgins 2011).
Data synthesis
Data were pooled using the random‐effects model but the fixed‐effect model was also used to ensure robustness of the model chosen and susceptibility to outliers. Where data were reported in insufficient detail to allow meta‐analysis and further information was not forthcoming from trialists, these outcomes were tabulated and assessed with descriptive techniques and where possible the risk difference (RD) with 95% CI was calculated. If adequate data were available then the number of persons needed to treat to avoid one cardiovascular death was calculated.
Subgroup analysis and investigation of heterogeneity
Subgroup analysis was used to explore possible sources of heterogeneity according to the following characteristics:
Sex
Age
History of cardiac disease
Glucose‐lowering agent and dose of glucose‐lowering agent
Concomitant glucose‐lowering agents (such as insulin)
Dose and duration of concomitant glucose‐lowering agent used (such as insulin)
Concomitant medications (such as aspirin or BP medications)
Baseline HbA1c level
Type 1 diabetes versus type 2 diabetes
CKD stages (3, 4 and 5)
Primary cause of kidney disease (diabetes versus others).
Adverse effects were tabulated and assessed with descriptive techniques. Where possible, the risk difference with 95% CI was calculated for each adverse effect, either compared to no treatment or to another agent.
Sensitivity analysis
Sensitivity analyses explored the influence of the following factors on effect size:
Repeating the analysis excluding unpublished studies
Repeating the analysis taking account of risk of bias, as specified
Repeating the analysis excluding any very long or large studies to establish how much they dominate the results
Repeating the analysis excluding studies using the following filters: diagnostic criteria, language of publication, source of funding (industry versus other), and country.
'Summary of findings' tables
The main results of the review are presented in 'Summary of findings' tables. These tables present key information concerning the quality of the evidence, the magnitude of the effects of the interventions examined, and the sum of the available data for the main outcomes (Schünemann 2011a). The 'Summary of findings' tables also include an overall grading of the evidence related to each of the main outcomes using the GRADE (Grades of Recommendation, Assessment, Development and Evaluation) approach (GRADE 2008). The GRADE approach defines the quality of a body of evidence as the extent to which one can be confident that an estimate of effect or association is close to the true quantity of specific interest. The quality of a body of evidence involves consideration of within‐trial risk of bias (methodological quality), directness of evidence, heterogeneity, precision of effect estimates and risk of publication bias (Schünemann 2011b). The following outcomes are presented in the 'Summary of findings' tables.
HbA1c
Fasting glucose
eGFR
Weight
Death (all causes)
All cardiovascular death
Hypoglycaemia
Discontinuation of medications due to adverse events.
Results
Description of studies
See Characteristics of included studies, Characteristics of excluded studies, Characteristics of studies awaiting classification and Characteristics of ongoing studies.
Results of the search
The search identified 185 studies (529 records). Following assessment of titles, abstracts and full‐text articles, we included 44 studies (128 records) and excluded 124 studies (353 records). Fourteen studies are awaiting assessment (mostly awaiting data from the authors), and three studies are ongoing (see Figure 1); these will be included in a future update of this review.
1.
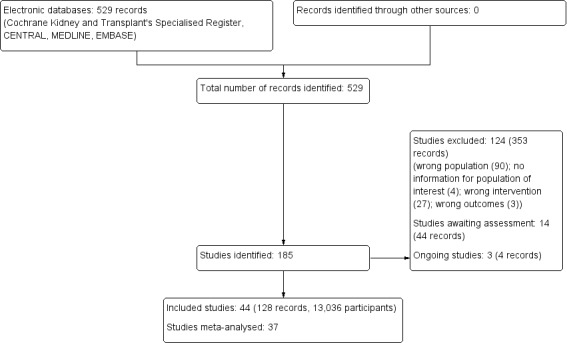
Study flow diagram.
Included studies
We included 44 studies (13,036 participants) for qualitative synthesis, however after contact with authors, only 37 studies had adequate data to be quantitatively synthesised for meta‐analyses.
Nine studies compared SGLT2 inhibitors to placebo in people with an eGFR 15 to < 60 mL/min/1.73 m2. Two studies compared dapagliflozin to placebo (Kaku 2014; Kohan 2014); three studies compared empagliflozin to placebo (EMPA‐REG BP 2015; EMPA‐REG OUTCOME 2013; EMPA‐REG RENAL 2014), one study compared luseogliflozin to placebo (Haneda 2016), one study compared canagliflozin to placebo (Yale 2013), and one study compared ipragliflozin to placebo (LANTERN 2015). Additionally, one study compared a dual SGLT1 and 2 inhibitor, LX4211 or sotagliflozin to placebo (Zambrowicz 2015). All studies could be included in the meta‐analysis.
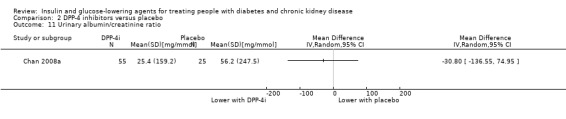
Thirteen studies compared DPP‐4 inhibitors to placebo in people with an eGFR < 60 mL/min/1.73 m2 including those receiving dialysis. Three studies compared saxagliptin to placebo (Abe 2016; Nowicki 2011; SAVOR‐TIMI 53 2011), five studies compared linagliptin to placebo (Barnett 2013; Laakso 2015; Lewin 2012; McGill 2013; Yki‐Järvinen 2013), two studies compared sitagliptin to placebo (Chan 2008a; TECOS 2013), two studies compared vildagliptin to placebo ( Ito 2011a; Lukashevich 2011), and one study compared gemigliptin to placebo (GUARD 2017). All studies could be included in the meta‐analysis.
Two studies compared GLP‐1 agonists (liraglutide) to placebo (Idorn 2013; LIRA‐RENAL 2016) in people with an eGFR < 60 mL/min/1.73 m2 including those receiving dialysis. All studies were included in the meta‐analysis.
Seven parallel studies and 1 cross‐over study compared glitazones to placebo. The majority of participants were receiving HD but one study had people with an eGFR 15 to 59 mL/min/1.73 m2 (Jin 2007). Six studies compared pioglitazone to placebo (Abe 2007; Abe 2008a; Abe 2010a; Jin 2007; Nakamura 2001; Pfutzner 2011), one study compared rosiglitazone to placebo (Wong 2005), and one cross‐over study compared troglitazone to placebo (Nakamura 2001). Mohideen 2005 and Nakamura 2001 could not be included in the meta‐analysis. It should be noted that troglitazone was withdrawn from the market by the US Food and Drug Administration (FDA) in 2000 due to the risk of liver failure and hepatotoxicity (FDA 2000).
One study compared glinides (mitiglinide) to control (not receiving mitiglinide) in people receiving HD (Abe 2010).
Seven studies compared one glucose‐lowering agent to another. Two studies compared sitagliptin to glipizide in people with an eGFR < 50 mL/min/1.73 m2 including those receiving dialysis (Arjona Ferreira 2013; Arjona Ferreira 2013a), one study compared vildagliptin to sitagliptin in those with an eGFR < 30 mL/min/1.73 m2 including those receiving HD (Kothny 2015), one study compared albiglutide to sitagliptin in those with an eGFR 15 to <60 mL/min/1.73 m2 (Leiter 2014), one study compared sitagliptin to insulin in people with an eGFR < 45 mL/min/1.73 m2 including those on HD (Bellante 2016), and one study compared linagliptin to voglibose in those receiving HD (Mori 2016). Additionally, one study compared glitazars (aleglitazar) to pioglitazone (AleNephro 2014) in people with an eGFR 30 to < 60 mL/min/1.73 m2. Only Arjona Ferreira 2013 and Arjona Ferreira 2013a could be included in the meta‐analyses. One should note that the development of aleglitazar was halted by Roche in 2013 due to concerns about its safety and efficacy (ALECARDIO 2013).
Four studies compared different type, dosages, or modes of administration of insulin. One study compared 0.25 U/kg to 0.5 U/kg of insulin glulisine and glargine in those with an eGFR ≤ 45 mL/min/1.73 m2 (Baldwin 2012), and one cross‐over study compared insulin lispro to regular insulin in those with a GFR 50 to 60 mL/min (Ruggenenti 2003a). One parallel study (Diez 1987) and one cross‐over study (Scarpioni 1994) compared intraperitoneal (IP) to subcutaneous (SC) insulin in those receiving PD. None of the studies could be included in the meta‐analysis due to heterogeneity in the intervention or presentation of the results.
Excluded studies
We excluded 124 studies due to the following reasons:
Wrong study population: 90 studies
Inadequate information (data for people with an eGFR < 60 was not available from authors): 4 studies
Wrong intervention: 27 studies
No relevant outcomes: 3 studies
Risk of bias in included studies
Summaries of risk of bias are reported in Figure 2 and Figure 3.
2.
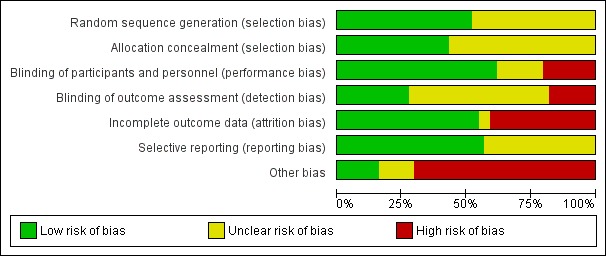
Risk of bias graph: review authors' judgements about each risk of bias item presented as percentages across all included studies.
3.
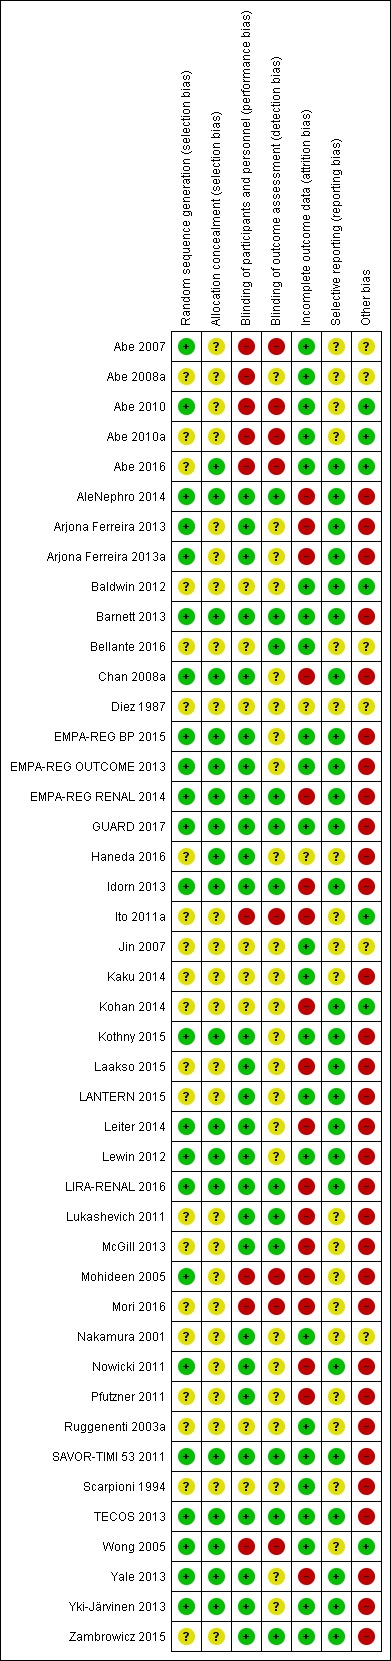
Risk of bias summary: review authors' judgements about each risk of bias item for each included study.
Allocation
Random sequence generation
Random sequence generation was judged to be at low risk of bias in 23 studies (Abe 2007; Abe 2010; AleNephro 2014; Arjona Ferreira 2013; Arjona Ferreira 2013a; Barnett 2013; Chan 2008a; EMPA‐REG BP 2015; EMPA‐REG OUTCOME 2013; EMPA‐REG RENAL 2014; GUARD 2017; Idorn 2013; Kothny 2015; Leiter 2014; Lewin 2012; LIRA‐RENAL 2016; Mohideen 2005; Nowicki 2011; SAVOR‐TIMI 53 2011; TECOS 2013; Wong 2005; Yale 2013; Yki‐Järvinen 2013) and unclear in 21 studies (Abe 2008a; Abe 2010a; Abe 2016; Baldwin 2012; Bellante 2016; Diez 1987; Haneda 2016; Ito 2011a; Jin 2007; Kaku 2014; Kohan 2014; Laakso 2015; LANTERN 2015; Lukashevich 2011; McGill 2013; Mori 2016; Nakamura 2001; Pfutzner 2011; Ruggenenti 2003a; Scarpioni 1994; Zambrowicz 2015).
Allocation concealment
Allocation concealment was judged to be at low risk of bias in 19 studies (Abe 2016; AleNephro 2014; Barnett 2013; Chan 2008a; EMPA‐REG BP 2015; EMPA‐REG OUTCOME 2013; EMPA‐REG RENAL 2014; GUARD 2017; Haneda 2016; Idorn 2013; Kothny 2015; Leiter 2014; Lewin 2012; LIRA‐RENAL 2016; SAVOR‐TIMI 53 2011; TECOS 2013; Wong 2005; Yale 2013; Yki‐Järvinen 2013) and unclear in 25 studies (Abe 2007; Abe 2008a; Abe 2010; AleNephro 2014; Arjona Ferreira 2013; Arjona Ferreira 2013a; Baldwin 2012; Bellante 2016; Diez 1987; Ito 2011a; Jin 2007; Kaku 2014; Kohan 2014; Laakso 2015; LANTERN 2015; Lukashevich 2011; McGill 2013; Mohideen 2005; Mori 2016; Nakamura 2001; Nowicki 2011; Pfutzner 2011; Ruggenenti 2003a; Scarpioni 1994; Zambrowicz 2015).
Blinding
Performance bias
Performance bias (blinding of participants and investigators) was judged to be at low risk of bias in 27 studies (AleNephro 2014; Arjona Ferreira 2013; Arjona Ferreira 2013a; Barnett 2013; Chan 2008a; EMPA‐REG BP 2015; EMPA‐REG OUTCOME 2013; EMPA‐REG RENAL 2014; GUARD 2017; Haneda 2016; Idorn 2013; Kothny 2015; Laakso 2015; LANTERN 2015; Leiter 2014; Lewin 2012; LIRA‐RENAL 2016; Lukashevich 2011; McGill 2013; Nakamura 2001; Nowicki 2011; Pfutzner 2011; SAVOR‐TIMI 53 2011; TECOS 2013; Yale 2013; Yki‐Järvinen 2013; Zambrowicz 2015) and at high risk of bias in 9 studies (Abe 2007; Abe 2008a; Abe 2010; Abe 2010a; Abe 2016; Ito 2011a; Mohideen 2005; Mori 2016; Wong 2005). The risk of bias was unclear in eight studies (Baldwin 2012; Bellante 2016; Diez 1987; Jin 2007; Kaku 2014; Kohan 2014; Ruggenenti 2003a; Scarpioni 1994).
Detection bias
Detection bias (blinding of outcome assessors) was judged to be at low risk of bias in 12 studies (AleNephro 2014; Barnett 2013; Bellante 2016; EMPA‐REG RENAL 2014; GUARD 2017; Idorn 2013; Lukashevich 2011; LIRA‐RENAL 2016; McGill 2013; SAVOR‐TIMI 53 2011; TECOS 2013; Zambrowicz 2015) and at high risk of bias in eight studies (Abe 2007; Abe 2010; Abe 2010a; Abe 2016; Ito 2011a; Mohideen 2005; Mori 2016; Wong 2005). The risk of bias was unclear in 24 studies (Abe 2008a; Arjona Ferreira 2013; Arjona Ferreira 2013a; Baldwin 2012; Chan 2008a; Diez 1987; EMPA‐REG BP 2015; EMPA‐REG OUTCOME 2013; Haneda 2016; Jin 2007; Kaku 2014; Kohan 2014; Kothny 2015; Laakso 2015; LANTERN 2015; Leiter 2014; Lewin 2012; Nakamura 2001; Nowicki 2011; Pfutzner 2011; Ruggenenti 2003a; Scarpioni 1994; Yale 2013; Yki‐Järvinen 2013).
Incomplete outcome data
Attrition bias was judged to be at low risk of bias in 24 studies (Abe 2007; Abe 2008a; Abe 2010; Abe 2010a; Abe 2016; Baldwin 2012; Barnett 2013; Bellante 2016; EMPA‐REG BP 2015; EMPA‐REG OUTCOME 2013; GUARD 2017; Jin 2007; Kaku 2014; Kothny 2015; LANTERN 2015; Lewin 2012; Nakamura 2001; Ruggenenti 2003a; SAVOR‐TIMI 53 2011; Scarpioni 1994; TECOS 2013; Wong 2005; Yki‐Järvinen 2013; Zambrowicz 2015) and at high risk of bias in 18 studies (AleNephro 2014; Arjona Ferreira 2013; Arjona Ferreira 2013a; Chan 2008a; EMPA‐REG RENAL 2014; Idorn 2013; Ito 2011a; Kohan 2014; Laakso 2015; Leiter 2014; LIRA‐RENAL 2016; Lukashevich 2011; McGill 2013; Mohideen 2005; Mori 2016; Nowicki 2011; Pfutzner 2011; Yale 2013). The risk of bias was unclear in two studies (Diez 1987; Haneda 2016).
Selective reporting
Reporting bias was judged to be at low risk of bias in 25 studies (Abe 2016; AleNephro 2014; Arjona Ferreira 2013; Baldwin 2012; Barnett 2013; Chan 2008a; EMPA‐REG BP 2015; EMPA‐REG OUTCOME 2013; EMPA‐REG RENAL 2014; GUARD 2017; Idorn 2013; Kaku 2014; Kohan 2014; Kothny 2015; Laakso 2015; LANTERN 2015; Leiter 2014; Lewin 2012; LIRA‐RENAL 2016; Nowicki 2011; SAVOR‐TIMI 53 2011; TECOS 2013; Yale 2013; Yki‐Järvinen 2013; Zambrowicz 2015) and was unclear in 19 studies (Abe 2007; Abe 2008a; Abe 2010; Abe 2010a; Arjona Ferreira 2013a; Bellante 2016; Diez 1987; Haneda 2016; Ito 2011a; Jin 2007; Lukashevich 2011; McGill 2013; Mohideen 2005; Mori 2016; Nakamura 2001; Pfutzner 2011; Ruggenenti 2003a; Scarpioni 1994; Wong 2005).
Other potential sources of bias
Thirty‐one studies had a high risk of funding bias (AleNephro 2014; Arjona Ferreira 2013; Arjona Ferreira 2013a; Barnett 2013; Chan 2008a; EMPA‐REG BP 2015; EMPA‐REG OUTCOME 2013; EMPA‐REG RENAL 2014; GUARD 2017; Haneda 2016; Idorn 2013; Kaku 2014; Kothny 2015; Laakso 2015; LANTERN 2015; Leiter 2014; Lewin 2012; LIRA‐RENAL 2016; Lukashevich 2011; McGill 2013; Mohideen 2005; Mori 2016; Nowicki 2011; Pfutzner 2011; Ruggenenti 2003a; SAVOR‐TIMI 53 2011; Scarpioni 1994; TECOS 2013; Yale 2013; Yki‐Järvinen 2013; Zambrowicz 2015) due to the studies being supported by pharmaceutical companies and the majority of the authors receiving funding or being employees of these companies. Six studies did not report their funding source and conflicts of interest (Abe 2007; Abe 2008a; Bellante 2016; Diez 1987; Jin 2007; Nakamura 2001) and seven studies had a low risk of funding bias (Abe 2010; Abe 2010a; Abe 2016; Baldwin 2012; Ito 2011a; Kohan 2014; Wong 2005).
Effects of interventions
See: Table 1; Table 2; Table 3; Table 4; Table 5
Summary of findings for the main comparison. SGLT2 inhibitors versus placebo for treating people with diabetes and chronic kidney disease (CKD).
| SGLT2 inhibitors versus placebo for treating people with diabetes and CKD | |||||
| Patient or population: people with diabetes and CKD Intervention: SGLT2 inhibitors Comparison: placebo | |||||
| Outcomes | Anticipated absolute effects* (95% CI) | Effect estimate (95% CI) | No. of participants (studies) | Quality of the evidence (GRADE) | |
| Risk with placebo | Risk with SGLT2 inhibitors | ||||
| HbA1c (%) HbA1c (mmol/mol) |
The mean HbA1c was 0.29% lower (0.19 to 0.38 lower) with SGLT2 inhibitors compared to placebo The mean HbA1c was 3.2 mmol/mol lower (2.2 to 4.2 lower) with SGLT2 inhibitors compared to placebo |
MD ‐0.29 (‐0.38 to ‐0.19) MD ‐3.2 (‐4.2 to ‐2.2) |
1092 (7) | ⊕⊕⊕⊝ MODERATE 1 | |
| FBG (mmol/L) | The mean FBG was 0.48 mmol/L lower (0.19 to 0.78 lower) with SGLT2 inhibitors compared to placebo | MD ‐0.48 (‐0.78 to ‐0.19) |
855 (5) | ⊕⊕⊕⊝ MODERATE 1 | |
| Death (all causes) | 78 per 1,000 | 61 per 1,000 (47 to 79) | RR 0.78 (0.60 to 1.02) | 2933 (5) | ⊕⊝⊝⊝ VERY LOW 1 2 |
| All cardiovascular death | 52 per 1,000 | 40 per 1,000 (29 to 57) | RR 0.78 (0.56 to 1.10) | 2788 (4) | ⊕⊕⊝⊝ LOW 1 2 |
| Weight (kg) | Weight was 1.41 kg lower (1.02 to 1.8 lower) with SGLT2 inhibitor compared to placebo | MD ‐1.41 (‐1.8 to ‐1.02) |
1029 (5) | ⊕⊕⊝⊝ LOW 1 | |
| eGFR (mL/min/1.73 m2) | The mean eGFR was 1.85 mL/min/1.73 m2 lower (0.94 to 2.76 lower) with SGLT2 inhibitors compared to placebo | MD ‐1.85 (‐2.76 to ‐0.94) |
848 (4) | ⊕⊕⊕⊝ MODERATE 1 | |
| Hypoglycaemia | 118 per 1,000 | 104 per 1,000 (86 to 126) | RR 0.88 (0.73 to 1.07) | 3086 (7) | ⊕⊕⊝⊝ LOW 1 2 |
| Discontinuation of medication due to adverse events | 105 per 1,000 | 90 per 1,000 (59 to 138) | RR 0.86 (0.56 to 1.32) | 917 (4) | ⊕⊝⊝⊝ VERY LOW 1 3 4 |
| *The risk in the intervention group (and its 95% confidence interval) is based on the assumed risk in the comparison group and the relative effect of the intervention (and its 95% CI). CI: Confidence interval; RR: Risk ratio; MD: mean difference | |||||
| GRADE Working Group grades of evidence High quality: We are very confident that the true effect lies close to that of the estimate of the effect Moderate quality: We are moderately confident in the effect estimate: The true effect is likely to be close to the estimate of the effect, but there is a possibility that it is substantially different Low quality: Our confidence in the effect estimate is limited: The true effect may be substantially different from the estimate of the effect Very low quality: We have very little confidence in the effect estimate: The true effect is likely to be substantially different from the estimate of effect | |||||
1 All studies had funding bias and/or attrition bias
2 Effect is beneficial or harmful but confidence interval is wide and crosses 1
3 Moderate heterogeneity in effect
4 Wide CI and the effect shows appreciable benefit and harm
Summary of findings 2. DPP‐4 inhibitors versus placebo for treating people with diabetes and chronic kidney disease (CKD).
| DPP‐4 inhibitors versus placebo for treating people with diabetes and CKD | |||||
| Patient or population: people with diabetes and CKD Intervention: DPP‐4 inhibitors Comparison: placebo | |||||
| Outcomes | Anticipated absolute effects* (95% CI) | Effect estimate (95% CI) | No. of participants (studies) | Quality of the evidence (GRADE) | |
| Risk with placebo | Risk with DPP‐4 inhibitors | ||||
| HbA1c (%) HbA1c (mmol/mol) |
The mean HbA1c was 0.62% lower (0.39 to 0.62 lower) with DPP‐4 inhibitors compared to placebo The mean HbA1c was 6.8 mmol/mol lower (4.3 to 9.3 lower) with DPP‐4 inhibitors compared to placebo |
MD ‐0.62 (‐0.85 to ‐0.39) MD ‐6.8 (‐9.3 to ‐4.3) |
867 (7) | ⊕⊕⊝⊝ LOW 1 2 | |
| FBG (mmol/L) | The mean FBG was 0.47 mmol/L lower (1.08 lower to 0.15 higher) with DPP‐4 inhibitors compared to placebo | MD ‐0.47 (‐1.08 to 0.15) |
589 (4) | ⊕⊕⊝⊝ LOW 3 4 | |
| Death (all causes) | 108 per 1,000 | 96 per 1,000 (81 to 115) | RR 0.89 (0.75 to 1.07) | 4211 (6) | ⊕⊕⊝⊝ LOW 1 3 |
| All cardiovascular death | 77 per 1,000 | 71 per 1,000 (59 to 85) | RR 0.93 (0.77 to 1.11) |
5897 (2) | ⊕⊕⊕⊝ MODERATE 5 |
| Weight (kg) | The mean weight was 0.16 kg higher (0.58 lower to 0.9 higher) with DPP‐4 inhibitors compared to placebo | MD 0.16 (‐0.58 to 0.9) |
210 (2) | ⊕⊕⊕⊝ MODERATE 5 | |
| eGFR (mL/min/1.73 m2) | The mean eGFR was 1.99 mL/min/1.73 m2 lower (0.49 to 3.49 lower) with DPP‐4 inhibitors compared to placebo | MD ‐1.99 (‐3.49 to ‐0.49) |
130 (1) | ⊕⊝⊝⊝ VERY LOW 5 6 | |
| Hypoglycaemia | 229 per 1,000 | 245 per 1,000 (183 to 325) | RR 1.07 (0.80 to 1.42) | 1443 (11) | ⊕⊝⊝⊝ VERY LOW 2 3 7 |
| Discontinuation of medication due to adverse events | 65 per 1,000 | 61 per 1,000 (40 to 94) | RR 0.94 (0.61 to 1.45) | 1257 (7) | ⊕⊝⊝⊝ VERY LOW 1 8 |
| *The risk in the intervention group (and its 95% confidence interval) is based on the assumed risk in the comparison group and the relative effect of the intervention (and its 95% CI). CI: Confidence interval; RR: Risk ratio; MD: mean difference; HbA1c: haemoglobin A1c (glycated); FBG: fasting blood glucose; eGFR: estimated glomerular filtration rate | |||||
| GRADE Working Group grades of evidence High quality: We are very confident that the true effect lies close to that of the estimate of the effect Moderate quality: We are moderately confident in the effect estimate: The true effect is likely to be close to the estimate of the effect, but there is a possibility that it is substantially different Low quality: Our confidence in the effect estimate is limited: The true effect may be substantially different from the estimate of the effect Very low quality: We have very little confidence in the effect estimate: The true effect is likely to be substantially different from the estimate of effect | |||||
1 All studies had funding bias, and the majority had attrition bias
2 Moderate heterogeneity in results
3 Effect had appreciable benefit or harm but the confidence interval crossed 1
4 All studies had risk of funding bias and attrition bias
5 All studies had a risk of funding bias
6 Only 1 study reported this outcome
7 Majority of studies had funding bias and/or attrition bias
8 Wide confidence interval with appreciable benefit and harm
Summary of findings 3. GLP‐1 agonists versus placebo for treating people with diabetes and chronic kidney disease (CKD).
| GLP‐1 agonists versus to placebo for treating people with diabetes and CKD | ||||||
| Patient or population: people with diabetes and CKD Intervention: GLP‐1 agonists Comparison: placebo | ||||||
| Outcomes | Anticipated absolute effects* (95% CI) | Effect estimate (95% CI) | No. of participants (studies) | Quality of the evidence (GRADE) | Comments | |
| Risk with placebo | Risk with GLP‐1 agonists | |||||
| HbA1c (%) HbA1c (mmol/mol) |
The mean HbA1c was 0.53% lower (0.06 to 1.01 lower) with GLP‐1 agonists compared to placebo The mean HbA1c was 5.8 mmol/mol lower (0.7 to 11.0 lower) with GLP‐1 agonists compared to placebo |
MD ‐0.53 (‐1.01 to ‐0.06) MD ‐5.8 (‐11.0 to ‐0.7) |
283 (2) | ⊕⊕⊕⊝ MODERATE 1 | ‐ | |
| FBG (mmol/L) | The mean FBG was 1.08 mmol/L lower (0.45 to 1.71 lower) with GLP‐1 agonists compared to placebo | MD ‐1.08 (‐1.71 to ‐0.45) | 231 (1) | ⊕⊝⊝⊝ VERY LOW 1 2 | ‐ | |
| Death (all causes) | 7 per 1,000 | 27 per 1,000 (3 to 235) | RR 3.91 (0.44 to 34.58) | 301 (2) | ⊕⊝⊝⊝ VERY LOW 1 2 | ‐ |
| All cardiovascular death | ‐ | ‐ | ‐ | ‐ | ‐ | Not reported. |
| Weight (kg) | ‐ | ‐ | 303 (2) | ⊕⊕⊝⊝ LOW 1 3 |
On qualitative synthesis of results from two studies (total of 303 participants), liraglutide reduced body weight to a greater extent compared to the control group in people with an eGFR < 60 mL/min/1.73 m2, including patients receiving HD. In one study in patients with ESKD receiving HD (24 participants), liraglutide resulted in a 2.20 kg loss of weight (‐3.87 to 0.53; P = 0.01) compared to placebo. However, weight (mean ± SE) was reduced insignificantly compared to before the treatment (91.1 ± 4.9 to 88.7 ± 5.2 kg, P= 0.22). In another study, in patients with an eGFR 30 to < 60 mL/min/1.73 m2 both liraglutide and placebo exhibited gradual weight reduction (279 participants). The patients in the liraglutide group had a greater reduction in body weight compared to placebo (‐2.41 and ‐1.09 kg respectively) with an estimated treatment different of ‐1.32 kg (95% CI ‐2.24 to ‐0.4; P = 0.0052). |
|
| eGFR (mL/min/1.73 m2) | ‐ | ‐ | 279 (1) | ⊕⊕⊝⊝ LOW 1 4 | Only one study reported eGFR. In this study, the mean observed changes in eGFR (MDRD) from baseline to week 26 was ‐0.35 mL/min/1.73 m2 in the GLP‐1 group and +0.37 mL/min/1.73 m2 in the placebo group; the estimated treatment effect was not significant (P = 0.36). The other study occurred in HD. | |
| Hypoglycaemia | ‐ | ‐ | 303 (2) | ⊕⊕⊝⊝ LOW 1 3 | In one study in patients with an eGFR of 30 to < 60 mL/min/1.73 m2 (279 participants) liraglutide resulted in an equivalent risk of hypoglycaemia to placebo (0.79; 0.51 to 1.21; P = 0.28). In the other study (24 participants) with ESKD on HD, the number of episodes of hypoglycaemia did not differ between those receiving liraglutide and those receiving placebo. | |
| Discontinuation of medication due to adverse events | ‐ | ‐ | 303 (2) | ⊕⊕⊝⊝ LOW 1 2 | In one study in patients with ESKD comparing liraglutide to placebo, there were no discontinuations due to adverse events in the liraglutide or placebo group (24 participants). In another study, in patients with an eGFR 30 to < 60 mL/min/1.73 m2, (279 participants) liraglutide resulted in a 4.65 times higher risk of discontinuation due to adverse events compared to placebo (4.65; 1.62 to 13.31; P = 0.004) | |
| *The risk in the intervention group (and its 95% confidence interval) is based on the assumed risk in the comparison group and the relative effect of the intervention (and its 95% CI). CI: Confidence interval; RR: Risk ratio; MD: mean difference; ; HbA1c: haemoglobin A1c (glycated); FBG: fasting blood glucose; eGFR: estimated glomerular filtration rate; ESKD: end‐stage kidney disease; HD: haemodialysis | ||||||
| GRADE Working Group grades of evidence High quality: We are very confident that the true effect lies close to that of the estimate of the effect Moderate quality: We are moderately confident in the effect estimate: The true effect is likely to be close to the estimate of the effect, but there is a possibility that it is substantially different Low quality: Our confidence in the effect estimate is limited: The true effect may be substantially different from the estimate of the effect Very low quality: We have very little confidence in the effect estimate: The true effect is likely to be substantially different from the estimate of effect | ||||||
1 All had risk of attrition bias and funding bias
2 Effect had appreciable benefit or harm but the confidence interval crossed 1
3 Narrative/qualitative synthesis was conducted. Estimates were not precise
4Downgraded one point because only one study reported eGFR, and therefore there is a likelihood of publication bias
Summary of findings 4. Glitazone versus placebo for treating people with diabetes and chronic kidney disease (CKD).
| Glitazone versus placebo for treating people with diabetes and CKD | ||||||
| Patient or population: people with diabetes and CKD Intervention: glitazone Comparison: placebo | ||||||
| Outcomes | Anticipated absolute effects* (95% CI) | Effect estimate (95% CI) | No. of participants (studies) | Quality of the evidence (GRADE) | Comments | |
| Risk with placebo | Risk with glitazone | |||||
| HbA1c (%) HbA1c (mmol/mol) |
The mean HbA1c was 0.41% lower (1.15 lower to 0.32 higher) with glitazone agonists compared to placebo The mean HbA1c was 4.5 mmol/mol lower (12.6 lower to 3.5 higher) with glitazone agonists compared to placebo |
MD ‐0.41 (‐1.15 to 0.32) MD ‐4.5 (‐12.6 to 3.5) |
88 (2) | ⊕⊝⊝⊝ VERY LOW 1 2 3 | ‐ | |
| FBG (mmol/L) | ‐ | ‐ | ‐ | 233 (5) | ⊕⊝⊝⊝ VERY LOW5 6 | Qualitative synthesis of studies showed that glitazones, particularly pioglitazone lowered FBG compared to placebo in patients with an eGFR < 60 mL/min/1.73 m2, including patients on HD. Two studies (total of 71 participants) in people with HD reported that pioglitazone lowered FBG at the end of the study compared to the start, and also lower than in placebo group (both P < 0.05). Similarly another study (39 participants) in HD patients reported that pioglitazone reduced the FBG by 2.91 mmol/L (‐5.44 to ‐0.38 mmol/L); P = 0.02 compared to placebo. Conversely another study in HD patients (63 participants) reported that pioglitazone resulted in a lower FBG (mean ± SD) at the end of the study compared to the start (7.72 ± 2.50 versus 6.89 ± 2.67 mmol/L P < 0.05), but this was not statistically lower than placebo (6.89 ± 2.67 versus 7.33 ± 2.56 mmol/L, P > 0.05). One study of people with earlier stages of CKD (60 participants) showed that in people with stage 3 CKD who were treated with pioglitazone‐losartan, there were higher rates of decline in blood glucose values compared with people treated with losartan only. This difference was significant after 12 months ( change (mean ± SD) after 12 months –22.7 ± 6.9% for pioglitazone‐losartan therapy as compared with –15.1 ± 6.3% for losartan alone; P < 0.01). Larger reductions in FBG concentrations were observed for people in this study with stage 4 CKD after 12 months of the combined as compared with the single‐drug treatment (i.e. –22.9 ± 8.9% versus –17.6 ± 5.9%; P = 0.07), but the difference was not significant. |
| Death (all causes) | 77 per 1,000 | 38 per 1,000 (4 to 398) | RR 0.50 (0.05 to 5.18) | 52 (1 RCT) | ⊕⊝⊝⊝ VERY LOW 1 4 | ‐ |
| All cardiovascular death | ‐ | ‐ | ‐ | ‐ | ‐ | Not reported. |
| Weight (kg) | ‐ | ‐ | ‐ | 222 (5) | ⊕⊝⊝⊝ VERY LOW5 6 | From qualitative synthesis of data from 3 studies (total of 110 participants), pioglitazone did not result in a significant increase of dry weight compared to placebo in patients receiving HD (Abe 2007; Abe 2008a; Pfutzner 2011) or a significant increase of body weight compared to placebo in patients with an eGFR 15 to < 60 mL/min/1.73 m2 (Jin 2007: 60 participants). Conversely, in patients receiving PD (Wong 2005: 52 participants), rosiglitazone resulted in more weight gain (mean ± SD) compared to placebo (2.0% ± 5.6% versus control, ‐0.8% ± 4.4%; P = 0.049). |
| eGFR (mL/min/1.73 m2) | ‐ | ‐ | ‐ | ‐ | ‐ | Not reported. |
| Hypoglycaemia | 59 per 1,000 | 56 per 1,000 (9 to 358) | RR 0.95 (0.15 to 6.08) | 70 (2 RCTs) | ⊕⊝⊝⊝ VERY LOW 1 4 | ‐ |
| Discontinuation of medication due to adverse events | 0 per 1,000 | 0 per 1,000 (0 to 0) | not estimable | 63 (1 RCT) | ⊕⊝⊝⊝ VERY LOW 4 5 | ‐ |
| *The risk in the intervention group (and its 95% confidence interval) is based on the assumed risk in the comparison group and the relative effect of the intervention (and its 95% CI). CI: Confidence interval; RR: Risk ratio; MD: mean difference; HbA1c: haemoglobin A1c (glycated); FBG: fasting blood glucose; eGFR: estimated glomerular filtration rate; HD: haemodialysis; CKD: chronic kidney disease | ||||||
| GRADE Working Group grades of evidence High quality: We are very confident that the true effect lies close to that of the estimate of the effect Moderate quality: We are moderately confident in the effect estimate: The true effect is likely to be close to the estimate of the effect, but there is a possibility that it is substantially different Low quality: Our confidence in the effect estimate is limited: The true effect may be substantially different from the estimate of the effect Very low quality: We have very little confidence in the effect estimate: The true effect is likely to be substantially different from the estimate of effect | ||||||
1 Risk of attrition and funding bias
2 Substantial heterogeneity
3 CI is wide and effect shows appreciable benefit and harm
4 Only 1 study had data for this outcome
5 Risk of selection, performance and detection bias
6 Narrative/qualitative synthesis was conducted. Estimates were not precise
Summary of findings 5. Sitagliptin versus glipizide for treating people with diabetes and chronic kidney disease (CKD).
| Sitagliptin versus glipizide for treating people with diabetes and CKD | ||||||
| Patient or population: people with diabetes and CKD Intervention: sitagliptin Comparison: glipizide | ||||||
| Outcomes | Anticipated absolute effects* (95% CI) | Effect estimate (95% CI) | No. of participants (studies) | Quality of the evidence (GRADE) | Comments | |
| Risk with glipizide | Risk with sitagliptin | |||||
| HbA1c (%) HbA1c (mmol/mol) |
The mean HbA1c was 0.05% lower (0.39 lower to 0.29 higher) with glipizide compared to sitagliptin The mean HbA1c was 0.6 mmol/mol lower (4.3 lower to 3.2 higher) with glipizide compared to sitagliptin |
MD ‐0.05 (‐0.39 to 0.29) MD ‐0.6 (‐4.3 to 3.2) |
398 (2) | ⊕⊕⊝⊝ LOW 1 2 | ‐ | |
| FBG (mmol/L) | Mean FBG was 0.36 mmol/L higher (0.1 lower to 0.82 higher) with glipizide compared to sitagliptin | MD 0.36 (‐0.1 to 0.82) | 397 (2) | ⊕⊕⊝⊝ LOW 1 3 | ‐ | |
| Death (all causes) | 47 per 1,000 | 26 per 1,000 (10 to 64) | RR 0.55 (0.22 to 1.36) | 551 (2) | ⊕⊝⊝⊝ VERY LOW 1 4 | ‐ |
| All cardiovascular death | ‐ | ‐ | ‐ | ‐ | ‐ | Not reported. |
| Weight (kg) | ‐ | ‐ | ‐ | 552 (2) | ⊕⊕⊝⊝ LOW 1 5 | In one study in people with an eGFR < 50 mL/min/1.73 m2 but not on dialysis (423 participants) sitagliptin resulted in a reduction in body weight (‐0.6 kg) compared to glipizide where the body weight increased (1.2 kg), resulting in a statistically significant (P < 0.001) between‐group difference of ‐1.8 kg. Conversely in another study in people with ESKD on dialysis (129 participants), sitagliptin had a similar effect to glipizide on weight ‐1.00 kg (‐2.80 to 0.80) P = 0.28. |
| eGFR (mL/min/1.73 m2) | ‐ | ‐ | ‐ | 552 (2) | ⊕⊕⊝⊝ LOW 1 5 | One study (423 participants) occurred in patients with an eGFR < 50 mL/min/1.73 m2 and not on dialysis. There were similar reductions from baseline in eGFR observed in the sitagliptin and glipizide groups (sitagliptin, 23.9 mL/min/1.73 m2; glipizide, 23.3 mL/min/1.73 m2). Similarly in another study (129 participants) which occurred in patients receiving dialysis, there were no meaningful differences in changes from baseline in eGFR, SCr, UACR between sitagliptin and glipizide. |
| Hypoglycaemia | 155 per 1,000 | 62 per 1,000 (36 to 107) | RR 0.40 (0.23 to 0.69) | 551 (2) | ⊕⊕⊕⊝ MODERATE 1 | ‐ |
| Discontinuation of medication due to adverse events | 90 per 1,000 | 84 per 1,000 (49 to 144) | RR 0.93 (0.54 to 1.60) | 551 (2) | ⊕⊝⊝⊝ VERY LOW 1 4 | ‐ |
| *The risk in the intervention group (and its 95% confidence interval) is based on the assumed risk in the comparison group and the relative effect of the intervention (and its 95% CI). CI: Confidence interval; RR: Risk ratio; MD: mean difference; HbA1c: haemoglobin A1c (glycated); FBG: fasting blood glucose; eGFR: estimated glomerular filtration rate; ESKD: end‐stage kidney disease; SCr: serum creatinine; UACR: urinary albumin/creatinine ratio | ||||||
| GRADE Working Group grades of evidence High quality: We are very confident that the true effect lies close to that of the estimate of the effect Moderate quality: We are moderately confident in the effect estimate: The true effect is likely to be close to the estimate of the effect, but there is a possibility that it is substantially different Low quality: Our confidence in the effect estimate is limited: The true effect may be substantially different from the estimate of the effect Very low quality: We have very little confidence in the effect estimate: The true effect is likely to be substantially different from the estimate of effect | ||||||
1 Both studies had funding bias and attrition bias
2 Heterogeneity in results
3 Effect has either benefit or harm with a confidence interval that crosses 1
4 Effect has both appreciable benefit and harm with a wide confidence interval that crosses 1
5 Narrative/Qualitative synthesis was conducted. Estimates were not precise
Primary outcomes
Glycated haemoglobin A1c (HbA1c)
SGLT2 Inhibitors versus placebo
In people with an eGFR 30 to < 60 mL/min/1.73 m2, SGLT2 inhibitors probably reduce HbA1c (MD ‐0.29%, 95% CI ‐0.38 to ‐0.19 (‐3.2 mmol/mol, ‐4.2 to ‐2.2); I2 = 0%; Analysis 1.1) compared to placebo (7 studies, 1092 participants; moderate certainty evidence) (EMPA‐REG RENAL 2014; Haneda 2016; Kaku 2014; Kohan 2014; LANTERN 2015; Yale 2013).
1.1. Analysis.
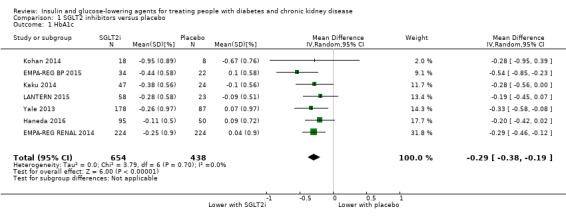
Comparison 1 SGLT2 inhibitors versus placebo, Outcome 1 HbA1c.
DPP‐4 inhibitors versus placebo
In people with an eGFR < 60 mL/min/1.73 m2 including those people with ESKD receiving dialysis, DPP‐4 inhibitors may reduce HbA1c (MD ‐0.62%, 95% CI ‐0.85 to ‐0.39 (‐6.8 mmol/mol, ‐9.3 to ‐4.3); I2 = 59%; Analysis 2.1) compared to placebo (7 studies, 867 participants; low certainty evidence) (Barnett 2013; Chan 2008a; GUARD 2017; Laakso 2015; McGill 2013; Nowicki 2011; Yki‐Järvinen 2013).
2.1. Analysis.
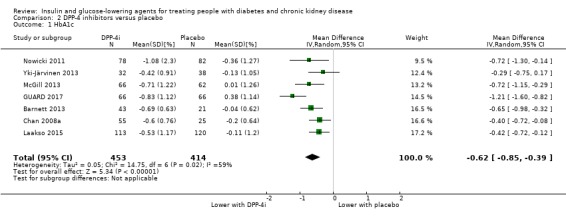
Comparison 2 DPP‐4 inhibitors versus placebo, Outcome 1 HbA1c.
GLP‐1 agonists versus placebo
In people with an eGFR < 60 mL/min/1.73 m2 including those people receiving HD, GLP‐1 agonists probably reduce HbA1c (MD ‐0.53%, 95% CI ‐1.01 to ‐0.06 (‐5.8 mmol/mol, ‐11.0 to ‐0.7); I2 = 41%; Analysis 3.1), compared to placebo (2 studies, 283 participants; moderate certainty evidence) (Idorn 2013; LIRA‐RENAL 2016).
3.1. Analysis.
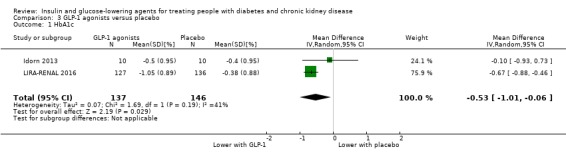
Comparison 3 GLP‐1 agonists versus placebo, Outcome 1 HbA1c.
Glitazones versus placebo/control
In people receiving HD and PD it is uncertain whether glitazones have any effect on HbA1c (MD ‐0.41%, 95% CI ‐1.15 to 0.32 (‐4.5 mmol/mol, ‐12.6 to 3.5); I2 = 66%; Analysis 4.1) compared to placebo (2 studies, 88 participants; very low certainty evidence) (Pfutzner 2011; Wong 2005).
4.1. Analysis.
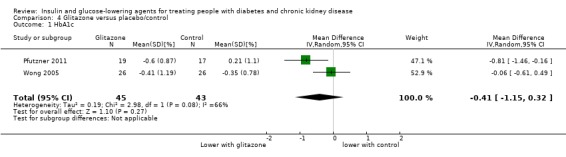
Comparison 4 Glitazone versus placebo/control, Outcome 1 HbA1c.
Glinides versus placebo/control
Abe 2010 compared glinide to no glinide treatment (36 participants) in people receiving dialysis. Mitiglinide was reported to reduce HbA1c compared to placebo over 24 weeks.
Sitagliptin versus glipizide
In people with an eGFR < 50 mL/min/1.73 m2, including those on dialysis, sitagliptin may make little or no difference to HbA1c (MD ‐0.05%, 95% CI ‐0.39 to 0.29 (‐0.6 mmol/mol, ‐4.3 to 3.2); I2 = 67%; Analysis 6.1) compared to glipizide (2 studies, 398 participants; low certainty evidence) (Arjona Ferreira 2013; Arjona Ferreira 2013a).
6.1. Analysis.
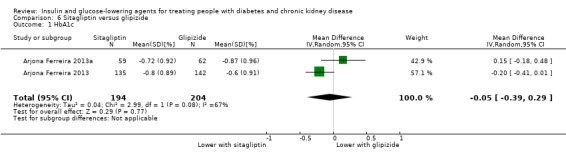
Comparison 6 Sitagliptin versus glipizide, Outcome 1 HbA1c.
Vildagliptin versus sitagliptin
Kothny 2015 compared vildagliptin to sitagliptin (148 participants) in people with an eGFR < 30 mL/min/1.73 m2 including those receiving HD. In this study vildagliptin had little or no effect on HbA1c compared to sitagliptin (MD 0.02%, 95% CI ‐0.33 to 0.37 (0.2 mmol/mol, ‐3.6 to 4.0); P = 0.91; Analysis 7.1).
7.1. Analysis.
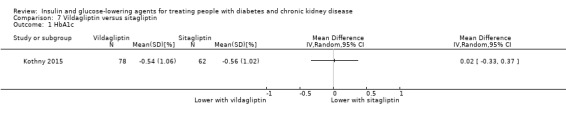
Comparison 7 Vildagliptin versus sitagliptin, Outcome 1 HbA1c.
Albiglutide versus sitagliptin
Leiter 2014 compared albiglutide to sitagliptin (507 participants) in people with an eGFR 15 to < 60 mL/min/1.73 m2. Albiglutide was reported to reduce HbA1c (MD ‐0.52%, 95% CI ‐0.77 to ‐0.27 (‐5.7 mmol/mol, ‐8.4 to ‐3.0); P < 0.0001) compared to sitagliptin (Analysis 8.1).
8.1. Analysis.
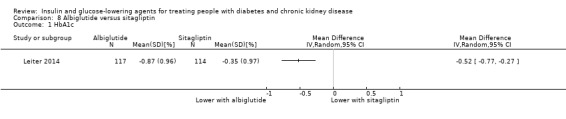
Comparison 8 Albiglutide versus sitagliptin, Outcome 1 HbA1c.
Sitagliptin versus insulin
Bellante 2016 compared sitagliptin to insulin (49 participants) in people with an eGFR < 45 mL/min/1.73 m2, including those people receiving HD. HbA1c was reported to be reduced from 8.2 ± 1.9% (66.1 ± 20.8 mmol/mol) at baseline to 7.3 ± 1.4% (56.3 ± 15.3 mmol/mol) at 52 weeks (P = 0.058) in the insulin group and was unchanged in the sitagliptin group (7.1 ± 1.0% (54.1 ± 10.9 mmol/mol) to 6.9 ± 0.8% (51.9 ± 8.7 mmol/mol)).
Linagliptin versus voglibose
Mori 2016 compared linagliptin to voglibose (78 participants) in people receiving HD. Linagliptin was reported to reduce HbA1c to a greater extent than voglibose (‐0.60% (‐6.6 mmol/mol) compared to ‐0.20% (‐2.2 mmol/mol); treatment difference (‐0.40%, 95% CI ‐0.74 to ‐0.06 (MD ‐4.4 mmol/mol, 95% CI ‐8.1 to ‐0.7); P = 0.022).
Aleglitazar versus pioglitazone
AleNephro 2014 compared aleglitazar to pioglitazone (302 participants) in people with an eGFR of 30 to < 60 mL/min/1.73 m2. In this study aleglitazar made little or no difference to HbA1c compared to pioglitazone (MD 0.09%, 95% CI ‐0.19 to 0.37 (1.0 mmol/mol, ‐2.1 to 4.0); P = 0.53; Analysis 9.1).
9.1. Analysis.
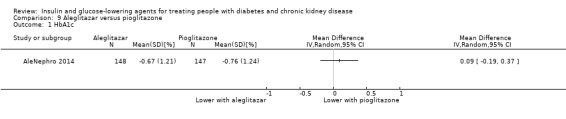
Comparison 9 Aleglitazar versus pioglitazone, Outcome 1 HbA1c.
Insulin
Two studies compared insulin administered IP to SC in people receiving PD (Diez 1987; Scarpioni 1994). In Diez 1987 (22 participants) there was no difference in HbA1c between the groups while Scarpioni 1994 (6 participants in a cross‐over study) did not report HbA1c as an outcome.
Studies comparing regular insulin to lispro insulin (Ruggenenti 2003a; 11 participants) and 0.25 U/kg of insulin glulisine and glargine compared to 0.5 U/kg (Baldwin 2012; 107 participants) did not report HbA1c as an outcome.
Fasting blood glucose
SGLT2 inhibitors versus placebo
In people with an eGFR of 15 to < 60 mL/min/1.73 m2, SGLT2 inhibitors probably reduce FBG by 0.48 mmol/L (95% CI ‐0.78 to ‐0.19; I2 = 0%; Analysis 1.2) compared to placebo (5 studies; 855 participants; moderate certainty evidence) (EMPA‐REG RENAL 2014; Haneda 2016; Kohan 2014; Yale 2013; Zambrowicz 2015).
1.2. Analysis.
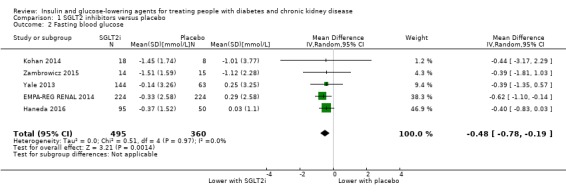
Comparison 1 SGLT2 inhibitors versus placebo, Outcome 2 Fasting blood glucose.
DPP‐4 inhibitors versus placebo
In people with an eGFR < 60 mL/min/1.73 m2, inclusive of people with ESKD receiving dialysis, DPP‐4 inhibitors may make little or no difference to FBG (MD ‐0.47 mmol/L, 95% CI ‐1.08 to 0.15; I2 = 16%; Analysis 2.2,) compared to placebo (4 studies; 589 participants; low certainty evidence) (Chan 2008a; Laakso 2015; McGill 2013; Nowicki 2011).
2.2. Analysis.
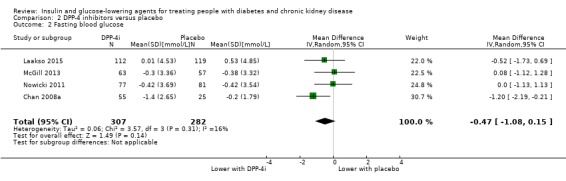
Comparison 2 DPP‐4 inhibitors versus placebo, Outcome 2 Fasting blood glucose.
GLP‐1 agonists versus placebo
LIRA‐RENAL 2016 (279 participants) quantified the difference in effect of liraglutide compared to placebo in people with an eGFR of 30 to < 60 mL/min/1.73 m2. Liraglutide was reported to reduce FBG by 1.08 mmol/L (95% CI ‐1.71 to ‐0.45; P = 0.0008) compared to placebo (Analysis 3.2). Idorn 2013 (24 participants) did not report FBG.
3.2. Analysis.
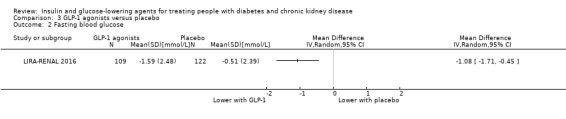
Comparison 3 GLP‐1 agonists versus placebo, Outcome 2 Fasting blood glucose.
Glitazones versus placebo/control
Meta‐analysis of data was not possible due to heterogeneity in the outcomes and reporting of outcomes. Qualitative synthesis of the studies showed that glitazones, particularly pioglitazone may reduce FBG compared to placebo in people with an eGFR < 60 mL/min/1.73 m2, including people on HD.
Two studies (71 participants) in HD people reported that pioglitazone reduced FBG more so than in the group not receiving pioglitazone (both P < 0.05; Abe 2007 (31 participants); Abe 2008a (40 participants)). Similarly, another study in HD people (Pfutzner 2011 (39 participants)) reported that pioglitazone reduced the FBG by 2.91 mmol/L (95% CI ‐5.44 to ‐0.38; P = 0.02) compared to placebo (Analysis 4.2).
4.2. Analysis.

Comparison 4 Glitazone versus placebo/control, Outcome 2 Fasting blood glucose.
In people with stage 3 CKD (60 participants), after 12 months, Jin 2007 reported pioglitazone‐losartan treatment resulted in a higher rate of decline for FBG values compared to losartan‐only treatment (change after 12 months –22.7 ± 6.9% for pioglitazone‐losartan therapy as compared with –15.1 ± 6.3% for losartan alone; P < 0.01). In stage 4 CKD, this drug combination was reported to have had little or no effect on FBG after 12 months compared with single‐drug treatment (–22.9 ± 8.9% versus –17.6 ± 5.9%; P = 0.07).
Conversely Abe 2010a (63 participants) reported that in HD people, pioglitazone reduced FBG at the end of the study compared to the start (7.72 ± 2.50 versus 6.89 ± 2.67 mmol/L; P < 0.05). However pioglitazone makes little or no difference to FBG compared to people not receiving pioglitazone (6.89 ± 2.67 mmol/L versus 7.33 ± 2.56 mmol/L; P > 0.05).
Data were unavailable from three studies (Mohideen 2005; Nakamura 2001; Wong 2005).
Glinides versus placebo/control
Abe 2010 compared glinides to a control group (36 participants) in people receiving HD. Mitiglinide was reported to reduce FBG compared to placebo over 24 weeks.
Sitagliptin versus glipizide
In people with an eGFR < 60 mL/min/1.73 m2 including those people receiving HD, sitagliptin may make little or no difference to FBG (MD 0.36 mmol/L, 95% CI ‐0.10 to 0.82; I2 = 0%; Analysis 6.2) compared to glipizide (2 studies; 397 participants; low certainty evidence) (Arjona Ferreira 2013; Arjona Ferreira 2013a).
6.2. Analysis.
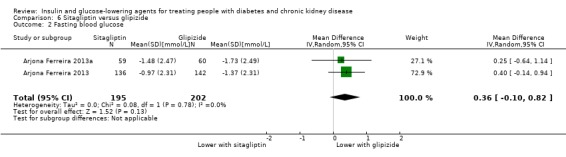
Comparison 6 Sitagliptin versus glipizide, Outcome 2 Fasting blood glucose.
Vildagliptin versus sitagliptin
Kothny 2015 compared vildagliptin to sitagliptin (148 participants) in people with an eGFR < 30 mL/min/1.73 m2 including those receiving HD. This study reported vildagliptin made little or no difference to FBG compared to sitagliptin (MD ‐0.63 mmol/L, 95% CI ‐1.74 to 0.48; P = 0.27; Analysis 7.2).
7.2. Analysis.
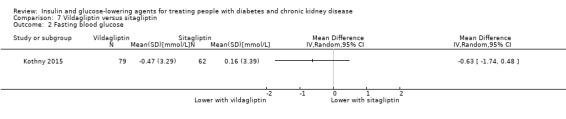
Comparison 7 Vildagliptin versus sitagliptin, Outcome 2 Fasting blood glucose.
Albiglutide versus sitagliptin
Leiter 2014 compared albiglutide to sitagliptin (507 participants) in people with an eGFR of 15 to < 60 mL/min/1.73 m2. Albiglutide was reported to reduce the FBG by 1.61 mmol/L (95% IC ‐2.35 to ‐0.87, P < 0.0001), compared to sitagliptin (Analysis 8.2).
8.2. Analysis.

Comparison 8 Albiglutide versus sitagliptin, Outcome 2 Fasting blood glucose.
Sitagliptin versus insulin
Bellante 2016 did not report FBG.
Linagliptin versus voglibose
Mori 2016 did not report FBG.
Aleglitazar versus pioglitazone
AleNephro 2014 compared aleglitazar to pioglitazone (302 participants) in people with an eGFR of 30 to < 60 mL/min/1.73 m2. This study reported aleglitazar had little or no effect on FBG compared to pioglitazone (MD ‐0.32 mmol/L, 95% CI ‐0.91 to 0.27; P = 0.29; Analysis 9.2).
9.2. Analysis.

Comparison 9 Aleglitazar versus pioglitazone, Outcome 2 Fasting blood glucose.
Insulin
Two studies compared IP versus SC insulin in people receiving PD (Diez 1987; Scarpioni 1994). Diez 1987 (22 participants) reported no difference in the FBG between groups, while Scarpioni 1994 (6 participants in a cross‐over study) did not report FBG.
Baldwin 2012 (107 participants), compared 0.25 U/kg of insulin glulisine and glargine to 0.5 U/kg in people with an eGFR ≤ 45 mL/min/1.73 m2. A SC insulin regimen of 0.25 U/kg/d (half of the dose insulin glulisine three times a day and half the dose glargine once a day) was reported to have had little or no effect on FBG compared to a regimen of 0.5 U/kg/d (half of the dose insulin glulisine three times a day and half of the dose glargine once a day; i.e. 8.62 ± 2.97 mmol/L versus 8.44 ± 3.48 mmol/L; P = 0.78) in people with an eGFR < 45 mL/min/1.73 m2.
Ruggenenti 2003a did not report FBG.
Secondary outcomes
Kidney function (creatinine, eGFR, albuminuria)
SGLT2 inhibitors versus placebo
In people with an eGFR of 30 to < 60 mL/min/1.73 m2, SGLT2 inhibitors probably increase SCr by 3.82 μmol/L (95% CI 1.45 to 6.19 (0.04 mg/dL, 0.02 to 0.07); I2 = 16%; Analysis 1.12) and probably reduces eGFR by 1.85 mL/min/1.73 m2 (95% CI ‐2.76 to ‐0.94; I2 = 0%; Analysis 1.9) compared to placebo (4 studies, 848 participants; moderate certainty evidence) (EMPA‐REG RENAL 2014; Haneda 2016; Kohan 2014; LANTERN 2015). However, SGLT2 inhibitors may reduce albuminuria (MD ‐8.14 mg/mmol creatinine, 95% CI ‐14.51 to ‐1.77 (‐71.89 mg/g creatinine, ‐128.17 to ‐15.60); I2 = 11%; Analysis 1.13) compared to placebo (5 studies; 1153 participants; low certainty evidence) (EMPA‐REG RENAL 2014; Haneda 2016; Kohan 2014; LANTERN 2015; Yale 2013) (Analysis 1.13).
1.12. Analysis.
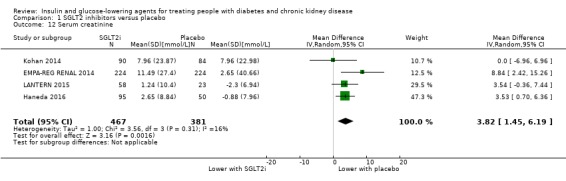
Comparison 1 SGLT2 inhibitors versus placebo, Outcome 12 Serum creatinine.
1.9. Analysis.
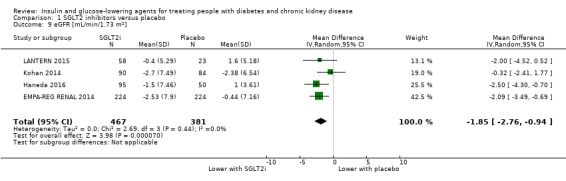
Comparison 1 SGLT2 inhibitors versus placebo, Outcome 9 eGFR [mL/min/1.73 m2].
1.13. Analysis.
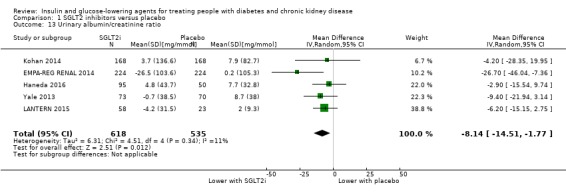
Comparison 1 SGLT2 inhibitors versus placebo, Outcome 13 Urinary albumin/creatinine ratio.
Relevant data suitable for incorporation in meta‐analyses were not available from EMPA‐REG OUTCOME 2013.
DPP‐4 inhibitors versus placebo
Meta‐analysis of data was not possible due to heterogeneity in, and reporting of, outcomes; as well as the different CKD stages of the participants studied. Two studies were in people undergoing dialysis making reporting of kidney function (creatinine, eGFR and albuminuria) meaningless (Abe 2016; Ito 2011a).
Several studies reported no significant or a small difference in the effects of DPP‐4 inhibitors compared to placebo on kidney function. In McGill 2013 (133 participants), linagliptin made little or no difference to the risk of kidney failure compared to placebo. Similarly, in Yki‐Järvinen 2013 (127 participants) there were no between‐group imbalance in shifts in stage of CKD. Two studies compared the effect of saxagliptin to placebo on kidney function. In SAVOR‐TIMI 53 2011, for people with an eGFR of 15 to < 50 mL/min/1.73 m2 (2576 participants) saxagliptin was reported to reduce eGFR to a similar extent as placebo. In Nowicki 2011 (571 participants) which compared the effects of saxagliptin with placebo in people with a creatinine clearance (CrCl) < 50 mL/min, saxagliptin doubled the SCr concentration from baseline in three people during the 52‐week treatment period. For those people not on dialysis, both saxagliptin and placebo were reported to slightly reduce the mean GFR (estimated by the Cockcroft‐Gault and MDRD equations). Two studies compared the effect of sitagliptin to placebo on the eGFR. In Chan 2008a (91 participants), which compared sitagliptin to placebo in people with a CrCl ≥ 30 to < 50 mL/min, sitagliptin made little or no difference to SCr compared to placebo (MD 4.42 μmol/L, 95% CI ‐9.59 to 18.43 (0.05 mg/dL, ‐0.11 to 0.21); P = 0.54; Analysis 2.10). In TECOS 2013 (3324 participants) there was a reported small reduction with sitagliptin in eGFR compared to placebo (mean between group treatment difference ‐1.33 mL/min/1.73 m2 (95% CI ‐2.45 to ‐0.21) for people with an eGFR 45 to 59 mL/min/1.73 m2; and ‐2.25 mL/min/1.73 m2 (95% CI ‐4.27 to ‐0.23) for people with an eGFR of 30 to 44 mL/min/1.73 m2. Additionally in a study comparing vildagliptin to placebo (Lukashevich 2011; 525 participants), there was a reported small and similar decline in eGFR over the year in both groups.
2.10. Analysis.
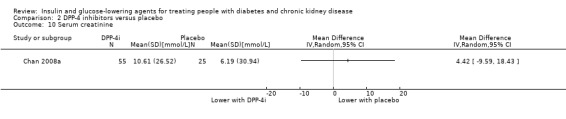
Comparison 2 DPP‐4 inhibitors versus placebo, Outcome 10 Serum creatinine.
Three studies reported an improvement in albuminuria. Chan 2008a (91 participants) compared sitagliptin to placebo in people with an eGFR < 50 mL/min/1.73 m2 to people on dialysis. In both groups, there was an increase from baseline (mean ± SE) in the UACR of 25,425 ± 21,470 mg/mmol (225 ± 190 mg/mg) and 56,161 ± 49,494 mg/mmol (497 ± 438 mg/mg) for the sitagliptin and placebo groups respectively (Analysis 2.11). GUARD 2017 (130 participants) compared gemigliptin to placebo in people with an eGFR of 15 to 59 mL/min/1.73 m2. Gemigliptin reduced the UACR at week 12 by 28.0% (95% CI ‐40.2 to ‐13.3) compared with 4.3% (95% CI ‐19.7 to 14.2) with placebo with a between‐group difference of 24.8% (95% CI ‐41.8 to ‐2.9; P = 0.0294). However, Gemigliptin also reduced eGFR compared to placebo (MD ‐1.99 mL/min/1.73 m2, 95% CI ‐3.49 to ‐0.49; P = 0.009; Analysis 2.9). In SAVOR‐TIMI 53 2011, for people with an eGFR of 15 to < 50 mL/min/1.73 m2 (2576 participants) saxagliptin reduced UACR compared to placebo. From baseline to two years, saxagliptin was reported to reduce UACR to a greater extent compared to placebo for those with an eGFR ≤ 50 and ≥ 30 mL/min/1.73 m2 (‐11.87 mg/mmol (‐105 mg/g); P = 0.011) and an eGFR < 30 mL/min/1.73 m2 (‐27.71 mg/mmol (‐245.2 mg/g); P = 0.086). In TECOS 2013 (3324 participants), for people with an eGFR of 30 to < 60 mL/min/1.73 m2, sitagliptin did not reduce the UACR compared to placebo (mean between group treatment difference ‐0.03 mg/mmol, 95% CI ‐0.08 to 0.01 (‐0.30 mg/g, ‐0.70 to 0.09) for people with an eGFR of 45 to 59 mL/min/1.73 m2; and 0.03 mg/mmol, 95% CI ‐0.06 to 0.11 (0.23 mg/g, ‐0.54 to 1.00) for people with an eGFR of 30 to 44 mL/min/1.73 m2)).
2.11. Analysis.
Comparison 2 DPP‐4 inhibitors versus placebo, Outcome 11 Urinary albumin/creatinine ratio.
2.9. Analysis.
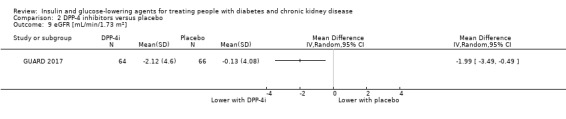
Comparison 2 DPP‐4 inhibitors versus placebo, Outcome 9 eGFR [mL/min/1.73 m2].
Data for kidney function were not available for three studies (Barnett 2013; Lewin 2012; SAVOR‐TIMI 53 2011).
GLP‐1 agonists versus placebo/control
Meta‐analysis of data was not possible due to heterogeneity in, and reporting of, outcomes.
Qualitative synthesis of studies (303 participants) show that liraglutide made little or no difference to kidney function compared to placebo, although one of the studies occurred in people on dialysis (Idorn 2013). In Idorn 2013 (24 participants), for people with ESKD on dialysis, it was reported that liraglutide had little or no effect on SCr compared to placebo (MD ‐0.88 μmol/L, 95% CI ‐5.30 to 3.5 (‐0.01 mg/dL, ‐0.06 to 0.04); P = 0.69; Analysis 3.9). However, this is meaningless given that the included people were on dialysis. Similarly in LIRA‐RENAL 2016 (279 participants), liraglutide made little or no difference to kidney function parameters compared to placebo. Liraglutide makes little or no difference to the ratio of week 26 to baseline for SCr compared to placebo (P = 0.26). Liraglutide changed the mean eGFR from baseline to week 26 by ‐0.35 mL/min/1.73 m2 compared to placebo (0.37 mL/min/1.73 m2). The estimated ratio of the week 26 to baseline UACR was 0.87 with liraglutide and 1.05 with placebo.
3.9. Analysis.

Comparison 3 GLP‐1 agonists versus placebo, Outcome 9 Serum creatinine.
Glitazones versus placebo/control
Meta‐analysis of data was not possible.
The majority of studies included people who had ESKD and were on dialysis making reporting of eGFR, creatinine and albuminuria pointless (Abe 2007 (pioglitazone); Abe 2008a (pioglitazone); Abe 2010 (pioglitazone); Nakamura 2001 (pioglitazone); Pfutzner 2011 (pioglitazone); Wong 2005 (rosiglitazone)).
Jin 2007 (60 participants) compared pioglitazone added to losartan to losartan alone in people with an eGFR of 15 to < 60 mL/min/1.73 m2. Pioglitazone plus losartan was reported to reduce SCr more than losartan alone in stage 3 and 4 CKD. GFR was reported to decline more sharply and significantly in those with losartan alone compared to pioglitazone plus losartan. In people with stage 3 CKD, the median change in proteinuria was reported to be significantly greater after treatment with pioglitazone plus losartan compared with losartan alone at 12 months (–50.0 versus –26.2 g/L, P < 0.001, respectively). In people with stage 4 CKD, the change in proteinuria at 12 months was reported to be significantly greater after treatment with the pioglitazone plus losartan than with losartan alone (–44.7 versus –28.0 g/L, P < 0.001).
Data were not available from Mohideen 2005.
Glinides versus placebo/control
Abe 2010 did not report data for SCr, eGFR and albuminuria.
Sitagliptin versus glipizide
Meta‐analysis of the two included studies was not possible.
Arjona Ferreira 2013 (423 participants) enrolled people with an eGFR < 50 mL/min/1.73 m2 and not on dialysis. Both sitagliptin and glipizide were reported to reduce eGFR similarly from baseline (sitagliptin, 23.9 mL/min/1.73 m2; glipizide, 23.3 mL/min/1.73 m2). Arjona Ferreira 2013a (129 participants) enrolled in people receiving dialysis, so measures of eGFR, SCr, and UACR between sitagliptin and glipizide are meaningless.
Vildagliptin versus sitagliptin
Kothny 2015 (148 participants) compared vildagliptin to sitagliptin in people with an eGFR < 30 mL/min/1.73 m2 including those receiving HD. No deterioration of kidney function was reported with either vildagliptin or sitagliptin.
Albiglutide to sitagliptin
Leiter 2014 (507 participants) compared albiglutide to sitagliptin in people with an eGFR of 15 to < 60 mL/min/1.73 m2. Shifts from baseline in kidney impairment category, as assessed by eGFR, were reported to be similar between groups, with no treatment‐associated trends evident in either SCr or UACR.
Sitagliptin versus insulin
Bellante 2016 (49 participants) compared sitagliptin to insulin in people with an eGFR < 45 mL/min/1.73 m2, including those people receiving HD. It was reported that neither insulin nor sitagliptin resulted in a change in eGFR.
Linagliptin versus voglibose
Mori 2016 (78 participants) compared linagliptin to voglibose in people receiving HD. Reporting change in kidney function in this study is meaningless.
Aleglitazar versus pioglitazone
AleNephro 2014 (302 participants) compared aleglitazar to pioglitazone in people with an eGFR of 30 to < 60 mL/min/1.73 m2. A reduction in the mean eGFR from baseline was reported in the aleglitazar group by week 2 and plateaued after 8 weeks, returning towards baseline following cessation of treatment. Mean eGFR change at end of treatment with aleglitazar was –15.0% (95% CI –19.1 to –10.8) versus –5.4% (95% CI –9.6 to –1.2) with pioglitazone (P = 0.001) (Analysis 9.9: MD ‐9.60%, 95% CI ‐15.50 to ‐3.70). The treatment difference in eGFR at the end of follow‐up was 0.77% (95% CI: –4.5 to 6.0; P = 0.77).
9.9. Analysis.
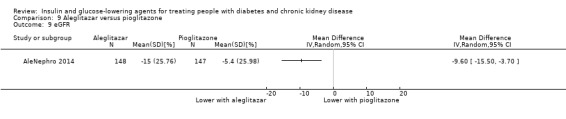
Comparison 9 Aleglitazar versus pioglitazone, Outcome 9 eGFR.
Aleglitazar was reported to reduce UACR by the end of treatment to 35.0% (95% CI –46.8 to –20.5) compared to 29.4% with pioglitazone (95% CI –42.4 to –13.4). Additionally, Aleglitazar reduced UACR by the end of follow‐up to 19.8% (95% CI –36.3 to 0.9) compared to 18.2% with pioglitazone (95% CI –35.3 to 3.3).
Insulin
Two studies (28 participants) compared insulin administered IP compared to SC (Diez 1987; Scarpioni 1994) in people with ESKD receiving PD. Reporting change in kidney function in these studies is meaningless.
Ruggenenti 2003a (11 participants) compared regular insulin to lispro insulin in people with a GFR 50 to 60 mL/min. Both insulin lispro and regular insulin administration were reported to result in acute changes in GFR estimated by paraminohippuric acid clearance, two hours post‐prandially. Insulin lispro reduced mean (± SE) GFR compared to regular insulin respectively (‐6.3 ± 4.7% versus 5.8 ± 5.0%; P < 0.05).
Baldwin 2012 (107 participants), compared 0.25 U/kg of glulisine insulin and glargine insulin to 0.5 U/kg in people with an eGFR ≤ 45 mL/min/1.73 m2. Kidney function markers including creatinine, eGFR, and albuminuria were not reported.
Systolic and diastolic blood pressure
SGLT2 Inhibitors versus placebo
In people with an eGFR 15 to < 60 mL/min/1.73 m2, SGLT2 inhibitors probably reduce systolic BP by 4.68 mmHg (‐6.69 to ‐2.68; I2 = 40%; Analysis 1.10; 7 studies; 1198 participants; moderate certainty evidence) (EMPA‐REG BP 2015; EMPA‐REG RENAL 2014; Haneda 2016; Kohan 2014; LANTERN 2015; Yale 2013; Zambrowicz 2015) and diastolic BP by 1.72 mmHg (‐2.77 to ‐0.66; I2 = 0%; Analysis 1.11; 6 studies; 1142 participants; moderate certainty evidence) (EMPA‐REG BP 2015; Haneda 2016; Kohan 2014; LANTERN 2015; Yale 2013; Zambrowicz 2015).
1.10. Analysis.
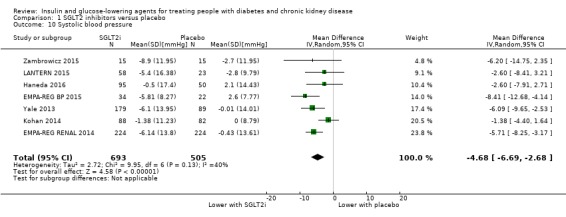
Comparison 1 SGLT2 inhibitors versus placebo, Outcome 10 Systolic blood pressure.
1.11. Analysis.
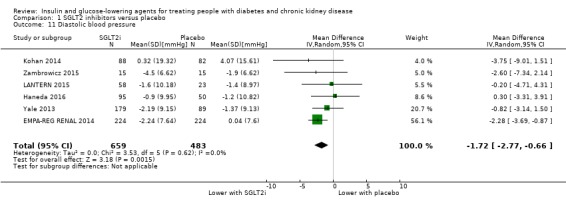
Comparison 1 SGLT2 inhibitors versus placebo, Outcome 11 Diastolic blood pressure.
DPP‐4 inhibitors versus placebo
Meta‐analysis was not possible.
DPP‐4 inhibitors may have no to minimal effect on BP compared to placebo. Two studies (144 participants) report no change in BP with the use of DPP‐4 inhibitors compared to placebo in people receiving HD (saxagliptin (Abe 2016: 84 participants); vildagliptin (Ito 2011a: 60 participants)). Two studies (261 participants) reported small reductions in BP compared to placebo. Chan 2008a (91 participants), comparing sitagliptin to placebo in people with an eGFR < 50 mL/min/1.73 m2, reported a small (approximately 2 mmHg), mean reduction in systolic, diastolic and mean arterial BP compared to those on placebo. Nowicki 2011 (170 participants) reported a "trend toward reduction in mean systolic and diastolic blood pressure from baseline to week 52 with saxagliptin (‐6.6 and ‐2.7 mmHg respectively) vs. placebo (2.1 and 0.7 mmHg respectively)" in people with a CrCl < 50 mL/min.
Nine studies did not report BP data (Barnett 2013; GUARD 2017; Laakso 2015; Lewin 2012; Lukashevich 2011; McGill 2013; SAVOR‐TIMI 53 2011; TECOS 2013; Yki‐Järvinen 2013).
GLP‐1 agonists versus placebo
Meta‐analysis was not possible.
From qualitative synthesis of two studies, liraglutide had little or no effect on systolic or diastolic BP compared to placebo. Idorn 2013 (24 participants) reported liraglutide did not change systolic or diastolic BP significantly in people receiving dialysis. Liraglutide had little or no effect on systolic BP (MD 0.00 mmHg, ‐23.63 to 23.63; Analysis 3.7) and diastolic BP (MD 4.00 mmHg, ‐5.34 to 13.34; Analysis 3.8) compared to placebo. LIRA‐RENAL 2016 (279 participants), reported a reduction of systolic BP occurs in people with an eGFR of 30 to < 60 mL/min/1.73 m2 when given liraglutide (‐2.45 mmHg) or placebo (‐0.33 mmHg) but there was no difference between groups (P = 0.25). There is no difference in the diastolic BP reported between the groups (P = 0.89).
3.7. Analysis.

Comparison 3 GLP‐1 agonists versus placebo, Outcome 7 Systolic blood pressure.
3.8. Analysis.
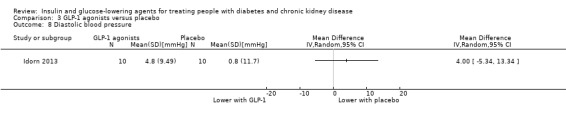
Comparison 3 GLP‐1 agonists versus placebo, Outcome 8 Diastolic blood pressure.
Glitazones versus placebo/control
Meta‐analysis of data was not possible.
The majority of studies reported glitazones reduced systolic and diastolic BP compared to those not receiving glitazones. Abe 2007 (31 participants) compared pioglitazone to control in people on HD. Pioglitazone reduced (mean ± SE) systolic BP (162.3 ± 7.1 mmHg compared to 148.5 ± 6.2 mmHg P < 0.05) whilst the absence of pioglitazone did not (161.0 ± 7.0 mmHg compared to 159.6 ± 6.2 mmHg P > 0.05). Similarly, pioglitazone reduced diastolic BP (85.5 ± 4.2 mmHg versus 75.0 ± 3.3 mmHg P < 0.05) whilst the absence of pioglitazone does not (84.4 ± 4.5 mmHg versus 83.8 ± 3.6 mmHg P > 0.05). In Abe 2008a (40 participants), amongst people receiving HD, pioglitazone reduced systolic and diastolic BP compared to baseline (P < 0.01) and compared to placebo (P < 0.01). In another study (63 participants) amongst people receiving HD (Abe 2010a) pioglitazone reduced (mean ± SD) systolic (159.2 ± 22.1 mmHg versus 147.0 ± 21.1 mmHg, P < 0.05) and diastolic BP (83.8 ± 12.6 mmHg versus 78.1 ± 12.1 mmHg, P < 0.05) compared to baseline and systolic (147.0 ± 21.1 mmHg versus 159.8 ± 19.7 mmHg, P < 0.05) and diastolic BP (78.1 ± 12.1 mmHg versus 85.6 ± 11.2 mmHg, P < 0.05) compared to placebo.
Wong 2005 (52 participants) reported rosiglitazone reduced systolic BP by 11 mmHg (‐21.99 to ‐0.01; P = 0.05; Analysis 4.5) and diastolic BP by 13.79 mmHg (‐24.13 to ‐3.45; P = 0.009; Analysis 4.6) compared to placebo.
4.5. Analysis.
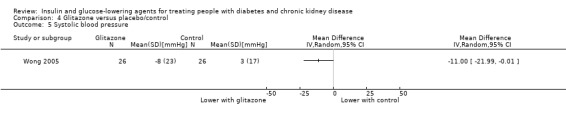
Comparison 4 Glitazone versus placebo/control, Outcome 5 Systolic blood pressure.
4.6. Analysis.
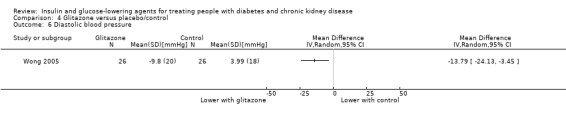
Comparison 4 Glitazone versus placebo/control, Outcome 6 Diastolic blood pressure.
In contrast, Jin 2007 (60 participants; eGFR 15 to 59 mL/min/1.73 m2) reported little or no difference in BP between pioglitazone and the control group. Similarly, Pfutzner 2011 (39 participants) reported pioglitazone had little or no effect on BP in people on HD.
BP data were not available from Mohideen 2005; and Nakamura 2001.
Sitagliptin versus glipizide
Meta‐analysis of data was not possible.
There may be little or no difference in BP between sitagliptin and glipizide (2 studies, 555 participants) in people with an eGFR < 50 mL/min/1.73 m2 (Arjona Ferreira 2013: 423 participants) but not on dialysis, and in people with ESKD on dialysis (Arjona Ferreira 2013a: 129 participants).
Linagliptin versus voglibose
Mori 2016 did not report BP data.
Sitagliptin versus insulin
Bellante 2016 compared sitagliptin to insulin in people with an eGFR < 45 mL/min/1.73 m2, including those on HD (49 participants); there was no reported change in BP after treatment with either sitagliptin or insulin.
Aleglitazar versus pioglitazone
AleNephro 2014 compared aleglitazar to pioglitazone in people with an eGFR of 30 to 59 mL/min/1.73 m2 (302 participants). In this study, aleglitazar had little or no effect on systolic BP (MD ‐ 0.60 mmHg, 95% CI ‐ 4.49 to 3.29 mmHg; P = 0.76; Analysis 9.10) or diastolic BP (MD‐1.70 mmHg, 95% CI‐ 4.14 to 0.74 mmHg; P = 0.17; Analysis 9.11) compared to pioglitazone.
9.10. Analysis.
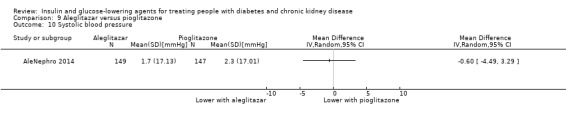
Comparison 9 Aleglitazar versus pioglitazone, Outcome 10 Systolic blood pressure.
9.11. Analysis.

Comparison 9 Aleglitazar versus pioglitazone, Outcome 11 Diastolic blood pressure.
Other comparisons
Data for the following comparisons were not available: vildagliptin versus sitagliptin; albiglutide versus sitagliptin; IP to SC insulin; 0.5 U/kg compared to 0.25 U/kg of insulin glulisine and glargine; and regular insulin versus insulin lispro.
Lipids (total cholesterol, HDL, LDL, triglyceride)
SGLT2 inhibitors versus placebo
In people with an eGFR of 30 to < 60 mL/min/1.73 m2, SGLT2 inhibitors probably has little or no effect on total cholesterol (MD 0.09 mmol/L, 95% CI ‐0.05 to 0.24; I2 = 0%; Analysis 1.15) compared to placebo (2 studies; 529 participants; moderate certainty evidence) (EMPA‐REG RENAL 2014; LANTERN 2015). However, SGLT2 inhibitors probably raise HDL levels (MD 0.04 mmol/L, 95% CI 0.01 to 0.07; I2 = 0%; Analysis 1.16) compared to placebo (4 studies; 918 participants; moderate certainty evidence) (EMPA‐REG RENAL 2014; Haneda 2016; LANTERN 2015; Yale 2013). SGLT2 inhibitors probably has little or no effect on LDL cholesterol (MD 0.04 mmol/L, 95% CI ‐0.06 to 0.14; I2 = 22%; Analysis 1.17) and triglycerides (MD 0.01 mmol/L, 95% CI ‐0.11 to 0.14; I2 = 0%; Analysis 1.18) compared to placebo (4 studies; 918 participants; moderate certainty evidence) (EMPA‐REG RENAL 2014; Haneda 2016; LANTERN 2015; Yale 2013).
1.15. Analysis.
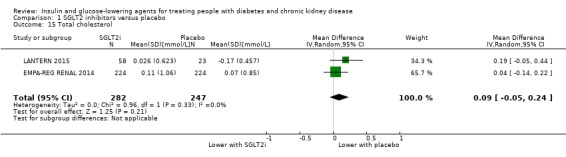
Comparison 1 SGLT2 inhibitors versus placebo, Outcome 15 Total cholesterol.
1.16. Analysis.

Comparison 1 SGLT2 inhibitors versus placebo, Outcome 16 HDL cholesterol.
1.17. Analysis.
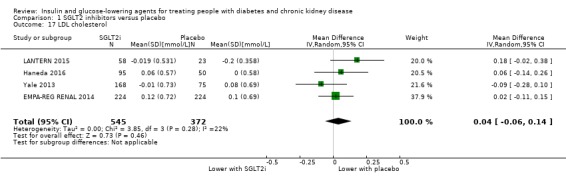
Comparison 1 SGLT2 inhibitors versus placebo, Outcome 17 LDL cholesterol.
1.18. Analysis.
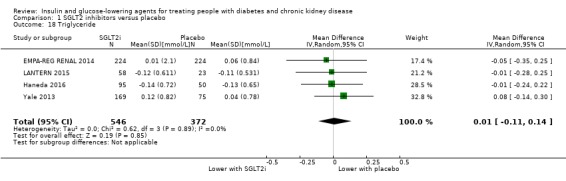
Comparison 1 SGLT2 inhibitors versus placebo, Outcome 18 Triglyceride.
DPP‐4 inhibitors versus placebo
Meta‐analysis of data was not possible.
Abe 2016 (84 participants) compared saxagliptin to placebo in people receiving HD. Saxagliptin was reported to not reduce total cholesterol or increase HDL cholesterol from baseline to the end of the study, and had a similar effect to placebo. However, saxagliptin reduced triglyceride concentrations from baseline to the end of the study (median 1.11 mmol/L, IQR 0.64 to 1.58 versus 0.97 mmol/L, 0.63 to 1.40; P = 0.0015) and also compared to placebo (0.97; 0.63 to 1.40 versus 1.26; 0.95 to 1.89 mmol/L; P = 0.041).
Ito 2011a (60 participants) compared vildagliptin to placebo amongst HD people. In this study, vildagliptin had little or no effect on total cholesterol, HDL cholesterol or triglyceride levels.
In people with less severe CKD with an eGFR of 15 to 59 mL/min/1.73 m2, GUARD 2017 compared gemigliptin to placebo (130 participants). Gemigliptin was reported to reduce total cholesterol (MD 0.33 mmol/L, 95% CI‐0.54 to ‐0.12; P = 0.003) and LDL (MD 0.23 mmol/L, 95% CI‐0.42 to ‐0.04 mmol/L; P = 0.02) (Analysis 2.12; Analysis 2.13).
2.12. Analysis.
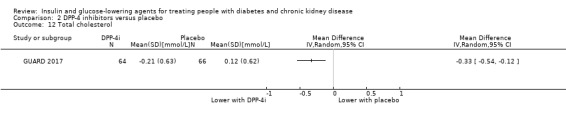
Comparison 2 DPP‐4 inhibitors versus placebo, Outcome 12 Total cholesterol.
2.13. Analysis.
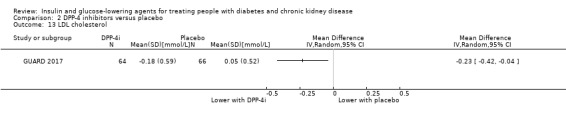
Comparison 2 DPP‐4 inhibitors versus placebo, Outcome 13 LDL cholesterol.
No data were available from 10 studies (Barnett 2013; Chan 2008a; Laakso 2015; Lewin 2012; Lukashevich 2011; McGill 2013; Nowicki 2011; SAVOR‐TIMI 53 2011; TECOS 2013; Yki‐Järvinen 2013).
GLP‐1 agonists versus placebo
Meta‐analysis of data was not possible.
Idorn 2013 (24 participants) reported liraglutide may have a similar effect to placebo in people with ESKD receiving HD on total cholesterol (Analysis 3.10: MD 0.20 mmol/L, 95% CI ‐0.85 to 1.23; P = 0.71); LDL (Analysis 3.11: MD 0.10 mmol/L, 95% CI ‐0.77 to 0.97; P = 0.82); HDL (Analysis 3.12: MD ‐0.10 mmol/L, 95% CI ‐0.38 to 0.18 ; P = 0.48) and triglyceride levels (Analysis 3.13: MD 0.43 mmol/L, 95% CI ‐0.29 to 1.15; P = 0.24) and in people with an eGFR of 30 to < 60 mL/min/1.73 m2 (LIRA‐RENAL 2016: 279 participants).
3.10. Analysis.
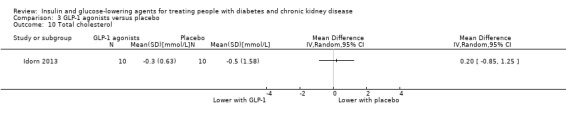
Comparison 3 GLP‐1 agonists versus placebo, Outcome 10 Total cholesterol.
3.11. Analysis.
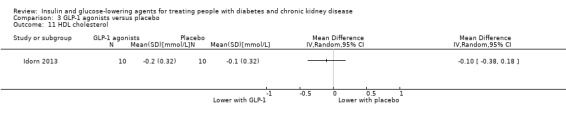
Comparison 3 GLP‐1 agonists versus placebo, Outcome 11 HDL cholesterol.
3.12. Analysis.
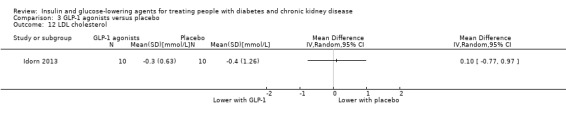
Comparison 3 GLP‐1 agonists versus placebo, Outcome 12 LDL cholesterol.
3.13. Analysis.

Comparison 3 GLP‐1 agonists versus placebo, Outcome 13 Triglyceride.
Glitazones versus placebo/control
In people receiving HD and PD, glitazones may have little or no effect on total cholesterol (MD 0.60 mmol/L, 95% CI ‐0.02 to 1.23; I2 = 0%; Analysis 4.7) compared to placebo (2 studies; 72 participants; low certainty evidence) (Pfutzner 2011; Wong 2005). It is uncertain if glitazones have any effect on HDL cholesterol (MD 0.07 mmol/L, 95% CI ‐0.25 to 0.40; I2 = 85%; Analysis 4.8), LDL cholesterol (MD 0.39 mmol/L,95% CI ‐ 0.60 to 1.39; I2 = 68%; Analysis 4.9) and triglyceride levels (MD ‐ 0.34 mmol/L, 95% CI ‐2.99 to 2.30; I2 = 94%; Analysis 4.10) compared to placebo (2 studies; 72 participants; very low certainty evidence) (Pfutzner 2011; Wong 2005).
4.7. Analysis.
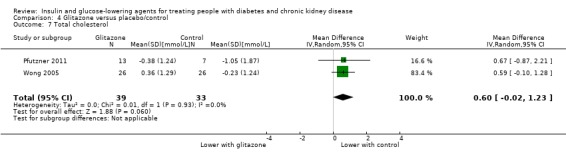
Comparison 4 Glitazone versus placebo/control, Outcome 7 Total cholesterol.
4.8. Analysis.
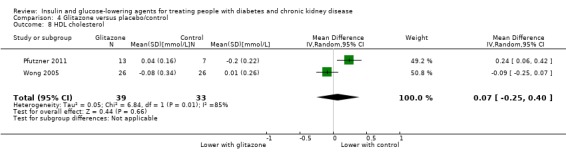
Comparison 4 Glitazone versus placebo/control, Outcome 8 HDL cholesterol.
4.9. Analysis.

Comparison 4 Glitazone versus placebo/control, Outcome 9 LDL cholesterol.
4.10. Analysis.
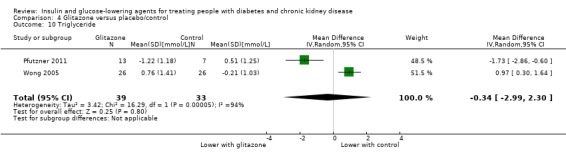
Comparison 4 Glitazone versus placebo/control, Outcome 10 Triglyceride.
Glinides versus placebo/control
In people receiving HD, Abe 2010 reported mitiglinide did not result in a change in total cholesterol or HDL levels compared to placebo (36 participants). However, mitiglinide resulted in lower triglyceride levels (mean ± SD) compared to the start of the study (1.91 ± 1.10 mmol/L versus 1.37 ± 0.90 mmol/L; P = 0.002) and reduced triglyceride levels compared to placebo (1.37 ± 0.90 mmol/L versus 1.80 ± 0.73 mmol/L; P < 0.05)
Sitagliptin versus glipizide
Meta‐analysis of data was not possible.
Arjona Ferreira 2013 reported that in people with an eGFR < 50 mL/min/1.73 m2 but not on HD (423 participants), sitagliptin reduced total cholesterol by 0.18 mmol/L (95% CI ‐0.33 to ‐0.03; P = 0.015; Analysis 6.6) and LDL cholesterol by 0.30 mmol/L (95% CI ‐0.54 to ‐0.06; P = 0.016; Analysis 6.8) more than glipizide. Additionally, sitagliptin had little or no effect on HDL cholesterol (MD 0.07 mmol/L, 95% CI ‐0.06 to 0.20; P = 0.28; Analysis 6.7).
6.6. Analysis.

Comparison 6 Sitagliptin versus glipizide, Outcome 6 Total cholesterol.
6.8. Analysis.
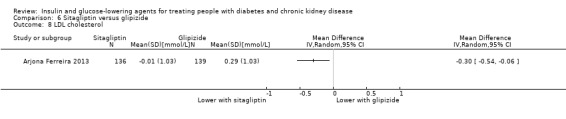
Comparison 6 Sitagliptin versus glipizide, Outcome 8 LDL cholesterol.
6.7. Analysis.

Comparison 6 Sitagliptin versus glipizide, Outcome 7 HDL cholesterol.
However, Arjona Ferreira 2013a reported that in people on dialysis (129 participants) receiving either sitagliptin or glipizide, there were no within‐group changes or differences between groups in cholesterol‐related parameters. For triglyceride levels, glipizide reduced levels from baseline (median percent change, ‐10.3%, 95% CI, ‐19.0 to ‐1.6) while sitagliptin did not (0.0%, 95% CI ‐16.6 to 16.6).
Aleglitazar versus pioglitazone
In people with an eGFR of 30 to < 60 mL/min/1.73 m2AleNephro 2014 (302 participants) reported aleglitazar reduced LDL cholesterol ‐7.3% (95% CI ‐13.2 to ‐1.0) while pioglitazone did not (‐0.3%, 95% CI ‐6.8 to 6.6). Aleglitazar resulted in a greater rise in HDL (22.0%, 95% CI 17.4 to 26.6) compared to pioglitazone (11.6%, 95% CI 6.9 to 16.3%) and a greater reduction in triglycerides (‐33.6%, 95% CI ‐41.1 to ‐26.1%) compared to pioglitazone (‐14.1%, 95% CI ‐21.7 to ‐6.5).
Other comparisons
Data for the following comparisons were not available: vildagliptin versus sitagliptin; albiglutide versus sitagliptin; linagliptin versus voglibose; sitagliptin versus insulin; IP versus SC insulin; 0.5 U/kg versus 0.25 U/kg of insulin glulisine and glargine; and regular insulin versus insulin lispro.
Body weight
SGLT2 inhibitors versus placebo
In people with an eGFR of 30 to < 60 mL/min/1.73 m2 (1029 participants), SGLT2 inhibitors may reduce weight (MD ‐1.41 kg, 95% CI ‐1.80 to ‐1.02; I2 = 28%; Analysis 1.8) compared to placebo (5 studies; 1029 participants; low certainty evidence) (EMPA‐REG RENAL 2014; Haneda 2016; Kohan 2014; LANTERN 2015; Yale 2013).
1.8. Analysis.

Comparison 1 SGLT2 inhibitors versus placebo, Outcome 8 Weight.
DPP‐4 inhibitors versus placebo
In people with an eGFR < 60 mL/min/1.73 m2 to ESKD (210 participants), DPP‐4 inhibitors may have little or no effect on weight (MD 0.16 kg, 95% CI ‐0.58 to 0.90; I2 = 29%; Analysis 2.8) versus placebo (2 studies; 210 participants; low certainty evidence) (Chan 2008a; GUARD 2017).
2.8. Analysis.

Comparison 2 DPP‐4 inhibitors versus placebo, Outcome 8 Weight.
GLP‐1 agonists versus placebo
Meta‐analysis of data was not possible.
In two studies (303 participants), liraglutide may reduce body weight to a greater extent than control in people with an eGFR < 60 mL/min/1.73 m2, including people receiving HD (Idorn 2013; LIRA‐RENAL 2016).
In people with ESKD receiving HD (24 participants), Idorn 2013 reported liraglutide resulted in a 2.20 kg reduction in weight (‐3.87 to 0.53; P = 0.01) (Analysis 3.6), compared to placebo. However, weight (mean ± SE) was not reduced compared to baseline (91.1 ± 4.9 kg to 88.7 ± 5.2 kg; P = 0.22).
3.6. Analysis.

Comparison 3 GLP‐1 agonists versus placebo, Outcome 6 Weight.
In people with an eGFR of 30 to < 60 mL/min/1.73 m2LIRA‐RENAL 2016 reported both liraglutide and placebo groups exhibited gradual weight reduction (279 participants). Liraglutide causes a greater reduction in body weight compared to placebo (‐2.41 kg and ‐1.09 kg respectively) with an estimated treatment different of ‐1.32 kg (95% CI ‐2.24 to ‐0.4; P = 0.0052).
Glitazones versus placebo
Meta‐analysis of data was not possible.
In 3 studies (total of 110 participants), pioglitazone does not result in a significant increase of dry weight compared to placebo in people receiving HD (Abe 2007; Abe 2008a; Pfutzner 2011) or significant increase of body weight compared to placebo in people with an eGFR 15 to < 60 mL/min/1.73 m2 (Jin 2007: 60 participants). Conversely, rosiglitazone results in more weight gain (mean ± SD) compared to placebo (2.0% ± 5.6% versus ‐0.8% ± 4.4%; P = 0.049) in people receiving PD (Wong 2005: 52 participants).
Data on weight was not available from three studies (Abe 2010; Mohideen 2005; Nakamura 2001).
Glinides versus placebo
Amongst people receiving HD randomised to either mitiglinide or placebo (36 participants), Abe 2010 reported there was little or no effect on body weight.
Sitagliptin versus glipizide
Meta‐analysis of data was not possible.
In people with an eGFR < 50 mL/min/1.73 m2 but not on dialysis (423 participants) Arjona Ferreira 2013 reported sitagliptin reduced body weight (‐0.6 kg) compared to glipizide which increased (1.2 kg) body weight, resulting in a between‐group difference of ‐1.8 kg (P < 0.001).
Conversely in people with ESKD on dialysis (129 participants) Arjona Ferreira 2013a reported sitagliptin had a similar effect to glipizide on weight ‐1.00 kg (‐2.80 to 0.80 kg; P = 0.28).
Aleglitazar versus pioglitazone
In people with an eGFR of 30 to < 60 mL/min/1.73 m2 (302 participants) AleNephro 2014 reported aleglitazar showed similar weight gain (MD 2.4 kg, 95% CI 1.6 to 3.2) to pioglitazone (MD 2.5 kg, 95% CI 1.7 to 3.3; Analysis 9.8).
9.8. Analysis.

Comparison 9 Aleglitazar versus pioglitazone, Outcome 8 Weight.
Other comparisons
Data for the following comparisons were not available: vildagliptin versus sitagliptin; albiglutide versus sitagliptin; linagliptin versus voglibose; sitagliptin versus insulin; IP versus SC insulin; 0.5 U/kg versus 0.25 U/kg of insulin glulisine and glargine; and regular insulin versus insulin lispro.
Death (all causes)
SGLT2 inhibitors
In people with an eGFR 30 to < 60 mL/min/1.73 m2 it is uncertain whether SGLT2 inhibitors have any effect on death (RR 0.78, 95% CI 0.60 to 1.02; I2 = 0%; Analysis 1.3) compared to placebo (5 studies; 2933 participants; very low certainty evidence) EMPA‐REG OUTCOME 2013; EMPA‐REG RENAL 2014; Haneda 2016; Kohan 2014; Yale 2013).
1.3. Analysis.
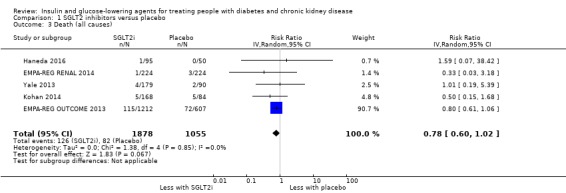
Comparison 1 SGLT2 inhibitors versus placebo, Outcome 3 Death (all causes).
DPP‐4 inhibitors
In people with an eGFR < 60 mL/min/1.73 m2 including ESKD on dialysis, DPP‐4 inhibitors may make little or no difference to the risk of death (RR 0.89, 95% CI 0.75 to 1.07; I2 = 0%; Analysis 2.3) compared to placebo (6 studies; 4211 participants; low certainty evidence) (Chan 2008a; Lukashevich 2011; McGill 2013; Nowicki 2011; TECOS 2013; Yki‐Järvinen 2013).
2.3. Analysis.
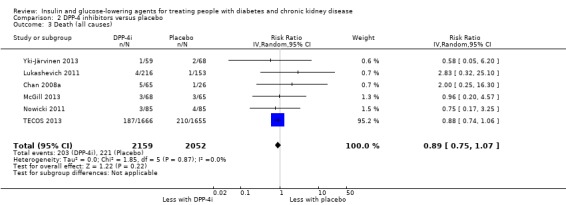
Comparison 2 DPP‐4 inhibitors versus placebo, Outcome 3 Death (all causes).
GLP‐1 agonists
In people with an eGFR < 60 mL/min/1.73 m2 including ESKD on dialysis, GLP‐1 agonists may make little or no difference to the risk of death (RR 3.91, 95% CI 0.44 to 34.58; Analysis 3.3) compared to placebo (2 studies; 301 participants; low certainty evidence) (Idorn 2013; LIRA‐RENAL 2016).
3.3. Analysis.
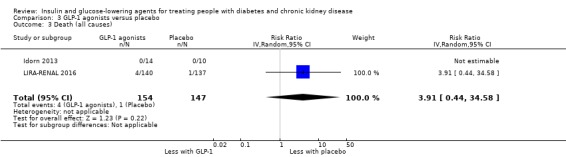
Comparison 3 GLP‐1 agonists versus placebo, Outcome 3 Death (all causes).
Glitazones versus placebo
In people receiving PD Wong 2005 reported rosiglitazone made little or no difference to the risk of death compared to placebo (RR 0.50, 95% CI 0.05 to 5.18; P = 0.56; 52 participants; Analysis 4.3).
4.3. Analysis.

Comparison 4 Glitazone versus placebo/control, Outcome 3 Death (all causes).
Sitagliptin versus glipizide
In people with an eGFR < 50 mL/min/1.73 m2, including those on dialysis, it is uncertain if sitagliptin has an effect on the risk of death (RR 0.55, 95% CI 0.22 to 1.36; I2 = 0%; Analysis 6.3) compared to glipizide (2 studies; 551 participants; very low certainty evidence) (Arjona Ferreira 2013; Arjona Ferreira 2013a).
6.3. Analysis.

Comparison 6 Sitagliptin versus glipizide, Outcome 3 Death (all causes).
Aleglitazar versus pioglitazone
In people with an eGFR of 30 to < 60 mL/min/1.73 m2AleNephro 2014 (302 participants) reported aleglitazar had little or no effect on the risk of death compared to pioglitazone (RR 1.02, 95% CI 0.21 to 4.97; P = 0.98; 302 participants; Analysis 9.4).
9.4. Analysis.
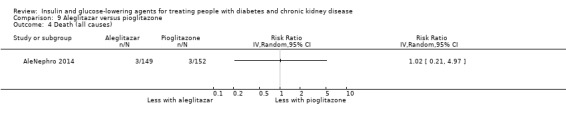
Comparison 9 Aleglitazar versus pioglitazone, Outcome 4 Death (all causes).
Vildagliptin versus sitagliptin
In people with an eGFR < 30 mL/min/1.73 m2, including ESKD on HD, Kothny 2015 reported vildagliptin had little or no effect on death compared to sitagliptin (RR 0.78, 95% CI 0.11 to 5.41; P = 0.80; 148 participants; Analysis 7.3).
7.3. Analysis.
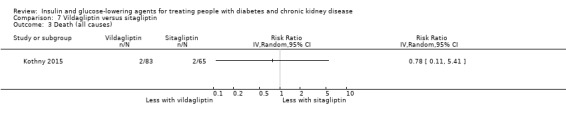
Comparison 7 Vildagliptin versus sitagliptin, Outcome 3 Death (all causes).
Linagliptin versus voglibose
Mori 2016 compared linagliptin to voglibose in people receiving HD (78 participants). Although one death occurred in the voglibose group during the study period, it was not considered treatment‐related.
Other comparisons
Data for the following comparisons were not available: glinide versus no glinide; albiglutide versus sitagliptin; sitagliptin versus insulin; IP versus SC insulin; 0.5 U/kg versus 0.25 U/kg of insulin glulisine and glargine; and regular insulin versus insulin lispro.
Macrovascular events (cardiovascular death, non‐fatal myocardial infarction, non‐fatal stroke)
SGLT2 inhibitors
In people with an eGFR of 30 to < 60 mL/min/1.73 m2 SGLT2 inhibitors may have little or no effect on the risk of cardiovascular death compared to placebo (RR 0.78, 95% CI 0.56 to 1.10; I2 = 0%; Analysis 1.4; 4 studies, 2788 participants; low certainty evidence) (EMPA‐REG OUTCOME 2013; EMPA‐REG RENAL 2014; Kohan 2014; Yale 2013).
1.4. Analysis.
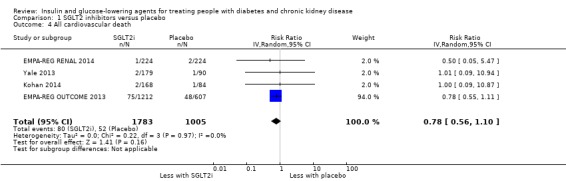
Comparison 1 SGLT2 inhibitors versus placebo, Outcome 4 All cardiovascular death.
Additionally, it is uncertain whether SGLT2 inhibitors have any effect on the risk of myocardial infarction (RR 0.63, 95% CI 0.30 to 1.34; I2 = 30%; Analysis 1.5; 4 studies, 2788 participants; very low certainty evidence; EMPA‐REG OUTCOME 2013; EMPA‐REG RENAL 2014;Kohan 2014; Yale 2013) or stroke (RR 0.96, 95% CI 0.63 to 1.48; I2 = 0%; Analysis 1.6) compared to placebo (5 studies, 2933 participants; very low certainty evidence) (EMPA‐REG OUTCOME 2013;EMPA‐REG RENAL 2014; Haneda 2016; Kohan 2014; Yale 2013).
1.5. Analysis.

Comparison 1 SGLT2 inhibitors versus placebo, Outcome 5 Myocardial infarction.
1.6. Analysis.
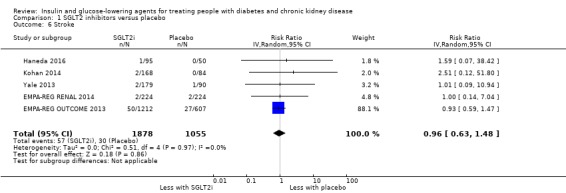
Comparison 1 SGLT2 inhibitors versus placebo, Outcome 6 Stroke.
DPP‐4 inhibitors
In people with an eGFR < 60 mL/min/1.73 m2 but not on dialysis (5897 participants), DPP‐4 inhibitors probably has little or no effect on the risk of cardiovascular death (RR 0.93, 95% CI 0.77 to 1.11; I2 = 0%; Analysis 2.4) compared to placebo (2 studies, 5897 participants; moderate certainty evidence) (SAVOR‐TIMI 53 2011; TECOS 2013).
2.4. Analysis.
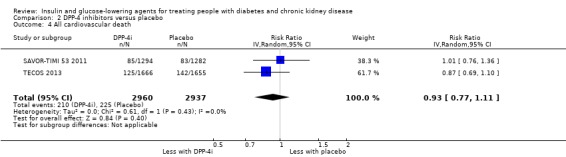
Comparison 2 DPP‐4 inhibitors versus placebo, Outcome 4 All cardiovascular death.
Additionally, in people with an eGFR < 60 mL/min/1.73 m2 inclusive of those with ESKD on dialysis, DPP‐4 inhibitors may have little or no effect on the risk of myocardial infraction (RR 1.08, 95% CI 0.88 to 1.33; I2 = 0%; Analysis 2.5) compared to placebo (4 studies, 6121 participants; low certainty evidence) (Chan 2008a; McGill 2013; SAVOR‐TIMI 53 2011; TECOS 2013).
2.5. Analysis.
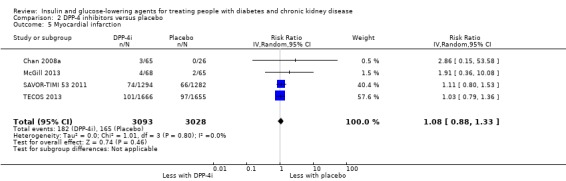
Comparison 2 DPP‐4 inhibitors versus placebo, Outcome 5 Myocardial infarction.
Similarly, in people with an eGFR < 60 mL/min/1.73 m2 but not on dialysis, DPP‐4 inhibitors may have little or no effect on the risk of stroke (RR 0.92, 95% CI 0.69 to 1.24; I2 = 0%; Analysis 2.6) compared to placebo (3 studies, 6030 participants; low certainty evidence) (McGill 2013; SAVOR‐TIMI 53 2011; TECOS 2013).
2.6. Analysis.
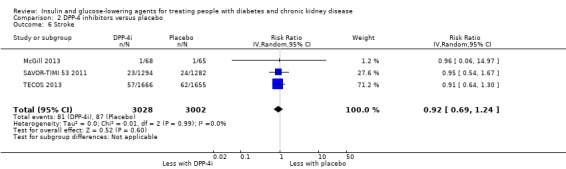
Comparison 2 DPP‐4 inhibitors versus placebo, Outcome 6 Stroke.
GLP‐1 agonists
LIRA‐RENAL 2016 reported macrovascular outcomes. In people with an eGFR of 30 to < 60 mL/min/1.73 m2 (279 participants), liraglutide was reported to have had little or no effect on the risk of myocardial infarction compared to placebo (0.98, 95% CI 0.06 to 15.49; P = 0.99; Analysis 3.4).
3.4. Analysis.
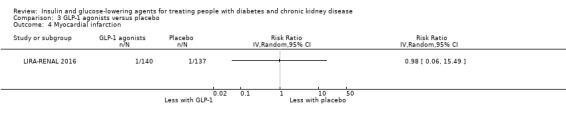
Comparison 3 GLP‐1 agonists versus placebo, Outcome 4 Myocardial infarction.
Sitagliptin versus glipizide
Arjona Ferreira 2013 reported macrovascular events (423 participants). In people with an eGFR < 60 mL/min/1.73 m2 but not on dialysis, sitagliptin was reported to have had little or no effect on the risk of myocardial infarction (RR 0.20, 95% CI 0.01 to 4.18; P = 0.30; Analysis 6.4), or stroke (RR 0.34, 95% CI 0.01 to 8.21; P = 0.50; Analysis 6.5) compared to glipizide.
6.4. Analysis.
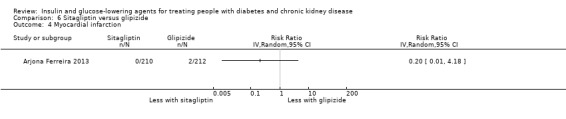
Comparison 6 Sitagliptin versus glipizide, Outcome 4 Myocardial infarction.
6.5. Analysis.
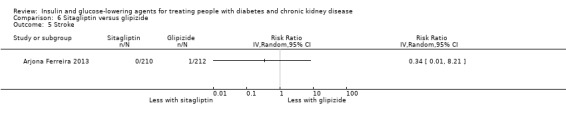
Comparison 6 Sitagliptin versus glipizide, Outcome 5 Stroke.
Aleglitazar versus pioglitazone
In people with an eGFR of 30 to < 60 mL/min/1.73 m2 (AleNephro 2014: 302 participants) aleglitazar was reported to have had little or no effect on the risk of cardiovascular death (RR 1.02, 95% CI 0.15 to 7.15; P = 0.98; Analysis 9.5), myocardial infarction (RR 0.34, 95% CI 0.01 to 8.28; P = 0.51; Analysis 9.6) or stroke (RR 0.34, 95% CI 0.01 to 8.28; P = 0.51; Analysis 9.7) compared to pioglitazone.
9.5. Analysis.
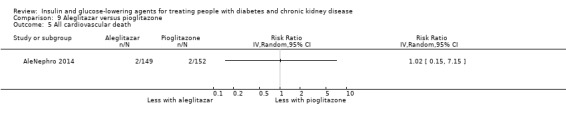
Comparison 9 Aleglitazar versus pioglitazone, Outcome 5 All cardiovascular death.
9.6. Analysis.
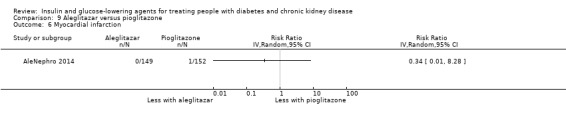
Comparison 9 Aleglitazar versus pioglitazone, Outcome 6 Myocardial infarction.
9.7. Analysis.
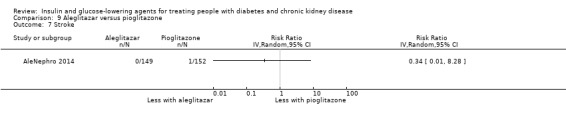
Comparison 9 Aleglitazar versus pioglitazone, Outcome 7 Stroke.
Other comparisons
Data for the following comparisons were not available: glinides versus no glinide use; glitazones versus placebo; vildagliptin versus sitagliptin; albiglutide versus sitagliptin; linagliptin compared voglibose; sitagliptin versus insulin; IP versus SC insulin; 0.5 U/kg versus 0.25 U/kg of insulin glulisine and glargine; and regular insulin versus insulin lispro.
Microvascular events (new or worsening kidney disease, or retinopathy)
SGLT2 inhibitors
In people with an eGFR of 30 to < 60 mL/min/1.73 m2 it is uncertain whether SGLT2 inhibitors have any effect on the risk of ESKD (RR 0.71, 95% CI 0.10 to 4.98; I2 = 0%; Analysis 1.21) and doubling of SCr (RR 0.96, 95% CI 0.49 to 1.88; I2 = 0%; Analysis 1.32) compared to placebo (700 participants; 2 studies; very low certainty evidence) (EMPA‐REG RENAL 2014; Kohan 2014). Additionally, SGLT2 inhibitors may reduce the risk of acute kidney injury (AKI) compared to placebo (RR 0.78, 95% CI 0.61 to 1.00; I2 = 0%; Analysis 1.31), although the 95% CI indicates there may not be a difference (4 studies; 2788 participants; low certainty evidence) (EMPA‐REG OUTCOME 2013; EMPA‐REG RENAL 2014; Kohan 2014; Yale 2013).
1.21. Analysis.
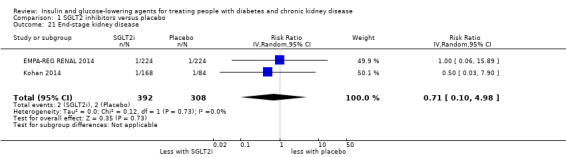
Comparison 1 SGLT2 inhibitors versus placebo, Outcome 21 End‐stage kidney disease.
1.32. Analysis.
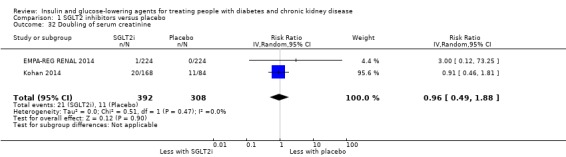
Comparison 1 SGLT2 inhibitors versus placebo, Outcome 32 Doubling of serum creatinine.
1.31. Analysis.
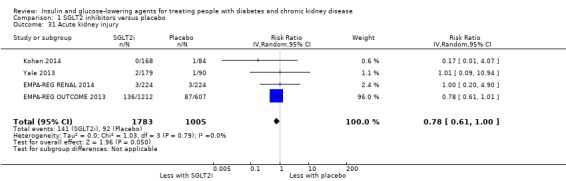
Comparison 1 SGLT2 inhibitors versus placebo, Outcome 31 Acute kidney injury.
DPP‐4 inhibitors
McGill 2013 reported AKI (133 participants). In people with an eGFR < 30 mL/min/1.73 m2, excluding dialysis, linagliptin was reported to have had little or no effect on the risk of AKI compared to placebo (RR 1.19, 95% CI 0.34 to 4.25; P = 0.78; Analysis 2.29).
2.29. Analysis.

Comparison 2 DPP‐4 inhibitors versus placebo, Outcome 29 Acute kidney injury.
TECOS 2013 reported worsening of retinopathy (3324 participants). In people with an eGFR of 30 to < 60 mL/min/1.73 m2, sitagliptin was reported to have had little or no effect on the risk of retinopathy compared to placebo (RR 0.84, 95% CI 0.62 to 1.14; P = 0.27; Analysis 2.18).
2.18. Analysis.
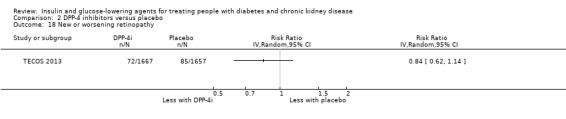
Comparison 2 DPP‐4 inhibitors versus placebo, Outcome 18 New or worsening retinopathy.
Vildagliptin versus sitagliptin
There was no reported deterioration of kidney function with either vildagliptin or sitagliptin in people with an eGFR < 30 mL/min/1.73 m2 including ESKD on HD (Kothny 2015: 148 participants).
Other comparisons
Data for the following comparisons were not available: GLP‐1 agonists versus placebo; glinides versus no glinides; glitazones versus placebo; sitagliptin versus glipizide; albiglutide versus sitagliptin; linagliptin versus voglibose; sitagliptin versus insulin; aleglitazar versus pioglitazone; IP versus SC insulin; 0.5 U/kg versus 0.25 U/kg of insulin glulisine and glargine; and regular insulin versus insulin lispro.
Safety
Hypoglycaemia
SGLT2 inhibitors
In people with an eGFR of 30 to < 60 mL/min/1.73 m2 SGLT2 inhibitors may have little or no effect on the risk of hypoglycaemia (RR 0.88, 95% CI 0.73 to 1.07; I2 = 0%; Analysis 1.19) compared to placebo (7 studies; 3086 participants; low certainty evidence; EMPA‐REG OUTCOME 2013; EMPA‐REG RENAL 2014; Haneda 2016; Kaku 2014; Kohan 2014; LANTERN 2015; Yale 2013). Similarly, it is uncertain whether SGLT2 inhibitors have any effect on the risk of hypoglycaemia requiring third party assistance (RR 0.47, 95% CI 0.17 to 1.28; I2 = 0%; Analysis 1.23) compared to placebo (3 studies, 845 participants; very low certainty evidence) (EMPA‐REG RENAL 2014; Haneda 2016; Kohan 2014).
1.19. Analysis.
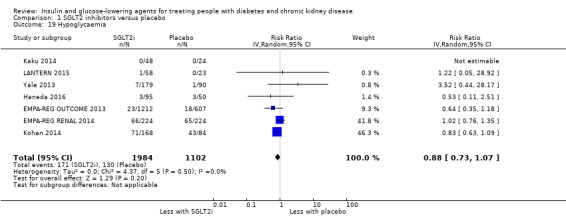
Comparison 1 SGLT2 inhibitors versus placebo, Outcome 19 Hypoglycaemia.
1.23. Analysis.
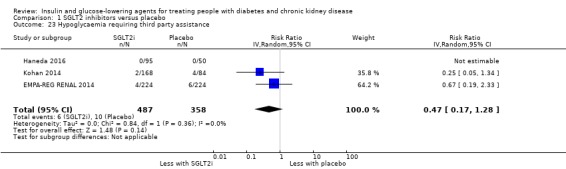
Comparison 1 SGLT2 inhibitors versus placebo, Outcome 23 Hypoglycaemia requiring third party assistance.
DPP‐4 inhibitors
In people with an eGFR < 60 mL/min/1.73 m2 inclusive of those on dialysis it is uncertain whether DPP‐4 inhibitors have any effect on the risk of hypoglycaemia (RR 1.07, 95% CI 0.80 to 1.42; I2 = 45%; Analysis 2.14; 11 studies, 1443 participants; very low certainty evidence) (Abe 2016; Barnett 2013; Chan 2008a; GUARD 2017; Ito 2011a; Laakso 2015; Lewin 2012; Lukashevich 2011; McGill 2013; Nowicki 2011; Yki‐Järvinen 2013) and hypoglycaemia requiring third party assistance (RR 0.72, 95% CI 0.25 to 2.03; I2 = 60%; Analysis 2.17; 6 studies; 3383 participants; very low certainty evidence) (Abe 2016; Chan 2008a; GUARD 2017; Lukashevich 2011; McGill 2013; SAVOR‐TIMI 53 2011) compared to placebo.
2.14. Analysis.
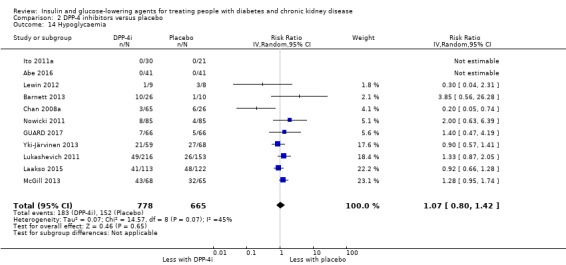
Comparison 2 DPP‐4 inhibitors versus placebo, Outcome 14 Hypoglycaemia.
2.17. Analysis.
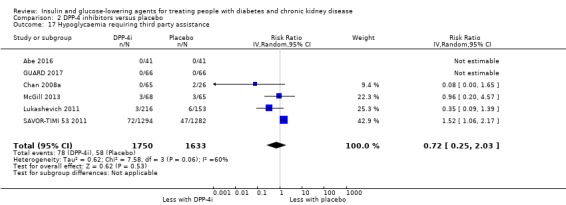
Comparison 2 DPP‐4 inhibitors versus placebo, Outcome 17 Hypoglycaemia requiring third party assistance.
GLP‐1 agonists
In people with an eGFR of 30 to < 60 mL/min/1.73 m2 (279 participants) LIRA‐RENAL 2016 reported liraglutide had little or no effect on the risk of hypoglycaemia to placebo (RR 0.79, 95% CI 0.51 to 1.21; P = 0.28; Analysis 3.14). Similarly, in people with ESKD on HD, Idorn 2013 reported liraglutide made little or no difference to the number of hypoglycaemic episodes compared to placebo (24 participants).
3.14. Analysis.
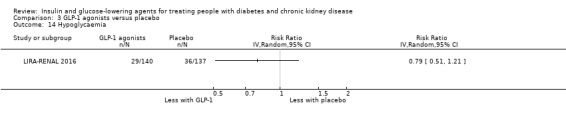
Comparison 3 GLP‐1 agonists versus placebo, Outcome 14 Hypoglycaemia.
Glinides
In people receiving HD (36 participants), Abe 2010 reported no episodes of hypoglycaemia or hypoglycaemia requiring third party assistance in those receiving mitiglinide compared to those not receiving mitiglinide.
Glitazones
In people receiving HD (70 participants) it is uncertain whether pioglitazone has an effect on the risk of hypoglycaemia (RR 0.95; 0.15 to 6.08; Analysis 4.11) compared to those not receiving pioglitazone/placebo (2 studies, 70 participants; very low certainty evidence) (Abe 2007; Pfutzner 2011).
4.11. Analysis.
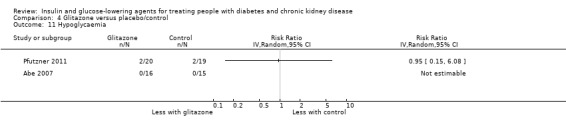
Comparison 4 Glitazone versus placebo/control, Outcome 11 Hypoglycaemia.
In one study reporting 'hypoglycaemia requiring third party assistance' in people receiving pioglitazone or no pioglitazone, there were no reported episodes in either group (Abe 2007: 31 participants; Analysis 4.12).
4.12. Analysis.
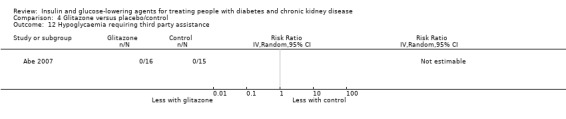
Comparison 4 Glitazone versus placebo/control, Outcome 12 Hypoglycaemia requiring third party assistance.
Sitagliptin versus glipizide
In people with an eGFR < 50 mL/min/1.73 m2 including those with ESKD on dialysis (551 participants), sitagliptin probably reduces the risk of hypoglycaemia by 60% (RR 0.40, 95% CI 0.23 to 0.69; I2 = 0%; Analysis 6.10) compared to glipizide (2 studies, 551 participants; moderate certainty evidence) (Arjona Ferreira 2013; Arjona Ferreira 2013a). However it is uncertain if sitagliptin has an effect on the risk of hypoglycaemia requiring third party assistance (RR 0.35, 95% CI 0.09 to 1.37; I2 = 8%) compared to glipizide (2 studies, 551 participants; very low certainty evidence) (Arjona Ferreira 2013; Arjona Ferreira 2013a; Analysis 6.12).
6.10. Analysis.
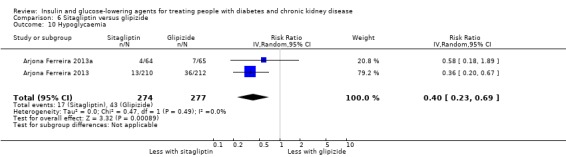
Comparison 6 Sitagliptin versus glipizide, Outcome 10 Hypoglycaemia.
6.12. Analysis.

Comparison 6 Sitagliptin versus glipizide, Outcome 12 Hypoglycaemia requiring third party assistance.
Vildagliptin versus sitagliptin
In people with an eGFR < 30 mL/min/1.73 m2 including ESKD on HD (148 participants), Kothny 2015 reported vildagliptin had little or no effect on the risk of hypoglycaemia compared to sitagliptin (RR 1.02, 95% CI 0.48 to 2.17; P = 0.96; Analysis 7.4).
7.4. Analysis.
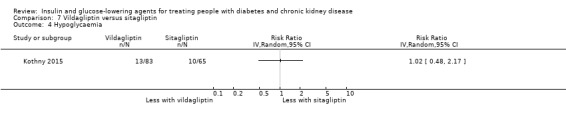
Comparison 7 Vildagliptin versus sitagliptin, Outcome 4 Hypoglycaemia.
Linagliptin versus voglibose
In one study comparing linagliptin to voglibose (78 participants) in people receiving HD (Mori 2016), both glucose‐lowering agents did not result in hypoglycaemia.
Aleglitazar versus pioglitazone
In people with an eGFR of 30 to < 60 mL/min/1.73 m2 (302 participants), AleNephro 2014 reported aleglitazar had little or no effect on the risk of hypoglycaemia (RR 1.34, 95% CI 0.81 to 2.23; P = 0.25; Analysis 9.13), and hypoglycaemia requiring third party assistance (RR 5.10, 95% CI 0.25 to 105.34; P = 0.29; Analysis 9.14) compared to pioglitazone.
9.13. Analysis.
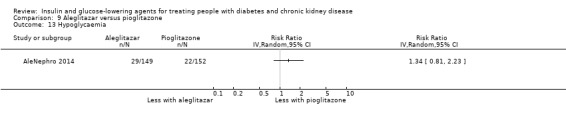
Comparison 9 Aleglitazar versus pioglitazone, Outcome 13 Hypoglycaemia.
9.14. Analysis.
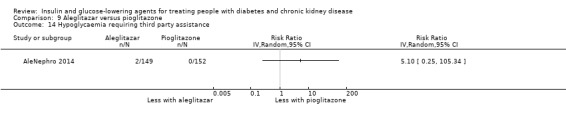
Comparison 9 Aleglitazar versus pioglitazone, Outcome 14 Hypoglycaemia requiring third party assistance.
Insulins
Baldwin 2012 and Diez 1987 reported on both hypoglycaemia and/or severe hypoglycaemia. In a hospital inpatient setting, an insulin regimen based on 0.25 U/kg compared to 0.5 U/kg had little to no effect on the rate of hypoglycaemia (defined as a blood glucose level < 3.89 mmol/L) ‐ 15% versus 30%, respectively; P = 0.08 (Analysis 10.1), or severe hypoglycaemia (defined as a blood glucose level < 2.78 mmol/L) – 1.8% versus 6%, respectively; P = 0.34 (Baldwin 2012: 107 participants; Analysis 10.2). In a study comparing IP to SC routes of administration of insulin, the rate of hypoglycaemia was two per month in all participants (Diez 1987: 22 participants).
10.1. Analysis.
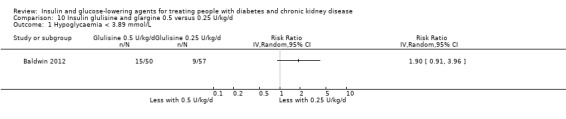
Comparison 10 Insulin glulisine and glargine 0.5 versus 0.25 U/kg/d, Outcome 1 Hypoglycaemia < 3.89 mmol/L.
10.2. Analysis.
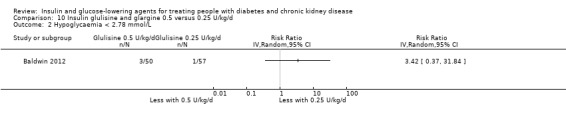
Comparison 10 Insulin glulisine and glargine 0.5 versus 0.25 U/kg/d, Outcome 2 Hypoglycaemia < 2.78 mmol/L.
Other comparisons
Data for the following comparisons were not available: albiglutide versus sitagliptin and sitagliptin versus insulin.
Discontinuation of medication due to adverse events
SGLT2 inhibitors
In people with an eGFR of 30 to < 60 mL/min/1.73 m2 (917 participants) it is uncertain whether SGLT2 inhibitors have any effect on the risk of discontinuation due to adverse events (RR 0.86, 95% CI 0.56 to 1.32; I2 = 14%; Analysis 1.20) compared to placebo (4 studies, 917 participants; very low certainty evidence) (EMPA‐REG RENAL 2014; Haneda 2016; Kaku 2014; Kohan 2014).
1.20. Analysis.
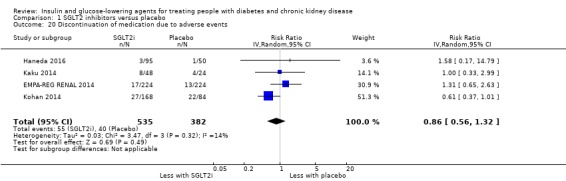
Comparison 1 SGLT2 inhibitors versus placebo, Outcome 20 Discontinuation of medication due to adverse events.
DPP‐4 inhibitors
In people with an eGFR < 60 mL/min/1.73 m2 inclusive of those with ESKD on dialysis, it is uncertain whether DPP‐4 inhibitors have any effect on the risk of discontinuation due to adverse events (RR 0.94, 95% CI 0.61 to 1.45; I2 = 0%; Analysis 2.15) compared to placebo (7 studies, 1257 participants; very low certainty evidence) (Chan 2008a; GUARD 2017; Laakso 2015 ;Lukashevich 2011; McGill 2013; Nowicki 2011; Yki‐Järvinen 2013).
2.15. Analysis.
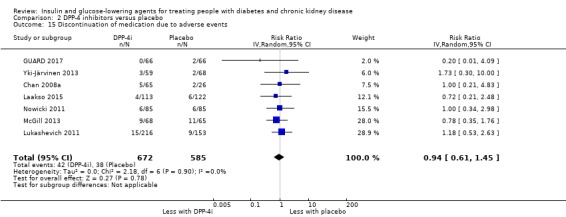
Comparison 2 DPP‐4 inhibitors versus placebo, Outcome 15 Discontinuation of medication due to adverse events.
GLP‐1 agonists
In people with ESKD comparing liraglutide to placebo, Idorn 2013 reported no discontinuations due to adverse events in the liraglutide or placebo group (24 participants). In people with an eGFR of 30 to < 60 mL/min/1.73 m2LIRA‐RENAL 2016 reported a 4.65 times higher risk of discontinuation due to adverse events with liraglutide compared to placebo (RR 4.65, 95% CI 1.62 to 13.31; P = 0.004; 279 participants; Analysis 3.15).
3.15. Analysis.
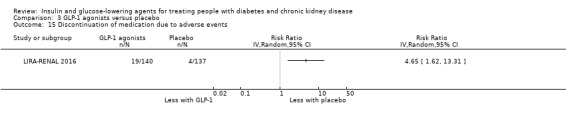
Comparison 3 GLP‐1 agonists versus placebo, Outcome 15 Discontinuation of medication due to adverse events.
Glinides
Abe 2010 compared mitiglinide to no mitiglinide in people on HD (36 participants). There were no reported increases in adverse effects such as hypoglycaemia, liver impairment, skin rash, fluid overload or oedema in either study group.
Glitazones
Abe 2010a (63 participants) compared pioglitazone to no treatment in people on HD and reported nobody withdrew prematurely from pioglitazone therapy because of an adverse event.
Sitagliptin versus glipizide
In people with an eGFR < 50 mL/min/1.73 m2 inclusive of those with ESKD on dialysis it is uncertain whether sitagliptin has an effect on the risk of discontinuation due to adverse events (RR 0.93, 95% CI 0.54 to 1.60; I2 = 0%; Analysis 6.11) compared to glipizide (2 studies, 551 participants; very low certainty evidence) (Arjona Ferreira 2013; Arjona Ferreira 2013a).
6.11. Analysis.
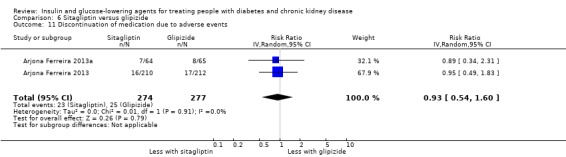
Comparison 6 Sitagliptin versus glipizide, Outcome 11 Discontinuation of medication due to adverse events.
Vildagliptin versus sitagliptin
In people with an eGFR < 30 mL/min/1.73 m2 including those with ESKD on HD (48 participants), Kothny 2015 reported vildagliptin had little or no effect on the risk of discontinuation due to adverse events compared to sitagliptin (RR 0.78, 95% CI 0.26 to 2.32; P = 0.66).
Linagliptin versus voglibose
In one study comparing linagliptin to voglibose (78 participants) in people receiving HD (Mori 2016), one patient receiving voglibose discontinued on the advice of the attending physician due to severe hyperglycaemia (blood glucose level: 30.2 mmol/L).
Other comparisons
Data for the following comparisons were not available: albiglutide versus sitagliptin; aleglitazar versus pioglitazone; sitagliptin versus insulin; IP versus SC insulin; 0.5 U/kg versus 0.25 U/kg of insulin glulisine and glargine; and regular insulin versus insulin lispro.
Other adverse events described by the study authors
SGLT2 inhibitors
Heart failure
In people with an eGFR of 30 to < 60 mL/min/1.73 m2 SGLT2 inhibitors probably reduce the risk of heart failure by 41% (RR 0.59, 95% CI 0.41 to 0.87; I2 = 0%; Analysis 1.7) compared to placebo (3 studies, 2519 participants; moderate certainty evidence) (EMPA‐REG OUTCOME 2013; EMPA‐REG RENAL 2014; Kohan 2014).
1.7. Analysis.

Comparison 1 SGLT2 inhibitors versus placebo, Outcome 7 Heart failure.
Hyperkalaemia
In people with an eGFR of 30 to < 60 mL/min/1.73 m2, SGLT2 inhibitors probably reduce the risk of hyperkalaemia by 42% (RR 0.58, 95% CI 0.42 to 0.81; I2 = 0%; Analysis 1.22) compared to placebo (4 studies, 2788 participants; moderate certainty evidence) (EMPA‐REG OUTCOME 2013; EMPA‐REG RENAL 2014; Kohan 2014; Yale 2013).
1.22. Analysis.
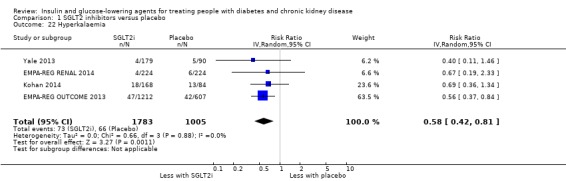
Comparison 1 SGLT2 inhibitors versus placebo, Outcome 22 Hyperkalaemia.
Hypovolaemia
In people with an eGFR of 30 to < 60 mL/min/1.73 m2 it is uncertain whether SGLT2 inhibitors have any effect on the risk of hypovolaemia (RR 1.07, 95% CI 0.62 to 1.84; I2 = 31%; Analysis 1.24) compared to placebo (6 studies, 3005 participants; very low certainty evidence) (EMPA‐REG OUTCOME 2013; EMPA‐REG RENAL 2014; Haneda 2016; Kaku 2014; Kohan 2014; Yale 2013).
1.24. Analysis.
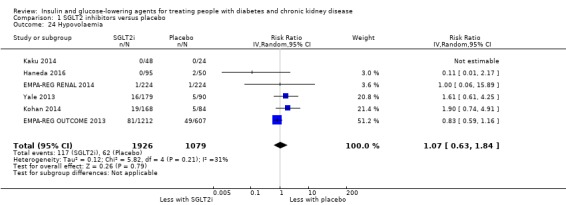
Comparison 1 SGLT2 inhibitors versus placebo, Outcome 24 Hypovolaemia.
Fractures
In people with an eGFR 30 to < 60 mL/min/1.73 m2, it is uncertain whether SGLT2 inhibitors have any effect on the risk of fracture (RR 0.81, 95% CI 0.31 to 2.10; I2 = 51%; Analysis 1.25) compared to placebo (5 studies, 2860 participants; very low certainty evidence) (EMPA‐REG OUTCOME 2013; EMPA‐REG RENAL 2014; Kaku 2014; Kohan 2014; Yale 2013).
1.25. Analysis.

Comparison 1 SGLT2 inhibitors versus placebo, Outcome 25 Fracture.
Diabetic ketoacidosis
In people with an eGFR 30 to < 60 mL/min/1.73 m2 it is uncertain whether SGLT2 inhibitors have any effect on the risk of diabetic ketoacidosis (RR 1.00, 95% CI 0.09 to 11.02; Analysis 1.27) compared to placebo (2 studies,1962 participants; very low certainty evidence) (EMPA‐REG OUTCOME 2013; Haneda 2016).
1.27. Analysis.
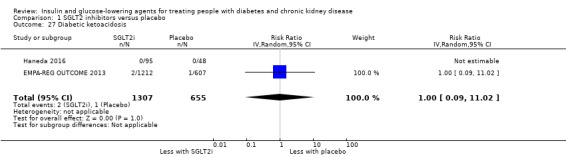
Comparison 1 SGLT2 inhibitors versus placebo, Outcome 27 Diabetic ketoacidosis.
Upper respiratory tract infection
In people with an eGFR 30 to < 60 mL/min/1.73 m2, it is uncertain whether SGLT2 inhibitors have any effect on the risk of upper respiratory tract infections (RR 0.79, 95% CI 0.43 to 1.44; I2 = 6%; Analysis 1.28) compared to placebo (2 studies, 593 participants; very low certainty evidence) (EMPA‐REG RENAL 2014; Haneda 2016).
1.28. Analysis.
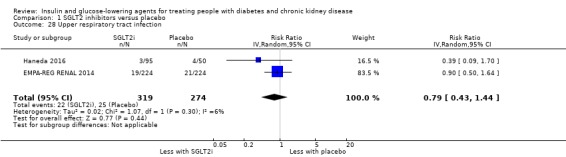
Comparison 1 SGLT2 inhibitors versus placebo, Outcome 28 Upper respiratory tract infection.
Urinary tract infection
In people with an eGFR 30 to < 60 mL/min/1.73 m2, SGLT2 inhibitors may have little or no effect on the risk of urinary tract infection (UTI) (RR 1.09, 95% CI 0.82 to 1.43; I2 = 0%; Analysis 1.29) compared to placebo (7 studies, 3086 participants; low certainty evidence) (EMPA‐REG OUTCOME 2013; EMPA‐REG RENAL 2014; Haneda 2016; Kaku 2014; Kohan 2014; LANTERN 2015; Yale 2013).
1.29. Analysis.
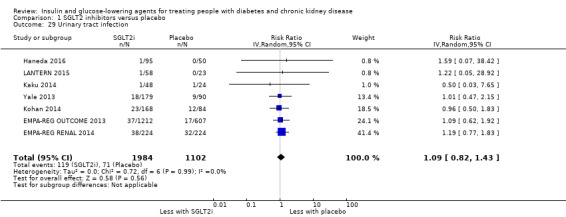
Comparison 1 SGLT2 inhibitors versus placebo, Outcome 29 Urinary tract infection.
Genital infections.
In a meta‐analysis of in people with eGFR 30 to < 60 mL/min/1.73 m2, SGLT2 inhibitors probably increase the risk of genital infections 2.5 times more (RR 2.50, 95% CI 1.52 to 4.11; I2 = 0%; Analysis 1.30) than placebo (7 studies, 3086 participants; moderate certainty evidence; EMPA‐REG OUTCOME 2013; EMPA‐REG RENAL 2014; Haneda 2016; Kaku 2014; Kohan 2014; LANTERN 2015; Yale 2013).
1.30. Analysis.
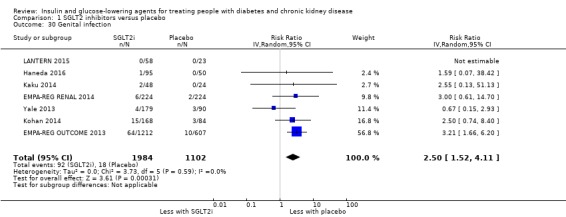
Comparison 1 SGLT2 inhibitors versus placebo, Outcome 30 Genital infection.
DPP‐4 inhibitors
Heart failure
In people with an eGFR < 60 mL/min/1.73 m2 inclusive of those with ESKD on dialysis, DPP‐4 inhibitors may have little or no effect on the risk of heart failure (RR 1.18, 95% CI 0.98 to 1.44; I2 = 0%; Analysis 2.7) compared to placebo (4 studies, 6115 participants; low certainty evidence; Chan 2008a; SAVOR‐TIMI 53 2011; TECOS 2013; Yki‐Järvinen 2013).
2.7. Analysis.

Comparison 2 DPP‐4 inhibitors versus placebo, Outcome 7 Heart failure.
Hyperkalaemia
In people with an eGFR < 50 mL/min/1.73 m2 inclusive of ESKD, DPP‐4 inhibitors may have little or no effect on hyperkalaemia (RR 1.30, 95% CI 0.81 to 2.08; I2 = 0%; Analysis 2.16) compared to placebo (2 studies, 502 participants; low certainty evidence) (Lukashevich 2011; McGill 2013).
2.16. Analysis.

Comparison 2 DPP‐4 inhibitors versus placebo, Outcome 16 Hyperkalaemia.
Peripheral oedema
In people with an eGFR < 50 mL/min/1.73 m2 inclusive of ESKD, DPP‐4 inhibitors may have little or no effect on the risk of peripheral oedema (0.84, 95% CI 0.58 to 1.22; I2 = 0%; Analysis 2.19) compared to placebo (4 studies, 763 participants; low certainty evidence) (Chan 2008a; Lukashevich 2011; McGill 2013; Nowicki 2011).
2.19. Analysis.
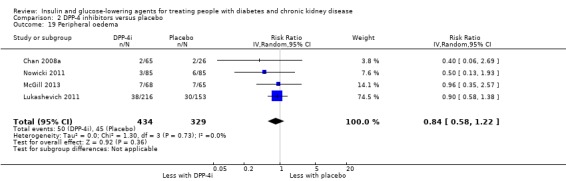
Comparison 2 DPP‐4 inhibitors versus placebo, Outcome 19 Peripheral oedema.
Liver impairment
In people with an eGFR < 50 mL/min/1.73 m2 inclusive of ESKD and people on HD, DPP‐4 inhibitors may have little or no effect on the risk of liver impairment (RR 1.42, 95% CI 0.26 to 7.64; Analysis 2.25) compared to placebo (2 studies, 451 participants; low certainty evidence) (Abe 2016; Lukashevich 2011).
2.25. Analysis.
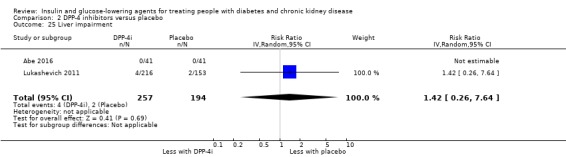
Comparison 2 DPP‐4 inhibitors versus placebo, Outcome 25 Liver impairment.
Malignancy
TECOS 2013 reported in people with an eGFR 30 to < 60 mL/min/1.73 m2 (3324 participants), sitagliptin had little or no effect on the risk of malignancy compared to placebo (RR 1.01, 95% CI 0.69 to 1.48; P = 0.94; Analysis 2.22).
2.22. Analysis.
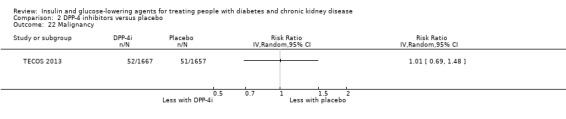
Comparison 2 DPP‐4 inhibitors versus placebo, Outcome 22 Malignancy.
Pancreatic cancer
Chan 2008a reported in people with an eGFR < 50 mL/min/1.73 m2 inclusive of ESKD on dialysis (91 participants), sitagliptin had little or no effect on the risk of pancreatic cancer compared to placebo (RR 1.23, 95% CI 0.05 to 29.19; Analysis 2.23).
2.23. Analysis.
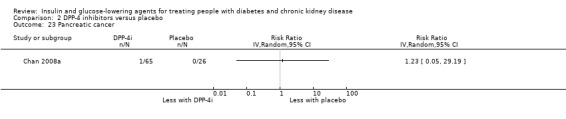
Comparison 2 DPP‐4 inhibitors versus placebo, Outcome 23 Pancreatic cancer.
Pancreatitis
In people with an eGFR < 50 mL/min/1.73 m2 inclusive of ESKD, it is uncertain whether DPP‐4 inhibitors have any effect on the risk of pancreatitis (RR 0.99, 95% CI 0.14 to 7.05; Analysis 2.24) compared to placebo (2 studies, 3693 participants; very low certainty evidence; Lukashevich 2011; TECOS 2013)
2.24. Analysis.
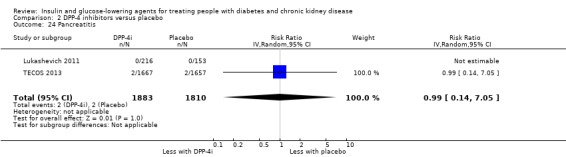
Comparison 2 DPP‐4 inhibitors versus placebo, Outcome 24 Pancreatitis.
Constipation
In people with an eGFR < 50 mL/min/1.73 m2 including people with ESKD on dialysis, it is uncertain whether DPP‐4 inhibitors have any effect on the risk of constipation (RR 0.79, 95% CI 0.09 to 6.84; I2 = 65%; Analysis 2.21) compared to placebo (2 studies, 224 participants; very low certainty evidence) (Chan 2008a; McGill 2013)
2.21. Analysis.
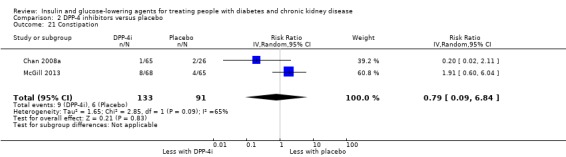
Comparison 2 DPP‐4 inhibitors versus placebo, Outcome 21 Constipation.
Diarrhoea
In people with an eGFR < 50 mL/min/1.73 m2 including people with ESKD, DPP‐4 inhibitors may have little or no effect on the risk of diarrhoea (RR 1.39, 95% CI 0.80 to 2.41; I2 = 0%; Analysis 2.20) compared to placebo (2 studies, 502 participants; low certainty evidence) (Lukashevich 2011; McGill 2013)
2.20. Analysis.
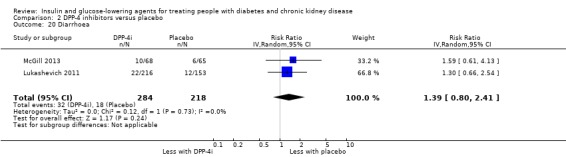
Comparison 2 DPP‐4 inhibitors versus placebo, Outcome 20 Diarrhoea.
Upper respiratory tract infection
In people with an eGFR < 50 mL/min/1.73 m2 inclusive of people with ESKD on dialysis, DPP‐4 inhibitors may have little or no effect on the risk of upper respiratory tract infections (RR 0.63, 95% CI 0.38 to 1.04; I2 = 0%; Analysis 2.26) compared to placebo (3 studies, 593 participants; low certainty evidence) (Chan 2008a; Lukashevich 2011; McGill 2013).
2.26. Analysis.
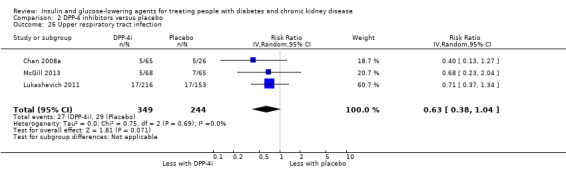
Comparison 2 DPP‐4 inhibitors versus placebo, Outcome 26 Upper respiratory tract infection.
Cellulitis
Ito 2011a reported no episodes of cellulitis in people on HD (60 participants) with either vildagliptin or placebo.
Urinary tract infection
In people with an eGFR < 50 mL/min/1.73 m2 inclusive of people with ESKD on dialysis, it is uncertain whether DPP‐4 inhibitors have any effect on UTI (RR 0.82, 95% CI 0.50 to 1.35; I2 = 0%; Analysis 2.28) compared to placebo (4 studies, 763 participants; very low certainty evidence) (Chan 2008a; Lukashevich 2011; McGill 2013; Nowicki 2011).
2.28. Analysis.
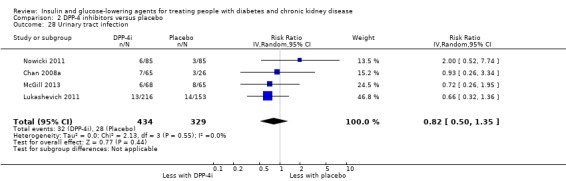
Comparison 2 DPP‐4 inhibitors versus placebo, Outcome 28 Urinary tract infection.
GLP‐1 agonists
LIRA‐RENAL 2016 (279 participants) reported in people with an eGFR of 30 to < 60 mL/min/1.73 m2, liraglutide had little or no effect on the risk of heart failure compared to placebo (RR 2.94, 95% CI 0.12 to 71.46; P = 0.51; Analysis 3.5). Additionally, compared to placebo, liraglutide was reported to have had a 2 times increased risk of GI disorders (RR 2.04, 95% CI 1.33 to 3.12; P = 0.001; Analysis 3.16), 4.9 times increased risk of nausea (RR 4.89, 95% CI 2.10 to 11.38; P = 0.0002; Analysis 3.19) and had an increased, reduced or no effect on the risk of vomiting (RR 2.45, 95% CI 0.79 to 7.71; P = 0.12; Analysis 3.17) pancreatitis compared to placebo (RR 2.94, 95% CI 0.12 to 71.46; P = 0.51; Analysis 3.18).
3.5. Analysis.

Comparison 3 GLP‐1 agonists versus placebo, Outcome 5 Heart failure.
3.16. Analysis.
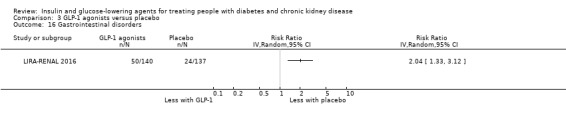
Comparison 3 GLP‐1 agonists versus placebo, Outcome 16 Gastrointestinal disorders.
3.19. Analysis.
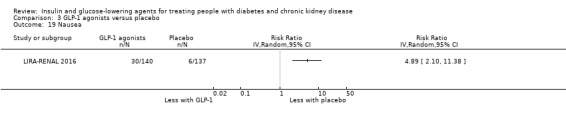
Comparison 3 GLP‐1 agonists versus placebo, Outcome 19 Nausea.
3.17. Analysis.
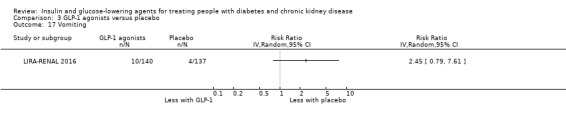
Comparison 3 GLP‐1 agonists versus placebo, Outcome 17 Vomiting.
3.18. Analysis.
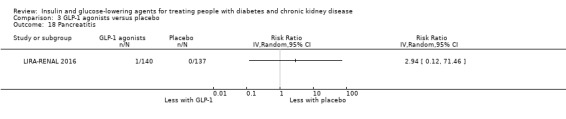
Comparison 3 GLP‐1 agonists versus placebo, Outcome 18 Pancreatitis.
Conversely Idorn 2013 reported in people with ESKD on dialysis (24 participants), nausea and vomiting occurred more frequently in liraglutide‐treated people with ESKD than in the other treatment arms (P < 0.04). Both nausea and vomiting were however temporary in most people and primarily related to initiation of treatment and dose escalation. There was more dyspepsia in the liraglutide group compared to the placebo group.
Glitazones
Heart failure
In people with an eGFR < 60 mL/min/1.73 m2 inclusive of those on HD, it is uncertain whether glitazones have any effect on the risk of heart failure (RR 0.34, 95% CI 0.01 to 8.13; Analysis 4.4) compared to the control group not receiving glitazones (2 studies, 123 participants; very low certainty evidence) (Abe 2010a; Jin 2007).
4.4. Analysis.

Comparison 4 Glitazone versus placebo/control, Outcome 4 Heart failure.
Peripheral oedema
In people on HD it is uncertain whether pioglitazone has an effect on the risk of peripheral oedema (RR 3.05, 95% CI 0.33 to 28.32; I2 = 0%; Analysis 4.13) compared to the control group not on pioglitazone (3 studies, 134 participants; very low certainty evidence) (Abe 2007; Abe 2008a; Abe 2010a).
4.13. Analysis.
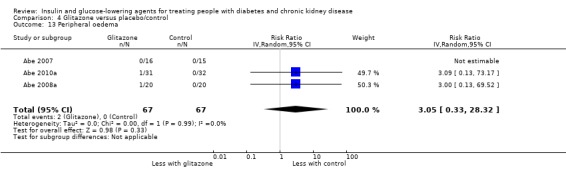
Comparison 4 Glitazone versus placebo/control, Outcome 13 Peripheral oedema.
Fluid overload
In people on HD (Abe 2007; Abe 2008a) (71 participants) receiving pioglitazone and in people on PD receiving rosiglitazone (Wong 2005) (52 participants) there were no episodes of fluid overload (Analysis 4.14).
4.14. Analysis.

Comparison 4 Glitazone versus placebo/control, Outcome 14 Fluid overload.
Fracture
In people on HD receiving pioglitazone (Abe 2008a: 40 participants), there were no reported fractures (Analysis 4.15).
4.15. Analysis.
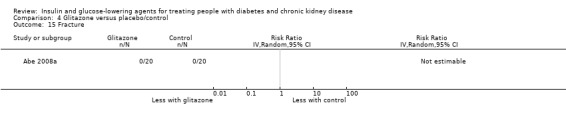
Comparison 4 Glitazone versus placebo/control, Outcome 15 Fracture.
Gastrointestinal disorders
Pfutzner 2011 reported in people on HD, pioglitazone had little or no effect on the risk of having a GI disorder (RR 0.51; 0.26 to 1.00; P = 0.05) compared to placebo (39 participants; Analysis 4.16).
4.16. Analysis.

Comparison 4 Glitazone versus placebo/control, Outcome 16 Gastrointestinal disorders.
Liver impairment
In people on HD receiving pioglitazone (Abe 2007; Abe 2008a; Abe 2010a) and in people on PD receiving rosiglitazone (Wong 2005), there were no episodes of liver impairment (186 participants). Additionally, in one study comparing pioglitazone to no pioglitazone in people with an eGFR of 15 to < 60 mL/min/1.73 m2 (Jin 2007: 60 participants), the aspartate aminotransferase concentrations increased slightly after six months in five people (1 with stage 3, and 4 with stage 4 CKD) treated with the pioglitazone. These concentrations subsequently return to normal values without specific treatment.
Glinides
Abe 2010 reported no episodes of peripheral oedema, fluid overload, skin rash or liver impairment amongst patient receiving HD (36 participants) in either the mitiglinide or control group.
Sitagliptin versus glipizide
In people with an eGFR < 50 mL/min/1.73 m2 including those receiving dialysis, it is uncertain whether sitagliptin has an effect on the risk of peripheral oedema (RR 0.71, 95% CI 0.11 to 4.80; I2 = 67%; Analysis 6.13), diarrhoea (RR 0.79, 95% CI 0.39 to 1.60; I2 = 0%; Analysis 6.16), or UTI (RR 1.29, 95% CI 0.24 to 6.94; I2 = 76%; Analysis 6.20) compared to glipizide (2 studies, 551 participants; very low certainty evidence) (Arjona Ferreira 2013; Arjona Ferreira 2013a). Additionally, sitagliptin may have little or no effect on the risk of upper respiratory tract infections (RR 0.60, 95% CI 0.31 to 1.17; I2 = 0%; Analysis 6.19) compared to glipizide (2 studies, 551 participants; low certainty evidence) (Arjona Ferreira 2013; Arjona Ferreira 2013a).
6.13. Analysis.
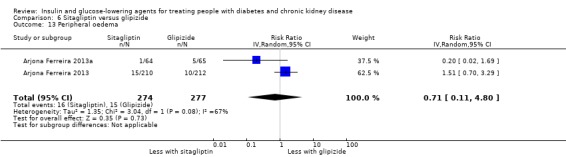
Comparison 6 Sitagliptin versus glipizide, Outcome 13 Peripheral oedema.
6.16. Analysis.
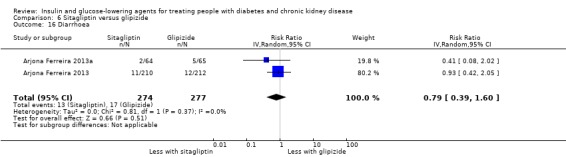
Comparison 6 Sitagliptin versus glipizide, Outcome 16 Diarrhoea.
6.20. Analysis.
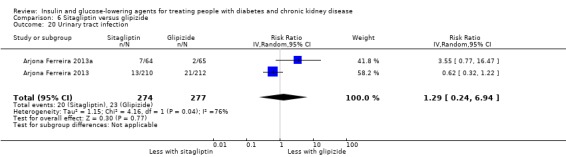
Comparison 6 Sitagliptin versus glipizide, Outcome 20 Urinary tract infection.
6.19. Analysis.

Comparison 6 Sitagliptin versus glipizide, Outcome 19 Upper respiratory tract infection.
Arjona Ferreira 2013a reported in people with ESKD on dialysis (129 participants), sitagliptin had little or no effect on the risk of fracture (RR 0.34, 95% CI 0.01 to 8.16; P = 0.50; Analysis 6.14), vomiting (RR 2.03, 95% CI 0.39 to 10.70; P = 0.40; Analysis 6.15), and cellulitis (RR 9.14, 95% CI 0.50 to 166.35; P = 0.14; Analysis 6.21) compared to glipizide.
6.14. Analysis.
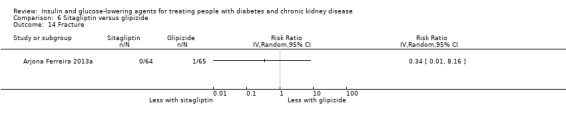
Comparison 6 Sitagliptin versus glipizide, Outcome 14 Fracture.
6.15. Analysis.

Comparison 6 Sitagliptin versus glipizide, Outcome 15 Vomiting.
6.21. Analysis.
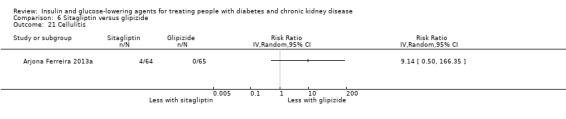
Comparison 6 Sitagliptin versus glipizide, Outcome 21 Cellulitis.
Arjona Ferreira 2013 reported in people with an eGFR < 50 mL/min/1.73 m2 but not on dialysis (422 participants) sitagliptin had little or no effect on the risk of malignancy (RR 7.07, 95% CI 0.37 to 135.97; P = 0.19; Analysis 6.17) and pancreatic cancer compared to glipizide (3.03, 95% CI 0.12 to 73.92; P = 0.50; Analysis 6.18).
6.17. Analysis.
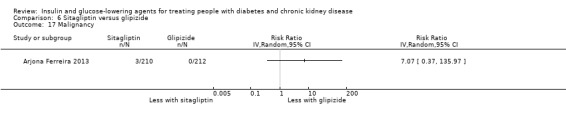
Comparison 6 Sitagliptin versus glipizide, Outcome 17 Malignancy.
6.18. Analysis.
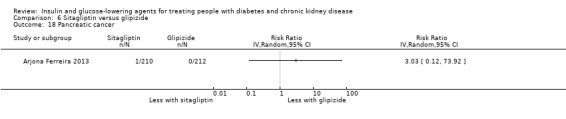
Comparison 6 Sitagliptin versus glipizide, Outcome 18 Pancreatic cancer.
Aleglitazar versus pioglitazone
AleNephro 2014 reported in people with an eGFR of 30 to < 60 mL/min/1.73 m2 (302 participants), aleglitazar had little or no effect on the risk of heart failure (RR 9.12, 95% CI 0.50 to 167.92; P = 0.14; Analysis 9.3), peripheral oedema (RR 0.61, 95% CI 0.36 to 1.05; P = 0.07; Analysis 9.15), fracture (RR 1.53, 95% CI 0.26 to 9.03; P = 0.64; Analysis 9.16), and malignancy (RR 3.06, 95% CI 0.32 to 29.09; P = 0.33; Analysis 9.17) compared to placebo.
9.3. Analysis.
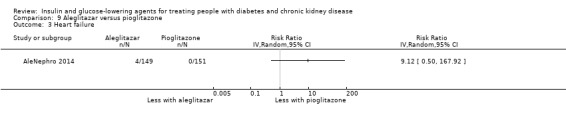
Comparison 9 Aleglitazar versus pioglitazone, Outcome 3 Heart failure.
9.15. Analysis.

Comparison 9 Aleglitazar versus pioglitazone, Outcome 15 Peripheral oedema.
9.16. Analysis.
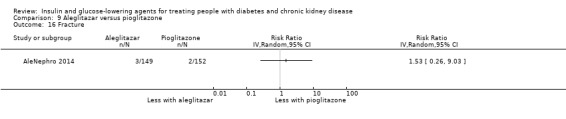
Comparison 9 Aleglitazar versus pioglitazone, Outcome 16 Fracture.
9.17. Analysis.
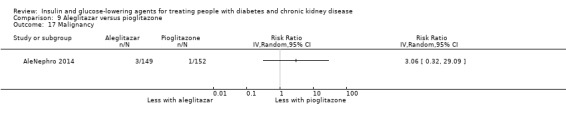
Comparison 9 Aleglitazar versus pioglitazone, Outcome 17 Malignancy.
Vildagliptin versus sitagliptin
Kothny 2015 reported in people with an eGFR < 30 mL/min/1.73 m2 including those receiving HD (148 participants), vildagliptin had little or no effect on the risk of peripheral oedema (RR 0.93, 95% CI 0.52 to 1.66; P = 0.81; Analysis 7.6) and liver impairment (0.16, 95% CI 0.01 to 3.22; P = 0.23) compared to sitagliptin (Analysis 7.8). The most common adverse events were peripheral oedema (which occurred at a similar frequency in the vildagliptin (23%) and sitagliptin (25%) groups). There were no episodes of pancreatitis in either group. Two people on sitagliptin had ALT elevations (one patient with ALT > 3 times the upper limit of normal in the context of a gastritis, one asymptomatic with ALT > 5 time the upper limit of normal); both events resolving on treatment. No liver enzyme elevations occurred in people on vildagliptin.
7.6. Analysis.

Comparison 7 Vildagliptin versus sitagliptin, Outcome 6 Peripheral oedema.
7.8. Analysis.
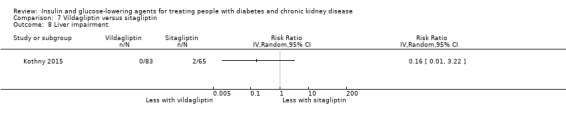
Comparison 7 Vildagliptin versus sitagliptin, Outcome 8 Liver impairment.
Insulin
Diez 1987 reported in people receiving PD (22 participants), the peritonitis incidence was 3.2 times higher in the intraperitoneal group compared to the subcutaneous insulin group.
Other comparisons
No further data concerning other adverse events were available for the following comparisons: sitagliptin versus insulin; linagliptin versus voglibose; and albiglutide versus sitagliptin.
Discussion
Summary of main results
There are currently 11 different classes of glucose‐lowering agents available for managing diabetes and CKD, each with varying mechanisms of action and adverse effect profiles. In this systematic review we aim to provide a contemporary comprehensive review of the efficacy and safety of glucose‐lowering agents in people with diabetes and CKD to inform clinical practice and policy. Consequently, we included all 11 different classes in our inclusion criteria, resulting in 14 different comparisons.
Evidence for the current use of glucose‐lowering agents in diabetes and CKD is of limited certainty. The majority of studies explored the efficacy and safety of SGLT2 inhibitors, mainly in people with an eGFR of 30 to < 60 mL/min/1.73 m2; DPP‐4 inhibitors and GLP‐1 agonists in people with an eGFR < 60 mL/min/1.73 m2; glitazones, mainly in people with ESKD on dialysis; and compared sitagliptin to glipizide in people with an eGFR < 60 mL/min/1.73 m2.
Compared to placebo, SGLT2 inhibitors probably reduce HbA1c (7 studies, 1092 participants: MD ‐0.29%, 95% CI ‐0.38 to ‐0.19% (‐3.2 mmol/mol, ‐4.2 to ‐2.2); I2 = 0%; moderate certainty evidence), FBG (5 studies, 855 participants: MD ‐0.48 mmol/L, 95% CI ‐0.78 to ‐0.19; I2 = 0%; moderate certainty evidence), systolic BP (7 studies, 1198 participants: MD ‐4.68 mmHg, 95% CI ‐6.69 to ‐2.68; I2 = 40%; moderate certainty evidence), diastolic BP (6 studies, 1142 participants: MD ‐1.72 mmHg, 95% CI ‐2.77 to ‐0.66; I2 = 0%; moderate certainty evidence), heart failure (3 studies, 2519 participants: RR 0.59, 95% CI 0.41 to 0.87; I2 = 0%; moderate certainty evidence) and hyperkalaemia (4 studies, 2788 participants: RR 0.58, 0.42 to 0.81; I2 = 0%; moderate certainty evidence); but increase genital infections (7 studies, 3086 participants: RR 2.50, 95% CI 1.52 to 4.11; I2 = 0%; moderate certainty evidence) and serum creatinine (4 studies, 848 participants: MD 3.82 μmol/L, 95% CI 1.45 to 6.19, ( 0.04 mg/dL, 0.02 to 0.07); I2 = 16%; moderate certainty evidence). SGLT2 inhibitors may reduce weight (5 studies, 1029 participants: MD ‐1.41 kg, 95% CI ‐1.8 to ‐1.02; I2 = 28%; low certainty evidence) and albuminuria (MD ‐8.14 mg/mmol creatinine, 95% CI ‐14.51 to ‐1.77 (‐71.89 mg/g creatinine, ‐128.17 to ‐15.60); I2 = 11%; low certainty evidence). SGLT2 inhibitors may have little or no effect on the risk of cardiovascular death, hypoglycaemia, AKI, and UTI (low certainty evidence). It is uncertain whether SGLT2 inhibitors have any effect on death (all causes), ESKD, hypovolaemia, fractures, diabetic ketoacidosis, and discontinuation due to adverse effects (very low certainty evidence).
Compared to placebo, DPP‐4 inhibitors may reduce HbA1c (7 studies, 867 participants: MD ‐0.62 %, 95% CI ‐0.85 to ‐0.39% (‐6.8 mmol/mol, ‐9.3 to ‐4.3); I2 = 59%) but may have little or no effect on FBG (low certainty evidence). DPP‐4 inhibitors probably have little or no effect on cardiovascular death (2 studies, 5897 participants: RR 0.93, 95% CI 0.77 to 1.11; I2 = 0%) and weight (2 studies, 210 participants: MD 0.16 kg, 95% CI ‐0.58 to 0.90; I2 = 29%; moderate certainty evidence). Compared to placebo, DPP‐4 inhibitors may have little or no effect on heart failure, upper respiratory tract infection and liver impairment (low certainty evidence). Compared to placebo, it is uncertain whether DPP‐4 inhibitors have any effect on eGFR, hypoglycaemia, pancreatitis, pancreatic cancer, and discontinuation due to adverse effects (very low certainty evidence).
Compared to placebo, GLP‐1 agonists probably reduce HbA1c (2 studies, 283 participants: MD ‐0.53%, 95% CI ‐1.01 to ‐0.06 (‐5.8 mmol/mol, ‐11.0 to ‐0.7); I2 = 41%; moderate certainty evidence) and may reduce weight (low certainty evidence). GLP‐1 agonists may have little or no effect on hypoglycaemia and discontinuation due to adverse effects (low certainty evidence). It is uncertain whether GLP‐1 agonists reduce FBG, increase GI symptoms, or alter the risk of pancreatitis (very low certainty evidence).
Compared to placebo, it is uncertain whether glitazones have any effect on HbA1c, FBG, death (all causes), weight, and risk of hypoglycaemia (very low certainty evidence).
Compared to glipizide, sitagliptin probably reduces hypoglycaemia (2 studies, 551 participants: RR 0.40, 95% CI 0.23 to 0.69; I2 = 0%; moderate certainty evidence). Compared to glipizide, sitagliptin may have little or no effect on HbA1c, FBG, and weight (low certainty evidence). Compared to glipizide, it is uncertain if sitagliptin has any effect on death (all causes) and discontinuation due to adverse effects (very low certainty).
For types, dosages or modes of administration of insulin and other head‐to‐head comparisons only individual studies were available so no conclusions could be made.
This review highlights the lack of high certainty evidence to guide clinical decision making for glucose‐lowering in people with diabetes and CKD.
Overall completeness and applicability of evidence
In some studies, outcomes were not reported or were not in a suitable format to be used in meta‐analyses. Despite attempting to contact authors for outcome data not reported in studies, the majority of unpublished data were not obtained. In addition, many of the studies from China did not have the authors' contact details on the report, negating the ability to contact authors with data queries. Fourteen studies are still awaiting classification (Characteristics of studies awaiting classification) and three studies are currently ongoing (Characteristics of ongoing studies). Once further data becomes available, the review will be updated.
For completeness, studies including troglitazone (Mohideen 2005) and aleglitazar (AleNephro 2014) were included in our systematic review. Troglitazone was withdrawn from the market by the FDA in 2000 due to the risk of liver failure and hepatotoxicity (FDA 2000), and the development of aleglitazar was halted by Roche in 2013 due to concerns about its safety and efficacy (ALECARDIO 2013). The data from these studies were not incorporated into any meta‐analyses, and did not affect any treatment estimates in our results.
Out of all the contemporary glucose‐lowering agent classes, evidence is most certain for the glucose‐lowering efficacy of SGLT2 inhibitors and GLP‐1 agonists in diabetes and CKD. Additionally, SGLT2 inhibitors probably reduce BP, heart failure and hyperkalaemia but probably increase serum creatinine and slightly reduce eGFR, and increase the rate of genital infections. Evidence for the safety profile of GLP‐1 agonists is of low to very low certainty.
Consequently, evidence to guide clinical decision making and choice of glucose‐lowering agents in diabetes and CKD is lacking, and more studies are required to address this evidence gap.
Quality of the evidence
The certainty of the evidence for most outcomes examined is low to very low according to GRADE (GRADE 2008). The main contributors to the low certainty of evidence are: the majority of studies had a high risk of funding bias; many studies had attrition bias; the majority of studies had an unclear risk of detection bias; the imprecision of results with wide CIs; and the absence of quantitative data for some outcomes for several glucose‐lowering agent classes.
Potential biases in the review process
Key strengths of the review process are the pre‐published peer‐reviewed protocol, a systematic search of electronic databases and the methodological soundness of the data extraction, analysis and assessment of the risk of bias. Two independent review authors assessed the majority of the studies in English. Two other independent reviewers assessed the majority of the studies in Chinese. Any differences in interpretation were discussed with disagreements resolved by a fifth author. None of the authors assessing the studies or performing data extraction had any conflicts of interest to declare. A potential weakness is that despite a comprehensive search through appropriate databases, we cannot exclude the possibility that studies with negative findings remain unpublished.
Agreements and disagreements with other studies or reviews
To our knowledge, this is the first contemporary systematic review comprehensively examining the safety and efficacy of all glucose‐lowering agents including insulin in diabetes and CKD.
Our systematic review provides the first meta‐analysis of SGLT2 inhibitors amongst people with diabetes and CKD. We found that SGLT2 inhibitors probably reduce HbA1c, FBG, systolic and diastolic BP, heart failure, and hyperkalaemia compared to placebo. This is broadly consistent with systematic reviews of the efficacy and safety of SGLT2 inhibitors amongst people with diabetes (Shyangdan 2016; Storgaard 2016; Zaccardi 2016). Recent literature suggests that SGLT2 inhibitors may be renoprotective mechanistically (Andrianesis 2016; Scheen 2015, Zanoli 2015) with the most compelling clinical trial evidence coming from EMPA‐REG OUTCOME 2013 (included in our systematic review and meta‐analysis). In EMPA‐REG OUTCOME 2013, empagliflozin slowed the progression of kidney disease and reduced the rates of kidney events such as doubling of SCr, incident or worsening kidney disease, and the need for renal replacement therapy compared to placebo. In contrast, systematic reviews of canagliflozin in diabetes and CKD (Patel 2016) and SGTL2 inhibitors in diabetes (Storgaard 2016) report a small decline in eGFR and small rise in serum creatinine. The systematic review by Patel 2016 also reported an increase in kidney impairment and SCr but a reduction in eGFR and albuminuria with canagliflozin. We found that SGLT2 inhibitors probably increase serum creatinine and reduce eGFR, and may reduce albuminuria. However there may be little or no effect of SGLT2 inhibitors on the risk of AKI, and it is uncertain whether SGLT2 inhibitors have any effect on ESKD. Furthermore, the natriuretic effect of SGLT2 inhibitors (Vallon 2007) and resultant increase in serum creatinine concentration, has to be considered when interpreting the effect of SGLT2 inhibitors on albuminuria (measured by the urine albumin:creatinine ratio) and eGFR (derived from serum creatinine). Thus, the effect of SGLT2 inhibitors on kidney function in people with diabetes and CKD remains unclear.
In our meta‐analysis, SGLT2 inhibitors probably increase the risk of genital infections compared to placebo. This is consistent with previous meta‐analyses of the safety of SGLT2 inhibitors amongst people with type 2 diabetes (Storgaard 2016; Wu 2016; Zaccardi 2016). Additionally, we found that SGLT2 inhibitors may reduce weight and may have little or no effect on the risk of UTI and hypoglycaemia. Other meta‐analyses of studies amongst people with diabetes report a beneficial effect of SGLT2 inhibitors on weight, an increase in UTI, and a variable effect on hypoglycaemia (Storgaard 2016; Wu 2016; Zaccardi 2016). Due to recent concerns about euglycaemic diabetic ketoacidosis and fractures with SGLT2 inhibitors, we examined these outcomes with the rationale that the presence of CKD may increase the risk of both. The effect of SGLT2 inhibitors on either outcome was uncertain. Other meta‐analyses amongst people with diabetes have been similarly inconclusive (Zaccardi 2016) or have not noted an increased risk of diabetic ketoacidosis (Storgaard 2016) and fractures with SGLT2 inhibitors (Ruanpeng 2016; Wu 2016). Thus these risks in people with diabetes and CKD remain unclear.
In our review, DPP‐4 inhibitors probably have little or no effect on the risk of cardiovascular death and weight compared to placebo. While other systematic reviews examining the efficacy and safety of DPP‐4 inhibitors amongst people with diabetes and CKD have not evaluated cardiovascular death as an outcome, Cheng 2014 confirmed our findings of no effect of DPP‐4 inhibitors on weight. We are only able to report the effect of DPP‐4 inhibitors on glycaemic control, kidney function, BP, lipid profile, death (all causes), hypoglycaemia, and discontinuation due to adverse effects, with a low degree of certainty (GRADE 2008). The systematic review by Cheng 2014 also reports low certainty evidence for most outcomes according to GRADE (GRADE 2008). Other systematic reviews report that DPP‐4 inhibitors reduced HbA1c (Singh‐Franco 2016; Walker 2017) and either increased or reduced the risk of hypoglycaemia compared to placebo (Singh‐Franco 2016; Walker 2017) without grading the certainty of evidence. As DPP‐4 inhibitors have been linked to pancreatic cancer (Elashoff 2011), pancreatitis (Rehman 2017), and heart failure (Xu 2017) amongst people with diabetes, we explored these outcomes in our systematic review. These outcomes have not been explored in other meta‐analyses of DPP‐4 use in people with diabetes and CKD (Cheng 2014; Singh‐Franco 2016; Walker 2017). Unfortunately, evidence for the effect of DPP‐4 inhibitors on these outcomes is of low to very low certainty (GRADE 2008).
Compared to glipizide, we found that sitagliptin probably reduces the risk of hypoglycaemia. This is also reported in several other systematic reviews (Cheng 2014; Singh‐Franco 2016).
We report that GLP‐1 agonists probably reduce HbA1c by 0.53% (5.8 mmol/mol) compared to placebo (‐0.53%, 95% CI ‐1.01 to ‐0.06 (‐5.8 mmol/mol, ‐11.0 to ‐0.7); I2 = 41%). This effect size seems slightly blunted amongst people with diabetes and CKD in comparison to the effects reported by meta‐analyses of people with diabetes only (Orme 2017). However, direct comparisons are not completely valid as head‐to‐head comparisons have not been undertaken. The HbA1c lowering effect seen in our review is comparable to that of a meta‐analysis examining the effect of incretins in CKD (Howse 2016). However, this meta‐analysis (Howse 2016) did not do a sub‐analysis of the effects of GLP‐1 agonists on the other outcomes, but rather pooled GLP‐1 agonist data with DPP‐4 inhibitor data.
We are unable to report the efficacy and safety of glitazones in diabetes and CKD for any outcome with a moderate to high degree of certainty (GRADE 2008). To our knowledge, there are no other systematic reviews examining glitazones in diabetes and CKD. Guidelines and consensus statement recommendations for the management of co‐morbid diabetes and CKD acknowledge this lack of evidence (ERBP 2015; Tuttle 2014). The American Diabetes Association concludes that glitazones should generally be avoided in diabetes and CKD due to adverse effects such as refractory fluid retention, hypertension, and increased fracture risk (Tuttle 2014). The European Renal Best Practice Group guidelines do not make a recommendation, citing that glitazones are under regular scrutiny, are not available on most markets, and that public access to the entire body of information for this drug class may not be available (ERBP 2015).
There is also little evidence to evaluate the safety and efficacy of insulin and to guide choice of, type, dosing and optimal route of administration of insulin. The most widely quoted recommendations for insulin dosing in CKD are from the American College of Physicians. They suggest a reduction in insulin dosage of 25% for an eGFR between 10 to 50 mL/min/1.73 m2 and of 50% if the eGFR is < 10 mL/min/1.73 m2 (Bennett 1983). However, insulin dose reduction with the development of CKD is likely to be more complex and has not been studied. Several case series of people with diabetes and CKD requiring insulin, have demonstrated a variable reduction in insulin requirements with one series demonstrating a linear correlation between CrCl and insulin dosage (Charpentier 2000). Secondly, the dose reduction requirements may differ for different types of insulin. In a two‐way, double‐blind cross‐over euglycaemic (5 mmol/L) glucose clamp study of people with type 1 diabetes with and without CKD, regular and lispro insulin levels were higher in CKD (Rave 2001). Despite this the metabolic response to regular insulin but not to insulin lispro (assessed by the maximal glucose infusion rate) was reduced (Rave 2001) highlighting the fact that dose reduction for different insulins may not be uniform.
Authors' conclusions
Implications for practice.
Currently, there is a lack of high certainty evidence to guide the use of glucose‐lowering agents in people with diabetes and CKD.
SGLT2 inhibitors and GLP‐1 agonists are probably efficacious in reducing HbA1c in diabetes and CKD with SGLT2 inhibitors probably having the added benefits of reducing BP, heart failure, and hyperkalaemia. This must be balanced with the probable increase in genital infections and serum creatinine, and mild reduction in eGFR. Additionally, the effect of SGLT2 inhibitors on the risk of ESKD and the safety profile of GLP‐1 agonists is uncertain.
DPP‐4 inhibitors may be efficacious in reducing HbA1c in diabetes and CKD. Sitagliptin probably has a lower risk of hypoglycaemia compared to glipizide.
The efficacy and safety of other classes of glucose‐lowering agents is unclear.
More evidence is required to help guide choice of agents for glucose‐lowering in diabetes and CKD.
Implications for research.
The lack of high certainty evidence reviewed, highlights the urgent need for more large‐scale RCTs of glucose‐lowering agents in people with both diabetes and CKD.
Given that the majority of moderate certainty evidence concerns the glucose‐lowering efficacy of SGLT2 inhibitors and GLP‐1 agonists in diabetes and CKD, the safety profile of both classes need further study. Specifically, the effects of SGLT2 inhibitors on kidney function and the overall safety profile of GLP‐1 agonists need to be characterised.
Additionally, as there is low certainty evidence for the efficacy of DPP‐4 inhibitors in glucose‐lowering, larger double‐blind RCTs are warranted to confirm their glucose‐lowering efficacy and characterise their safety profile people with diabetes and CKD.
Finally, appropriately blinded RCTs comparing different glucose‐lowering agents to sulphonylureas, metformin, and insulin are now required to clarify the place of the newer and older classes of glucose‐lowering agents in treating people with diabetes and CKD. In particular, given that insulin is widely used as a glucose‐lowering agent in CKD, especially in moderate to severe disease, further studies are required to help guide insulin dosing, ascertain the safety and efficacy of various insulin types (including insulin analogues), and ascertain the safety and efficacy of various modalities of insulin delivery – especially subcutaneous multiple dose injections, subcutaneous continuous infusion of insulin, and intraperitoneal insulin in PD.
History
Protocol first published: Issue 8, 2015 Review first published: Issue 9, 2018
| Date | Event | Description |
|---|---|---|
| 6 August 2015 | Amended | Search strategies for MEDLINE, EMBASE & CENTRAL revised. |
Acknowledgements
We wish to thank Cochrane Kidney and Transplant. We also thank the referees for their comments and feedback during the preparation of this manuscript. We also want to thank Boehringer Ingelheim, Astra Zeneca, Janssen Research & Development, LLC for re‐analysing their trials and providing additional data.
Appendices
Appendix 1. Electronic search strategies
| Database | Search terms |
| CENTRAL |
|
| MEDLINE |
|
| EMBASE |
|
Appendix 2. Risk of bias assessment tool
| Potential source of bias | Assessment criteria |
|
Random sequence generation Selection bias (biased allocation to interventions) due to inadequate generation of a randomised sequence |
Low risk of bias: Random number table; computer random number generator; coin tossing; shuffling cards or envelopes; throwing dice; drawing of lots; minimization (minimization may be implemented without a random element, and this is considered to be equivalent to being random). |
| High risk of bias: Sequence generated by odd or even date of birth; date (or day) of admission; sequence generated by hospital or clinic record number; allocation by judgement of the clinician; by preference of the participant; based on the results of a laboratory test or a series of tests; by availability of the intervention. | |
| Unclear: Insufficient information about the sequence generation process to permit judgement. | |
|
Allocation concealment Selection bias (biased allocation to interventions) due to inadequate concealment of allocations prior to assignment |
Low risk of bias: Randomisation method described that would not allow investigator/participant to know or influence intervention group before eligible participant entered in the study (e.g. central allocation, including telephone, web‐based, and pharmacy‐controlled, randomisation; sequentially numbered drug containers of identical appearance; sequentially numbered, opaque, sealed envelopes). |
| High risk of bias: Using an open random allocation schedule (e.g. a list of random numbers); assignment envelopes were used without appropriate safeguards (e.g. if envelopes were unsealed or non‐opaque or not sequentially numbered); alternation or rotation; date of birth; case record number; any other explicitly unconcealed procedure. | |
| Unclear: Randomisation stated but no information on method used is available. | |
|
Blinding of participants and personnel Performance bias due to knowledge of the allocated interventions by participants and personnel during the study |
Low risk of bias: No blinding or incomplete blinding, but the review authors judge that the outcome is not likely to be influenced by lack of blinding; blinding of participants and key study personnel ensured, and unlikely that the blinding could have been broken. |
| High risk of bias: No blinding or incomplete blinding, and the outcome is likely to be influenced by lack of blinding; blinding of key study participants and personnel attempted, but likely that the blinding could have been broken, and the outcome is likely to be influenced by lack of blinding. | |
| Unclear: Insufficient information to permit judgement | |
|
Blinding of outcome assessment Detection bias due to knowledge of the allocated interventions by outcome assessors. |
Low risk of bias: No blinding of outcome assessment, but the review authors judge that the outcome measurement is not likely to be influenced by lack of blinding; blinding of outcome assessment ensured, and unlikely that the blinding could have been broken. |
| High risk of bias: No blinding of outcome assessment, and the outcome measurement is likely to be influenced by lack of blinding; blinding of outcome assessment, but likely that the blinding could have been broken, and the outcome measurement is likely to be influenced by lack of blinding. | |
| Unclear: Insufficient information to permit judgement | |
|
Incomplete outcome data Attrition bias due to amount, nature or handling of incomplete outcome data. |
Low risk of bias: No missing outcome data; reasons for missing outcome data unlikely to be related to true outcome (for survival data, censoring unlikely to be introducing bias); missing outcome data balanced in numbers across intervention groups, with similar reasons for missing data across groups; for dichotomous outcome data, the proportion of missing outcomes compared with observed event risk not enough to have a clinically relevant impact on the intervention effect estimate; for continuous outcome data, plausible effect size (difference in means or standardized difference in means) among missing outcomes not enough to have a clinically relevant impact on observed effect size; missing data have been imputed using appropriate methods. |
| High risk of bias: Reason for missing outcome data likely to be related to true outcome, with either imbalance in numbers or reasons for missing data across intervention groups; for dichotomous outcome data, the proportion of missing outcomes compared with observed event risk enough to induce clinically relevant bias in intervention effect estimate; for continuous outcome data, plausible effect size (difference in means or standardized difference in means) among missing outcomes enough to induce clinically relevant bias in observed effect size; ‘as‐treated’ analysis done with substantial departure of the intervention received from that assigned at randomisation; potentially inappropriate application of simple imputation. | |
| Unclear: Insufficient information to permit judgement | |
|
Selective reporting Reporting bias due to selective outcome reporting |
Low risk of bias: The study protocol is available and all of the study’s pre‐specified (primary and secondary) outcomes that are of interest in the review have been reported in the pre‐specified way; the study protocol is not available but it is clear that the published reports include all expected outcomes, including those that were pre‐specified (convincing text of this nature may be uncommon). |
| High risk of bias: Not all of the study’s pre‐specified primary outcomes have been reported; one or more primary outcomes is reported using measurements, analysis methods or subsets of the data (e.g. subscales) that were not pre‐specified; one or more reported primary outcomes were not pre‐specified (unless clear justification for their reporting is provided, such as an unexpected adverse effect); one or more outcomes of interest in the review are reported incompletely so that they cannot be entered in a meta‐analysis; the study report fails to include results for a key outcome that would be expected to have been reported for such a study. | |
| Unclear: Insufficient information to permit judgement | |
|
Other bias Bias due to problems not covered elsewhere in the table |
Low risk of bias: The study appears to be free of other sources of bias. |
| High risk of bias: Had a potential source of bias related to the specific study design used; stopped early due to some data‐dependent process (including a formal‐stopping rule); had extreme baseline imbalance; has been claimed to have been fraudulent; had some other problem. | |
| Unclear: Insufficient information to assess whether an important risk of bias exists; insufficient rationale or evidence that an identified problem will introduce bias. |
Data and analyses
Comparison 1. SGLT2 inhibitors versus placebo.
| Outcome or subgroup title | No. of studies | No. of participants | Statistical method | Effect size |
|---|---|---|---|---|
| 1 HbA1c | 7 | 1092 | Mean Difference (IV, Random, 95% CI) | ‐0.29 [‐0.38, ‐0.19] |
| 2 Fasting blood glucose | 5 | 855 | Mean Difference (IV, Random, 95% CI) | ‐0.48 [‐0.78, ‐0.19] |
| 3 Death (all causes) | 5 | 2933 | Risk Ratio (IV, Random, 95% CI) | 0.78 [0.60, 1.02] |
| 4 All cardiovascular death | 4 | 2788 | Risk Ratio (IV, Random, 95% CI) | 0.78 [0.56, 1.10] |
| 5 Myocardial infarction | 4 | 2788 | Risk Ratio (IV, Random, 95% CI) | 0.63 [0.30, 1.34] |
| 6 Stroke | 5 | 2933 | Risk Ratio (IV, Random, 95% CI) | 0.96 [0.63, 1.48] |
| 7 Heart failure | 3 | 2519 | Risk Ratio (IV, Random, 95% CI) | 0.59 [0.41, 0.87] |
| 8 Weight | 5 | 1029 | Mean Difference (IV, Random, 95% CI) | ‐1.41 [‐1.80, ‐1.02] |
| 9 eGFR [mL/min/1.73 m2] | 4 | 848 | Mean Difference (IV, Random, 95% CI) | ‐1.85 [‐2.76, ‐0.94] |
| 10 Systolic blood pressure | 7 | 1198 | Mean Difference (IV, Random, 95% CI) | ‐4.68 [‐6.69, ‐2.68] |
| 11 Diastolic blood pressure | 6 | 1142 | Mean Difference (IV, Random, 95% CI) | ‐1.72 [‐2.77, ‐0.66] |
| 12 Serum creatinine | 4 | 848 | Mean Difference (IV, Random, 95% CI) | 3.82 [1.45, 6.19] |
| 13 Urinary albumin/creatinine ratio | 5 | 1153 | Mean Difference (IV, Random, 95% CI) | ‐8.14 [‐14.51, ‐1.77] |
| 14 Serum potassium | 4 | 2443 | Mean Difference (IV, Random, 95% CI) | ‐0.01 [‐0.05, 0.02] |
| 15 Total cholesterol | 2 | 529 | Mean Difference (IV, Random, 95% CI) | 0.09 [‐0.05, 0.24] |
| 16 HDL cholesterol | 4 | 918 | Mean Difference (IV, Random, 95% CI) | 0.04 [0.01, 0.07] |
| 17 LDL cholesterol | 4 | 917 | Mean Difference (IV, Random, 95% CI) | 0.04 [‐0.06, 0.14] |
| 18 Triglyceride | 4 | 918 | Mean Difference (IV, Random, 95% CI) | 0.01 [‐0.11, 0.14] |
| 19 Hypoglycaemia | 7 | 3086 | Risk Ratio (IV, Random, 95% CI) | 0.88 [0.73, 1.07] |
| 20 Discontinuation of medication due to adverse events | 4 | 917 | Risk Ratio (IV, Random, 95% CI) | 0.86 [0.56, 1.32] |
| 21 End‐stage kidney disease | 2 | 700 | Risk Ratio (IV, Random, 95% CI) | 0.71 [0.10, 4.98] |
| 22 Hyperkalaemia | 4 | 2788 | Risk Ratio (IV, Random, 95% CI) | 0.58 [0.42, 0.81] |
| 23 Hypoglycaemia requiring third party assistance | 3 | 845 | Risk Ratio (IV, Random, 95% CI) | 0.47 [0.17, 1.28] |
| 24 Hypovolaemia | 6 | 3005 | Risk Ratio (IV, Random, 95% CI) | 1.07 [0.63, 1.84] |
| 25 Fracture | 5 | 2860 | Risk Ratio (IV, Random, 95% CI) | 0.81 [0.31, 2.10] |
| 26 Diarrhoea | 1 | Risk Ratio (IV, Random, 95% CI) | Totals not selected | |
| 27 Diabetic ketoacidosis | 2 | 1962 | Risk Ratio (IV, Random, 95% CI) | 1.00 [0.09, 11.02] |
| 28 Upper respiratory tract infection | 2 | 593 | Risk Ratio (IV, Random, 95% CI) | 0.79 [0.43, 1.44] |
| 29 Urinary tract infection | 7 | 3086 | Risk Ratio (IV, Random, 95% CI) | 1.09 [0.82, 1.43] |
| 30 Genital infection | 7 | 3086 | Risk Ratio (IV, Random, 95% CI) | 2.50 [1.52, 4.11] |
| 31 Acute kidney injury | 4 | 2788 | Risk Ratio (IV, Random, 95% CI) | 0.78 [0.61, 1.00] |
| 32 Doubling of serum creatinine | 2 | 700 | Risk Ratio (IV, Random, 95% CI) | 0.96 [0.49, 1.88] |
1.14. Analysis.
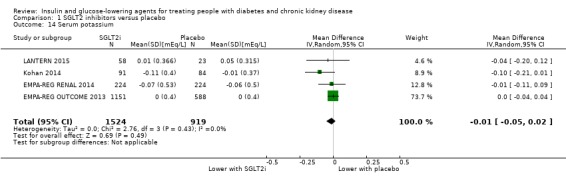
Comparison 1 SGLT2 inhibitors versus placebo, Outcome 14 Serum potassium.
1.26. Analysis.
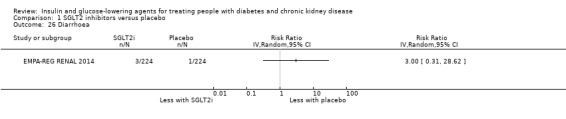
Comparison 1 SGLT2 inhibitors versus placebo, Outcome 26 Diarrhoea.
Comparison 2. DPP‐4 inhibitors versus placebo.
| Outcome or subgroup title | No. of studies | No. of participants | Statistical method | Effect size |
|---|---|---|---|---|
| 1 HbA1c | 7 | 867 | Mean Difference (IV, Random, 95% CI) | ‐0.62 [‐0.85, ‐0.39] |
| 2 Fasting blood glucose | 4 | 589 | Mean Difference (IV, Random, 95% CI) | ‐0.47 [‐1.08, 0.15] |
| 3 Death (all causes) | 6 | 4211 | Risk Ratio (IV, Random, 95% CI) | 0.89 [0.75, 1.07] |
| 4 All cardiovascular death | 2 | 5897 | Risk Ratio (IV, Random, 95% CI) | 0.93 [0.77, 1.11] |
| 5 Myocardial infarction | 4 | 6121 | Risk Ratio (IV, Random, 95% CI) | 1.08 [0.88, 1.33] |
| 6 Stroke | 3 | 6030 | Risk Ratio (IV, Random, 95% CI) | 0.92 [0.69, 1.24] |
| 7 Heart failure | 4 | 6115 | Risk Ratio (IV, Random, 95% CI) | 1.18 [0.98, 1.44] |
| 8 Weight | 2 | 210 | Mean Difference (IV, Random, 95% CI) | 0.16 [‐0.58, 0.90] |
| 9 eGFR [mL/min/1.73 m2] | 1 | Mean Difference (IV, Random, 95% CI) | Totals not selected | |
| 10 Serum creatinine | 1 | Mean Difference (IV, Random, 95% CI) | Totals not selected | |
| 11 Urinary albumin/creatinine ratio | 1 | Mean Difference (IV, Random, 95% CI) | Totals not selected | |
| 12 Total cholesterol | 1 | Mean Difference (IV, Random, 95% CI) | Totals not selected | |
| 13 LDL cholesterol | 1 | Mean Difference (IV, Random, 95% CI) | Totals not selected | |
| 14 Hypoglycaemia | 11 | 1443 | Risk Ratio (IV, Random, 95% CI) | 1.07 [0.80, 1.42] |
| 15 Discontinuation of medication due to adverse events | 7 | 1257 | Risk Ratio (IV, Random, 95% CI) | 0.94 [0.61, 1.45] |
| 16 Hyperkalaemia | 2 | 502 | Risk Ratio (IV, Random, 95% CI) | 1.30 [0.81, 2.08] |
| 17 Hypoglycaemia requiring third party assistance | 6 | 3383 | Risk Ratio (IV, Random, 95% CI) | 0.72 [0.25, 2.03] |
| 18 New or worsening retinopathy | 1 | Risk Ratio (IV, Random, 95% CI) | Totals not selected | |
| 19 Peripheral oedema | 4 | 763 | Risk Ratio (IV, Random, 95% CI) | 0.84 [0.58, 1.22] |
| 20 Diarrhoea | 2 | 502 | Risk Ratio (IV, Random, 95% CI) | 1.39 [0.80, 2.41] |
| 21 Constipation | 2 | 224 | Risk Ratio (IV, Random, 95% CI) | 0.79 [0.09, 6.84] |
| 22 Malignancy | 1 | Risk Ratio (IV, Random, 95% CI) | Totals not selected | |
| 23 Pancreatic cancer | 1 | Risk Ratio (IV, Random, 95% CI) | Totals not selected | |
| 24 Pancreatitis | 2 | 3693 | Risk Ratio (IV, Random, 95% CI) | 0.99 [0.14, 7.05] |
| 25 Liver impairment | 2 | 451 | Risk Ratio (IV, Random, 95% CI) | 1.42 [0.26, 7.64] |
| 26 Upper respiratory tract infection | 3 | 593 | Risk Ratio (IV, Random, 95% CI) | 0.63 [0.38, 1.04] |
| 27 Cellulitis | 1 | Risk Ratio (IV, Random, 95% CI) | Totals not selected | |
| 28 Urinary tract infection | 4 | 763 | Risk Ratio (IV, Random, 95% CI) | 0.82 [0.50, 1.35] |
| 29 Acute kidney injury | 1 | Risk Ratio (IV, Random, 95% CI) | Totals not selected |
2.27. Analysis.

Comparison 2 DPP‐4 inhibitors versus placebo, Outcome 27 Cellulitis.
Comparison 3. GLP‐1 agonists versus placebo.
| Outcome or subgroup title | No. of studies | No. of participants | Statistical method | Effect size |
|---|---|---|---|---|
| 1 HbA1c | 2 | 283 | Mean Difference (IV, Random, 95% CI) | ‐0.53 [‐1.01, ‐0.06] |
| 2 Fasting blood glucose | 1 | Mean Difference (IV, Random, 95% CI) | Totals not selected | |
| 3 Death (all causes) | 2 | 301 | Risk Ratio (IV, Random, 95% CI) | 3.91 [0.44, 34.58] |
| 4 Myocardial infarction | 1 | Risk Ratio (IV, Random, 95% CI) | Totals not selected | |
| 5 Heart failure | 1 | Risk Ratio (IV, Random, 95% CI) | Totals not selected | |
| 6 Weight | 1 | Mean Difference (IV, Random, 95% CI) | Totals not selected | |
| 7 Systolic blood pressure | 1 | Mean Difference (IV, Random, 95% CI) | Totals not selected | |
| 8 Diastolic blood pressure | 1 | Mean Difference (IV, Random, 95% CI) | Totals not selected | |
| 9 Serum creatinine | 1 | Mean Difference (IV, Random, 95% CI) | Totals not selected | |
| 10 Total cholesterol | 1 | Mean Difference (IV, Random, 95% CI) | Totals not selected | |
| 11 HDL cholesterol | 1 | Mean Difference (IV, Random, 95% CI) | Totals not selected | |
| 12 LDL cholesterol | 1 | Mean Difference (IV, Random, 95% CI) | Totals not selected | |
| 13 Triglyceride | 1 | Mean Difference (IV, Random, 95% CI) | Totals not selected | |
| 14 Hypoglycaemia | 1 | Risk Ratio (IV, Random, 95% CI) | Totals not selected | |
| 15 Discontinuation of medication due to adverse events | 1 | Risk Ratio (IV, Random, 95% CI) | Totals not selected | |
| 16 Gastrointestinal disorders | 1 | Risk Ratio (IV, Random, 95% CI) | Totals not selected | |
| 17 Vomiting | 1 | Risk Ratio (IV, Random, 95% CI) | Totals not selected | |
| 18 Pancreatitis | 1 | Risk Ratio (IV, Random, 95% CI) | Totals not selected | |
| 19 Nausea | 1 | Risk Ratio (IV, Random, 95% CI) | Totals not selected |
Comparison 4. Glitazone versus placebo/control.
| Outcome or subgroup title | No. of studies | No. of participants | Statistical method | Effect size |
|---|---|---|---|---|
| 1 HbA1c | 2 | 88 | Mean Difference (IV, Random, 95% CI) | ‐0.41 [‐1.15, 0.32] |
| 2 Fasting blood glucose | 1 | Mean Difference (IV, Random, 95% CI) | Totals not selected | |
| 3 Death (all causes) | 1 | Risk Ratio (IV, Random, 95% CI) | Totals not selected | |
| 4 Heart failure | 2 | 123 | Risk Ratio (IV, Random, 95% CI) | 0.34 [0.01, 8.13] |
| 5 Systolic blood pressure | 1 | Mean Difference (IV, Random, 95% CI) | Totals not selected | |
| 6 Diastolic blood pressure | 1 | Mean Difference (IV, Random, 95% CI) | Totals not selected | |
| 7 Total cholesterol | 2 | 72 | Mean Difference (IV, Random, 95% CI) | 0.60 [‐0.02, 1.23] |
| 8 HDL cholesterol | 2 | 72 | Mean Difference (IV, Random, 95% CI) | 0.07 [‐0.25, 0.40] |
| 9 LDL cholesterol | 2 | 72 | Mean Difference (IV, Random, 95% CI) | 0.39 [‐0.60, 1.39] |
| 10 Triglyceride | 2 | 72 | Mean Difference (IV, Random, 95% CI) | ‐0.34 [‐2.99, 2.30] |
| 11 Hypoglycaemia | 2 | Risk Ratio (IV, Random, 95% CI) | Totals not selected | |
| 12 Hypoglycaemia requiring third party assistance | 1 | Risk Ratio (IV, Random, 95% CI) | Totals not selected | |
| 13 Peripheral oedema | 3 | 134 | Risk Ratio (IV, Random, 95% CI) | 3.05 [0.33, 28.32] |
| 14 Fluid overload | 1 | Risk Ratio (IV, Random, 95% CI) | Totals not selected | |
| 15 Fracture | 1 | Risk Ratio (IV, Random, 95% CI) | Totals not selected | |
| 16 Gastrointestinal disorders | 1 | Risk Ratio (IV, Random, 95% CI) | Totals not selected | |
| 17 Liver impairment | 1 | Risk Ratio (IV, Random, 95% CI) | Totals not selected |
4.17. Analysis.

Comparison 4 Glitazone versus placebo/control, Outcome 17 Liver impairment.
Comparison 5. Glinides versus placebo/control.
| Outcome or subgroup title | No. of studies | No. of participants | Statistical method | Effect size |
|---|---|---|---|---|
| 1 Hypoglycaemia | 1 | Risk Ratio (IV, Random, 95% CI) | Totals not selected | |
| 2 Hypoglycaemia requiring third party assistance | 1 | Risk Ratio (IV, Random, 95% CI) | Totals not selected | |
| 3 Peripheral oedema | 1 | Risk Ratio (IV, Random, 95% CI) | Totals not selected | |
| 4 Liver impairment | 1 | Risk Ratio (IV, Random, 95% CI) | Totals not selected |
5.1. Analysis.
Comparison 5 Glinides versus placebo/control, Outcome 1 Hypoglycaemia.
5.2. Analysis.

Comparison 5 Glinides versus placebo/control, Outcome 2 Hypoglycaemia requiring third party assistance.
5.3. Analysis.

Comparison 5 Glinides versus placebo/control, Outcome 3 Peripheral oedema.
5.4. Analysis.

Comparison 5 Glinides versus placebo/control, Outcome 4 Liver impairment.
Comparison 6. Sitagliptin versus glipizide.
| Outcome or subgroup title | No. of studies | No. of participants | Statistical method | Effect size |
|---|---|---|---|---|
| 1 HbA1c | 2 | 398 | Mean Difference (IV, Random, 95% CI) | ‐0.05 [‐0.39, 0.29] |
| 2 Fasting blood glucose | 2 | 397 | Mean Difference (IV, Random, 95% CI) | 0.36 [‐0.10, 0.82] |
| 3 Death (all causes) | 2 | 551 | Risk Ratio (IV, Random, 95% CI) | 0.55 [0.22, 1.36] |
| 4 Myocardial infarction | 1 | Risk Ratio (IV, Random, 95% CI) | Totals not selected | |
| 5 Stroke | 1 | Risk Ratio (IV, Random, 95% CI) | Totals not selected | |
| 6 Total cholesterol | 1 | Mean Difference (IV, Random, 95% CI) | Totals not selected | |
| 7 HDL cholesterol | 1 | Mean Difference (IV, Random, 95% CI) | Totals not selected | |
| 8 LDL cholesterol | 1 | Mean Difference (IV, Random, 95% CI) | Totals not selected | |
| 9 Triglyceride | 1 | Mean Difference (IV, Random, 95% CI) | Totals not selected | |
| 10 Hypoglycaemia | 2 | 551 | Risk Ratio (IV, Random, 95% CI) | 0.40 [0.23, 0.69] |
| 11 Discontinuation of medication due to adverse events | 2 | 551 | Risk Ratio (IV, Random, 95% CI) | 0.93 [0.54, 1.60] |
| 12 Hypoglycaemia requiring third party assistance | 2 | 551 | Risk Ratio (IV, Random, 95% CI) | 0.35 [0.09, 1.37] |
| 13 Peripheral oedema | 2 | 551 | Risk Ratio (IV, Random, 95% CI) | 0.71 [0.11, 4.80] |
| 14 Fracture | 1 | Risk Ratio (IV, Random, 95% CI) | Totals not selected | |
| 15 Vomiting | 1 | Risk Ratio (IV, Random, 95% CI) | Totals not selected | |
| 16 Diarrhoea | 2 | 551 | Risk Ratio (IV, Random, 95% CI) | 0.79 [0.39, 1.60] |
| 17 Malignancy | 1 | Risk Ratio (IV, Random, 95% CI) | Totals not selected | |
| 18 Pancreatic cancer | 1 | Risk Ratio (IV, Random, 95% CI) | Totals not selected | |
| 19 Upper respiratory tract infection | 2 | 551 | Risk Ratio (IV, Random, 95% CI) | 0.60 [0.31, 1.17] |
| 20 Urinary tract infection | 2 | 551 | Risk Ratio (IV, Random, 95% CI) | 1.29 [0.24, 6.94] |
| 21 Cellulitis | 1 | Risk Ratio (IV, Random, 95% CI) | Totals not selected |
6.9. Analysis.
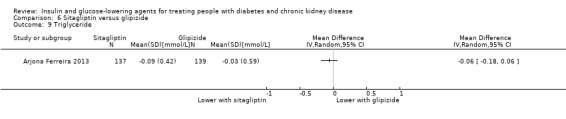
Comparison 6 Sitagliptin versus glipizide, Outcome 9 Triglyceride.
Comparison 7. Vildagliptin versus sitagliptin.
| Outcome or subgroup title | No. of studies | No. of participants | Statistical method | Effect size |
|---|---|---|---|---|
| 1 HbA1c | 1 | Mean Difference (IV, Random, 95% CI) | Totals not selected | |
| 2 Fasting blood glucose | 1 | Mean Difference (IV, Random, 95% CI) | Totals not selected | |
| 3 Death (all causes) | 1 | Risk Ratio (IV, Random, 95% CI) | Totals not selected | |
| 4 Hypoglycaemia | 1 | Risk Ratio (IV, Random, 95% CI) | Totals not selected | |
| 5 Discontinuation of medication due to adverse events | 1 | Risk Ratio (IV, Random, 95% CI) | Totals not selected | |
| 6 Peripheral oedema | 1 | Risk Ratio (IV, Random, 95% CI) | Totals not selected | |
| 7 Pancreatitis | 1 | Risk Ratio (IV, Random, 95% CI) | Totals not selected | |
| 8 Liver impairment | 1 | Risk Ratio (IV, Random, 95% CI) | Totals not selected |
7.5. Analysis.

Comparison 7 Vildagliptin versus sitagliptin, Outcome 5 Discontinuation of medication due to adverse events.
7.7. Analysis.

Comparison 7 Vildagliptin versus sitagliptin, Outcome 7 Pancreatitis.
Comparison 8. Albiglutide versus sitagliptin.
| Outcome or subgroup title | No. of studies | No. of participants | Statistical method | Effect size |
|---|---|---|---|---|
| 1 HbA1c | 1 | Mean Difference (IV, Random, 95% CI) | Totals not selected | |
| 2 Fasting blood glucose | 1 | Mean Difference (IV, Random, 95% CI) | Totals not selected |
Comparison 9. Aleglitazar versus pioglitazone.
| Outcome or subgroup title | No. of studies | No. of participants | Statistical method | Effect size |
|---|---|---|---|---|
| 1 HbA1c | 1 | Mean Difference (IV, Random, 95% CI) | Totals not selected | |
| 2 Fasting blood glucose | 1 | Mean Difference (IV, Random, 95% CI) | Totals not selected | |
| 3 Heart failure | 1 | Risk Ratio (IV, Random, 95% CI) | Totals not selected | |
| 4 Death (all causes) | 1 | Risk Ratio (IV, Random, 95% CI) | Totals not selected | |
| 5 All cardiovascular death | 1 | Risk Ratio (IV, Random, 95% CI) | Totals not selected | |
| 6 Myocardial infarction | 1 | Risk Ratio (IV, Random, 95% CI) | Totals not selected | |
| 7 Stroke | 1 | Risk Ratio (IV, Random, 95% CI) | Totals not selected | |
| 8 Weight | 1 | Mean Difference (IV, Random, 95% CI) | Totals not selected | |
| 9 eGFR | 1 | Mean Difference (IV, Random, 95% CI) | Totals not selected | |
| 10 Systolic blood pressure | 1 | Mean Difference (IV, Random, 95% CI) | Totals not selected | |
| 11 Diastolic blood pressure | 1 | Mean Difference (IV, Random, 95% CI) | Totals not selected | |
| 12 Serum creatinine | 1 | Mean Difference (IV, Random, 95% CI) | Totals not selected | |
| 13 Hypoglycaemia | 1 | Risk Ratio (IV, Random, 95% CI) | Totals not selected | |
| 14 Hypoglycaemia requiring third party assistance | 1 | Risk Ratio (IV, Random, 95% CI) | Totals not selected | |
| 15 Peripheral oedema | 1 | Risk Ratio (IV, Random, 95% CI) | Totals not selected | |
| 16 Fracture | 1 | Risk Ratio (IV, Random, 95% CI) | Totals not selected | |
| 17 Malignancy | 1 | Risk Ratio (IV, Random, 95% CI) | Totals not selected |
9.12. Analysis.

Comparison 9 Aleglitazar versus pioglitazone, Outcome 12 Serum creatinine.
Comparison 10. Insulin glulisine and glargine 0.5 versus 0.25 U/kg/d.
| Outcome or subgroup title | No. of studies | No. of participants | Statistical method | Effect size |
|---|---|---|---|---|
| 1 Hypoglycaemia < 3.89 mmol/L | 1 | Risk Ratio (IV, Random, 95% CI) | Totals not selected | |
| 2 Hypoglycaemia < 2.78 mmol/L | 1 | Risk Ratio (IV, Random, 95% CI) | Totals not selected |
Characteristics of studies
Characteristics of included studies [ordered by study ID]
Abe 2007.
| Methods |
|
|
| Participants |
|
|
| Interventions | Treatment group
Control group
|
|
| Outcomes |
|
|
| Notes |
|
|
| Risk of bias | ||
| Bias | Authors' judgement | Support for judgement |
| Random sequence generation (selection bias) | Low risk | A computer generated list was used |
| Allocation concealment (selection bias) | Unclear risk | Insufficient information to permit judgement |
| Blinding of participants and personnel (performance bias) All outcomes | High risk | Open‐label study |
| Blinding of outcome assessment (detection bias) All outcomes | High risk | Open‐label study |
| Incomplete outcome data (attrition bias) All outcomes | Low risk | No people dropped out |
| Selective reporting (reporting bias) | Unclear risk | The prespecified outcomes were not available on a clinical trials database |
| Other bias | Unclear risk | Conflicts of interest and funding source were not reported |
Abe 2008a.
| Methods |
|
|
| Participants |
|
|
| Interventions | Treatment group
Control group
|
|
| Outcomes |
|
|
| Notes |
|
|
| Risk of bias | ||
| Bias | Authors' judgement | Support for judgement |
| Random sequence generation (selection bias) | Unclear risk | Study was described as randomised, method of randomisation was not reported |
| Allocation concealment (selection bias) | Unclear risk | Insufficient information to permit judgement |
| Blinding of participants and personnel (performance bias) All outcomes | High risk | Open‐label study |
| Blinding of outcome assessment (detection bias) All outcomes | Unclear risk | Open‐label study |
| Incomplete outcome data (attrition bias) All outcomes | Low risk | No patients dropped out in either group |
| Selective reporting (reporting bias) | Unclear risk | The prespecified outcomes were not available on a clinical trials database |
| Other bias | Unclear risk | Conflicts of interest and funding source were not reported |
Abe 2010.
| Methods |
|
|
| Participants |
|
|
| Interventions | Treatment group
Control group
|
|
| Outcomes |
|
|
| Notes |
|
|
| Risk of bias | ||
| Bias | Authors' judgement | Support for judgement |
| Random sequence generation (selection bias) | Low risk | A computer‐generated list was used for randomisation. |
| Allocation concealment (selection bias) | Unclear risk | Insufficient information to permit judgement |
| Blinding of participants and personnel (performance bias) All outcomes | High risk | Open‐label study |
| Blinding of outcome assessment (detection bias) All outcomes | High risk | Open‐label study |
| Incomplete outcome data (attrition bias) All outcomes | Low risk | No patients dropped out in either arm |
| Selective reporting (reporting bias) | Unclear risk | The prespecified outcomes were not available on a clinical trials database |
| Other bias | Low risk | No conflicts of interest |
Abe 2010a.
| Methods |
|
|
| Participants |
|
|
| Interventions | Treatment group
Control group
|
|
| Outcomes |
|
|
| Notes |
|
|
| Risk of bias | ||
| Bias | Authors' judgement | Support for judgement |
| Random sequence generation (selection bias) | Unclear risk | Study was described as randomised, method of randomisation was not reported |
| Allocation concealment (selection bias) | Unclear risk | Insufficient information to permit judgement |
| Blinding of participants and personnel (performance bias) All outcomes | High risk | Open‐label study |
| Blinding of outcome assessment (detection bias) All outcomes | High risk | Open‐label study |
| Incomplete outcome data (attrition bias) All outcomes | Low risk | Low dropout rate with 3.2% of intervention group and 6.3% of control group dropping out |
| Selective reporting (reporting bias) | Unclear risk | The prespecified outcomes were not available on a clinical trials database |
| Other bias | Low risk | No conflict of interest reported |
Abe 2016.
| Methods |
|
|
| Participants |
|
|
| Interventions | Both groups
Treatment group
Control group
|
|
| Outcomes |
|
|
| Notes |
|
|
| Risk of bias | ||
| Bias | Authors' judgement | Support for judgement |
| Random sequence generation (selection bias) | Unclear risk | Study was described as randomised, method of randomisation was not reported |
| Allocation concealment (selection bias) | Low risk | The randomisation of subjects was monitored by an independent investigator with no previous knowledge of the subjects |
| Blinding of participants and personnel (performance bias) All outcomes | High risk | Open‐label study |
| Blinding of outcome assessment (detection bias) All outcomes | High risk | Open‐label study |
| Incomplete outcome data (attrition bias) All outcomes | Low risk | Low dropout rate with 2.3% of each group dropping out |
| Selective reporting (reporting bias) | Low risk | All outcomes reported. The prespecified outcomes were available on a clinical trials database |
| Other bias | Low risk | "MA has received honoraria from Kyowa Hakko Kirin Co. Ltd. The other authors have no conflict of interest to declare" |
AleNephro 2014.
| Methods |
|
|
| Participants |
|
|
| Interventions | Treatment group
Control group
Both groups
|
|
| Outcomes |
|
|
| Notes |
|
|
| Risk of bias | ||
| Bias | Authors' judgement | Support for judgement |
| Random sequence generation (selection bias) | Low risk | “At the baseline visit, patients were randomly assigned (via an interactive voice‐response system) in a 1:1 ratio to receive orally either 150 μg aleglitazar tablets and placebo capsules matching pioglitazone capsules, or 45 mg pioglitazone capsules and placebo tablets matching aleglitazar tablets. The patient randomisation numbers were generated by Roche and maintained by an unblinded statistician. The investigator or designee entered the case report form number (CRF; patient number) on the electronic CRF (given to a patient at visit 2 at the time of randomisation) and entered the corresponding randomisation number for allocation to the treatment groups in the appropriate place on each patient’s eCRF." |
| Allocation concealment (selection bias) | Low risk | "The patient randomisation numbers were allocated sequentially in the order in which the patients were enrolled according to the specification document agreed with the randomisation company (S‐Clinica). The password‐protected and/or encrypted electronic master randomisation list was kept in a central repository by the Roche Biometrics and Drug Safety Departments. No open key to the code was available at the study centre, to the Roche monitors, project statisticians, or to the project team at Roche.” |
| Blinding of participants and personnel (performance bias) All outcomes | Low risk | Patients, study site personnel and sponsor were all blinded to treatment assignment |
| Blinding of outcome assessment (detection bias) All outcomes | Low risk | Patients, study site personnel and sponsor were all blinded to treatment assignment |
| Incomplete outcome data (attrition bias) All outcomes | High risk | 21.3% dropped out from the aleglitazar group and 22.4% dropped out from the pioglitazone group |
| Selective reporting (reporting bias) | Low risk | The prespecified outcomes were available on a clinical trials database was available and reported |
| Other bias | High risk | Conflicts of interest were present. The sponsor F. Hoffmann‐La Roche contributed to dosing, data collection, statistical analysis and interpretation of data in collaboration with the investigators. Authors were either employees of F. Hoffmann‐La Roche or serve as advisors to the company, or have received speaker honoraria, consulting fees, research grants from the company |
Arjona Ferreira 2013.
| Methods |
|
|
| Participants |
|
|
| Interventions | Treatment group
Control group
|
|
| Outcomes |
|
|
| Notes |
|
|
| Risk of bias | ||
| Bias | Authors' judgement | Support for judgement |
| Random sequence generation (selection bias) | Low risk | “Patients were randomised (1:1) using a computer‐generated randomisation schedule to receive sitagliptin or glipizide. Randomization was stratified based on: 1) kidney insufficiency status (moderate or severe), 2) history of cardiovascular disease (yes or no), and 3) history of heart failure (yes or no)". |
| Allocation concealment (selection bias) | Unclear risk | Insufficient information to permit judgement |
| Blinding of participants and personnel (performance bias) All outcomes | Low risk | Sitagliptin and glipizide matching placebos were used to maintain blinding |
| Blinding of outcome assessment (detection bias) All outcomes | Unclear risk | The study was described as double‐blind, but the methods to ensure blinding of outcome assessment were not reported |
| Incomplete outcome data (attrition bias) All outcomes | High risk | 22.3% of the sitagliptin group and 19.8% of the glipizide group dropped out |
| Selective reporting (reporting bias) | Low risk | The prespecified outcomes were available on a clinical trials database. All outcomes were reported |
| Other bias | High risk | Conflicts of interest: The study was sponsored by Merck Sharp & Dohme Corp., a subsidiary of Merck & Co., Inc., Whitehouse Station, NJ, the manufacturer of sitagliptin. J.C.A.F., H.G., G.T.G., C.M.S., K.D.K., and B.J.G. are employees of Merck Sharp & Dohme Corp., a subsidiary of Merck & Co., Inc., and may have stock or stock options in the company. N.B. has served on the National Diabetes Advisory Board. M.M. is a consultant for Association Diabete Risque Vasculaire, serves on the Merck global advisory board and the French subsidiary advisory board, and is a speaker for Merck, Sanofi, Novo Nordisk, Servier, and Abbott Diagnostics. No other potential conflicts of interest relevant to this. |
Arjona Ferreira 2013a.
| Methods |
|
|
| Participants |
|
|
| Interventions | Treatment group
Control group
|
|
| Outcomes |
|
|
| Notes |
|
|
| Risk of bias | ||
| Bias | Authors' judgement | Support for judgement |
| Random sequence generation (selection bias) | Low risk | Patients were “randomly assigned 1:1, using a computer‐generated randomisation schedule, to receive sitagliptin, 25 mg daily or glipizide”. |
| Allocation concealment (selection bias) | Unclear risk | Insufficient information to permit judgement |
| Blinding of participants and personnel (performance bias) All outcomes | Low risk | “Sitagliptin or glipizide placebo pills were used to maintain blinding”. |
| Blinding of outcome assessment (detection bias) All outcomes | Unclear risk | Insufficient information to permit judgement |
| Incomplete outcome data (attrition bias) All outcomes | High risk | Large dropout rates for both groups ‐ 26.6% for the sitagliptin group and 30.8% for the glipizide group |
| Selective reporting (reporting bias) | Low risk | The prespecified outcomes were available on a clinical trials database and all outcomes were reported |
| Other bias | High risk | 1) The study was underpowered. From the report: “Due to enrolment challenges, the sample size was revised from 150 (original design) to 125. The following calculations were based on the revised sample size. Assuming 10% of patients discontinued without a post randomisation measurement, the study had 76% power to detect a true difference of 0.40% in the within‐group mean reduction in HbA1c level from baseline, using a standard deviation of 1.1%”. However, 28.7% of cohort discontinued. 2) Conflict of interest: The study was sponsored by Merck Sharp & Dohme Corp., a subsidiary of Merck & Co. Inc., the manufacturer of sitagliptin. Doctors Arjona Ferreira, Xu, Golm, Davies, Kaufman, and Goldstein and Mr Gonzalez are employees of Merck Sharp & Dohme Corp., a subsidiary of Merck & Co. Inc., and may have stock or stock options in the company. Dr Sloan has served on an advisory board for sitagliptin and has been a speaker and consultant for Merck Sharp & Dohme Corp. The other authors declare that they have no other relevant financial interests. |
Baldwin 2012.
| Methods |
|
|
| Participants |
|
|
| Interventions | Both groups
Treatment group
Control group
|
|
| Outcomes |
|
|
| Notes |
|
|
| Risk of bias | ||
| Bias | Authors' judgement | Support for judgement |
| Random sequence generation (selection bias) | Unclear risk | The method of random sequence generation was not reported. All the paper reports was: “Eligible patients gave informed consent and were randomised 1:1 into two protocol groups by a research pharmacist”. |
| Allocation concealment (selection bias) | Unclear risk | Insufficient information to permit judgement |
| Blinding of participants and personnel (performance bias) All outcomes | Unclear risk | Insufficient information to permit judgement |
| Blinding of outcome assessment (detection bias) All outcomes | Unclear risk | Insufficient information to permit judgement |
| Incomplete outcome data (attrition bias) All outcomes | Low risk | There were no drop‐outs in each group, and all subjects were analysed in the groups to which they were randomised |
| Selective reporting (reporting bias) | Low risk | The prespecified outcomes were available on a clinical trials database and all outcomes were reported |
| Other bias | Low risk | No conflicts of interest were reported |
Barnett 2013.
| Methods |
|
|
| Participants |
|
|
| Interventions | Both groups
Treatment group
Control group
Other information
|
|
| Outcomes |
|
|
| Notes |
|
|
| Risk of bias | ||
| Bias | Authors' judgement | Support for judgement |
| Random sequence generation (selection bias) | Low risk | “Computer‐generated randomisation lists were produced by the sponsor...” |
| Allocation concealment (selection bias) | Low risk | “...allocation concealed using a central interactive voice–web response system”. |
| Blinding of participants and personnel (performance bias) All outcomes | Low risk | “Linagliptin and placebo tablets were identical in appearance, and investigators and patients were masked to treatment assignment throughout the study” |
| Blinding of outcome assessment (detection bias) All outcomes | Low risk | “Linagliptin and placebo tablets were identical in appearance, and investigators and patients were masked to treatment assignment throughout the study”. |
| Incomplete outcome data (attrition bias) All outcomes | Low risk | 16/162 (9.9%) linagliptin; 5/79 (6.3%) placebo dropped out |
| Selective reporting (reporting bias) | Low risk | The prespecified outcomes were available on a clinical trials database and all outcomes were reported. |
| Other bias | High risk | Conflict of interest: This study was sponsored by Boehringer Ingelheim. The sponsor was involved in study design, and data collection, review, and analysis. All authors were employees of Boehringer Ingelheim except the first author who has received honoraria for lecture and advisory work for the company. |
Bellante 2016.
| Methods |
|
|
| Participants |
|
|
| Interventions | Treatment group
Control group
|
|
| Outcomes |
|
|
| Notes |
|
|
| Risk of bias | ||
| Bias | Authors' judgement | Support for judgement |
| Random sequence generation (selection bias) | Unclear risk | Random sequence generation was not reported |
| Allocation concealment (selection bias) | Unclear risk | Insufficient information to permit judgement |
| Blinding of participants and personnel (performance bias) All outcomes | Unclear risk | Insufficient information to permit judgement |
| Blinding of outcome assessment (detection bias) All outcomes | Low risk | "The same trained operators, blind to the clinical status of each subject, performed the tests throughout the entire study." |
| Incomplete outcome data (attrition bias) All outcomes | Low risk | No dropouts were reported. |
| Selective reporting (reporting bias) | Unclear risk | The prespecified outcomes were not available on a clinical trials database. |
| Other bias | Unclear risk | Insufficient information to permit judgement |
Chan 2008a.
| Methods |
|
|
| Participants |
|
|
| Interventions | Treatment group
Control group
Other information
|
|
| Outcomes |
|
|
| Notes |
|
|
| Risk of bias | ||
| Bias | Authors' judgement | Support for judgement |
| Random sequence generation (selection bias) | Low risk | “Following the placebo run‐in period, patients underwent baseline measurements and were randomised to receive once‐daily administration of sitagliptin or placebo in a 2 : 1 ratio using a computer‐generated randomisation schedule”. |
| Allocation concealment (selection bias) | Low risk | “Following the placebo run‐in period, patients underwent baseline measurements and were randomised to receive once‐daily administration of sitagliptin or placebo in a 2 : 1 ratio using a computer‐generated randomisation schedule” |
| Blinding of participants and personnel (performance bias) All outcomes | Low risk | Patients received placebo tablets. Also described as a 54‐week, multinational, randomised, double‐blind, parallel‐group study |
| Blinding of outcome assessment (detection bias) All outcomes | Unclear risk | study described as a 54‐week, multinational, randomised, double‐blind, parallel‐group study, but the method of outcome assessment blinding was not described in the report |
| Incomplete outcome data (attrition bias) All outcomes | High risk | 29.2% 19/65 dropped out in the sitagliptin group. 23.1% 6/26 dropped out in the placebo/gliclazide group. |
| Selective reporting (reporting bias) | Low risk | The prespecified outcomes were available on a clinical trials database and all outcomes were reported |
| Other bias | High risk | Conflict of interest: This study was sponsored by Merck & Co., Inc, Whitehouse Station, NJ, USA, who make sitagliptin |
Diez 1987.
| Methods |
|
|
| Participants |
|
|
| Interventions | Treatment group 1
Treatment group 2
|
|
| Outcomes |
|
|
| Notes |
|
|
| Risk of bias | ||
| Bias | Authors' judgement | Support for judgement |
| Random sequence generation (selection bias) | Unclear risk | Study was described as randomised, method of randomisation was not reported |
| Allocation concealment (selection bias) | Unclear risk | Insufficient information to permit judgement |
| Blinding of participants and personnel (performance bias) All outcomes | Unclear risk | Insufficient information to permit judgement |
| Blinding of outcome assessment (detection bias) All outcomes | Unclear risk | Insufficient information to permit judgement |
| Incomplete outcome data (attrition bias) All outcomes | Unclear risk | No drop‐outs reported |
| Selective reporting (reporting bias) | Unclear risk | The prespecified outcomes were not available on a clinical trials database available ‐ inadequate information |
| Other bias | Unclear risk | Insufficient information to permit judgement |
EMPA‐REG BP 2015.
| Methods |
|
|
| Participants |
|
|
| Interventions | All groups
Treatment group 1
Treatment group 2
Control group
Other information
|
|
| Outcomes |
|
|
| Notes |
|
|
| Risk of bias | ||
| Bias | Authors' judgement | Support for judgement |
| Random sequence generation (selection bias) | Low risk | Randomisation was undertaken using a computer‐generated, pseudo‐random sequence and an interactive voice and web response system. |
| Allocation concealment (selection bias) | Low risk | Randomisation was undertaken using a computer‐generated, pseudo‐random sequence and an interactive voice and web response system. |
| Blinding of participants and personnel (performance bias) All outcomes | Low risk | “Patients were randomised (1:1:1) to receive 10 mg empagliflozin o.d., 25mg empagliflozin o.d., or placebo double blind for 12 weeks.” |
| Blinding of outcome assessment (detection bias) All outcomes | Unclear risk | Study labelled as double blind, but the methodology for blinding was not reported. |
| Incomplete outcome data (attrition bias) All outcomes | Low risk | 11/276 (4.0%) Empagliflozin 10 mg d; 11/277 (4.0%) Empagliflozin 25 mg d; 16/272 (5.9%) placebo discontinued. |
| Selective reporting (reporting bias) | Low risk | The prespecified outcomes were available on a clinical trials database and all major outcomes were reported. |
| Other bias | High risk | Conflicts of interest: This study was funded by Boehringer Ingelheim and Eli Lilly who developed Empagliflozin. All but one of the authors works for Boehringer Ingelheim or on behalf of Boehringer Ingelheim. The remaining author has received consulting fees/payments for lectures and support for travel to meetings from Boehringer Ingelheim. |
EMPA‐REG OUTCOME 2013.
| Methods |
|
|
| Participants |
|
|
| Interventions | Treatment group
Control group
|
|
| Outcomes |
|
|
| Notes |
|
|
| Risk of bias | ||
| Bias | Authors' judgement | Support for judgement |
| Random sequence generation (selection bias) | Low risk | “Randomization was performed with the use of a computer‐generated random‐sequence and interactive voice‐ and Web‐response system and was stratified according to the glycated haemoglobin level at screening (<8.5% or ≥8.5%), body mass index at randomisation (<30 or ≥30), renal function at screening (eGFR, 30 to 59 mL, 60 to 89 mL, or ≥90 mL per minute per 1.73 m2), and geographic region (North America [plus Australia and New Zealand], Latin America, Europe, Africa, or Asia)”. |
| Allocation concealment (selection bias) | Low risk | “Randomization was performed with the use of a computer‐generated random‐sequence and interactive voice‐ and Web‐response system and was stratified according to the glycated haemoglobin level at screening (<8.5% or ≥8.5%), body mass index at randomisation (<30 or ≥30), renal function at screening (eGFR, 30 to 59 mL, 60 to 89 mL, or ≥90 mL per minute per 1.73 m2), and geographic region (North America [plus Australia and New Zealand], Latin America, Europe, Africa, or Asia)”. |
| Blinding of participants and personnel (performance bias) All outcomes | Low risk | “Patients meeting the inclusion criteria were then randomly assigned in a 1:1:1 ratio to receive either 10 mg or 25 mg of empagliflozin or placebo once daily”. |
| Blinding of outcome assessment (detection bias) All outcomes | Unclear risk | Study reported to be double‐blind, but the methodology for blinding was not reported. |
| Incomplete outcome data (attrition bias) All outcomes | Low risk | 81/2345 (3.5%) Empagliflozin 10 mg; 63/2342 (2.7%) Empagliflozin 25 mg ; 67/2333 (2.9%) Placebo discontinued. |
| Selective reporting (reporting bias) | Low risk | The prespecified outcomes were available on a clinical trials database and all major outcomes were reported. |
| Other bias | High risk | Conflicts of interest: The study was supported by the manufacturers of Empagliflozin, Boehringer Ingelheim and Eli Lilly. Six of the authors were employees of Boehringer Ingelheim, and 3 of them either received consulting fees from Eli Lilly or research grants from Boehringer Ingelheim and/or Eli Lilly were on the advisory board of both companies. |
EMPA‐REG RENAL 2014.
| Methods |
|
|
| Participants |
|
|
| Interventions | CKD stage 2 (1:1:1)
CKD stage 3 (1:1)
CKD stage 4 (1:1)
All groups
|
|
| Outcomes |
|
|
| Notes |
|
|
| Risk of bias | ||
| Bias | Authors' judgement | Support for judgement |
| Random sequence generation (selection bias) | Low risk | “Randomisation was done by the study sponsor via an interactive response system using a computer‐generated random sequence, and was stratified by degree of renal impairment”. |
| Allocation concealment (selection bias) | Low risk | “Treatment allocation during the treatment period was masked from patients, investigators, and those involved in analysing study data. Access to the randomisation code was limited to non‐study team functions including a randomisation operator, a person trained to generate the randomisation scheme, supply staff responsible for packaging and labelling, an independent statistician to verify the randomisation scheme, a system operator for clinical data systems to do the technical aspects of uploading the randomisation scheme, a dedicated contract research organisation responsible for the interactive voice and internet‐based response system, and a dedicated contract research organisation supporting the Data Monitoring Committee”. |
| Blinding of participants and personnel (performance bias) All outcomes | Low risk | “Treatment allocation during the treatment period was masked from patients, investigators, and those involved in analysing trial data. Access to the randomisation code was limited to non‐trial team functions including a randomisation operator, a person trained to generate the randomisation scheme, supply staff responsible for packaging and labelling, an independent statistician to verify the randomisation scheme, a system operator for clinical data systems to do the technical aspects of uploading the randomisation scheme, a dedicated contract research organisation responsible for the interactive voice and internet‐based response system, and a dedicated contract research organisation supporting the Data Monitoring Committee” |
| Blinding of outcome assessment (detection bias) All outcomes | Low risk | “Treatment allocation during the treatment period was masked from patients, investigators, and those involved in analysing trial data. Access to the randomisation code was limited to non‐trial team functions including a randomisation operator, a person trained to generate the randomisation scheme, supply staff responsible for packaging and labelling, an independent statistician to verify the randomisation scheme, a system operator for clinical data systems to do the technical aspects of uploading the randomisation scheme, a dedicated contract research organisation responsible for the interactive voice and internet‐based response system, and a dedicated contract research organisation supporting the Data Monitoring Committee” |
| Incomplete outcome data (attrition bias) All outcomes | High risk | Stage 3: Empagliflozin 25 mg 23/188 12.2%; Placebo 21/187 7.3% discontinued. Stage 4: Empagliflozin 25 mg 11/37 29.7%; Placebo 12/37 32.4% discontinued |
| Selective reporting (reporting bias) | Low risk | The prespecified outcomes were available on a clinical trials database and all major outcomes were reported |
| Other bias | High risk | Conflicts of interest: Boehringer Ingelheim was involved in study design, data collection, and data analysis. Eli Lilly cosponsored the study, but was not involved in study design, data collection, or data analysis. All authors, except 2 were employees of Boehringer Ingelheim the maker of empagliflozin. The other 2 authors had received honoraria from Boehringer Ingelheim for lectures and advisory work/consultancy |
GUARD 2017.
| Methods |
|
|
| Participants |
|
|
| Interventions | Treatment group
Control group
Both groups
|
|
| Outcomes |
|
|
| Notes |
|
|
| Risk of bias | ||
| Bias | Authors' judgement | Support for judgement |
| Random sequence generation (selection bias) | Low risk | 1:1 ratio by severity of kidney impairment and the type of background antidiabetic agents, using the interactive web response system for randomisation |
| Allocation concealment (selection bias) | Low risk | 1:1 ratio by severity of kidney impairment and the type of background antidiabetic agents, using the interactive web response system for randomisation |
| Blinding of participants and personnel (performance bias) All outcomes | Low risk | "The double‐blind approach was maintained by providing matching placebo, labelling each study drug with a kit number, disclosing the randomisation code only to authorized personnel (statistician, IWRS manager and randomisation manager) when necessary, and by not disclosing individual data to the investigator or other study‐related personnel during or before the time of this interim analysis" |
| Blinding of outcome assessment (detection bias) All outcomes | Low risk | "The double‐blind approach was maintained by providing matching placebo, labelling each study drug with a kit number, disclosing the randomisation code only to authorized personnel (statistician, IWRS manager and randomisation manager) when necessary, and by not disclosing individual data to the investigator or other study‐related personnel during or before the time of this interim analysis" |
| Incomplete outcome data (attrition bias) All outcomes | Low risk | No missing outcome data |
| Selective reporting (reporting bias) | Low risk | The prespecified outcomes were available on a clinical trials database. All major outcomes reported |
| Other bias | High risk | Conflicts of interest: 2 of the authors are employed by LG Life Sciences who manufacture gemigliptin |
Haneda 2016.
| Methods |
|
|
| Participants |
|
|
| Interventions | Treatment group
Control group
Other information
|
|
| Outcomes |
|
|
| Notes |
|
|
| Risk of bias | ||
| Bias | Authors' judgement | Support for judgement |
| Random sequence generation (selection bias) | Unclear risk | Study was described as randomised, method of randomisation was not reported |
| Allocation concealment (selection bias) | Low risk | “The allocations were implemented at the individual central registration office”. |
| Blinding of participants and personnel (performance bias) All outcomes | Low risk | Patients were either given 2.5 mg/d luseogliflozin or placebo |
| Blinding of outcome assessment (detection bias) All outcomes | Unclear risk | The study was reported to be placebo‐controlled, randomised and double‐blinded, but the method of blinding was not reported |
| Incomplete outcome data (attrition bias) All outcomes | Unclear risk | The discontinuation rate was not reported |
| Selective reporting (reporting bias) | Unclear risk | The prespecified outcomes were not available on a clinical trials database and it was unclear what the major outcomes were for the original study |
| Other bias | High risk | The sponsor of the study and maker of luseogliflozin, Taisho Pharmaceuticals collected the study data and monitored the study sites. All authors are either employed by Taisho Pharmaceutical or have received advisory board consulting fees, lectures fees, research support and grants from Taisho Pharmaceuticals |
Idorn 2013.
| Methods |
|
|
| Participants |
|
|
| Interventions | Treatment group
Control group
Other information
|
|
| Outcomes |
|
|
| Notes |
|
|
| Risk of bias | ||
| Bias | Authors' judgement | Support for judgement |
| Random sequence generation (selection bias) | Low risk | “Patients and control subjects were assigned to receive either liraglutide or pIacebo according to a computer‐generated randomisation list provided by Novo Nordisk”. |
| Allocation concealment (selection bias) | Low risk | “Patients and control subjects were assigned to receive either liraglutide or pIacebo according to a computer‐generated randomisation list provided by Novo Nordisk”. |
| Blinding of participants and personnel (performance bias) All outcomes | Low risk | “Participants, Investigators, and healthcare staff were blinded for the allocated treatment and remained so until the last patient’s last visit”. |
| Blinding of outcome assessment (detection bias) All outcomes | Low risk | “Participants, Investigators, and healthcare staff were blinded for the allocated treatment and remained so until the last patient’s last visit”. |
| Incomplete outcome data (attrition bias) All outcomes | High risk | 5/14 35% liraglutide group; 0/10 0% control group discontinued for the ESKD group. |
| Selective reporting (reporting bias) | Low risk | The prespecified outcomes were available on a clinical trials database and major outcomes were reported. |
| Other bias | High risk | Conflicts of interest: Novo Nordisk sponsored the study although the company did not participate in writing the protocol, collection, analysis and interpretation of data or writing the manuscript. All authors have either received research support, are on the advisory board, or hold shares with Novo Nordisk. Study was mildly underpowered: Based on the primary end point and with a liraglutide trough value of 20 000 pmol/L during steady state and standard deviation estimated to be 8000 pmol/L in people with normal kidney function, 10 completers in each liraglutide treatment arm and an α = 0.05 would enable the investigators to detect a difference of 10,600 pmol/L with a power of 80% (1‐ β = 0.80) using a 2 sample Student t‐test. In the ESKD arm, 9 patients completed the study. |
Ito 2011a.
| Methods |
|
|
| Participants |
|
|
| Interventions | Both groups
Treatment group
Control group
|
|
| Outcomes |
|
|
| Notes |
|
|
| Risk of bias | ||
| Bias | Authors' judgement | Support for judgement |
| Random sequence generation (selection bias) | Unclear risk | Not reported. The text just says: “subjects were then randomly split into two groups”. |
| Allocation concealment (selection bias) | Unclear risk | Insufficient information to permit judgement |
| Blinding of participants and personnel (performance bias) All outcomes | High risk | Open‐label study |
| Blinding of outcome assessment (detection bias) All outcomes | High risk | Open‐label study |
| Incomplete outcome data (attrition bias) All outcomes | High risk | None of the treatment group but 9/30 30% control group discontinued. |
| Selective reporting (reporting bias) | Unclear risk | The prespecified outcomes were not available on a clinical trials database. |
| Other bias | Low risk | There were no conflicts of interest |
Jin 2007.
| Methods |
|
|
| Participants |
|
|
| Interventions | Treatment group
Control group
Both groups
|
|
| Outcomes |
|
|
| Notes |
|
|
| Risk of bias | ||
| Bias | Authors' judgement | Support for judgement |
| Random sequence generation (selection bias) | Unclear risk | Block randomisation with stratification for stage of CKD, method of randomisation was not reported |
| Allocation concealment (selection bias) | Unclear risk | Insufficient information to permit judgement |
| Blinding of participants and personnel (performance bias) All outcomes | Unclear risk | Insufficient information to permit judgement |
| Blinding of outcome assessment (detection bias) All outcomes | Unclear risk | Insufficient information to permit judgement |
| Incomplete outcome data (attrition bias) All outcomes | Low risk | No patients discontinued. |
| Selective reporting (reporting bias) | Unclear risk | The prespecified outcomes were not available on a clinical trials database |
| Other bias | Unclear risk | Conflicts of interest were not reported. |
Kaku 2014.
| Methods |
|
|
| Participants |
|
|
| Interventions |
Treatment group 1
Treatment group 2
Control group
|
|
| Outcomes |
|
|
| Notes |
|
|
| Risk of bias | ||
| Bias | Authors' judgement | Support for judgement |
| Random sequence generation (selection bias) | Unclear risk | Study was described as randomised, method of randomisation was not reported |
| Allocation concealment (selection bias) | Unclear risk | Insufficient information to permit judgement |
| Blinding of participants and personnel (performance bias) All outcomes | Unclear risk | Reported to be double blind, but method of blinding of participants and personnel was not reported |
| Blinding of outcome assessment (detection bias) All outcomes | Unclear risk | Reported to be double blind, but method of blinding of participants and personnel was not reported |
| Incomplete outcome data (attrition bias) All outcomes | Low risk | 8/87 (9.1%) of placebo group, 5/86 (5.8%) of dapagliflozin 5 mg group and 9/88 (10.2%) of dapagliflozin 10 mg group discontinued |
| Selective reporting (reporting bias) | Unclear risk | The prespecified outcomes were not available on a clinical trials database |
| Other bias | High risk | Conflicts of interest: The study was funded by AstraZeneca and Bristol‐Myers Squibb the manufacturers of Dapagliflozin. All authors except 3 either received research funding from the sponsoring companies or were employees and share‐holders |
Kohan 2014.
| Methods |
|
|
| Participants |
|
|
| Interventions | Both groups
Treatment group 1
Treatment group 2
Control group
Other information
|
|
| Outcomes |
|
|
| Notes |
|
|
| Risk of bias | ||
| Bias | Authors' judgement | Support for judgement |
| Random sequence generation (selection bias) | Unclear risk | “On day 1, patients were randomised in a double‐blind manner to either placebo, dapagliflozin 5‐mg, or dapagliflozin 10‐mg daily, in addition to their original pre‐enrollment antidiabetic regimen.” |
| Allocation concealment (selection bias) | Unclear risk | Insufficient information to permit judgement |
| Blinding of participants and personnel (performance bias) All outcomes | Unclear risk | The study was labelled as double blind but does not describe how patients were blinded or if they were given placebo medications. |
| Blinding of outcome assessment (detection bias) All outcomes | Unclear risk | The study was labelled as double blind but does not describe how assessment was blinded |
| Incomplete outcome data (attrition bias) All outcomes | High risk | High rates of discontinuation by the end of the study. Dropout rates: At 24 weeks: 5 mg dapagliflozin 11/83 (13.3%); 10 mg dapagliflozin 16/85 (18.8%); Placebo 22/84 (26.2%) At 52 weeks: 5 mg dapagliflozin 19/83 (22.9%); 10 mg dapagliflozin; 21/85 (24.7%); Placebo 30/84 (35.7%) At 104 weeks: 5 mg dapagliflozin 38/83 (45.8%); 10 mg dapagliflozin 34/85 (40.0%); Placebo 41/84 (48.8%) |
| Selective reporting (reporting bias) | Low risk | There was an error in the study flow diagram ‐ authors missed counting one patient |
| Other bias | Low risk | Conflicts of interest: All the authors declared no competing interests. Bristol‐Myers Squibb and AstraZeneca‐supported the study |
Kothny 2015.
| Methods |
|
|
| Participants |
|
|
| Interventions | Both groups
Treatment group 1
Treatment group 2
Other information
|
|
| Outcomes |
|
|
| Notes |
|
|
| Risk of bias | ||
| Bias | Authors' judgement | Support for judgement |
| Random sequence generation (selection bias) | Low risk | “Eligible patients were randomised using interactive voice response technology (IVRS) to receive either vildagliptin (50 mg once daily) or sitagliptin (25 mg once daily)” |
| Allocation concealment (selection bias) | Low risk | “IVRS assigned a randomisation number to the patient, which was used to link the patient to a treatment arm and to specify unique medication numbers for the first package of study drug to be dispensed to the patient” |
| Blinding of participants and personnel (performance bias) All outcomes | Low risk | “Patients, investigator staff, persons performing the assessments and data analysts remained blinded to the identity of the treatment from the time of randomisation until database lock” |
| Blinding of outcome assessment (detection bias) All outcomes | Unclear risk | “Patients, investigator staff, persons performing the assessments and data analysts remained blinded to the identity of the treatment from the time of randomisation until database lock” |
| Incomplete outcome data (attrition bias) All outcomes | Low risk | 19/83 (22.9%) of the vildagliptin group and 12/65 (18.5%) of the sitagliptin group discontinued |
| Selective reporting (reporting bias) | Low risk | The prespecified outcomes were available on a clinical trials database and major outcomes were reported |
| Other bias | High risk | Conflicts of interest: This study was funded by Novartis Pharma AG, Basel, Switzerland. The sponsor was involved in study design, and collection, analysis and interpretation of data. Four of the authors are employed by and have shares with Novartis. The remaining authors are involved in clinical trials with Novartis. Novartis makes vildagliptin |
Laakso 2015.
| Methods |
|
|
| Participants |
|
|
| Interventions | Treatment group
Control group
|
|
| Outcomes |
|
|
| Notes |
|
|
| Risk of bias | ||
| Bias | Authors' judgement | Support for judgement |
| Random sequence generation (selection bias) | Unclear risk | Study was described as randomised, method of randomisation was not reported |
| Allocation concealment (selection bias) | Unclear risk | Insufficient information to permit judgement |
| Blinding of participants and personnel (performance bias) All outcomes | Low risk | Patients “were randomised 1:1 to double‐blind treatment with linagliptin 5 mg/day or placebo for 12 weeks; placebo patients were then switched to glimepiride 1–4 mg/day, with double blinding maintained using a double dummy design, and treatments continued until week 52.” |
| Blinding of outcome assessment (detection bias) All outcomes | Unclear risk | Study was reported to be double‐blind although the methodology of blinding of outcome assessment was not reported |
| Incomplete outcome data (attrition bias) All outcomes | High risk | Low risk of attrition bias at week 12: 3/113 linagliptin (2.7%) and 8/122 placebo (6.6%) discontinued by week 12. High risk of attrition bias at week 52: 18/113 linagliptin (15.9%) and 32/122 (26.2%) placebo/glimepiride discontinued by week 52 |
| Selective reporting (reporting bias) | Low risk | The prespecified outcomes were available on a clinical trials database and major outcomes were reported |
| Other bias | High risk | Conflicts of interest: This study was sponsored by Boehringer Ingelheim (BI) Pharma GmbH & Co. KG, the manufacturer of linagliptin. Authors have either served on the scientific advisory board, received grants or research support and/or received speaker honoraria from BI, or are employees of BI |
LANTERN 2015.
| Methods |
|
|
| Participants |
|
|
| Interventions | Both groups
Treatment group
Control group
Other information
|
|
| Outcomes |
|
|
| Notes |
|
|
| Risk of bias | ||
| Bias | Authors' judgement | Support for judgement |
| Random sequence generation (selection bias) | Unclear risk | Not reported. Text says: “At the end of the run‐in period, patients were randomised at a 2:1 ratio to receive 50mg ipragliflozin or placebo. Randomization was performed after stratifying patients according to RI severity”. |
| Allocation concealment (selection bias) | Unclear risk | Insufficient information to permit judgement |
| Blinding of participants and personnel (performance bias) All outcomes | Low risk | Patients received placebo or ipragliflozin |
| Blinding of outcome assessment (detection bias) All outcomes | Unclear risk | Study labelled as double‐blind however methodology of blinding of outcome assessment was but not reported. |
| Incomplete outcome data (attrition bias) All outcomes | Low risk | Low rate of discontinuation from the study For the whole cohort 12/119 10.1% treatment group and 4/46 8.7% control group discontinued For those patients with an eGFR < 60 6/58 10.3% treatment group and 3/23 13.0% control group discontinued |
| Selective reporting (reporting bias) | Low risk | The prespecified outcomes were available on a clinical trials database and major outcomes were reported |
| Other bias | High risk | Conflicts of interest: ipragliflozin (ASP1941) was developed by Astellas Pharma Inc. and Kotobuki Pharmaceutical Co., Ltd. Authors were either consultants and received consulting fees/honoraria from Astellas or were employees of Astellas Pharma Inc., Tokyo, Japan |
Leiter 2014.
| Methods |
|
|
| Participants |
|
|
| Interventions | Both groups
Treatment group 1
Treatment group 2
|
|
| Outcomes |
|
|
| Notes |
|
|
| Risk of bias | ||
| Bias | Authors' judgement | Support for judgement |
| Random sequence generation (selection bias) | Low risk | “An interactive voice response system was used for the blinded randomisation, which was based on a sequestered fixed randomisation schedule” |
| Allocation concealment (selection bias) | Low risk | “An interactive voice response system was used for the blinded randomisation, which was based on a sequestered fixed randomisation schedule” |
| Blinding of participants and personnel (performance bias) All outcomes | Low risk | “Albiglutide and matching placebo was supplied as a fixed‐dose (30 or 50 mg) pen injector system, which was injected subcutaneously into the abdomen. Sitagliptin and matching placebo were provided as overcoated tablets or capsules" |
| Blinding of outcome assessment (detection bias) All outcomes | Unclear risk | Although the study was described as double‐blind the method by which outcome assessment was blinded was not reported |
| Incomplete outcome data (attrition bias) All outcomes | High risk | High rate of discontinuation, especially in the sitagliptin group 51/254 (20.1%) of the albiglutide and 68/253 (26.9%) of the sitagliptin group discontinued |
| Selective reporting (reporting bias) | Low risk | The prespecified outcomes were available on a clinical trials database and major outcomes were reported |
| Other bias | High risk | Conflicts of interest: This study was sponsored by GlaxoSmithKline who manufactures albiglutide. All authors except one are employees and share‐holders of GlaxoSmithKline. The remaining author has received research funding from GlaxoSmithKline. |
Lewin 2012.
| Methods |
|
|
| Participants |
|
|
| Interventions | Run‐in period
Treatment group
Control group
Both groups
|
|
| Outcomes |
|
|
| Notes |
|
|
| Risk of bias | ||
| Bias | Authors' judgement | Support for judgement |
| Random sequence generation (selection bias) | Low risk | “Patients were randomised using the interactive voice response system (IVRS; Almac Clinical Technologies, Yardley, Pennsylvania) to ensure that the investigator did not know to which of the 2 treatment groups the next patient would belong” |
| Allocation concealment (selection bias) | Low risk | “Patients were randomised using the interactive voice response system (IVRS; Almac Clinical Technologies, Yardley, Pennsylvania) to ensure that the investigator did not know to which of the 2 treatment groups the next patient would belong” |
| Blinding of participants and personnel (performance bias) All outcomes | Low risk | The study was labelled as double‐blind. Patients were given either linagliptin or placebo |
| Blinding of outcome assessment (detection bias) All outcomes | Unclear risk | Although the study was labelled as double‐blind, the method through which outcome assessment was blinded was not reported |
| Incomplete outcome data (attrition bias) All outcomes | Low risk | 10/161 (6.21%) in the linagliptin plus sulphonylurea group versus 7/84 (1.19%) in the sulphonylurea group discontinued |
| Selective reporting (reporting bias) | Low risk | The prespecified outcomes were available on a clinical trials database and major outcomes were reported |
| Other bias | High risk | Conflicts of interest: The study was initiated and supported by Boehringer Ingelheim, the manufacturer of linagliptin. Boehringer Ingelheim financially supported the medical writing and editorial assistance. Authors were either employees of Boehringer Ingelheim or received honoraria for attending meetings, consultancy fees, speaker fees and/or travel grants from Boehringer Ingelheim |
LIRA‐RENAL 2016.
| Methods |
|
|
| Participants |
|
|
| Interventions | Treatment group
Control group
Both groups
|
|
| Outcomes |
|
|
| Notes |
|
|
| Risk of bias | ||
| Bias | Authors' judgement | Support for judgement |
| Random sequence generation (selection bias) | Low risk | Randomised using a sponsor‐provided telephone or Web‐based randomisation system. |
| Allocation concealment (selection bias) | Low risk | Randomised using a sponsor‐provided telephone or Web‐based randomisation system. |
| Blinding of participants and personnel (performance bias) All outcomes | Low risk | “Trial site personnel, patients, and the sponsor remained blinded until trial completion”. |
| Blinding of outcome assessment (detection bias) All outcomes | Low risk | “Trial site personnel, patients, and the sponsor remained blinded until trial completion”. |
| Incomplete outcome data (attrition bias) All outcomes | High risk | Discontinuation rates were moderately high: 35/140 (25%) from the liraglutide group versus 34/137 (24.8%) in the control group |
| Selective reporting (reporting bias) | Low risk | The prespecified outcomes were available on a clinical trials database and major outcomes were reported |
| Other bias | High risk | Conflicts of interest: The study was sponsored by Novo Nordisk who developed and sells liraglutide. All authors have either been on the advisory panel for Novo Nordisk, received research support or educational grants from Novo Nordisk or work for Novo Nordisk |
Lukashevich 2011.
| Methods |
|
|
| Participants |
|
|
| Interventions | Run‐in period
Treatment group
Control group
Both group
|
|
| Outcomes |
|
|
| Notes |
|
|
| Risk of bias | ||
| Bias | Authors' judgement | Support for judgement |
| Random sequence generation (selection bias) | Unclear risk | Study was described as randomised, method of randomisation was not reported |
| Allocation concealment (selection bias) | Unclear risk | Insufficient information to permit judgement |
| Blinding of participants and personnel (performance bias) All outcomes | Low risk | “The investigators and patients remained blinded to the identity of the treatment”. |
| Blinding of outcome assessment (detection bias) All outcomes | Low risk | “The investigators and patients remained blinded to the identity of the treatment”. |
| Incomplete outcome data (attrition bias) All outcomes | High risk | High rate of discontinuation across both treatment groups in those with moderate CKD (52/165 (31.5%) from the vildagliptin group and 40/129 (31.0%) from the placebo group) and severe CKD (41/124 (33.1%) from the vildagliptin group and 41/97 (42.3%) from the placebo group). |
| Selective reporting (reporting bias) | Unclear risk | The prespecified outcomes were not available on a clinical trials database |
| Other bias | High risk | "P.‐H. G. has served on advisory boards for Novartis, Boehringer Ingelheim and Cebix, has received honoraria for speaking engagements from Novartis, Boehringer Ingelheim, Novo‐Nordisk, Eli Lilly, Genzyme and MSD Finland and received research support from Eli Lilly. V. L., Q. S., A. S.and W. K. are employed by and own shares in Novartis." |
McGill 2013.
| Methods |
|
|
| Participants |
|
|
| Interventions | Run‐in period
Treatment group
Control group
Both groups
|
|
| Outcomes |
|
|
| Notes |
|
|
| Risk of bias | ||
| Bias | Authors' judgement | Support for judgement |
| Random sequence generation (selection bias) | Unclear risk | Study was described as randomised, method of randomisation was not reported |
| Allocation concealment (selection bias) | Unclear risk | Insufficient information to permit judgement |
| Blinding of participants and personnel (performance bias) All outcomes | Low risk | “Study investigators and participants were blinded to treatment assignment for the duration of the study and to results of interim analyses” |
| Blinding of outcome assessment (detection bias) All outcomes | Low risk | “Study investigators and participants were blinded to treatment assignment for the duration of the study and to results of interim analyses” |
| Incomplete outcome data (attrition bias) All outcomes | High risk | Moderately large discontinuation rate across both groups: 19/68 (27.9%) of the linagliptin group and 17/65 (26.2%) of the placebo group |
| Selective reporting (reporting bias) | Unclear risk | The prespecified outcomes were not available on a clinical trials database |
| Other bias | High risk | The study was sponsored by Boehringer Ingelheim. Authors were either employees of Boehringer Ingelheim or have spoken for or served as a consultant for Boehringer Ingelheim |
Mohideen 2005.
| Methods |
|
|
| Participants |
|
|
| Interventions | Treatment group
Control group
|
|
| Outcomes |
|
|
| Notes |
|
|
| Risk of bias | ||
| Bias | Authors' judgement | Support for judgement |
| Random sequence generation (selection bias) | Low risk | “Eligible subjects were randomised to either with troglitazone or without troglitazone (control) group using a table of random numbers assigned by an independent investigator” |
| Allocation concealment (selection bias) | Unclear risk | “Eligible subjects were randomised to either with troglitazone or without troglitazone (control) group using a table of random numbers assigned by an independent investigator”. But for second phase, subjects were given the option of crossing over into the Troglitazone arm. This give a risk of selection bias. The risk is removed if we analyse first phase data only as per the protocol |
| Blinding of participants and personnel (performance bias) All outcomes | High risk | Open‐label study |
| Blinding of outcome assessment (detection bias) All outcomes | High risk | Open‐label study |
| Incomplete outcome data (attrition bias) All outcomes | High risk | 3/6 (50%) of the troglitazone arm and 1/6 (16.7%) of the control arm discontinued |
| Selective reporting (reporting bias) | Unclear risk | The prespecified outcomes were not available on a clinical trials database |
| Other bias | High risk | Conflicts of interest: The study was supported in part by Pfizer, Inc |
Mori 2016.
| Methods |
|
|
| Participants |
|
|
| Interventions | Treatment group 1
Treatment group 2
|
|
| Outcomes |
|
|
| Notes |
|
|
| Risk of bias | ||
| Bias | Authors' judgement | Support for judgement |
| Random sequence generation (selection bias) | Unclear risk | Insufficient information to permit judgement |
| Allocation concealment (selection bias) | Unclear risk | Insufficient information to permit judgement |
| Blinding of participants and personnel (performance bias) All outcomes | High risk | Open‐label study |
| Blinding of outcome assessment (detection bias) All outcomes | High risk | Open‐label study |
| Incomplete outcome data (attrition bias) All outcomes | High risk | There was higher discontinuation in voglibose compared to the linagliptin group: 6/38 (15.8%) in the voglibose group and 3/40 (7.5 %) in the linagliptin group. Data were analysed using the full analysis set with the last observation carried forward |
| Selective reporting (reporting bias) | Unclear risk | Prespecified outcomes were available on a public database and were reported |
| Other bias | High risk | The authors received unrestricted research grants from Mitsubishi Tanabe Pharma Corporation, Daiichi Sankyo Co., Astellas Pharma, Asahi Kasei Pharm Corporation, Kyowa Hakko Kirin Co., Chugai Pharmaceutical Co., Teijin Pharma, Takeda Pharmaceutical Company, and Ono Pharmaceutical Co. All but one of the authors received honorarium for lecturing from Nippon Boehringer Ingelheim. Takeda produces voglibose, and Nippon Boehringer Ingelheim linagliptin |
Nakamura 2001.
| Methods |
|
|
| Participants |
|
|
| Interventions | Treatment group
Control group
|
|
| Outcomes |
|
|
| Notes |
|
|
| Risk of bias | ||
| Bias | Authors' judgement | Support for judgement |
| Random sequence generation (selection bias) | Unclear risk | Study was described as randomised, method of randomisation was not reported |
| Allocation concealment (selection bias) | Unclear risk | Insufficient information to permit judgement |
| Blinding of participants and personnel (performance bias) All outcomes | Low risk | Patients were given a placebo tablet |
| Blinding of outcome assessment (detection bias) All outcomes | Unclear risk | Insufficient information to permit judgement |
| Incomplete outcome data (attrition bias) All outcomes | Low risk | No patients discontinued |
| Selective reporting (reporting bias) | Unclear risk | The prespecified outcomes were not available on a clinical trials database |
| Other bias | Unclear risk | Conflicts of interest were not reported |
Nowicki 2011.
| Methods |
|
|
| Participants |
|
|
| Interventions | Run‐in period
Treatment group
Control group
Both groups
|
|
| Outcomes |
|
|
| Notes |
|
|
| Risk of bias | ||
| Bias | Authors' judgement | Support for judgement |
| Random sequence generation (selection bias) | Low risk | “Using CrCl estimated by the Cockcroft‐Gault equation (23), patients were stratified by degree of renal impairment: moderate (CrCl ≥ 30 and < 50 mL ⁄ min), severe (CrCl < 30 mL ⁄ min and not receiving dialysis) or end‐stage renal disease (ESRD) on haemodialysis at baseline. Patients were randomised 1 : 1 via an interactive voice response system in balanced blocks within each renal impairment category to once‐daily double‐blind treatment with saxagliptin 2.5 mg or placebo” |
| Allocation concealment (selection bias) | Unclear risk | “Using CrCl estimated by the Cockcroft‐Gault equation (23), patients were stratified by degree of renal impairment: moderate (CrCl ≥30 and < 50 mL ⁄ min), severe (CrCl < 30 mL ⁄ min and not receiving dialysis) or end‐stage renal disease (ESRD) on haemodialysis at baseline. Patients were randomised 1 : 1 via an interactive voice response system in balanced blocks within each renal impirment category to once‐daily double‐blind treatment with saxagliptin 2.5 mg or placebo”. |
| Blinding of participants and personnel (performance bias) All outcomes | Low risk | “Blinding was ensured using a single‐dummy technique”. |
| Blinding of outcome assessment (detection bias) All outcomes | Unclear risk | Study labelled as a double‐blind study. Otherwise, method of blinding was not described |
| Incomplete outcome data (attrition bias) All outcomes | High risk | There was high discontinuation in both groups: 43/85 (50.6%) in the saxagliptin group and 35/85 (41.2%) in the control group |
| Selective reporting (reporting bias) | Low risk | The prespecified outcomes were available on a clinical trials database and major outcomes were reported |
| Other bias | High risk | Conflicts of interest: The study was funded, designed and supervised by scientists at Bristol‐Myers Squibb and AstraZeneca. Three of the authors were employees of Astra Zeneca, the maker of saxagliptin. Two of the authors are either study investigators for Astra Zeneca or have received speaking honoraria. |
Pfutzner 2011.
| Methods |
|
|
| Participants |
|
|
| Interventions | Treatment group
Control group
Both groups
|
|
| Outcomes |
|
|
| Notes |
|
|
| Risk of bias | ||
| Bias | Authors' judgement | Support for judgement |
| Random sequence generation (selection bias) | Unclear risk | Study was described as randomised, method of randomisation was not reported |
| Allocation concealment (selection bias) | Unclear risk | Insufficient information to permit judgement |
| Blinding of participants and personnel (performance bias) All outcomes | Low risk | “After written informed consent was obtained from each participant, patients were randomised to either receive an additional treatment with pioglitazone (1 x 30 mg/day at breakfast) or placebo for 6 months”. Also the study was reported to be a double‐blind study. |
| Blinding of outcome assessment (detection bias) All outcomes | Unclear risk | Insufficient information to permit judgement |
| Incomplete outcome data (attrition bias) All outcomes | High risk | There was greater discontinuation in the control group compared to the pioglitazone group: 4/19 (21.1%) pioglitazone versus 6/17 (35.3%) control group. |
| Selective reporting (reporting bias) | Unclear risk | The prespecified outcomes were not available on a clinical trials database |
| Other bias | High risk | Conflicts of interest: The study was sponsored by TAKEDA Pharma GmbH, Aachen, Germany. |
Ruggenenti 2003a.
| Methods |
|
|
| Participants |
|
|
| Interventions | Treatment group
Control group
|
|
| Outcomes |
|
|
| Notes |
|
|
| Risk of bias | ||
| Bias | Authors' judgement | Support for judgement |
| Random sequence generation (selection bias) | Unclear risk | Study was described as randomised, method of randomisation was not reported |
| Allocation concealment (selection bias) | Unclear risk | Insufficient information to permit judgement |
| Blinding of participants and personnel (performance bias) All outcomes | Unclear risk | Insufficient information to permit judgement |
| Blinding of outcome assessment (detection bias) All outcomes | Unclear risk | Insufficient information to permit judgement |
| Incomplete outcome data (attrition bias) All outcomes | Low risk | There were no discontinuations |
| Selective reporting (reporting bias) | Unclear risk | The prespecified outcomes were not available on a clinical trials database |
| Other bias | High risk | Conflicts of interest: The study was sponsored partially by Eli Lilly Florence Italy |
SAVOR‐TIMI 53 2011.
| Methods |
|
|
| Participants |
|
|
| Interventions | Treatment group
Control group
Both groups
|
|
| Outcomes |
|
|
| Notes |
|
|
| Risk of bias | ||
| Bias | Authors' judgement | Support for judgement |
| Random sequence generation (selection bias) | Low risk | Patients were randomised via a central computerized telephone or Web‐based system in blocks of 4, with stratification according to the qualifying CVD state and kidney function |
| Allocation concealment (selection bias) | Low risk | Patients were randomised via a central computerized telephone or Web‐based system in blocks of 4, with stratification according to the qualifying CVD state and kidney function |
| Blinding of participants and personnel (performance bias) All outcomes | Low risk | "Saxagliptin or placebo was administered in a blinded fashion until the end of the follow‐up period" |
| Blinding of outcome assessment (detection bias) All outcomes | Low risk | "No member of the study delivery team at AstraZeneca or BMS or representative, personnel at study centres or any clinical research organisation (CRO) handling data will have access to the randomisation scheme during the conduct of the study" |
| Incomplete outcome data (attrition bias) All outcomes | Low risk | Low rate of attrition:‐ 202/8280 (2.4%) in the Saxagliptin group; 214/8212 (2.6%) in the placebo group |
| Selective reporting (reporting bias) | Low risk | The prespecified outcomes were available on a clinical trials database and all major outcomes were reported |
| Other bias | High risk | Conflicts of interest: The study was sponsored by AstraZeneca and Bristol‐Myers Squibb and designed by the TIMI Study Group and Hadassah Medical Organization in conjunction with the sponsors, who provided monitoring support and donated the drug. All authors except one author either received grant support, consulting fees and/or lecture fees from AstraZeneca and Bristol‐Myers Squibb or are employees of AstraZeneca or Bristol‐Myers Squibb |
Scarpioni 1994.
| Methods |
|
|
| Participants |
|
|
| Interventions | Treatment group
Control group
Both groups
|
|
| Outcomes |
|
|
| Notes |
|
|
| Risk of bias | ||
| Bias | Authors' judgement | Support for judgement |
| Random sequence generation (selection bias) | Unclear risk | Study was described as randomised, method of randomisation was not reported |
| Allocation concealment (selection bias) | Unclear risk | Insufficient information to permit judgement |
| Blinding of participants and personnel (performance bias) All outcomes | Unclear risk | Insufficient information to permit judgement |
| Blinding of outcome assessment (detection bias) All outcomes | Unclear risk | Insufficient information to permit judgement |
| Incomplete outcome data (attrition bias) All outcomes | Low risk | No discontinuations occurred |
| Selective reporting (reporting bias) | Unclear risk | The prespecified outcomes were not available on a clinical trials database. All outcomes were reported |
| Other bias | High risk | No washout period documented, therefore potential for carryover effect. No conflicts of interest documented |
TECOS 2013.
| Methods |
|
|
| Participants |
|
|
| Interventions | Treatment group
Control group
|
|
| Outcomes |
|
|
| Notes |
|
|
| Risk of bias | ||
| Bias | Authors' judgement | Support for judgement |
| Random sequence generation (selection bias) | Low risk | "An interactive voice‐response system assigned the study medication in a double‐blind manner, blocked within each site" |
| Allocation concealment (selection bias) | Low risk | "An interactive voice‐response system assigned the study medication in a double‐blind manner, blocked within each site" |
| Blinding of participants and personnel (performance bias) All outcomes | Low risk | "An interactive voice‐response system assigned the study medication in a double‐blind manner, blocked within each site" |
| Blinding of outcome assessment (detection bias) All outcomes | Low risk | "A clinical events committee (CEC), blinded to treatment allocation and independent of the sponsor, will adjudicate events including cardiovascular‐related death, non‐fatal MI, nonfatal stroke, unstable angina requiring hospitalization, congestive heart failure requiring hospitalization, and acute pancreatitis" |
| Incomplete outcome data (attrition bias) All outcomes | Low risk | Low rate of discontinuation for the whole population (not just eGFR < 60) in both sitagliptin arm (360/7332; 4.9%) and placebo arm (434/7339; 5.9%) |
| Selective reporting (reporting bias) | Low risk | The prespecified outcomes were available on a clinical trials database and all major outcomes were reported |
| Other bias | High risk | Conflicts of interest: The study was supported by Merck, the manufacturer of sitagliptin. All authors except 2, either received research grants, consulting fees, travel reimbursements and/or speaker fees from Merck or were employees of Merck with shares in the company |
Wong 2005.
| Methods |
|
|
| Participants |
|
|
| Interventions | Treatment group
Control group
Both groups
|
|
| Outcomes |
|
|
| Notes |
|
|
| Risk of bias | ||
| Bias | Authors' judgement | Support for judgement |
| Random sequence generation (selection bias) | Low risk | A computer generalized list was used for randomisation |
| Allocation concealment (selection bias) | Low risk | "Investigators were unaware of the randomisation schedule when recruiting patients" |
| Blinding of participants and personnel (performance bias) All outcomes | High risk | "investigators and patients were not blinded during the follow‐up period" |
| Blinding of outcome assessment (detection bias) All outcomes | High risk | "investigators and patients were not blinded during the follow‐up period" |
| Incomplete outcome data (attrition bias) All outcomes | Low risk | No discontinuations were reported |
| Selective reporting (reporting bias) | Unclear risk | The prespecified outcomes were available on a clinical trials database |
| Other bias | Low risk | Conflicts of interest: Rosiglitazone was provided by GLaxoSmithKline UK, with no other funding involved |
Yale 2013.
| Methods |
|
|
| Participants |
|
|
| Interventions | Treatment group 1
Treatment group 2
Control group
All groups
|
|
| Outcomes |
|
|
| Notes |
|
|
| Risk of bias | ||
| Bias | Authors' judgement | Support for judgement |
| Random sequence generation (selection bias) | Low risk | An Interactive Voice Response System/Interactive Web Response System was used for randomisation |
| Allocation concealment (selection bias) | Low risk | An Interactive Voice Response System/Interactive Web Response System was used for randomisation |
| Blinding of participants and personnel (performance bias) All outcomes | Low risk | Patients received canagliflozin at 100 or 300 mg or placebo |
| Blinding of outcome assessment (detection bias) All outcomes | Unclear risk | Study was labelled as a double‐blind placebo controlled study, but the methodology for the blinding of outcome assessment was not described |
| Incomplete outcome data (attrition bias) All outcomes | High risk | 23/90 (25.6%) from the canagliflozin 100 mg; 13/89 (14.6%) from the canagliflozin 300 mg group; and 26/90 (28.9%) from the placebo group did not complete the study |
| Selective reporting (reporting bias) | Low risk | All major outcomes were reported and the prespecified outcomes were available on a clinical trials database |
| Other bias | High risk | Conflicts of interest: All authors except one are either employees of Janssen or have received research support, served on the advisory panels for, and/or served as a lecturer for Janssen or Johnson and Johnson. Janssen, a division of Johnson and Johnson markets canagliflozin |
Yki‐Järvinen 2013.
| Methods |
|
|
| Participants |
|
|
| Interventions | Run‐in period
Treatment group
Control group
Both groups
|
|
| Outcomes |
|
|
| Notes |
|
|
| Risk of bias | ||
| Bias | Authors' judgement | Support for judgement |
| Random sequence generation (selection bias) | Low risk | “Treatment assignment was determined by computer‐generated random sequence with an interactive voice response system” |
| Allocation concealment (selection bias) | Low risk | “Treatment assignment was determined by computer‐generated random sequence with an interactive voice response system” |
| Blinding of participants and personnel (performance bias) All outcomes | Low risk | The study was reported to be double‐blind, and patients received placebo medication if they were not prescribed linagliptin |
| Blinding of outcome assessment (detection bias) All outcomes | Unclear risk | Insufficient information to permit judgement |
| Incomplete outcome data (attrition bias) All outcomes | Low risk | 88/631 (13.9%) of the linagliptin group and 110/630 (17.5%) of the control group discontinued |
| Selective reporting (reporting bias) | Low risk | The prespecified outcomes were available on a clinical trials database and major outcomes were reported |
| Other bias | High risk | Conflicts of interest: The study was sponsored by Boehringer Ingelheim. Authors either received research support, received consulting fees and/or served on scientific advisory committee and received honoraria, or were employees of Boehringer Ingelheim |
Zambrowicz 2015.
| Methods |
|
|
| Participants |
|
|
| Interventions | Treatment group
Control group
|
|
| Outcomes |
|
|
| Notes |
|
|
| Risk of bias | ||
| Bias | Authors' judgement | Support for judgement |
| Random sequence generation (selection bias) | Unclear risk | Study was described as randomised, method of randomisation was not reported |
| Allocation concealment (selection bias) | Unclear risk | Insufficient information to permit judgement |
| Blinding of participants and personnel (performance bias) All outcomes | Low risk | Participants received LX4211 or placebo. study also described as double blind |
| Blinding of outcome assessment (detection bias) All outcomes | Low risk | Although the study was described as double blind, the methodology behind outcome assessment blinding was not described |
| Incomplete outcome data (attrition bias) All outcomes | Low risk | Only 1 patient 1/16 (6.3%) of the LX4211 group discontinued. No patients discontinued from the placebo arm |
| Selective reporting (reporting bias) | Low risk | Protocol available. All major outcomes reported |
| Other bias | High risk | Conflicts of interest: All authors were employees of Lexicon Pharmaceuticals who funded the study and was responsible for the study design, interpretation of the data, writing of the manuscript, and the decision to submit the manuscript |
ABPM ‐ ambulatory blood pressure monitoring; AE ‐ adverse event/s; AKI ‐ acute kidney injury; ALT ‐ alanine aminotransferase; ALP ‐ alkaline phosphatase; AST ‐ aspartate aminotransferase; BCC ‐ basal cell carcinoma; BGL ‐ blood glucose level/s; BMI ‐ body mass index; BP ‐ blood pressure; BUN ‐ blood urea nitrogen; CAPD ‐ continuous ambulatory peritoneal dialysis; CrCl ‐ creatinine clearance; CRP ‐ C‐reactive protein; CTR ‐ cardiothoracic ratio; CVD ‐ cardiovascular disease; DBP ‐ diastolic blood pressure; DKD ‐ diabetic kidney disease; DM ‐ diabetes mellitus; eGFR ‐ estimated glomerular filtration rate; ESA ‐ erythropoietin stimulating agent/s; ESKD ‐ end‐stage kidney disease; FBG ‐ fasting blood glucose; GI ‐ gastrointestinal; GA ‐ glycated albumin; Hb ‐ haemoglobin; HbA1c ‐ haemoglobin A1c (glycated); HD ‐ haemodialysis; HDL ‐ high‐density lipoprotein; HIV ‐ human immunodeficiency virus; HOMA‐IR ‐ homeostasis model assessment for insulin resistance; IP ‐ intraperitoneal; iPTH ‐ intact parathyroid hormone; LDH ‐ lactate dehydrogenase; LDL ‐ low‐density lipoprotein; MDRD ‐ Modification of Diet in Renal Disease; M/F ‐ male/female; MI ‐ myocardial infarction; NYHA ‐ New York Heart Association; NSAID ‐ nonsteroidal anti‐inflammatory drugs; PAH ‐ paraminohippuric acid; PD ‐ peritoneal dialysis; RBC ‐ red blood cell/s; RCT‐ randomised controlled trial; RRT ‐ renal replacement therapy; SBP ‐ systolic blood pressure; SC‐ subcutaneous; SCr ‐ serum creatinine; SD ‐ standard deviation; SEM ‐ standard error of the mean; TIA ‐ transient ischaemic attack; UACR ‐ urinary albumin/creatinine ratio; UAER ‐ urinary albumin excretion ratio; ULN ‐ upper limit of normal; UTI ‐ urinary tract infection
Characteristics of excluded studies [ordered by study ID]
| Study | Reason for exclusion |
|---|---|
| ACCORD 2007 | Wrong intervention: comparing intensive versus less intensive glucose targets |
| ADOPT 2011 | Wrong study population: not in patients with diabetes and an eGFR < 60 |
| ADVANCE 2001 | Wrong intervention: comparing intensive versus less intensive glucose targets |
| Agarwal 2005 | Inadequate information: data for subgroup of patients with an eGFR < 60 not available from authors |
| Aljabri 2004 | Wrong study population: not in patients with diabetes and an eGFR < 60 |
| Amador‐Licona 2000 | Wrong study population: not in patients with diabetes and an eGFR < 60 |
| Aoki 1995 | Wrong intervention: insulin is not being used as glucose‐lowering agent |
| APRIME 2011 | Wrong study population: not in patients with diabetes and an eGFR < 60 |
| Bakris 2006 | Wrong study population: not in patients with diabetes and an eGFR < 60 |
| Bangstad 1992 | Wrong study population: not in patients with diabetes and an eGFR < 60 |
| BARI 2D 2011 | Wrong intervention: not comparing specific glucose‐lowering agents but comparing insulin sensitiser versus insulin provision therapy |
| Barnett 1984 | Wrong intervention: intervention was not a glucose‐lowering agent |
| CANTATA‐SU 2016 | Wrong study population: not in patients with diabetes and an eGFR < 60 |
| Cao 2005 | Wrong study population: not in patients with diabetes and an eGFR < 60 |
| Chacra 2009 | Wrong study population: not in patients with diabetes and an eGFR < 60 |
| Chen 2004b | Wrong study population: no information concerning whether patients had an eGFR < 60 |
| Chen 2006h | Wrong study population: no information concerning whether patients had an eGFR < 60 |
| Christensen 1986 | Wrong study population: not in patients with diabetes and an eGFR < 60 |
| Christensen 2001c | Wrong intervention: intervention was not a glucose‐lowering agent |
| Chu 2006 | Wrong intervention: intervention was not a glucose‐lowering agent |
| Ciavarella 1985 | Wrong study population: not in patients with diabetes and an eGFR < 60 |
| Dailey 2000 | Wrong intervention: insulin is not being used as glucose‐lowering agent |
| Davidson 2007 | Wrong study population: no information concerning whether patients had an eGFR < 60 |
| DCCT 1986 | Wrong study population: not in patients with diabetes and an eGFR < 60 |
| de Boer 2013 | Wrong intervention: intervention was not a glucose‐lowering agent. |
| DeFronzo 2009 | Wrong study population: not in patients with diabetes and an eGFR < 60 |
| Derosa 2004 | Wrong study population: not in patients with diabetes and an eGFR < 60 |
| Di Mauro 2001 | Wrong intervention: intervention was not a glucose lowering‐agent |
| Didjurgeit 2002 | Wrong intervention: intervention was not a glucose‐lowering agent |
| DNETT Japan 2010 | Wrong intervention: intervention was not a glucose‐lowering agent |
| Einhorn 2000 | Wrong study population: not in patients with diabetes and an eGFR < 60 |
| Fadini 2016 | No relevant outcomes (looks at progenitor cells and monocyte phenotypes) |
| Fang 2007 | Wrong study population: no information concerning whether patients had an eGFR < 60 |
| Feldt‐Rasmussen 1986 | Wrong study population: not in patients with diabetes and an eGFR < 60 |
| Frederich 2012 | Wrong study population: not in patients with diabetes and an eGFR < 60 |
| Gadallah 2000b | Wrong study population: not in patients with diabetes and an eGFR < 60 |
| Gan 2007 | Wrong study population: no information concerning whether patients had an eGFR < 60 |
| Gao 2006a | Wrong study population: no information concerning whether patients had an eGFR < 60 |
| Gao 2007a | Wrong study population: no information concerning whether patients had an eGFR < 60 |
| Gao 2007b | Wrong study population: no information concerning whether patients had an eGFR < 60 |
| GEMINI 2005 | Wrong intervention: intervention was not a glucose‐lowering agent |
| Goicolea 2002 | Wrong intervention: intervention was not a glucose‐lowering agent |
| He 2004 | Wrong study population: no information concerning whether patients had an eGFR < 60 |
| Hollander 2009 | Wrong study population: not in patients with diabetes and an eGFR < 60 |
| Holman 1983 | Wrong study population: not in patients with diabetes and an eGFR < 60 |
| Hu 2007 | Wrong study population: no information concerning whether patients had an eGFR < 60 |
| Hu 2010 | Wrong study population: not in patients with diabetes and an eGFR < 60 |
| Huang 2004 | Wrong study population: no information concerning whether patients had an eGFR < 60 |
| Huang 2006 | Wrong study population: no information concerning whether patients had an eGFR < 60 |
| Huang 2007 | Wrong study population: no information concerning whether patients had an eGFR < 60 |
| Imano 1998 | Wrong study population: no information concerning whether patients had an eGFR < 60 |
| Inagaki 2014 | No relevant outcomes (pharmacokinetic and pharmacodynamic study) |
| Jerums 1987 | Wrong study population: not in patients with diabetes and an eGFR < 60 |
| Kadhim 2006 | Wrong intervention: intervention was not a glucose‐lowering agent |
| Kadowaki 2014 | Wrong study population: not in patients with diabetes and an eGFR < 60 |
| Karalliedde 2006 | Wrong intervention: intervention was not a glucose‐lowering agent |
| Katavetin 2006 | Inadequate information: unable to get information about patients with an eGFR < 60 |
| Kim 2003 | Wrong study population: no information concerning whether patients had an eGFR < 60 |
| Kirk 1999 | Wrong study population: not in patients with diabetes and an eGFR < 60 |
| KUMAMOTO 1995 | Wrong study population: no information concerning whether patients had an eGFR < 60 |
| Lebovitz 2001 | Wrong study population: no information concerning whether patients had an eGFR < 60 |
| Leslie 2008 | Wrong study population: not in patients with diabetes and an eGFR < 60 |
| Li 2004a | Wrong study population: no information concerning whether patients had an eGFR < 60 |
| Li 2006e | Wrong study population: no information concerning whether patients had an eGFR < 60 |
| Li 2008f | Wrong study population: no information concerning whether patients had an eGFR < 60 |
| Li 2008g | Wrong study population: not in patients with diabetes and an eGFR < 60 |
| Lu 2010 | Wrong intervention: intervention was not a glucose‐lowering agent |
| Matthews 2005 | Wrong study population: no information concerning whether patients had an eGFR < 60 |
| MEMO 2011 | Wrong intervention: intervention was not a glucose‐lowering agent |
| Miyazaki 2007 | Wrong study population: not in patients with diabetes and an eGFR < 60 |
| Nakamura 2000b | Wrong study population: not in patients with diabetes and an eGFR < 60 |
| Nakamura 2001b | Wrong study population: not in patients with diabetes and an eGFR < 60 |
| Nakamura 2004 | Wrong study population: not in patients with diabetes and an eGFR < 60 |
| Nakamura 2006a | Wrong study population: not in patients with diabetes and an eGFR < 60 |
| NCT00708981 | Wrong intervention: intervention was not a glucose‐lowering agent |
| NCT01245166 | Wrong study population: no information concerning whether patients had an eGFR < 60 |
| Nishimura 2015 | Wrong study population: not in patients with diabetes and an eGFR < 60 |
| OSLO 1986 | Wrong study population: no information concerning whether patients had an eGFR < 60 |
| Ostman 1998 | Wrong intervention: intervention was not a glucose‐lowering agent |
| Pan 2012 | Wrong study population: not in patients with diabetes and an eGFR < 60 |
| Petrica 2009 | Wrong study population: not in patients with diabetes and an eGFR < 60 |
| Pistrosch 2004 | Wrong study population: no information concerning whether patients had an eGFR < 60 |
| Pistrosch 2005 | Wrong study population: not in patients with diabetes and an eGFR < 60 |
| Pistrosch 2012 | Wrong study population: not in patients with diabetes and an eGFR < 60 |
| PIVIT 2010 | Wrong intervention: insulin was not being used as a glucose‐lowering agent |
| Pomerleau 1993 | Wrong intervention: intervention was not a glucose‐lowering agent |
| QUARTET 2004 | Wrong study population: no information concerning whether patients had an eGFR < 60 |
| Reinhard 2013 | Wrong intervention: intervention looking at bioactive IGF‐I and inflammatory biomarkers |
| Rosenstock 2009 | Wrong study population: not in patients with diabetes and an eGFR < 60 |
| SDIS 1988 | Wrong study population: not in patients with diabetes and an eGFR < 60 |
| Seino 2015 | Inadequate information: unable to get information about patients with an eGFR < 60 from authors |
| SESTA R 2011 | Wrong study population: not in patients with diabetes and an eGFR < 60 |
| Shata'er 2007 | Wrong study population: no information concerning whether patients had an eGFR < 60 |
| SPEAD‐A 2013 | Wrong study population: not in patients with diabetes and an eGFR < 60 |
| Stein 2014 | Wrong study population: not in patients with diabetes and an eGFR < 60 |
| STENO‐2 1999 | Wrong intervention: intervention was not a glucose‐lowering agent |
| Strojek 2011 | Wrong study population: not in patients with diabetes and an eGFR < 60 |
| Su 2006 | Wrong study population: no information concerning whether patients had an eGFR < 60 |
| Sun 2006 | Wrong study population: no information concerning whether patients had an eGFR < 60 |
| Tan 2006 | Wrong study population: no information concerning whether patients had an eGFR < 60 |
| Tang 2007 | Wrong study population: no information concerning whether patients had an eGFR < 60 |
| Thrasher 2012 | Wrong study population: no information concerning whether patients had an eGFR < 60 |
| UKPDS 1991 | Wrong intervention ‐ examining "more intensive" versus "less intensive" glucose targets |
| UKPDS‐HD 1998 | Wrong intervention: examining "more intensive" versus "less intensive" glucose targets |
| VA‐CSDM 1992 | Wrong intervention: examining "more intensive" versus "less intensive" glucose targets |
| Viswanathan 1990 | Inadequate information: unable to get information about patients with an eGFR < 60 from authors |
| Vos 2011 | Wrong study population: not in patients with diabetes and an eGFR < 60 |
| Wang 2004 | Wrong study population: no information concerning whether patients had an eGFR < 60 |
| Wang 2005b | Wrong study population: no information concerning whether patients had an eGFR < 60 |
| Wang 2005c | Wrong study population: no information concerning whether patients had an eGFR < 60 |
| Wang 2006 | Wrong study population: no information concerning whether patients had an eGFR < 60 |
| Wang 2008e | Wrong study population: no information concerning whether patients had an eGFR < 60 |
| Wiseman 1985 | Wrong study population: not in patients with diabetes and an eGFR < 60 |
| Xu 2005 | Wrong study population: no information concerning whether patients had an eGFR < 60 |
| Yang 2011a | Wrong study population: no information concerning whether patients had an eGFR < 60 |
| Yokoyama 2009 | No relevant outcomes (serum cystatin C levels) |
| Zhang 2007c | Wrong study population: no information concerning whether patients had an eGFR < 60 |
| Zhang 2012a | Wrong study population: not in patients with diabetes and an eGFR < 60 |
| Zhao 2007 | Wrong study population: no information concerning whether patients had an eGFR < 60 |
| Zheng 2006 | Wrong study population: no information concerning whether patients had an eGFR < 60 |
| Zhou 2003 | Wrong study population: no information concerning whether patients had an eGFR < 60 |
| Zhou 2007 | Wrong study population: no information concerning whether patients had an eGFR < 60 |
| Zhu 2007 | Wrong study population: no information concerning whether patients had an eGFR < 60 |
| Zou 2005 | Wrong study population: no information concerning whether patients had an eGFR < 60 |
eGFR ‐ estimated glomerular filtration rate
Characteristics of studies awaiting assessment [ordered by study ID]
AWARD‐7 2017.
| Methods | Open‐label, parallel RCT over 26 weeks |
| Participants |
|
| Interventions | Treatment group 1
Treatment group 1
|
| Outcomes |
|
| Notes |
|
Chacra 2017.
| Methods | This was a randomised, placebo‐controlled, parallel‐group, double‐blind, multicentre, multinational study. Study duration was up to 69 weeks, including a 1‐week screening period, an 8‐week “wash‐off” period (for patients on oral glucose‐lowering agents at screening), a 2‐week single‐blind placebo run‐in period, a 54‐week double‐blind treatment period consisting of a 24‐week placebo‐controlled period (Phase A) and a 30‐week active‐controlled period (Phase B) and a post‐trial phone follow‐up 28 days after final dose |
| Participants |
|
| Interventions | Treatment group
Control group
|
| Outcomes |
|
| Notes |
Chan 2011.
| Methods | Randomised double‐blind placebo‐controlled study over 8 weeks |
| Participants |
|
| Interventions | Treatment group
Control group
|
| Outcomes |
|
| Notes | Awaiting data from authors for patients with an eGFR < 60 mL/min/1.73m2 and with DM |
DEVOTE 2017.
| Methods | Multinational, treat‐to‐target, randomised, double‐blind, active comparator–controlled cardiovascular outcomes trial |
| Participants |
|
| Interventions | Treatment group 1
Treatment group 2
Identical 100 U/mL, 10 mL vials |
| Outcomes |
|
| Notes | Information for the subgroup of patients with an eGFR < 60 mL/min/1.73 m2 is required from the authors |
EXAMINE 2011.
| Methods | Multicenter, prospective, randomised, double‐blind trial over 4.75 years |
| Participants |
|
| Interventions | Treatment group
Control group
|
| Outcomes |
|
| Notes | Further data for those patients with an eGFR < 60 mL/min/1.73 m2 were not available at the moment but will be published |
LEADER 2017.
| Methods | Multicenter, randomised double‐blind, placebo‐controlled trial with a median follow‐up of 3.8 years |
| Participants |
|
| Interventions | Treatment group
Control group
|
| Outcomes |
|
| Notes |
Li 2012b.
| Methods | Randomised cross‐over trial. Randomly assigned to receive either oral pioglitazone 15 mg once daily or no pioglitazone for 12 weeks then, after a 4‐week washout, the patients were switched to the alternative regimen |
| Participants |
|
| Interventions | Treatment group
Control group
Both groups
|
| Outcomes |
|
| Notes | Awaiting reply to authors for patients with both DM and on PD (n = 10). Wrote to the authors on 6/2/17 |
MARLINA‐T2D 2015.
| Methods | Randomised, double‐blind parallel group trial |
| Participants |
|
| Interventions | Treatment group
Control group
|
| Outcomes | Change from baseline in HbA1c at 24 weeks Time weighted average of percentage change from baseline in UACR at 24 weeks |
| Notes | Information for the subgroup of patients with an eGFR < 60 mL/min/1.73 m2 is required from the authors |
NCT00846716.
| Methods | Randomised, open‐label parallel group trial of pioglitazone added on to a sulphonylurea or biguanide versus a sulphonylurea or biguanide |
| Participants |
|
| Interventions | Treatment group 1
Treatment group 2
|
| Outcomes |
|
| Notes | The recruitment status of this study is unknown. The completion date has passed and the status has not been verified in more than two years. The study is not published. Written to authors 3 March 2017. Awaiting response. |
Neff 2016.
| Methods | RCT |
| Participants |
|
| Interventions | Treatment group
Control group
|
| Outcomes |
|
| Notes | Further details are required from the authors. The complete manuscript has not been published yet. |
Ott 2016.
| Methods | Double‐blind, parallel‐group, investigator‐initiated RCT |
| Participants |
|
| Interventions | Treatment group
Control group
|
| Outcomes | The primary objective was to assess endothelial function of the renal vasculature, by constant‐infusion input clearance and UACR, both before and after blockade of nitric oxide synthase with NG‐monomethyl‐L‐arginine |
| Notes | Further details regarding the subpopulation of patient with an eGFR < 60 mL/min/1.73m2 are required from the authors |
SUSTAIN‐6 2016.
| Methods | Multi‐national, double‐blind, placebo‐controlled, parallel‐group RCT |
| Participants |
|
| Interventions | Treatment group
Control group
|
| Outcomes |
|
| Notes | Further details regarding the subpopulation of patient with an eGFR < 60 mL/min/1.73m2 are required from the authors |
von Scholten 2017.
| Methods | Double‐blind, placebo‐controlled, cross‐over RCT running for 28 weeks. |
| Participants |
|
| Interventions | Treatment group
Control group
After 12 weeks of treatment, patients underwent a 4‐week washout period prior to crossing over to the other treatment group for 12 weeks. Participants attended a baseline examination visit and were instructed in SC injection of the study drug. Participants were treated with liraglutide/placebo 0.6 mg/d for 7 days, escalated to 1.2 mg/d for 7 days and lastly to 1.8 mg/d for the remaining 10 weeks or matching placebo |
| Outcomes |
|
| Notes | Written to authors for the subgroup analysis for those patients with an eGFR < 60. There were 11 patients with an eGFR < 60. We are awaiting reply from authors for the sub‐analysis |
Xie 2006.
| Methods | No details available |
| Participants | No details available |
| Interventions | No details available |
| Outcomes | No details available |
| Notes | Unable to obtain a copy of the study |
ACEi ‐ angiotensin‐converting enzyme inhibitor; ADA ‐ American Diabetes Association; AE ‐ adverse event/s; ARB ‐ angiotensin receptor blocker; BMI ‐ body mass index; BP ‐ blood pressure; CKD ‐ chronic kidney disease; CKD‐EPI ‐ CKD‐Epidemiology Collaboration; CrCl ‐ creatinine clearance; CRP ‐ C‐reactive protein; CVD ‐ cardiovascular disease; DBP ‐ diastolic blood pressure; DKD ‐ diabetic kidney disease; DM ‐ diabetes mellitus; DPP‐4 ‐ dipeptidyl‐peptidase 4; ECG ‐ electrocardiogram; (e)GFR ‐ (estimated) glomerular filtration rate; ESKD ‐ end‐stage kidney disease; FBG ‐ fasting blood glucose; GOT ‐ glutamic oxaloacetic transaminase; GPT ‐ glutamic pyruvic transaminase; Hb ‐ haemoglobin; HbA1c ‐ haemoglobin A1c (glycated); HD ‐ haemodialysis; HOMA ‐ homoeostasis model assessment; MACE ‐ Major Adverse Cardiac Events; MAP ‐ mean arterial pressure; MI ‐ myocardial infarction; NYHA ‐ New York Heart Association; PD ‐ peritoneal dialysis; RAS ‐ renin‐angiotensin system; RCT ‐ randomised controlled trial; RRT ‐ renal replacement therapy; SBP ‐ systolic blood pressure; SCr ‐ serum creatinine; SMPG ‐ self‐monitored plasma glucose; UACR ‐ urinary albumin‐creatinine ratio; UAER ‐ urinary albumin excretion rate; ULN ‐ upper limit of normal; UTI ‐ urinary tract infection
Characteristics of ongoing studies [ordered by study ID]
CARMELINA 2017.
| Trial name or title | Cardiovascular and renal microvascular outcome study with linagliptin in patients with type 2 diabetes mellitus (CARMELINA) |
| Methods | Parallel group, double‐blind RCT |
| Participants | Inclusion criteria
Exclusion criteria
|
| Interventions | Treatment group
Control group
|
| Outcomes |
|
| Starting date | July 10 2013 |
| Contact information | Boehringer Ingelheim |
| Notes |
NCT02547935.
| Trial name or title | An exploratory phase II/III, randomised, double‐blind, placebo controlled, parallel design study to evaluate the efficacy, safety and pharmacodynamics of dapagliflozin and dapagliflozin in combination with saxagliptin in CKD patients with type 2 diabetes mellitus and albuminuria treated With ACEi or ARB |
| Methods | Double‐blind randomised parallel group trial. |
| Participants | Inclusion criteria
Exclusion criteria
|
| Interventions | Treatment group 1
Treatment group 2
Control group
|
| Outcomes |
|
| Starting date | September 21, 2015 |
| Contact information | AstraZeneca Clinical Study Information centre: 1‐877‐240‐9479; information.center@astrazeneca.com |
| Notes | Currently recruiting participants. |
NCT02608177.
| Trial name or title | Continuous glucose monitoring to assess glycaemia in chronic kidney disease ‐ Changing glucose management (CANDY‐CANE) |
| Methods | Interventional cross‐over RCT |
| Participants | Inclusion criteria
Exclusion criteria
|
| Interventions | Linagliptin/glipizide
Glipizide/linagliptin
|
| Outcomes |
|
| Starting date | November 2015 |
| Contact information | Ian de Boer, Associate Professor, Medicine/Nephrology, University of Washington |
| Notes | Currently recruiting participants |
ACEi ‐ angiotensin‐converting enzyme inhibitor; AKI ‐ acute kidney injury; ALT ‐ alanine aminotransferase; ALP ‐ alkaline phosphatase; ARB ‐ angiotensin receptor blocker; AST ‐ aspartate aminotransferase; BMI ‐ body mass index; BP ‐ blood pressure; CKD ‐ chronic kidney disease; DKD ‐ diabetic kidney disease; DM ‐ diabetes mellitus; DPP‐4 ‐ dipeptidyl‐peptidase 4; eGFR ‐ estimated glomerular filtration rate; ESKD ‐ end‐stage kidney disease; HbA1c ‐ haemoglobin A1c (glycated); MDRD ‐ Modification of Diet in Renal Disease; MACE ‐ Major Adverse Cardiac Events; MI ‐ myocardial infarction; NYHA ‐ New York Heart Association; RCT ‐ randomised controlled trial; RRT ‐ renal replacement therapy; SBP ‐ systolic blood pressure; TIA ‐ transient ischaemic attack; UACR ‐ urinary albumin‐creatinine ratio; ULN ‐ upper limit of normal
Differences between protocol and review
Due to a lack of uniform reporting in included studies of fatal and non‐fatal myocardial infarcts and strokes, we reported myocardial infarction and strokes as secondary outcomes rather than non‐fatal myocardial infarcts and strokes.
Contributions of authors
Draft the protocol: CL, MJ, SZ
Study selection: CL, TT, YW, JL
Extract data from studies: CL, TT, YW, JL
Enter data into RevMan: CL,TT
Carry out the analysis: CL,TT
Interpret the analysis: CL, TT, YH, MJ, AC, CH, HP, SB, VP, SZ
Draft the final review: CL, TT, VP, SZ
Disagreement resolution: SZ, MJ
Update the review: CL, TT, YH, MJ, AC, CH, HP, SB, VP, SZ
Declarations of interest
Clement Lo: none known
Tadashi Toyoma: none known
Ying Wang: none known
Jin Lin: none known
Yoichiro Hirakawa: none known
Min Jun: none known
Sunil Badve: none known
Helen Pilmore: none known
Carmel Hawley has received fees from Amgen, Shire, Roche, Abbott, Bayer, Fresenius, Baxter, Gambro, Janssen‐Cilag and Genzyme in relation to consultancy, speakers' fees, education, and grants for activities unrelated to this review
Alan Cass: The Menzies School of Health Research has received unconditional research funding from AMGEN, Merck and Novartis for research in chronic kidney disease in Indigenous populations.
Vlado Perkovic: has received support from Boehringer Ingelheim for Advisory Boards, and his employer has received payments from Boehringer Ingelheim and Merck for Advisory activities, and has a contract for the conduct of a clinical study of glucose‐lowering with Janssen
Sophia Zoungas has received fees from Abbvie, Amgen Australia Pty Ltd, AstraZeneca Pty Ltd, Bristol Myers Squibb Australia Pty Ltd, Boehringer Ingleheim, Janssen‐Cilag Pty Ltd, Merck Sharp & Dohme (Australia) Pty Ltd, Novo Nordisk, Novartis Pharmaceuticals Australia, Ogilvy Healthworld, Sanofi, Servier Laboratories, and Takeda Pharmaceuticals Australia Pty Ltd in relation to consultancy, speakers' fees, education, and grants for activities unrelated to this review
New
References
References to studies included in this review
Abe 2007 {published data only}
- Abe M, Kikuchi F, Kaizu K, Matsumoto K. Combination therapy of pioglitazone with voglibose improves glycemic control safely and rapidly in Japanese type 2‐diabetic patients on hemodialysis. Clinical Nephrology 2007;68(5):287‐94. [MEDLINE: ] [DOI] [PubMed] [Google Scholar]
Abe 2008a {published data only}
- Abe M, Okada K, Kikuchi F, Matsumoto K. Clinical investigation of the effects of pioglitazone on the improvement of insulin resistance and blood pressure in type 2‐diabetic patients undergoing hemodialysis. Clinical Nephrology 2008;70(3):220‐8. [MEDLINE: ] [DOI] [PubMed] [Google Scholar]
Abe 2010 {published data only}
- Abe M, Okada K, Maruyama T, Maruyama N, Matsumoto K. Combination therapy with mitiglinide and voglibose improves glycemic control in type 2 diabetic patients on hemodialysis. Expert Opinion on Pharmacotherapy 2010;11(2):169‐76. [MEDLINE: ] [DOI] [PubMed] [Google Scholar]
Abe 2010a {published data only}
- Abe M, Okada K, Maruyama T, Maruyama N, Soma M, Matsumoto K. Clinical effectiveness and safety evaluation of long‐term pioglitazone treatment for erythropoietin responsiveness and insulin resistance in type 2 diabetic patients on hemodialysis. Expert Opinion on Pharmacotherapy 2010;11(10):1611‐20. [MEDLINE: ] [DOI] [PubMed] [Google Scholar]
Abe 2016 {published data only}
- Abe M, Higuchi T, Moriuchi M, Okamura M, Tei R, Nagura C, et al. Efficacy and safety of saxagliptin, a dipeptidyl peptidase‐4 inhibitor, in hemodialysis patients with diabetic nephropathy: A randomized open‐label prospective trial. Diabetes Research & Clinical Practice 2016;116:244‐52. [MEDLINE: ] [DOI] [PubMed] [Google Scholar]
- Abe M, Okada K, Oikawa O, Maruyama N, Furukawa T. Efficacy and safety of dipeptidyl peptidase‐4 (DPP‐4) inhibitor in hemodialysis patients with type 2 diabetes [abstract]. Nephrology Dialysis Transplantation 2016;31(Suppl 1):i216. [EMBASE: 72326481] [Google Scholar]
- Abe M, Otsuki T, Maruyama N, Oikawa O, Okada K. Efficacy and safety of saxagliptin, dipeptidyl peptidase‐4 inhibitor, in hemodialysis patients with type 2 diabetes [abstract]. Nephrology 2016;21(Suppl 2):65. [EMBASE: 612312682] [Google Scholar]
AleNephro 2014 {published data only}
- Herz M, Ruilope L, Hanefeld M, Lincoff AM, Viberti G, Reigner SM, et al. Effects of aleglitazar on renal function in patients with stage 3 chronic kidney disease and type‐2 diabetes [abstract no: O22]. British Transplantation Society & the Renal Association Joint Congress; 2013 Mar 13‐15; Bournemouth, UK. 2013.
- Malmberg K, Hanefeld M, Ruilope L, Lincoff A, Viberti G, Mudie N, et al. Effects of aleglitazar on cardiovascular risk factors in patients with stage 3 chronic kidney disease and type II diabetes [abstract]. Journal of the American College of Cardiology 2013;10(Suppl 1):E1173. [EMBASE: 71020536] [Google Scholar]
- Ruilope L, Hanefeld M, Lincoff AM, Viberti G, Meyer‐Reigner S, Mudie N, et al. Effects of the dual peroxisome proliferator‐activated receptor‐alpha/gamma agonist aleglitazar on renal function in patients with stage 3 chronic kidney disease and type 2 diabetes: a Phase IIb, randomized study. BMC Nephrology 2014;15(1):180. [MEDLINE: ] [DOI] [PMC free article] [PubMed] [Google Scholar]
Arjona Ferreira 2013 {published data only}
- Arjona Ferreira JC, Engel SS, Guo H, Golm GT, Johnson‐Levonas AO, Kaufman KD, et al. Consistency of the A1C‐lowering effects of sitagliptin versus glipizide in patients with type 2 diabetes and chronic renal insufficiency across a variety of baseline characteristics [abstract]. Diabetes 2012;61:A281. [EMBASE: 70797683] [Google Scholar]
- Arjona Ferreira JC, Engel SS, Guo H, Golm GT, Sisk CM, Kaufman KD, et al. Sitagliptin more effectively achieves a composite endpoint of a1c reduction, no body weight gain, and lack of hypoglycemia in patients with type 2 diabetes and renal insufficiency compared to glipizide [abstract]. Diabetes 2012;61:A258. [EMBASE: 70797604] [Google Scholar]
- Arjona Ferreira JC, Marre M, Barzilai N, Guo H, Golm GT, Sisk CM, et al. Efficacy and safety of sitagliptin versus glipizide in patients with type 2 diabetes and moderate‐to‐severe chronic renal insufficiency. Diabetes Care 2013;36(5):1067‐73. [MEDLINE: ] [DOI] [PMC free article] [PubMed] [Google Scholar]
- Arjona Ferreira JC, Marre M, Rabelink TJ, Barzilai N, Bakris GL, Guo H, et al. Efficacy and safety of sitagliptin versus glipizide in patients with type 2 diabetes and moderate to severe chronic renal insufficiency [abstract]. Diabetes, Stoffwechsel und Herz 2011;20(6):419. [EMBASE: 70696902] [DOI] [PMC free article] [PubMed] [Google Scholar]
- Arjona Ferreira JCA, Marre M, Bakris GL, Rabelink TJ. Efficacy and safety of sitagliptin vs. glipizide in patients with type 2 diabetes and moderate to severe chronic renal insufficiency [abstract no: LB‐PO3166]. Journal of the American Society of Nephrology 2011;22(Abstracts):8B. [Google Scholar]
- Engel S, Arjona Ferreira JC, Guo H, Golm G, Johnson‐Levonas AO, Kaufman K, et al. Consistency of HbA1c‐lowering effects of sitagliptin vs glipizide in patients with type 2 diabetes and chronic renal insufficiency across a variety of baseline characteristics [abstract]. Diabetologia 2012;55(1 Suppl):S342. [EMBASE: 70888848] [Google Scholar]
Arjona Ferreira 2013a {published data only}
- Arjona Ferreira JC, Corry D, Mogensen CE, Sloan L, Xu L, Golm GT, et al. Efficacy and safety of sitagliptin in patients with type 2 diabetes and ESRD receiving dialysis: a 54‐week randomized trial. American Journal of Kidney Diseases 2013;61(4):579‐87. [MEDLINE: ] [DOI] [PubMed] [Google Scholar]
- Arjona Ferreira JC, Corry D, Mogensen CE, Slone L, Xii L, Gonzalez EJ, et al. Efficacy and safety of sitagliptin vs. glipizide in patients with type 2 diabetes mellitus and end‐stage renal disease on dialysis: A 54‐week randomised trial [abstract]. Diabetes, Stoffwechsel und Herz 2011;20(6):430. [EMBASE: 70696927] [Google Scholar]
- Arjona Ferreira JC, Corry DB, Mogensen CE. Efficacy and safety of sitagliptin vs. glipizide in patients with type 2 diabetes and end‐stage renal disease on dialysis [abstract no: LB‐PO3167]. Journal of the American Society of Nephrology 2011;22(Abstracts):8B. [Google Scholar]
Baldwin 2012 {published data only}
- Baldwin D, Zander J, Munoz C, Raghu P, DeLange‐Hudec S, Lee H, et al. A randomized trial of two weight‐based doses of insulin glargine and glulisine in hospitalized subjects with type 2 diabetes and renal insufficiency. Diabetes Care 2012;35(10):1970‐4. [MEDLINE: ] [DOI] [PMC free article] [PubMed] [Google Scholar]
- Zander J, Raghu P, Lee H, Molitch M, Glossop V, Smallwood K, et al. Initial insulin doses should be decreased in hospitalized patients with renal insufficiency and type 2 diabetes [abstract]. Diabetes 2011;60:A297. [EMBASE: 70628849] [Google Scholar]
Barnett 2013 {published data only}
- Barnett AH, Huisman H, Jones R. Efficacy and safety of linagliptin in elderly patients (.70 years) with type 2 diabetes mellitus [abstract no: OCS‐05‐3]. Journal of Diabetes Investigation 2012;3(Suppl 1):102. [Google Scholar]
- Barnett AH, Huisman H, Jones R, Eynatten M, Patel S, Woerle HJ. Linagliptin for patients aged 70 years or older with type 2 diabetes inadequately controlled with common antidiabetes treatments: a randomised, double‐blind, placebo‐controlled trial. Lancet 2013;382(9902):1413‐23. [MEDLINE: ] [DOI] [PubMed] [Google Scholar]
- McGill JB, Barnett AH, Lewin AJ, Patel S, Neubacher D, Eynatten M, et al. Linagliptin added to sulphonylurea in uncontrolled type 2 diabetes patients with moderate‐to‐severe renal impairment. Diabetes & Vascular Disease Research 2014;11(1):34‐40. [MEDLINE: ] [DOI] [PubMed] [Google Scholar]
Bellante 2016 {published data only}
- Bellante R, Lucchesi D, Giusti L, Garofolo M, Sancho‐Bornez V, Caprioli R, et al. Sitagliptin increases circulating endothelial progenitor cells in patients with type 2 diabetes and advanced chronic kidney disease [abstract]. Diabetologia 2016;59(1 Suppl 1):S360‐1. [EMBASE: 612313307] [Google Scholar]
Chan 2008a {published data only}
- Chan JC, Scott R, Arjona Ferreira JC, Sheng D, Gonzalez E, Davies MJ, et al. Safety and efficacy of sitagliptin in patients with type 2 diabetes and chronic renal insufficiency. Diabetes, Obesity & Metabolism 2008;10(7):545‐55. [MEDLINE: ] [DOI] [PubMed] [Google Scholar]
Diez 1987 {published data only}
- Diez JJ, Alvaro F, Munoz J, Miguelez C, P‐Diaz V, Jabari NS, et al. Comparative randomized study of insulin administration through two different routes in CAPD diabetic patients [abstract]. Nephrology Dialysis Transplantation 1987;2(5):452‐3. [Google Scholar]
- Diez JJ, Alvaro F, Munoz J, Miguelez C, P‐Diaz V, Jabari NS, et al. Comparative randomized study of insulin administration through two different routes in CAPD diabetic patients. [abstract]. Kidney International 1988;34(2):296. [Google Scholar]
EMPA‐REG BP 2015 {published data only}
- Cherney D, Cooper M, Tikkanen I, Crowe S, Johansen OE, Lund SS, et al. Contrasting influences of renal function on blood pressure and HbA1c reductions with empagliflozin in patients with type 2 diabetes and hypertension [abstract no: 16709]. Circulation 2014;130(Suppl 1):n/a. [Google Scholar]
- Cherney D, Cooper M, Tikkanen I, Crowe S, Johansen OE, Lund SS, et al. Contrasting influences of renal function on blood pressure and hba1c reductions with empagliflozin in patients with type 2 diabetes and hypertension [abstract no: 4B.01]. Journal of Hypertension 2015;33(Suppl 1):e53. [MEDLINE: ] [Google Scholar]
- Mancia G, Cannon CP, Tikkanen I, Zeller C, Ley L, Woerle HJ, et al. Impact of empagliflozin on blood pressure in patients with type 2 diabetes mellitus and hypertension by background antihypertensive medication. Hypertension 2016;68(6):1355‐64. [MEDLINE: ] [DOI] [PubMed] [Google Scholar]
- Tikkanen I, Narko K, Zeller C, Green A, Salsali A, Broedl UC, et al. Empagliflozin reduces blood pressure in patients with type 2 diabetes and hypertension. Diabetes Care 2015;38(3):420‐8. [MEDLINE: ] [DOI] [PubMed] [Google Scholar]
EMPA‐REG OUTCOME 2013 {published and unpublished data}
- Cherney DZI, Zinman B, Inzucchi SE, Koitka‐Weber A, Mattheus M, von EM, et al. Effects of empagliflozin on the urinary albumin‐to‐creatinine ratio in patients with type 2 diabetes and established cardiovascular disease: an exploratory analysis from the EMPA‐REG OUTCOME randomised, placebo‐controlled trial. Lancet Diabetes & Endocrinology 2017;5(8):610‐21. [MEDLINE: ] [DOI] [PubMed] [Google Scholar]
- D'Emden M, Bergenstal R, Maldonado Lutomirsky M, Wanner C. Effect of empagliflozin on nephropathy in subgroups by age: Results from EMPA‐REG OUTCOME [abstract]. Nephrology 2016;21(Suppl 2):59. [EMBASE: 612313031] [Google Scholar]
- Daacke I, Kandaswamy P, Tebboth A, Kansal A, Reifsnider O. Impact of empagliflozin (jardiance) to the NHS: Estimation of budget and event impact based on EMPA‐REG OUTCOME data [abstract]. Value in Health 2016;19(7):A668. [EMBASE: 613236982] [Google Scholar]
- Inzucchi SE, Zinman B, Lachin JM, Wanner C, Ferrari R, Bluhmki E, et al. Design of the empagliflozin cardiovascular outcome event trial in type 2 diabetes mellitus [abstract]. Diabetologia 2013;56(Suppl 1):S378. [EMBASE: 71439366] [Google Scholar]
- Langslet G, Zinman B, Wanner C, Hantel S, Espadero R, Johansen O, et al. Cardiovascular (CV) outcomes according to LDL cholesterol (LDLC) levels in EMPA‐REG OUTCOME [abstract]. Diabetologia 2016;59(1 Suppl 1):S537. [EMBASE: 612313836] [Google Scholar]
- Langslet G, Zinman B, Wanner C, Hantel S, Espadero R, Johansen OE, et al. Cardiovascular outcomes according to LDL cholesterol levels in EMPA‐REG OUTCOME [abstract]. European Heart Journal 2016;37(Suppl 1):1192. [EMBASE: 612285725] [Google Scholar]
- Perkovic V, Levin A, Wheeler D, Koitka‐Weber A, Mattheus M, George J, et al. Effects of empagliflozin on cardiovascular outcomes across KDIGO risk categories: results from the EMPA‐REG OUTCOME trial [abstract]. Nephrology Dialysis Transplantation 2017;32(Suppl 3):iii12. [EMBASE: 617302721] [Google Scholar]
- Wanner C, Heerspink HJL, Koitka‐Weber A, Mattheus M, Eynatten M, Groop PH. Empagliflozin and progression of kidney disease in patients at high renal risk: Slope analyses from EMPA‐REG OUTCOME [abstract]. Diabetes 2017;66:A314. [EMBASE: 616962744] [Google Scholar]
- Wanner C, Inzucchi S, Lachin JM, Fitchett D, Eynatten M, Mattheus M, et al. Reduced progression of kidney disease with empagliflozin: Results from EMPA‐REG OUTCOME [abstract]. Diabetic Medicine 2017;34(Suppl 1):80‐1. [EMBASE: 614845117] [Google Scholar]
- Wanner C, Inzucchi SE, Lachin JM, Fitchett D, Eynatten M, Mattheus M, et al. Empagliflozin and progression of kidney disease in type 2 diabetes. New England Journal of Medicine 2016;375(4):323‐34. [MEDLINE: ] [DOI] [PubMed] [Google Scholar]
- Wanner C, Lachin JM, Inzucchi SE, Fitchett D, Mattheus M, George JT, et al. Empagliflozin and clinical outcomes in patients with type 2 diabetes, established cardiovascular disease and chronic kidney disease. Circulation 2018;137(2):119‐29. [MEDLINE: ] [DOI] [PubMed] [Google Scholar]
- Wanner C, Levin A, Perkovic V, Koitka‐Weber A, Mattheus M, Eynatten M, et al. Effects of empagliflozin on renal outcomes across KDIGO risk categories: Results from the EMPA‐REG OUTCOME trial [abstract]. Nephrology Dialysis Transplantation 2017;32(Suppl 3):iii193‐iii. [EMBASE: 617290043] [Google Scholar]
- Zinman B, Inzucchi S, Lachin J, Wanner C, Ferrari R, Fitchett D, et al. Baseline characteristics of participants enrolled in the empagliflozin cardiovascular outcome trial (EMPA‐REG OUTCOME) in patients with type 2 diabetes [abstract]. Diabetologie und Stoffwechsel 2014;9:n/a. [Google Scholar]
- Zinman B, Inzucchi SE, Lachin JM, Wanner C, Ferrari R, Bluhmki E, et al. Design of the empagliflozin cardiovascular (CV) outcome event trial in type 2 diabetes (T2D) [abstract]. Diabetes 2013;62(Suppl 1):A600. [EMBASE: 71288750] [Google Scholar]
- Zinman B, Inzucchi SE, Lachin JM, Wanner C, Ferrari R, Fitchett D, et al. Rationale, design, and baseline characteristics of a randomized, placebo‐controlled cardiovascular outcome trial of empagliflozin (EMPA‐REG OUTCOME). Cardiovascular Diabetology 2014;13:102. [MEDLINE: ] [DOI] [PMC free article] [PubMed] [Google Scholar]
- Zinman B, Inzucchi SE, Lachin JM, Wanner C, Fitchett D, Kohler S, et al. Empagliflozin and cerebrovascular events in patients with type 2 diabetes mellitus at high cardiovascular risk. Stroke 2017;48(5):1218‐25. [MEDLINE: ] [DOI] [PMC free article] [PubMed] [Google Scholar]
- Zinman B, Wanner C, Lachin JM, Fitchett D, Bluhmki E, Hantel S, et al. Empagliflozin, cardiovascular outcomes, and mortality in type 2 diabetes. New England Journal of Medicine 2015;373(22):2117‐28. [MEDLINE: ] [DOI] [PubMed] [Google Scholar]
- Eynatten M, Bergenstal RM, Calabro P, Maldonado‐Lutomirsky M, Mattheus M, Lachin JM, et al. Effect of empagliflozin on nephropathy in subgroups by age: Results from EMPA‐REG OUTCOME [abstract]. Diabetologia 2016;59(1 Suppl 1):S483. [EMBASE: 612313304] [Google Scholar]
EMPA‐REG RENAL 2014 {published and unpublished data}
- Barnett AH, Mithal A, Manassie J, Jones R, Rattunde H, Woerle HJ, et al. Efficacy and safety of empagliflozin added to existing antidiabetes treatment in patients with type 2 diabetes and chronic kidney disease: a randomised, double‐blind, placebo‐controlled trial. The Lancet Diabetes & Endocrinology 2014;2(5):369‐84. [MEDLINE: ] [DOI] [PubMed] [Google Scholar]
GUARD 2017 {published data only}
- Yoon S, Han B, Kim S, Han S, Jo Y, Jeong K, et al. Efficacy and safety of gemigliptin in type 2 diabetes patients with moderate to severe renal impairment [abstract no:804]. Diabetologia 2015;58(1 Suppl 1):S387. [EMBASE: 72031048] [Google Scholar]
- Yoon S, Han B, Kim S, Han S, Jo YI, Jeong K, et al. Efficacy and safety of gemigliptin in type 2 diabetes patients with moderate to severe renal impairment (GUARD study) [abstract no: 760]. Diabetologia 2016;59(1 Suppl 1):S361. [EMBASE: 612313344] [Google Scholar]
- Yoon SA, Han BG, Kim SG, Han SY, Jo YI, Jeong KH, et al. Efficacy, safety and albuminuria‐reducing effect of gemigliptin in Korean type 2 diabetes patients with moderate to severe renal impairment: A 12‐week, double‐blind randomized study (the GUARD Study). Diabetes, Obesity & Metabolism 2017;19(4):590‐8. [MEDLINE: ] [DOI] [PubMed] [Google Scholar]
Haneda 2016 {published data only}
- Haneda M, Seino Y, Inagaki N, Kaku K, Sasaki T, Fukatsu A, et al. Influence of renal function on the 52‐week efficacy and safety of the sodium glucose cotransporter 2 inhibitor luseogliflozin in Japanese patients with type 2 diabetes mellitus. Clinical Therapeutics 2016;38(1):66‐88. [MEDLINE: ] [DOI] [PubMed] [Google Scholar]
Idorn 2013 {published data only}
- Idorn T, Knop FK, Jorgensen M, Jensen T, Resuli M, Hansen PM, et al. Safety and efficacy of liraglutide in patients with type 2 diabetes and end‐stage renal disease: protocol for an investigator‐initiated prospective, randomised, placebo‐controlled, double‐blinded, parallel intervention study. BMJ Open 2013;3(4):1. [MEDLINE: ] [DOI] [PMC free article] [PubMed] [Google Scholar]
- Idorn T, Knop FK, Jorgensen MB, Jensen T, Resuli M, Hansen PM, et al. Safety and efficacy of liraglutide in patients with type 2 diabetes and end‐stage renal disease: An investigator‐initiated, randomised, placebo controlled trial [abstract]. Diabetologia 2014;57(1 Suppl):S370‐1. [EMBASE: 71595559] [Google Scholar]
- Idorn T, Knop FK, Jorgensen MB, Jensen T, Resuli M, Hansen PM, et al. Safety and efficacy of liraglutide in patients with type 2 diabetes and end‐stage renal disease: an investigator‐initiated, placebo‐controlled, double‐blind, parallel‐group, randomized trial. Diabetes Care 2016;39(2):206‐13. [MEDLINE: ] [DOI] [PubMed] [Google Scholar]
Ito 2011a {published data only}
- Ito M, Abe M, Okada K, Sasaki H, Maruyama N, Tsuchida M, et al. The dipeptidyl peptidase‐4 (DPP‐4) inhibitor vildagliptin improves glycemic control in type 2 diabetic patients undergoing hemodialysis. Endocrine Journal 2011;58(11):979‐87. [MEDLINE: ] [DOI] [PubMed] [Google Scholar]
Jin 2007 {published data only}
- Jin HM, Pan Y. Angiotensin type‐1 receptor blockade with losartan increases insulin sensitivity and improves glucose homeostasis in subjects with type 2 diabetes and nephropathy. Nephrology Dialysis Transplantation 2007;22(7):1943‐9. [MEDLINE: ] [DOI] [PubMed] [Google Scholar]
- Jin HM, Pan Y. Renoprotection provided by losartan in combination with pioglitazone is superior to renoprotection provided by losartan alone in patients with type 2 diabetic nephropathy. Kidney & Blood Pressure Research 2007;30(4):203‐11. [MEDLINE: ] [DOI] [PubMed] [Google Scholar]
Kaku 2014 {published data only}
- Kaku K, Kiyosue A, Inoue S, Ueda N, Tokudome T, Yang J, et al. Efficacy and safety of dapagliflozin monotherapy in Japanese patients with type 2 diabetes inadequately controlled by diet and exercise. Diabetes, Obesity and Metabolism 2014;16(11):1102‐1110. [MEDLINE: ] [DOI] [PubMed] [Google Scholar]
Kohan 2014 {published and unpublished data}
- Kohan DE, Fioretto P, Tang W, List JF. Long‐term study of patients with type 2 diabetes and moderate renal impairment shows that dapagliflozin reduces weight and blood pressure but does not improve glycemic control. Kidney International 2014;85(4):962‐71. [MEDLINE: ] [DOI] [PMC free article] [PubMed] [Google Scholar]
- Kohan DE, Firescu C, List JF, Tang W. Efficacy and safety of dapagliflozin in patients with type 2 diabetes and moderate renal impairment [abstract no:TH‐PO524]. Journal of the American Society of Nephrology 2011;22(Abstracts):232A‐3A. [Google Scholar]
Kothny 2015 {published data only}
- Kothny W, Lukashevich V, Foley JE, Rendell MS, Schweizer A. Comparison of vildagliptin and sitagliptin in patients with type 2 diabetes and severe renal impairment: a randomised clinical trial. Diabetologia 2015;58(9):2020‐6. [MEDLINE: ] [DOI] [PMC free article] [PubMed] [Google Scholar]
Laakso 2015 {published data only}
- Groop P, Perkovic V, Cooper M, Crowe S, Lee J, Patel S, et al. Long‐term efficacy and safety of linagliptin in type 2 diabetes patients with moderate to severe renal disease. Diabetes 2014;63(Suppl 1):A264. [EMBASE: 71559411] [Google Scholar]
- Groop PH, Laakso M, Rosenstock J, Hehnke U, Tamminen I, Patel S, et al. Linagliptin versus placebo followed by glimepiride in type 2 diabetes patients with moderate to severe renal impairment [abstract no:P13‐11527]. Diabetologia 2016;56(Suppl 1):S364‐5. [Google Scholar]
- Laakso M, Rosenstock J, Groop P, Hehnke U, Tamminen I, Patel S, et al. Linagliptin vs. placebo followed by glimepiride in type 2 diabetes patients with moderate to severe renal impairment. Diabetes 2013;62(Suppl 1):A281‐A2. [EMBASE: 71287521] [DOI] [PubMed] [Google Scholar]
- Laakso M, Rosenstock J, Groop PH, Barnett AH, Gallwitz B, Hehnke U, et al. Treatment with the dipeptidyl peptidase‐4 inhibitor linagliptin or placebo followed by glimepiride in patients with type 2 diabetes with moderate to severe renal impairment: a 52‐week, randomized, double‐blind clinical trial. Diabetes Care 2015;38(2):e15‐7. [MEDLINE: ] [DOI] [PubMed] [Google Scholar]
LANTERN 2015 {published data only}
- Kashiwagi A, Takahashi H, Ishikawa H, Yoshida S, Kazuta K, Utsuno A, et al. A randomized, double‐blind, placebo‐controlled study on long‐term efficacy and safety of ipragliflozin treatment in patients with type 2 diabetes mellitus and renal impairment: results of the long‐term ASP1941 safety evaluation in patients with type 2 diabetes with renal impairment (LANTERN) study. Diabetes, Obesity and Metabolism 2015;17(2):152‐60. [MEDLINE: ] [DOI] [PMC free article] [PubMed] [Google Scholar]
Leiter 2014 {published data only}
- Leiter LA, Carr MC, Stewart M, Jones‐Leone A, Scott R, Yang F, et al. Efficacy and safety of the once‐weekly GLP‐1 receptor agonist albiglutide versus sitagliptin in patients with type 2 diabetes and renal impairment: a randomized phase III study. Diabetes Care 2014;37(10):2723‐30. [MEDLINE: ] [DOI] [PubMed] [Google Scholar]
Lewin 2012 {published data only}
- Lewin AJ, Arvay L, Liu D, Patel S, Eynatten M, Woerle HJ. Efficacy and tolerability of linagliptin added to a sulfonylurea regimen in patients with inadequately controlled type 2 diabetes mellitus: an 18‐week, multicenter, randomized, double‐blind, placebo‐controlled trial. Clinical Therapeutics 2012;34(9):1909‐19. [MEDLINE: ] [DOI] [PubMed] [Google Scholar]
- McGill JB, Barnett AH, Lewin AJ, Patel S, Neubacher D, Eynatten M, et al. Linagliptin added to sulphonylurea in uncontrolled type 2 diabetes patients with moderate‐to‐severe renal impairment. Diabetes & Vascular Disease Research 2014;11(1):34‐40. [MEDLINE: ] [DOI] [PubMed] [Google Scholar]
LIRA‐RENAL 2016 {published data only}
- Davies MJ, Bain SC, Atkin SL, Rossing P, Scott D, Shamkhalova MS, et al. Efficacy and safety of liraglutide versus placebo as add‐on to glucose‐lowering therapy in patients with type 2 diabetes and moderate renal impairment (LIRA‐RENAL): a randomized clinical trial. Diabetes Care 2016;39(2):222‐30. [MEDLINE: ] [DOI] [PubMed] [Google Scholar]
- Mathieu C, Umpierrez G, Atkin S, Bain S, Rossing P, Scott D, et al. Efficacy and safety of liraglutide versus placebo in subjects with type 2 diabetes and moderate renal impairment (LIRA‐RENAL): a randomised trial [abstract no: OP60]. Diabetes Research & Clinical Practice 2014;106(Suppl 1):S31. [EMBASE: 71824748] [Google Scholar]
- Ngo P, Davies M, Atkin S, Bain S, Rossing P, Scott D, et al. Efficacy and safety of liraglutide vs. placebo as add‐on to existing diabetes medication in subjects with type 2 diabetes and moderate renal impairment (LIRA‐RENAL) [abstract no: 18]. Canadian Journal of Diabetes 2014;38(5 Suppl):S9‐S10. [EMBASE: 72003971] [Google Scholar]
- Umpierrez G, Atkin S, Bain S, Rossing P, Scott D, Shamkhalova M, et al. Efficacy and safety of liraglutide versus placebo in subjects with type 2 diabetes and moderate renal impairment (LIRA‐RENAL): a randomised trial [abstract]. Diabetologia 2014;57(Suppl 1):S84. [EMBASE: 71594832] [DOI] [PubMed] [Google Scholar]
Lukashevich 2011 {published data only}
- Kothny W, Schweizer A, Naik R, Groop P, Shao Q, Lukashevich V. Comparison of vildagliptin with placebo in a 24‐week study of 221 patients with type 2 diabetes and severe renal impairment (eGFR<30) [abstract]. Diabetologia 2011;54:S332. [EMBASE: 70562964] [Google Scholar]
- Kothny W, Shao Q, Groop PH, Lukashevich V. One‐year safety, tolerability and efficacy of vildagliptin in patients with type 2 diabetes and moderate or severe renal impairment. Diabetes, Obesity & Metabolism 2012;14(11):1032‐9. [MEDLINE: ] [DOI] [PubMed] [Google Scholar]
- Kothny W, Wang M, Shao Q, Groop P, Lukashevich V. One‐year safety, tolerability and efficacy of vildagliptin in patients with type 2 diabetes mellitus and moderate or severe renal insufficiency [abstract]. Diabetes 2012;61:A253. [EMBASE: 70797589] [DOI] [PubMed] [Google Scholar]
- Lukashevich V, Schweizer A, Foley J, Shao Q, Groop P, Kothny W. Efficacy of vildagliptin therapy in combination with insulin in patients with type 2 diabetes and severe renal impairment [abstract]. Diabetologia 2011;54:S332‐3. [EMBASE: 70562965] [Google Scholar]
- Lukashevich V, Schweizer A, Foley JE, Dickinson S, Groop PH, Kothny W. Efficacy of vildagliptin in combination with insulin in patients with type 2 diabetes and severe renal impairment. Vascular Health & Risk Management 2013;9:21‐8. [MEDLINE: ] [DOI] [PMC free article] [PubMed] [Google Scholar]
- Lukashevich V, Schweizer A, Shao Q, Groop PH, Kothny W. Safety and efficacy of vildagliptin versus placebo in patients with type 2 diabetes and moderate or severe renal impairment: a prospective 24‐week randomized placebo‐controlled trial. Diabetes, Obesity & Metabolism 2011;13(10):947‐54. [MEDLINE: ] [DOI] [PubMed] [Google Scholar]
McGill 2013 {published data only}
- McGill JB, Barnett AH, Lewin AJ, Patel S, Neubacher D, Eynatten M, et al. Linagliptin added to sulphonylurea in uncontrolled type 2 diabetes patients with moderate‐to‐severe renal impairment. Diabetes & Vascular Disease Research 2014;11(1):34‐40. [MEDLINE: ] [DOI] [PubMed] [Google Scholar]
- McGill JB, Sloan L, Newman J, Patel S, Sauce C, Eynatten M, et al. Long‐term efficacy and safety of linagliptin in patients with type 2 diabetes and severe renal impairment: A 1‐year, randomized, double‐blind, placebo‐controlled study. Diabetes Care 2013;36(2):237‐44. [MEDLINE: ] [DOI] [PMC free article] [PubMed] [Google Scholar]
- McGill JB, Yki‐Jarvinen H, Crowe S, Woerle HJ, Eynatten M. Combination of the dipeptidyl peptidase‐4 inhibitor linagliptin with insulin‐based regimens in type 2 diabetes and chronic kidney disease. Diabetes & Vascular Disease Research 2015;12(4):249‐57. [MEDLINE: ] [DOI] [PubMed] [Google Scholar]
Mohideen 2005 {published data only}
- Mohideen P, Bornemann M, Sugihara J, Genadio V, Sugihara V, Arakaki R. The metabolic effects of troglitazone in patients with diabetes and end‐stage renal disease. Endocrine 2005;28(2):181‐6. [MEDLINE: ] [DOI] [PubMed] [Google Scholar]
Mori 2016 {published data only}
- Mori K, Emoto M, Shoji T, Inaba M. Linagliptin monotherapy compared with voglibose monotherapy in patients with type 2 diabetes undergoing hemodialysis: a 12‐week randomized trial. BMJ Open Diabetes Research & Care 2016;4(1):e000265. [MEDLINE: ] [DOI] [PMC free article] [PubMed] [Google Scholar]
Nakamura 2001 {published data only}
- Nakamura T, Ushiyama C, Osada S, Shimada N, Ebihara I, Koide H. Effect of pioglitazone on dyslipidemia in hemodialysis patients with type 2 diabetes. Renal Failure 2001;23(6):863‐4. [MEDLINE: ] [PubMed] [Google Scholar]
Nowicki 2011 {published data only}
- Nowicki M, Rychlik I, Haller H, Warren M, Suchower L, Gause‐Nilsson I, et al. Long‐term treatment with the dipeptidyl peptidase‐4 inhibitor saxagliptin in patients with type 2 diabetes mellitus and renal impairment: a randomised controlled 52‐week efficacy and safety study. International Journal of Clinical Practice 2011;65(12):1230‐9. [MEDLINE: ] [DOI] [PubMed] [Google Scholar]
- Nowicki M, Rychlik I, Haller H, Warren ML, Suchower L, Gause‐Nilsson I, et al. Saxagliptin improves glycaemic control and is well tolerated in patients with type 2 diabetes mellitus and renal impairment. Diabetes, Obesity & Metabolism 2011;13(6):523‐32. [MEDLINE: ] [DOI] [PubMed] [Google Scholar]
Pfutzner 2011 {published data only}
- Pfutzner AH, Schondorf T, Dikta G, Krajewski V, Fuchs W, Forst T, et al. Use of pioglitazone vs. placebo in addition to standard insulin treatment in patients with type 2 diabetes mellitus requiring hemodialysis treatment [abstract]. Diabetes 2011;60(Suppl 1):A315‐6. [EMBASE: 70628912] [Google Scholar]
Ruggenenti 2003a {published data only}
- Ruggenenti P, Flores C, Aros C, Ene‐Iordache B, Trevisan R, Ottomano C, et al. Renal and metabolic effects of insulin lispro in type 2 diabetic subjects with overt nephropathy. Diabetes Care 2003;26(2):502‐9. [MEDLINE: ] [DOI] [PubMed] [Google Scholar]
SAVOR‐TIMI 53 2011 {published data only}
- Cahn A, Raz I, Mosenzon O, Leibowitz G, Yanuv I, Rozenberg A, et al. Predisposing factors for any and major hypoglycemia with saxagliptin versus placebo and overall: analysis from the SAVOR‐TIMI 53 trial. Diabetes care 2016;39(8):1329‐37. [MEDLINE: ] [DOI] [PubMed] [Google Scholar]
- Kalra S, Gupta Y, Baruah MP, Gupta A. Comment on Udell et al. Saxagliptin and cardiovascular outcomes in patients with type 2 diabetes and moderate or severe renal impairment: observations from the SAVOR‐TIMI 53 Trial. Diabetes Care 2015;38:696‐705. Diabetes Care 2015;38(6):e88‐9. [MEDLINE: ] [DOI] [PubMed] [Google Scholar]
- Krempf M. Study on the risk reduction of cardiovascular events with saxagliptin in type 2 diabetic patients (SAVOR‐TIMI 53): Study and patients description. Medecine des Maladies Metaboliques 2013;7(4):354‐9. [EMBASE: 2014082407] [Google Scholar]
- Leiter LA, Teoh H, Mosenzon O, Cahn A, Hirshberg B, Stahre CA, et al. Frequency of cancer events with saxagliptin in the SAVOR‐TIMI 53 trial. Diabetes, Obesity & Metabolism 2016;18(2):186‐90. [MEDLINE: ] [DOI] [PubMed] [Google Scholar]
- Mosenzon O, Leibowitz G, Bhatt DL, Cahn A, Hirshberg B, Wei C, et al. Effect of saxagliptin on renal outcomes in the SAVOR‐TIMI 53 trial. Diabetes care 2017;40(1):69‐76. [MEDLINE: ] [DOI] [PubMed] [Google Scholar]
- Mosenzon O, Raz I, Scirica BM, Hirshberg B, Stahre CI, Steg PG, et al. Baseline characteristics of the patient population in the Saxagliptin Assessment of Vascular Outcomes Recorded in patients with diabetes mellitus (SAVOR)‐TIMI 53 trial. Diabetes/Metabolism Research Reviews 2013;29(5):417‐26. [MEDLINE: ] [DOI] [PubMed] [Google Scholar]
- Mosenzon O, Scirica BM, Rozenberg A, Yanuv I, Cahn A, KyungAh I, et al. Clinically significant change in albumin creatinine ratio with saxagliptin: A post hoc analysis from the SAVOR‐TIMI 53 trial [abstract]. Diabetologia 2017;60(1 Suppl 1):S355. [EMBASE: 618052611] [Google Scholar]
- Mosenzon O, Wei C, Davidson J, Scirica BM, Yanuv I, Rozenberg A, et al. Incidence of fractures in patients with type 2 diabetes in the SAVOR‐TIMI 53 trial. Diabetes Care 2015;38(11):2142‐50. [MEDLINE: ] [DOI] [PubMed] [Google Scholar]
- Scirica BM, Bhatt DL, Braunwald E, Steg PG, Davidson J, Hirshberg B, et al. Saxagliptin and cardiovascular outcomes in patients with type 2 diabetes mellitus. New England Journal of Medicine 2013;369(14):1317‐26. [MEDLINE: ] [DOI] [PubMed] [Google Scholar]
- Scirica BM, Bhatt DL, Braunwald E, Steg PG, Davidson J, Hirshberg B, et al. The design and rationale of the saxagliptin assessment of vascular outcomes recorded in patients with diabetes mellitus‐thrombolysis in myocardial infarction (SAVOR‐TIMI) 53 study. American Heart Journal 2011;162(5):818‐25. [MEDLINE: ] [DOI] [PubMed] [Google Scholar]
- Scirica BM, Braunwald E, Raz I, Cavender MA, Morrow DA, Jarolim P, et al. Heart failure, saxagliptin, and diabetes mellitus: observations from the SAVOR‐TIMI 53 randomized trial. Circulation 2014;130(18):1579‐88. [MEDLINE: ] [DOI] [PubMed] [Google Scholar]
- Scirica BM, Raz I, Cavender MA, Steg P, Hirshberg B, Davidson J, et al. Outcomes of patients with type 2 diabetes and known congestive heart failure treated with saxagliptin: Analyses of the SAVOR‐TIMI 53 study [abstract]. Circulation 2013;128(22 Suppl 1):n/a. [EMBASE: 71339453] [Google Scholar]
- Udell JA, Bhatt DL, Braunwald E, Cavender MA, Mosenzon O, Steg PG, et al. Saxagliptin and cardiovascular outcomes in patients with type 2 diabetes and moderate or severe renal impairment: observations from the SAVOR‐TIMI 53 Trial. Diabetes Care 2015;38(4):696‐705. [MEDLINE: ] [DOI] [PubMed] [Google Scholar]
Scarpioni 1994 {published data only}
- Scarpioni L, Ballocchi S, Castelli A, Scarpioni R. Insulin therapy in uremic diabetic patients on continuous ambulatory peritoneal dialysis; comparison of intraperitoneal and subcutaneous administration. Peritoneal Dialysis International 1994;14(2):127‐31. [MEDLINE: ] [PubMed] [Google Scholar]
TECOS 2013 {published data only}
- Bethel MA, Engel SS, Green JB, Huang Z, Josse RG, Kaufman KD, et al. Assessing the safety of sitagliptin in older participants in the trial evaluating cardiovascular outcomes with sitagliptin (TECOS). Diabetes Care 2017;40(4):494‐501. [MEDLINE: ] [DOI] [PubMed] [Google Scholar]
- Buse JB, Bethel MA, Green JB, Stevens SR, Lokhnygina Y, Aschner P, et al. Pancreatic safety of sitagliptin in the TECOS study. Diabetes Care 2017;40(2):164‐70. [MEDLINE: ] [DOI] [PMC free article] [PubMed] [Google Scholar]
- Cornel JH, Bakris GL, Stevens SR, Alvarsson M, Bax WA, Chuang LM, et al. Effect of sitagliptin on kidney function and respective cardiovascular outcomes in type 2 diabetes: outcomes from TECOS. Diabetes care 2017;39(12):2304‐10. [MEDLINE: ] [DOI] [PubMed] [Google Scholar]
- Engel SS, Suryawanshi S, Josse RG, Peterson ED, Holman RR. Assessing the safety of sitagliptin in patients with type 2 diabetes and chronic kidney disease in the Trial Evaluating Cardiovascular Outcomes with Sitagliptin (TECOS) [abstract]. Diabetologia 2016;59(1 Suppl 1):S361. [EMBASE: 612313326] [Google Scholar]
- Green JB, Bethel MA, Armstrong PW, Buse JB, Engel SS, Garg J, et al. Effect of sitagliptin on cardiovascular outcomes in type 2 diabetes.[Erratum appears in N Engl J Med. 2015 Aug 6;373(6):586; PMID: 26182233]. New England Journal of Medicine 2015;373(3):232‐42. [MEDLINE: ] [DOI] [PubMed] [Google Scholar]
- Green JB, Bethel MA, Paul SK, Ring A, Kaufman KD, Shapiro DR, et al. Rationale, design, and organization of a randomized, controlled Trial Evaluating Cardiovascular Outcomes with Sitagliptin (TECOS) in patients with type 2 diabetes and established cardiovascular disease. American Heart Journal 2013;166(6):983‐9. [MEDLINE: ] [DOI] [PubMed] [Google Scholar]
- McGuire DK, Werf F, Armstrong PW, Standl E, Koglin J, Green JB, et al. Association between sitagliptin use and heart failure hospitalization and related outcomes in type 2 diabetes mellitus: secondary analysis of a randomized clinical trial. JAMA Cardiology 2016;1(2):126‐35. [MEDLINE: ] [DOI] [PubMed] [Google Scholar]
- Pagidipati NJ, Navar AM, Pieper KS, Green JB, Bethel MA, Armstrong PW, et al. Secondary prevention of cardiovascular disease in patients with type 2 diabetes mellitus: international insights from the TECOS Trial (Trial Evaluating Cardiovascular Outcomes With Sitagliptin). Circulation 2017;136(13):1193‐203. [MEDLINE: ] [DOI] [PMC free article] [PubMed] [Google Scholar]
Wong 2005 {published data only}
- Wong TY, Szeto CC, Chow KM, Leung CB, Lam CW, Li PK. Rosiglitazone reduces insulin requirement and C‐reactive protein levels in type 2 diabetic patients receiving peritoneal dialysis. American Journal of Kidney Diseases 2005;46(4):713‐9. [MEDLINE: ] [DOI] [PubMed] [Google Scholar]
Yale 2013 {published and unpublished data}
- Bakris G, Yale JF, Wajs E, Li X, Usiskin K, Meininger G. Efficacy and safety of canagliflozin (CANA) in subjects with type 2 diabetes mellitus (t2dm) and moderate renal impairment [abstract no:TH‐PO536]. Journal of the American Society of Nephrology 2012;23(Abstracts):220A. [Google Scholar]
- Nieto Iglesias J, Yale JF, Bakris G, Cariou B, Wajs E, Figueroa K, et al. Efficacy and safety of canagliflozin in subjects with type 2 diabetes mellitus and chronic kidney disease over 52 weeks [abstract no: 951]. Diabetologia 2013;56(Suppl 1):S381. [Google Scholar]
- Yale J, Bakris G, Cariou B, Iglesias JN, Wajs E, Figueroa K, et al. Efficacy and safety of canagliflozin (CANA) in subjects with type 2 diabetes mellitus (T2DM) and chronic kidney disease (CKD) over 52 weeks [abstract]. Diabetes 2013;62(Suppl 1):A277‐8. [EMBASE: 71287507] [Google Scholar]
- Yale JF, Bakris G, Cariou B, Nieto Iglesias J, Wajs E, Figueroa K, et al. Efficacy and safety of canagliflozin (CANA) in subjects with type 2 diabetes mellitus T2DM) and chronic kidney disease (CKD) over 52 weeks [abstract no: 71]. Canadian Journal of Diabetes 2015;37(Suppl 4):S27. [Google Scholar]
- Yale JF, Bakris G, Cariou B, Nieto J, David‐Neto E, Yue D, et al. Efficacy and safety of canagliflozin over 52 weeks in patients with type 2 diabetes mellitus and chronic kidney disease. Diabetes, Obesity & Metabolism 2014;16(10):1016‐27. [MEDLINE: ] [DOI] [PubMed] [Google Scholar]
- Yale JF, Bakris G, Cariou B, Yue D, David‐Neto E, Xi L, et al. Efficacy and safety of canagliflozin in subjects with type 2 diabetes and chronic kidney disease. Diabetes, Obesity & Metabolism 2013;15(5):463‐73. [MEDLINE: ] [DOI] [PMC free article] [PubMed] [Google Scholar]
- Yale JF, Bakris G, Wajs E, Xi L, Figueroa K, Usiskin K, et al. Canagliflozin, a sodium glucose co‐transporter 2 inhibitor, improves glycaemic control and is well tolerated in type 2 diabetes subjects with moderate renal impairment [abstract no:759]. Diabetologia 2012;55(Suppl 1):S312. [Google Scholar]
- Yale JF, Bakris G, Xi L, Figueroa K, Wajs E, Usiskin K, et al. Canagliflozin (CANA), a sodium glucose co‐transporter 2 (SGLT2) inhibitor, improves glycemia and is well tolerated in type 2 diabetes mellitus (T2DM) subjects with moderate renal impairment [abstract no:139]. Canadian Journal of Diabetes 2012;36(5 Suppl):S40‐1. [Google Scholar]
- Yale JF, Bakris GL, Cariou B, Nieto Iglesias J, Wajs E, Figueroa K, et al. Efficacy and safety of canagliflozin (CANA) in subjects with type 2 diabetes mellitus (T2DM) and chronic kidney disease (CKD) over 52 weeks [abstract no: 0175‐P]. 73rd Scientific Sessions of the American Diabetes Association; 21‐25 June 2013; Chicago, IL. 2013.
Yki‐Järvinen 2013 {published data only}
- Sheu WH, Park SW, Gong Y, Pinnetti S, Bhattacharya S, Patel S, et al. Linagliptin improves glycemic control after 1 year as add‐on therapy to basal insulin in Asian patients with type 2 diabetes mellitus. Current Medical Research & Opinion 2015;31(3):503‐12. [MEDLINE: ] [DOI] [PubMed] [Google Scholar]
- Yki‐Järvinen H, Rosenstock J, Durán‐Garcia S, Pinnetti S, Bhattacharya S, Thiemann S, et al. Effects of adding linagliptin to basal insulin regimen for inadequately controlled type 2 diabetes: a ≥52‐week randomized, double‐blind study. Diabetes Care 2013;36(12):3875‐81. [MEDLINE: ] [DOI] [PMC free article] [PubMed] [Google Scholar]
Zambrowicz 2015 {published data only}
- Zambrowicz B, Lapuerta P, Strumph P, Banks P, Wilson A, Ogbaa I, et al. LX4211 therapy reduces postprandial glucose levels in patients with type 2 diabetes mellitus and renal impairment despite low urinary glucose excretion. Clinical Therapeutics 2015;37(1):71‐82. [MEDLINE: ] [DOI] [PubMed] [Google Scholar]
References to studies excluded from this review
ACCORD 2007 {published data only}
- ACCORD Study Group, ACCORD Eye Study Group, Chew EY, Ambrosius WT, Davis MD, Danis RP, et al. Effects of medical therapies on retinopathy progression in type 2 diabetes.[Erratum appears in N Engl J Med. 2011 Jan 13;364(2):190], [Erratum appears in N Engl J Med. 2012 Dec 20;367(25):2458]. New England Journal of Medicine 2010;363(3):233‐44. [MEDLINE: ] [DOI] [PMC free article] [PubMed] [Google Scholar]
- ACCORD Study Group, Buse JB, Bigger JT, Byington RP, Cooper LS, Cushman WC, et al. Action to Control Cardiovascular Risk in Diabetes (ACCORD) trial: design and methods. American Journal of Cardiology 2007;99(12A):21i‐33i. [MEDLINE: ] [DOI] [PubMed] [Google Scholar]
- ACCORD Study Group, Cushman WC, Evans GW, Byington RP, Goff DC, Grimm RH, et al. Effects of intensive blood‐pressure control in type 2 diabetes mellitus. New England Journal of Medicine 2010;362(17):1575‐85. [MEDLINE: ] [DOI] [PMC free article] [PubMed] [Google Scholar]
- ACCORD Study Group, Gerstein HC, Miller ME, Genuth S, Ismail‐Beigi F, Buse JB, et al. Long‐term effects of intensive glucose lowering on cardiovascular outcomes. New England Journal of Medicine 2011;364(9):818‐28. [MEDLINE: ] [DOI] [PMC free article] [PubMed] [Google Scholar]
- ACCORD Study Group, Ginsberg HN, Elam MB, Lovato LC, Crouse JR, Leiter LA, et al. Effects of combination lipid therapy in type 2 diabetes mellitus.[Erratum appears in N Engl J Med. 2010 May 6;362(18):1748]. New England Journal of Medicine 2010;362(17):1563‐74. [MEDLINE: ] [DOI] [PMC free article] [PubMed] [Google Scholar]
- Action to Control Cardiovascular Risk in Diabetes Study Group, Gerstein HC, Miller ME, Byington RP, Goff DC, Bigger JT, et al. Effects of intensive glucose lowering in type 2 diabetes. New England Journal of Medicine 2008;358(24):2545‐59. [MEDLINE: ] [DOI] [PMC free article] [PubMed] [Google Scholar]
- Barzilay JI, Howard AG, Evans GW, Fleg JL, Cohen RM, Booth GL, et al. Intensive blood pressure treatment does not improve cardiovascular outcomes in centrally obese hypertensive individuals with diabetes: the Action to Control Cardiovascular Risk in Diabetes (ACCORD) Blood Pressure Trial. Diabetes Care 2012;35(7):1401‐5. [MEDLINE: ] [DOI] [PMC free article] [PubMed] [Google Scholar]
- Barzilay JI, Lovato JF, Murray AM, Williamson J, Ismail‐Beigi F, Karl D, et al. Albuminuria and cognitive decline in people with diabetes and normal renal function. Clinical Journal of the American Society of Nephrology: CJASN 2013;8(11):1907‐14. [MEDLINE: ] [DOI] [PMC free article] [PubMed] [Google Scholar]
- Bonds DE, Kurashige EM, Bergenstal R, Brillon D, Domanski M, Felicetta JV, et al. Severe hypoglycemia monitoring and risk management procedures in the Action to Control Cardiovascular Risk in Diabetes (ACCORD) trial. American Journal of Cardiology 2007;99(12A):80i‐9i. [MEDLINE: ] [DOI] [PubMed] [Google Scholar]
- Bonds DE, Miller ME, Bergenstal RM, Buse JB, Byington RP, Cutler JA, et al. The association between symptomatic, severe hypoglycaemia and mortality in type 2 diabetes: retrospective epidemiological analysis of the ACCORD study. BMJ 2010;340:b4909. [MEDLINE: ] [DOI] [PMC free article] [PubMed] [Google Scholar]
- Bonds DE, Miller ME, Dudl J, Feinglos M, Ismail‐Beigi F, Malozowski S, et al. Severe hypoglycemia symptoms, antecedent behaviors, immediate consequences and association with glycemia medication usage: Secondary analysis of the ACCORD clinical trial data. BMC Endocrine Disorders 2012;12:5. [MEDLINE: ] [DOI] [PMC free article] [PubMed] [Google Scholar]
- Chew EY, Ambrosius WT, Howard LT, Greven CM, Johnson S, Danis RP, et al. Rationale, design, and methods of the Action to Control Cardiovascular Risk in Diabetes Eye Study (ACCORD‐EYE). American Journal of Cardiology 2007;99(12A):103i‐11i. [MEDLINE: ] [DOI] [PubMed] [Google Scholar]
- Cushman WC, Grimm RH, Cutler JA, Evans GW, Capes S, Corson MA, et al. Rationale and design for the blood pressure intervention of the Action to Control Cardiovascular Risk in Diabetes (ACCORD) trial. American Journal of Cardiology 2007;99(12A):44i‐55i. [MEDLINE: ] [DOI] [PubMed] [Google Scholar]
- Fatemi O, Yuriditsky E, Tsioufis C, Tsachris D, Morgan T, Basile J, et al. Impact of intensive glycemic control on the incidence of atrial fibrillation and associated cardiovascular outcomes in patients with type 2 diabetes mellitus (from the Action to Control Cardiovascular Risk in Diabetes Study). American Journal of Cardiology 2014;114(8):1217‐22. [MEDLINE: ] [DOI] [PMC free article] [PubMed] [Google Scholar]
- Fonseca V, McDuffie R, Calles J, Cohen RM, Feeney P, Feinglos M, et al. Determinants of weight gain in the action to control cardiovascular risk in diabetes trial. Diabetes Care 2013;36(8):2162‐8. [MEDLINE: ] [DOI] [PMC free article] [PubMed] [Google Scholar]
- Genuth S, Ismail‐Beigi F. Clinical implications of the ACCORD trial. [Review]. Journal of Clinical Endocrinology & Metabolism 2012;97(1):41‐8. [MEDLINE: ] [DOI] [PubMed] [Google Scholar]
- Gerstein HC, Ambrosius WT, Danis R, Ismail‐Beigi F, Cushman W, Calles J, et al. Diabetic retinopathy, its progression, and incident cardiovascular events in the ACCORD trial. Diabetes Care 2013;36(5):1266‐71. [MEDLINE: ] [DOI] [PMC free article] [PubMed] [Google Scholar]
- Gerstein HC, Miller ME, Ismail‐Beigi F, Largay J, McDonald C, Lochnan HA, et al. Effects of intensive glycaemic control on ischaemic heart disease: analysis of data from the randomised, controlled ACCORD trial. Lancet 2014;384(9958):1936‐41. [MEDLINE: ] [DOI] [PMC free article] [PubMed] [Google Scholar]
- Gerstein HC, Riddle MC, Kendall DM, Cohen RM, Goland R, Feinglos MN, et al. Glycemia treatment strategies in the Action to Control Cardiovascular Risk in Diabetes (ACCORD) trial. American Journal of Cardiology 2007;99(12A):34i‐43i. [MEDLINE: ] [DOI] [PubMed] [Google Scholar]
- Ginsberg HN, Bonds DE, Lovato LC, Crouse JR, Elam MB, Linz PE, et al. Evolution of the lipid trial protocol of the Action to Control Cardiovascular Risk in Diabetes (ACCORD) trial. American Journal of Cardiology 2007;99(12A):56i‐67i. [MEDLINE: ] [DOI] [PubMed] [Google Scholar]
- Goff DC, Gerstein HC, Ginsberg HN, Cushman WC, Margolis KL, Byington RP, et al. Prevention of cardiovascular disease in persons with type 2 diabetes mellitus: current knowledge and rationale for the Action to Control Cardiovascular Risk in Diabetes (ACCORD) trial. American Journal of Cardiology 2007;99(12A):4i‐20i. [MEDLINE: ] [DOI] [PubMed] [Google Scholar]
- Isakova T, Craven TE, Scialla JJ, Nickolas TL, Schnall A, Barzilay J, et al. Change in estimated glomerular filtration rate and fracture risk in the Action to Control Cardiovascular Risk in Diabetes Trial. Bone 2015 Sep;78:23‐7. [MEDLINE: ] [DOI] [PMC free article] [PubMed] [Google Scholar]
- Ismail‐Beigi F, Craven T, Banerji MA, Basile J, Calles J, Cohen RM, et al. Effect of intensive treatment of hyperglycaemia on microvascular outcomes in type 2 diabetes: an analysis of the ACCORD randomised trial. Lancet 2010;376(9739):419‐30. [MEDLINE: ] [DOI] [PMC free article] [PubMed] [Google Scholar]
- Ismail‐Beigi F, Craven TE, O'Connor PJ, Karl D, Calles‐Escandon J, Hramiak I, et al. Combined intensive blood pressure and glycemic control does not produce an additive benefit on microvascular outcomes in type 2 diabetic patients. Kidney International 2012; Vol. 81, issue 6:586‐94. [MEDLINE: ] [DOI] [PMC free article] [PubMed]
- Kingry C, Bastien A, Booth G, Geraci TS, Kirpach BR, Lovato LC, et al. Recruitment strategies in the Action to Control Cardiovascular Risk in Diabetes (ACCORD) trial. American Journal of Cardiology 2007;99(12A):68i‐79i. [MEDLINE: ] [DOI] [PubMed] [Google Scholar]
- Linz PE, Lovato LC, Byington RP, O'Connor PJ, Leiter LA, Weiss D, et al. Paradoxical reduction in HDL‐C with fenofibrate and thiazolidinedione therapy in type 2 diabetes: the ACCORD Lipid Trial. Diabetes Care 2014;37(3):686‐93. [MEDLINE: ] [DOI] [PMC free article] [PubMed] [Google Scholar]
- Margolis KL, O'Connor PJ, Morgan TM, Buse JB, Cohen RM, Cushman WC, et al. Outcomes of combined cardiovascular risk factor management strategies in type 2 diabetes: the ACCORD randomized trial. Diabetes Care 2014;37(6):1721‐8. [MEDLINE: ] [DOI] [PMC free article] [PubMed] [Google Scholar]
- Meier M, Hummel M. Cardiovascular disease and intensive glucose control in type 2 diabetes mellitus: moving practice toward evidence‐based strategies. Vascular Health & Risk Management 2009;5:859‐71. [MEDLINE: ] [DOI] [PMC free article] [PubMed] [Google Scholar]
- Miller ME, Bonds DE, Gerstein HC, Seaquist ER, Bergenstal RM, Calles‐Escandon J, et al. The effects of baseline characteristics, glycaemia treatment approach, and glycated haemoglobin concentration on the risk of severe hypoglycaemia: post hoc epidemiological analysis of the ACCORD study. BMJ 2010;340:b5444. [MEDLINE: ] [DOI] [PMC free article] [PubMed] [Google Scholar]
- Miller ME, Williamson JD, Gerstein HC, Byington RP, Cushman WC, Ginsberg HN, et al. Effects of randomization to intensive glucose control on adverse events, cardiovascular disease, and mortality in older versus younger adults in the ACCORD Trial. Diabetes Care 2014;37(3):634‐43. [MEDLINE: ] [DOI] [PMC free article] [PubMed] [Google Scholar]
- Mottl AK, Pajewski N, Fonseca V, Ismail‐Beigi F, Chew E, Ambrosius WT, et al. The degree of retinopathy is equally predictive for renal and macrovascular outcomes in the ACCORD Trial. Journal of Diabetes & its Complications 2014;28(6):874‐9. [MEDLINE: ] [DOI] [PMC free article] [PubMed] [Google Scholar]
- Mychaleckyj JC, Craven T, Nayak U, Buse J, Crouse JR, Elam M, et al. Reversibility of fenofibrate therapy‐induced renal function impairment in ACCORD type 2 diabetic participants. Diabetes Care 2012; Vol. 35, issue 5:1008‐14. [MEDLINE: ] [DOI] [PMC free article] [PubMed]
- Mychaleckyj JC, Farber EA, Chmielewski J, Artale J, Light LS, Bowden DW, et al. Buffy coat specimens remain viable as a DNA source for highly multiplexed genome‐wide genetic tests after long term storage. Journal of Translational Medicine 2011;9:91. [MEDLINE: ] [DOI] [PMC free article] [PubMed] [Google Scholar]
- Nadkarni GN, Rao V, Ismail‐Beigi F, Fonseca VA, Shah SV, Simonson MS, et al. Association of Urinary Biomarkers of Inflammation, Injury, and Fibrosis with Renal Function Decline: The ACCORD Trial. Clinical Journal of the American Society of Nephrology: CJASN 2016;11(8):1343‐52. [MEDLINE: ] [DOI] [PMC free article] [PubMed] [Google Scholar]
- Papademetriou V, Lovato L, Doumas M, Nylen E, Mottl A, Cohen RM, et al. Chronic kidney disease and intensive glycemic control increase cardiovascular risk in patients with type 2 diabetes. Kidney International 2015;87(3):649‐59. [MEDLINE: ] [DOI] [PubMed] [Google Scholar]
- Papademetriou V, Zaheer M, Doumas M, Lovato L, Applegate WB, Tsioufis C, et al. Cardiovascular outcomes in action to control cardiovascular risk in diabetes: impact of blood pressure level and presence of kidney disease. American Journal of Nephrology 2016;43(4):271‐80. [MEDLINE: ] [DOI] [PubMed] [Google Scholar]
- Pop‐Busui R, Evans GW, Gerstein HC, Fonseca V, Fleg JL, Hoogwerf BJ, et al. Effects of cardiac autonomic dysfunction on mortality risk in the Action to Control Cardiovascular Risk in Diabetes (ACCORD) trial. Diabetes Care 2010;33(7):1578‐84. [MEDLINE: ] [DOI] [PMC free article] [PubMed] [Google Scholar]
- Punthakee Z, Miller ME, Launer LJ, Williamson JD, Lazar RM, Cukierman‐Yaffee T, et al. Poor cognitive function and risk of severe hypoglycemia in type 2 diabetes: post hoc epidemiologic analysis of the ACCORD trial. Diabetes Care 2012;35(4):787‐93. [MEDLINE: ] [DOI] [PMC free article] [PubMed] [Google Scholar]
- Raisch DW, Feeney P, Goff DC, Narayan KM, O'Connor PJ, Zhang P, et al. Baseline comparison of three health utility measures and the feeling thermometer among participants in the Action to Control Cardiovascular Risk in Diabetes trial. Cardiovascular Diabetology 2012;11:35. [MEDLINE: ] [DOI] [PMC free article] [PubMed] [Google Scholar]
- Reyes‐Soffer G, Ngai CI, Lovato L, Karmally W, Ramakrishnan R, Holleran S, et al. Effect of combination therapy with fenofibrate and simvastatin on postprandial lipemia in the ACCORD lipid trial. Diabetes Care 2013;36(2):422‐8. [MEDLINE: ] [DOI] [PMC free article] [PubMed] [Google Scholar]
- Riddle MC, Ambrosius WT, Brillon DJ, Buse JB, Byington RP, Cohen RM, et al. Epidemiologic relationships between A1C and all‐cause mortality during a median 3.4‐year follow‐up of glycemic treatment in the ACCORD trial. Diabetes Care 2010;33(5):983‐90. [MEDLINE: ] [DOI] [PMC free article] [PubMed] [Google Scholar]
- Samaropoulos XF, Light L, Ambrosius WT, Marcovina SM, Probstfield J, Jr DC. The effect of intensive risk factor management in type 2 diabetes on inflammatory biomarkers. Diabetes Research & Clinical Practice 2012;95(3):389‐98. [MEDLINE: ] [DOI] [PubMed] [Google Scholar]
- Seaquist ER, Miller ME, Bonds DE, Feinglos M, Goff DC, Peterson K, et al. The impact of frequent and unrecognized hypoglycemia on mortality in the ACCORD study. Diabetes Care 2012;35(2):409‐14. [MEDLINE: ] [DOI] [PMC free article] [PubMed] [Google Scholar]
- Strylewicz G, Doctor J. Evaluation of an automated method to assist with error detection in the ACCORD central laboratory. Clinical Trials 2010;7(4):380‐9. [MEDLINE: ] [DOI] [PubMed] [Google Scholar]
- Sullivan MD, Anderson RT, Aron D, Atkinson HH, Bastien A, Chen GJ, et al. Health‐related quality of life and cost‐effectiveness components of the Action to Control Cardiovascular Risk in Diabetes (ACCORD) trial: rationale and design. American Journal of Cardiology 2007;99(12A):90i‐102i. [MEDLINE: ] [DOI] [PubMed] [Google Scholar]
- Sullivan MD, O'Connor P, Feeney P, Hire D, Simmons DL, Raisch DW, et al. Depression predicts all‐cause mortality: epidemiological evaluation from the ACCORD HRQL substudy. Diabetes Care 2012;35(8):1708‐15. [MEDLINE: ] [DOI] [PMC free article] [PubMed] [Google Scholar]
- Thethi T, Rajapurkar M, Walker P, McDuffie R, Goff DC, Probstfield J, et al. Urinary catalytic iron in patients with type 2 diabetes without microalbuminuria‐‐a substudy of the ACCORD Trial. Clinical Chemistry 2011;57(2):341‐4. [MEDLINE: ] [DOI] [PubMed] [Google Scholar]
- Williamson JD, Launer LJ, Bryan RN, Coker LH, Lazar RM, Gerstein HC, et al. Cognitive function and brain structure in persons with type 2 diabetes mellitus after intensive lowering of blood pressure and lipid levels: a randomized clinical trial. JAMA Internal Medicine 2014;174(3):324‐33. [MEDLINE: ] [DOI] [PMC free article] [PubMed] [Google Scholar]
- Williamson JD, Miller ME, Bryan RN, Lazar RM, Coker LH, Johnson J, et al. The Action to Control Cardiovascular Risk in Diabetes Memory in Diabetes Study (ACCORD‐MIND): rationale, design, and methods. American Journal of Cardiology 2007;99(12A):112i‐22i. [MEDLINE: ] [DOI] [PubMed] [Google Scholar]
ADOPT 2011 {published data only}
- Kahn SE, Haffner SM, Heise MA, Herman WH, Holman RR, Jones NP, et al. Glycemic durability of rosiglitazone, metformin, or glyburide monotherapy.[erratum appears in N Engl J Med. 2007 Mar 29;356(13):1387‐8]. New England Journal of Medicine 2006;355(23):2427‐43. [MEDLINE: ] [DOI] [PubMed] [Google Scholar]
- Kahn SE, Zinman B, Haffner SM, O'Neill MC, Kravitz BG, Yu D, et al. Obesity is a major determinant of the association of C‐reactive protein levels and the metabolic syndrome in type 2 diabetes. Diabetes 2006;55(8):2357‐64. [MEDLINE: ] [DOI] [PubMed] [Google Scholar]
- Lachin JM, Viberti G, Zinman B, Haffner SM, Aftring RP, Paul G, et al. Renal function in type 2 diabetes with rosiglitazone, metformin, and glyburide monotherapy. Clinical Journal of the American Society of Nephrology: CJASN 2011;6(5):1032‐40. [MEDLINE: ] [DOI] [PMC free article] [PubMed] [Google Scholar]
- Zinman B, Kahn SE, Haffner SM, O'Neill MC, Heise MA, Freed MI, et al. Phenotypic characteristics of GAD antibody‐positive recently diagnosed patients with type 2 diabetes in North America and Europe. Diabetes 2004;53(12):3193‐200. [MEDLINE: ] [DOI] [PubMed] [Google Scholar]
ADVANCE 2001 {published data only}
- Rationale and design of the ADVANCE study: a randomised trial of blood pressure lowering and intensive glucose control in high‐risk individuals with type 2 diabetes mellitus. Action in Diabetes and Vascular Disease: PreterAx and DiamicroN Modified‐Release Controlled Evaluation. Journal of Hypertension ‐ Supplement 2001;19(4):S21‐8. [MEDLINE: ] [PubMed] [Google Scholar]
- Study rationale and design of ADVANCE: action in diabetes and vascular disease‐‐preterax and diamicron MR controlled evaluation. Diabetologia 2001;44(9):1118‐20. [MEDLINE: ] [DOI] [PubMed] [Google Scholar]
- ADVANCE Collaborative Group. ADVANCE‐‐Action in Diabetes and Vascular Disease: patient recruitment and characteristics of the study population at baseline. Diabetic Medicine 2005;22(7):882‐8. [MEDLINE: ] [DOI] [PubMed] [Google Scholar]
- ADVANCE Collaborative Group, Patel A, MacMahon S, Chalmers J, Neal B, Billot L, et al. Intensive blood glucose control and vascular outcomes in patients with type 2 diabetes. New England Journal of Medicine 2008;358(24):2560‐72. [MEDLINE: ] [DOI] [PubMed] [Google Scholar]
- Chalmers J. [ADVANCE study: objectives, design and current status]. [French]. Drugs 2003;63(Spec No 1):39‐44. [MEDLINE: ] [PubMed] [Google Scholar]
- Chalmers J, Marre M, de GB, Zoungas S, Hamet P, Neal B, et al. The efficacy of lowering HbAlc with a gliclazide modified release‐based intensive glucose lowering regimen in the ADVANCE trial [abstract]. Diabetologia 2009;52(Suppl 1):S354. [EMBASE: 70068392] [DOI] [PubMed] [Google Scholar]
- Cooper ME, Zoungas S, Jardine M, Hata J, Perkovic V, Ninomiya T, et al. Risk of major renal events in people with type 2 diabetes: Prediction models based on the ADVANCE study population [abstract]. Diabetologia 2011;54(1 Suppl):S442. [EMBASE: 70563236] [Google Scholar]
- Hata J, Arima H, Rothwell PM, Woodward M, Zoungas S, Anderson C, et al. Effects of visit‐to‐visit variability in systolic blood pressure on macrovascular and microvascular complications in patients with type 2 diabetes mellitus: the ADVANCE trial. Circulation 2013;128(12):1325‐34. [MEDLINE: ] [DOI] [PubMed] [Google Scholar]
- Heerspink HJ, Ninomiya T, Perkovic V, Woodward M, Zoungas S, Cass A, et al. Effects of a fixed combination of perindopril and indapamide in patients with type 2 diabetes and chronic kidney disease. European Heart Journal 2010;31(23):2888‐96. [MEDLINE: ] [DOI] [PubMed] [Google Scholar]
- Jardine M, Ninomiya T, Perkovic V, Woodward M, Pillai A, Cass A, et al. Predictive baseline factors for major renal events: a proportional hazards model based on the Advance Study [abstract no: F‐PO1916]. Journal of the American Society of Nephrology 2008;19(Abstracts Issue):543A. [Google Scholar]
- Jardine MJ, Hata J, Woodward M, Perkovic V, Ninomiya T, Arima H, et al. Prediction of kidney‐related outcomes in patients with type 2 diabetes. American Journal of Kidney Diseases 2012;60(5):770‐8. [MEDLINE: ] [DOI] [PubMed] [Google Scholar]
- Mohammedi K, Woodward M, Zoungas S, Li Q, Harrap S, Patel A, et al. Absence of peripheral pulses and risk of major vascular outcomes in patients with type 2 diabetes. Diabetes Care 2016;39(12):2270‐7. [MEDLINE: ] [DOI] [PubMed] [Google Scholar]
- Ninomiya T, Zoungas S, Neal B, Woodward M, Patel A, Perkovic V, et al. Efficacy and safety of routine blood pressure lowering in older patients with diabetes: results from the ADVANCE trial. Journal of Hypertension 2010;28(6):1141‐9. [MEDLINE: ] [PubMed] [Google Scholar]
- Patel A, Chalmers J, Poulter N. ADVANCE: Action in diabetes and vascular disease. Journal of Human Hypertension 2005;19(Suppl 1):S27‐32. [EMBASE: 2005306507] [DOI] [PubMed] [Google Scholar]
- Patel A, MacMahon S, Chalmers J, Neal B, Woodward M, Billot L, et al. Effects of a fixed combination of perindopril and indapamide on macrovascular and microvascular outcomes in patients with type 2 diabetes mellitus (the ADVANCE trial): a randomised controlled trial. Lancet 2007;370(9590):829‐40. [MEDLINE: ] [DOI] [PubMed] [Google Scholar]
- Perkovic V, Heerspink HL, Chalmers J, Woodward M, Jun M, Li Q, et al. Intensive glucose control improves kidney outcomes in patients with type 2 diabetes. Kidney International 2013;83(3):517‐23. [MEDLINE: ] [DOI] [PubMed] [Google Scholar]
- Perkovic V, Ninomiya T, Galan BE, Zoungas S, Cass A, Patel A, et al. Joint effects of routine blood pressure lowering and intensive glucose control in the ADVANCE trial [abstract no: LB‐002]. American Society of Nephrology (ASN) Renal Week; 2008 Nov 4‐9; Philadelphia, PA. 2008.
- Perkovic V, Zoungas S, Heerspink HL, Woodward M, Jun M, Cass A, et al. Intensive glucose lowering and end stage kidney disease ‐ new data from the ADVANCE trial [abstract no: 071]. Nephrology 2011;16(Suppl 1):42. [Google Scholar]
- Perkovic V, Galan B, Chalmers J, Ninomiya T, Patel A, Cass A, et al. Renoprotection with perindopril‐indapamide below current recommended blood pressure targets in patients with type 2 diabetes mellitus: results of the ADVANCE trial [abstract no: 085]. Nephrology 2008;13(Suppl 3):A121. [Google Scholar]
- Poulter NR. Blood pressure and glucose control in subjects with diabetes: new analyses from ADVANCE. Journal of Hypertension 2009;27 Suppl 1:S3‐8. [MEDLINE: ] [DOI] [PubMed] [Google Scholar]
- Wong G, Zoungas S, Lo S, Chalmers J, Cass A, Neal B, et al. The risk of cancer in people with diabetes and chronic kidney disease. Nephrology Dialysis Transplantation 2012;27(8):3337‐44. [MEDLINE: ] [DOI] [PubMed] [Google Scholar]
- Wong MG, Perkovic V, Chalmers J, Woodward M, Li Q, Cooper ME, et al. Long‐term benefits of intensive glucose control for preventing end‐stage kidney disease: ADVANCE‐ON. Diabetes Care 2016 May;39(5):694‐700. [MEDLINE: ] [DOI] [PubMed] [Google Scholar]
- Zoungas S, Chalmers J, Ninomiya T, Li Q, Cooper ME, Colagiuri S, et al. Association of HbA1c levels with vascular complications and death in patients with type 2 diabetes: evidence of glycaemic thresholds. Diabetologia 2012;55(3):636‐43. [MEDLINE: ] [DOI] [PubMed] [Google Scholar]
- Zoungas S, Lambers Heerspink HJ, Chalmers J, Woodward M, Jun M, Cass A, et al. Intensive glucose lowering and end stage kidney disease: New data from the ADVANCE trial [abstract]. Diabetologia 2011;54(1 Suppl):S23. [EMBASE: 70562184] [Google Scholar]
- Zoungas S, Patel A, Chalmers J, Galan BE, Li Q, Billot L, et al. Severe hypoglycemia and risks of vascular events and death. New England Journal of Medicine 2010;363(15):1410‐8. [MEDLINE: ] [DOI] [PubMed] [Google Scholar]
- Zoungas S, Perkovic V, Ninomiya T, de GB, Pillai I, Patel A, et al. Joint effects of blood pressure lowering and glucose control in the ADVANCE trial [abstract]. Hypertension 2009;53(6):1103. [EMBASE: 70036220] [Google Scholar]
- Zoungas S, Galan BE, Ninomiya T, Grobbee D, Hamet P, Heller S, et al. Combined effects of routine blood pressure lowering and intensive glucose control on macrovascular and microvascular outcomes in patients with type 2 diabetes: New results from the ADVANCE trial. Diabetes Care 2009;32(11):2068‐74. [MEDLINE: ] [DOI] [PMC free article] [PubMed] [Google Scholar]
- Galan BE, Ninomiya T, Perrovic V, Pillai A, Patel A, Neal ACB, et al. Renoprotective effects of blood pressure lowering with perindopril‐indapamide below current targets in people with type 2 diabetes mellitus: Results of the ADVANCE trial [abstract]. Diabetes 2008;57(Suppl 1):A218‐9. [Google Scholar]
- Galan BE, Perkovic V, Ninomiya T, Pillai A, Patel A, Cass A, et al. Lowering blood pressure reduces renal events in type 2 diabetes. Journal of the American Society of Nephrology 2009;20(4):883‐92. [MEDLINE: ] [DOI] [PMC free article] [PubMed] [Google Scholar]
Agarwal 2005 {published data only}
- Agarwal R. Anti‐inflammatory effects of short‐term pioglitazone therapy in men with advanced diabetic nephropathy. American Journal of Physiology ‐ Renal Physiology 2006;290(3):F600‐5. [MEDLINE: ] [DOI] [PubMed] [Google Scholar]
- Agarwal R, Saha C, Battiwala M, Vasavada N, Curley T, Chase SD, et al. A pilot randomized controlled trial of renal protection with pioglitazone in diabetic nephropathy. Kidney International 2005;68(1):285‐92. [MEDLINE: ] [DOI] [PubMed] [Google Scholar]
Aljabri 2004 {published data only}
- Aljabri K, Kozak SE, Thompson DM. Addition of pioglitazone or bedtime insulin to maximal doses of sulfonylurea and metformin in type 2 diabetes patients with poor glucose control: a prospective, randomized trial. American Journal of Medicine 2004;116(4):230‐5. [MEDLINE: ] [DOI] [PubMed] [Google Scholar]
Amador‐Licona 2000 {published data only}
- Amador‐Licona N, Guizar‐Mendoza J, Vargas E, Sanchez‐Camargo G, Zamora‐Mata L. The short‐term effect of a switch from glibenclamide to metformin on blood pressure and microalbuminuria in patients with type 2 diabetes mellitus. Archives of Medical Research 2000;31(6):571‐5. [MEDLINE: ] [DOI] [PubMed] [Google Scholar]
Aoki 1995 {published data only}
- Aoki TT, Grecu EO, Prendergast JJ, Arcangeli MA, Meisenheimer R. Effect of chronic intermittent intravenous insulin therapy on antihypertensive medication requirements in IDDM subjects with hypertension and nephropathy. Diabetes Care 1995;18(9):1260‐5. [MEDLINE: ] [DOI] [PubMed] [Google Scholar]
APRIME 2011 {published data only}
- Morikawa A, Ishizeki K, Iwashima Y, Yokoyama H, Muto E, Oshima E, et al. Pioglitazone reduces urinary albumin excretion in renin‐angiotensin system inhibitor‐treated type 2 diabetic patients with hypertension and microalbuminuria: the APRIME study. Clinical & Experimental Nephrology 2011;15(6):848‐53. [MEDLINE: ] [DOI] [PubMed] [Google Scholar]
Bakris 2006 {published data only}
- Bakris GL, Ruilope LM, McMorn SO, Weston WM, Heise MA, Freed MI, et al. Rosiglitazone reduces microalbuminuria and blood pressure independently of glycemia in type 2 diabetes patients with microalbuminuria. Journal of Hypertension 2006;24(10):2047‐55. [MEDLINE: ] [DOI] [PubMed] [Google Scholar]
Bangstad 1992 {published data only}
- Bangstad HJ. Early glomerulopathy is present in young, type 1 (insulin‐dependent) diabetic patients with microalbuminuria. Diabetologia 1993;36(6):523‐9. [MEDLINE: ] [DOI] [PubMed] [Google Scholar]
- Bangstad HJ, Kofoed‐Enevoldsen A, Dahl‐Jorgensen K, Hanssen KF. Glomerular charge selectivity and the influence of improved blood glucose control in type 1 (insulin‐dependent) diabetic patients with microalbuminuria. Diabetologia 1992;35(12):1165‐9. [MEDLINE: ] [DOI] [PubMed] [Google Scholar]
- Bangstad HJ, Osterby R, Dahl‐Jorgensen K, Berg KJ, Hartmann A, Hanssen KF. Improvement of blood glucose control in IDDM patients retards the progression of morphological changes in early diabetic nephropathy. Diabetologia 1994;37(5):483‐90. [MEDLINE: ] [DOI] [PubMed] [Google Scholar]
- Berg TJ, Nourooz‐Zadeh J, Wolff SP, Tritschler HJ, Bangstad HJ, Hanssen KF. Hydroperoxides in plasma are reduced by intensified insulin treatment. A randomized controlled study of IDDM patients with microalbuminuria. Diabetes Care 1998;21(8):1295‐300. [MEDLINE: ] [DOI] [PubMed] [Google Scholar]
- Hartmann A, Bangstad HJ, Holdass H, Fauchald P, Hanssen KF, Dahl‐Jorgensen K, et al. Effects of glucose control on renal tubular and glomerular functions in incipient IDDM nephropathy [abstract]. Nephrology 1997;3(Suppl 1):S378. [CENTRAL: CN‐00460903] [Google Scholar]
BARI 2D 2011 {published data only}
- Abbott JD, Lombardero MS, Barsness GW, Pena‐Sing I, Buitron LV, Singh P, et al. Ankle‐brachial index and cardiovascular outcomes in the Bypass Angioplasty Revascularization Investigation 2 Diabetes trial. American Heart Journal 2012;164(4):585‐90. [MEDLINE: ] [DOI] [PMC free article] [PubMed] [Google Scholar]
- Albu J, Gottlieb SH, August P, Nesto RW, Orchard TJ, Bypass ARI. Modifications of coronary risk factors. American Journal of Cardiology 2006;97(12A):41G‐52G. [MEDLINE: ] [DOI] [PMC free article] [PubMed] [Google Scholar]
- Albu JB, Lu J, Mooradian AD, Krone RJ, Nesto RW, Porter MH, et al. Relationships of obesity and fat distribution with atherothrombotic risk factors: baseline results from the Bypass Angioplasty Revascularization Investigation 2 Diabetes (BARI 2D) trial. Obesity 2010;18(5):1046‐54. [MEDLINE: ] [DOI] [PMC free article] [PubMed] [Google Scholar]
- Althouse AD, Abbott JD, Sutton‐Tyrrell K, Forker AD, Lombardero MS, Buitron LV, et al. Favorable effects of insulin sensitizers pertinent to peripheral arterial disease in type 2 diabetes: results from the Bypass Angioplasty Revascularization Investigation 2 Diabetes (BARI 2D) trial. Diabetes Care 2013;36(10):3269‐75. [MEDLINE: ] [DOI] [PMC free article] [PubMed] [Google Scholar]
- August P, Hardison RM, Hage FG, Marroquin OC, McGill JB, Rosenberg Y, et al. Change in albuminuria and eGFR following insulin sensitization therapy versus insulin provision therapy in the BARI 2D study. Clinical Journal of the American Society of Nephrology: CJASN 2014;9(1):64‐71. [MEDLINE: ] [DOI] [PMC free article] [PubMed] [Google Scholar]
- Bach RG, Brooks MM, Lombardero M, Genuth S, Donner TW, Garber A, et al. Rosiglitazone and outcomes for patients with diabetes mellitus and coronary artery disease in the Bypass Angioplasty Revascularization Investigation 2 Diabetes (BARI 2D) trial. Circulation 2013;128(8):785‐94. [MEDLINE: ] [DOI] [PMC free article] [PubMed] [Google Scholar]
- Barsness GW, Gersh BJ, Brooks MM, Frye RL, BARI 2DTI. Rationale for the revascularization arm of the Bypass Angioplasty Revascularization Investigation 2 Diabetes (BARI 2D) Trial. American Journal of Cardiology 2006;97(12A):31G‐40G. [MEDLINE: ] [DOI] [PubMed] [Google Scholar]
- Beohar N, Davidson CJ, Massaro EM, Srinivas VS, Sansing VV, Zonszein J, et al. The impact of race/ethnicity on baseline characteristics and the burden of coronary atherosclerosis in the Bypass Angioplasty Revascularization Investigation 2 Diabetes trial. American Heart Journal 2011;161(4):755‐63. [MEDLINE: ] [DOI] [PubMed] [Google Scholar]
- Beohar N, Sansing VV, Davis AM, Srinivas VS, Helmy T, Althouse AD, et al. Race/ethnic disparities in risk factor control and survival in the bypass angioplasty revascularization investigation 2 diabetes (BARI 2D) trial. American Journal of Cardiology 2013;112(9):1298‐305. [MEDLINE: ] [DOI] [PMC free article] [PubMed] [Google Scholar]
- Brooks MM, Chaitman BR, Nesto RW, Hardison RM, Feit F, Gersh BJ, et al. Clinical and angiographic risk stratification and differential impact on treatment outcomes in the Bypass Angioplasty Revascularization Investigation 2 Diabetes (BARI 2D) trial. Circulation 2012;126(17):2115‐24. [MEDLINE: ] [DOI] [PMC free article] [PubMed] [Google Scholar]
- Brooks MM, Chung SC, Helmy T, Hillegass WB, Escobedo J, Melsop KA, et al. Health status after treatment for coronary artery disease and type 2 diabetes mellitus in the Bypass Angioplasty Revascularization Investigation 2 Diabetes trial. Circulation 2010;122(17):1690‐9. [MEDLINE: ] [DOI] [PMC free article] [PubMed] [Google Scholar]
- Brooks MM, Frye RL, Genuth S, Detre KM, Nesto R, Sobel BE, et al. Hypotheses, design, and methods for the Bypass Angioplasty Revascularization Investigation 2 Diabetes (BARI 2D) Trial. American Journal of Cardiology 2006;97(12A):9G‐19G. [MEDLINE: ] [DOI] [PubMed] [Google Scholar]
- Bypass ARI. Baseline characteristics of patients with diabetes and coronary artery disease enrolled in the Bypass Angioplasty Revascularization Investigation 2 Diabetes (BARI 2D) trial. American Heart Journal 2008;156(3):528‐36. [MEDLINE: ] [DOI] [PMC free article] [PubMed] [Google Scholar]
- Chaitman BR, Hardison RM, Adler D, Gebhart S, Grogan M, Ocampo S, et al. The Bypass Angioplasty Revascularization Investigation 2 Diabetes randomized trial of different treatment strategies in type 2 diabetes mellitus with stable ischemic heart disease: impact of treatment strategy on cardiac mortality and myocardial infarction.[Erratum appears in Circulation. 2010 Mar 30;121(12):e254]. Circulation 2009;120(25):2529‐40. [MEDLINE: ] [DOI] [PMC free article] [PubMed] [Google Scholar]
- Chung SC, Hlatky MA, Faxon D, Ramanathan K, Adler D, Mooradian A, et al. The effect of age on clinical outcomes and health status BARI 2D (Bypass Angioplasty Revascularization Investigation in Type 2 Diabetes). Journal of the American College of Cardiology 2011;58(8):810‐9. [MEDLINE: ] [DOI] [PMC free article] [PubMed] [Google Scholar]
- Chung SC, Hlatky MA, Stone RA, Rana JS, Escobedo J, Rogers WJ, et al. Body mass index and health status in the Bypass Angioplasty Revascularization Investigation 2 Diabetes Trial (BARI 2D). American Heart Journal 2011;162(1):184‐92. [MEDLINE: ] [DOI] [PMC free article] [PubMed] [Google Scholar]
- Cresci S, Wu J, Province MA, Spertus JA, Steffes M, McGill JB, et al. Peroxisome proliferator‐activated receptor pathway gene polymorphism associated with extent of coronary artery disease in patients with type 2 diabetes in the bypass angioplasty revascularization investigation 2 diabetes trial. Circulation 2011 Sep 27;124(13):1426‐34. [MEDLINE: ] [DOI] [PMC free article] [PubMed] [Google Scholar]
- Dagenais GR, Lu J, Faxon DP, Bogaty P, Adler D, Fuentes F, et al. Prognostic impact of the presence and absence of angina on mortality and cardiovascular outcomes in patients with type 2 diabetes and stable coronary artery disease: results from the BARI 2D (Bypass Angioplasty Revascularization Investigation 2 Diabetes) trial. Journal of the American College of Cardiology 2013;61(7):702‐11. [MEDLINE: ] [DOI] [PMC free article] [PubMed] [Google Scholar]
- Dagenais GR, Lu J, Faxon DP, Kent K, Lago RM, Lezama C, et al. Effects of optimal medical treatment with or without coronary revascularization on angina and subsequent revascularizations in patients with type 2 diabetes mellitus and stable ischemic heart disease. Circulation 2011;123(14):1492‐500. [MEDLINE: ] [DOI] [PubMed] [Google Scholar]
- Escobedo J, Rana JS, Lombardero MS, Albert SG, Davis AM, Kennedy FP, et al. Association between albuminuria and duration of diabetes and myocardial dysfunction and peripheral arterial disease among patients with stable coronary artery disease in the BARI 2D study. Mayo Clinic Proceedings 2010;85(1):41‐6. [MEDLINE: ] [DOI] [PMC free article] [PubMed] [Google Scholar]
- Farkouh ME, Boden WE, Bittner V, Muratov V, Hartigan P, Ogdie M, et al. Risk factor control for coronary artery disease secondary prevention in large randomized trials. Journal of the American College of Cardiology 2013;61(15):1607‐15. [MEDLINE: ] [DOI] [PubMed] [Google Scholar]
- Grogan M, Jenkins M, Sansing VV, MacGregor J, Brooks MM, Julien‐Williams P, et al. Health insurance status and control of diabetes and coronary artery disease risk factors on enrollment into the Bypass Angioplasty Revascularization Investigation 2 Diabetes (BARI 2D) trial. Diabetes Educator 2010 Sep;36(5):774‐83. [MEDLINE: ] [DOI] [PubMed] [Google Scholar]
- Hlatky MA, Boothroyd DB, Melsop KA, Kennedy L, Rihal C, Rogers WJ, et al. Economic outcomes of treatment strategies for type 2 diabetes mellitus and coronary artery disease in the Bypass Angioplasty Revascularization Investigation 2 Diabetes trial. Circulation 2009;120(25):2550‐8. [MEDLINE: ] [DOI] [PMC free article] [PubMed] [Google Scholar]
- Hlatky MA, Melsop KA, Boothroyd DB, Bypass ARI. Economic evaluation of alternative strategies to treat patients with diabetes mellitus and coronary artery disease. American Journal of Cardiology 2006;97(12A):59G‐65G. [MEDLINE: ] [DOI] [PubMed] [Google Scholar]
- Iskandrian AE, Heo J, Mehta D, Tauxe EL, Yester M, Hall MB, et al. Gated SPECT perfusion imaging for the simultaneous assessment of myocardial perfusion and ventricular function in the BARI 2D trial: an initial report from the Nuclear Core Laboratory. Journal of Nuclear Cardiology 2006;13(1):83‐90. [MEDLINE: ] [DOI] [PubMed] [Google Scholar]
- Kim LJ, King SB, Kent K, Brooks MM, Kip KE, Abbott JD, et al. Factors related to the selection of surgical versus percutaneous revascularization in diabetic patients with multivessel coronary artery disease in the BARI 2D (Bypass Angioplasty Revascularization Investigation in Type 2 Diabetes) trial. Jacc: Cardiovascular Interventions 2009;2(5):384‐92. [MEDLINE: ] [DOI] [PMC free article] [PubMed] [Google Scholar]
- Kim LJ, King SB, Kent K, Brooks MM, Kip KE, Abbott JD, et al. Factors related to the selection of surgical versus percutaneous revascularization in diabetic patients with multivessel coronary artery disease in the BARI 2D (Bypass Angioplasty Revascularization Investigation in Type 2 Diabetes) trial. Jacc: Cardiovascular Interventions 2009;2(5):384‐92. [MEDLINE: ] [DOI] [PMC free article] [PubMed] [Google Scholar]
- Krishnaswami A, Hardison R, Nesto RW, Sobel B, BARI 2D Investigators. Presentation in patients with angiographically documented coronary artery disease and type II diabetes mellitus (from the BARI 2D Clinical Trial). American Journal of Cardiology 2012;109(1):36‐41. [MEDLINE: ] [DOI] [PMC free article] [PubMed] [Google Scholar]
- Krishnaswami A, Hardison R, Nesto RW, Sobel B, BARI 2D Investigators. Presentation in patients with angiographically documented coronary artery disease and type II diabetes mellitus (from the BARI 2D Clinical Trial). American Journal of Cardiology 2012;109(1):36‐41. [MEDLINE: ] [DOI] [PMC free article] [PubMed] [Google Scholar]
- Mafrici A, Briguori C. [The BARI 2D study]. [Italian]. Giornale Italiano di Cardiologia 2010;11(10):711‐7. [MEDLINE: ] [PubMed] [Google Scholar]
- Magee MF, Isley WL, BARI 2D Investigators. Rationale, design, and methods for glycemic control in the Bypass Angioplasty Revascularization Investigation 2 Diabetes (BARI 2D) Trial. American Journal of Cardiology 2006;97(12A):20G‐30G. [MEDLINE: ] [DOI] [PubMed] [Google Scholar]
- McBane RD, Hardison RM, Sobel BE, BARI 2D Study Group. Comparison of plasminogen activator inhibitor‐1, tissue type plasminogen activator antigen, fibrinogen, and D‐dimer levels in various age decades in patients with type 2 diabetes mellitus and stable coronary artery disease (from the BARI 2D trial). American Journal of Cardiology 2010;105(1):17‐24. [MEDLINE: ] [DOI] [PMC free article] [PubMed] [Google Scholar]
- Pambianco G, Lombardero M, Bittner V, Forker A, Kennedy F, Krishnaswami A, et al. Control of lipids at baseline in the Bypass Angioplasty Revascularization Investigation 2 Diabetes (BARI 2D) trial. Preventive Cardiology 2009;12(1):9‐18. [MEDLINE: ] [DOI] [PMC free article] [PubMed] [Google Scholar]
- Pop‐Busui R, Lombardero M, Lavis V, Forker A, Green J, Korytkowski M, et al. Relation of severe coronary artery narrowing to insulin or thiazolidinedione use in patients with type 2 diabetes mellitus (from the Bypass Angioplasty Revascularization Investigation 2 Diabetes Study). American Journal of Cardiology 2009;104(1):52‐8. [MEDLINE: ] [DOI] [PMC free article] [PubMed] [Google Scholar]
- Pop‐Busui R, Lu J, Brooks MM, Albert S, Althouse AD, Escobedo J, et al. Impact of glycemic control strategies on the progression of diabetic peripheral neuropathy in the Bypass Angioplasty Revascularization Investigation 2 Diabetes (BARI 2D) Cohort. Diabetes Care 2013;36(10):3208‐15. [MEDLINE: ] [DOI] [PMC free article] [PubMed] [Google Scholar]
- Pop‐Busui R, Lu J, Lopes N, Jones TL, BARI 2D Investigators. Prevalence of diabetic peripheral neuropathy and relation to glycemic control therapies at baseline in the BARI 2D cohort. Journal of the Peripheral Nervous System 2009;14(1):1‐13. [MEDLINE: ] [DOI] [PMC free article] [PubMed] [Google Scholar]
- Rana JS, Hardison RM, Pop‐Busui R, Brooks MM, Jones TL, Nesto RW, et al. Resting heart rate and metabolic syndrome in patients with diabetes and coronary artery disease in bypass angioplasty revascularization investigation 2 diabetes (BARI 2D) trial. Preventive Cardiology 2010;13(3):112‐6. [MEDLINE: ] [DOI] [PubMed] [Google Scholar]
- Schneider DJ, Hardison RM, Lopes N, Sobel BE, Brooks MM, Pro‐Thrombosis Ancillary Study Group. Association between increased platelet P‐selectin expression and obesity in patients with type 2 diabetes: a BARI 2D (Bypass Angioplasty Revascularization Investigation 2 Diabetes) substudy. Diabetes Care 2009;32(5):944‐9. [MEDLINE: ] [DOI] [PMC free article] [PubMed] [Google Scholar]
- Schwartz L, Bertolet M, Feit F, Fuentes F, Sako EY, Toosi MS, et al. Impact of completeness of revascularization on long‐term cardiovascular outcomes in patients with type 2 diabetes mellitus: results from the Bypass Angioplasty Revascularization Investigation 2 Diabetes (BARI 2D). Circulation: Cardiovascular Interventions 2012;5(2):166‐73. [MEDLINE: ] [DOI] [PubMed] [Google Scholar]
- Schwartz L, Kip KE, Alderman E, Lu J, Bates ER, Srinivas V, et al. Baseline coronary angiographic findings in the Bypass Angioplasty Revascularization Investigation 2 Diabetes trial (BARI 2D). American Journal of Cardiology 2009;103(5):632‐8. [MEDLINE: ] [DOI] [PubMed] [Google Scholar]
- Schwartz L, Kip KE, Alderman E, Lu J, Bates ER, Srinivas V, et al. Baseline coronary angiographic findings in the Bypass Angioplasty Revascularization Investigation 2 Diabetes trial (BARI 2D). American Journal of Cardiology 2009;103(5):632‐8. [MEDLINE: ] [DOI] [PubMed] [Google Scholar]
- Shah B, Srinivas VS, Lu J, Brooks MM, Bates ER, Nedeljkovic ZS, et al. Change in enrollment patterns, patient selection, and clinical outcomes with the availability of drug‐eluting stents in the Bypass Angioplasty Revascularization Investigation 2 Diabetes trial. American Heart Journal 2013 Sep;166(3):519‐26. [MEDLINE: ] [DOI] [PMC free article] [PubMed] [Google Scholar]
- Shaw LJ, Cerqueira MD, Brooks MM, Althouse AD, Sansing VV, Beller GA, et al. Impact of left ventricular function and the extent of ischemia and scar by stress myocardial perfusion imaging on prognosis and therapeutic risk reduction in diabetic patients with coronary artery disease: results from the Bypass Angioplasty Revascularization Investigation 2 Diabetes (BARI 2D) trial. Journal of Nuclear Cardiology 2012;19(4):658‐69. [MEDLINE: ] [DOI] [PMC free article] [PubMed] [Google Scholar]
- Singh PP, Abbott JD, Lombardero MS, Sutton‐Tyrrell K, Woodhead G, Venkitachalam L, et al. The prevalence and predictors of an abnormal ankle‐brachial index in the Bypass Angioplasty Revascularization Investigation 2 Diabetes (BARI 2D) trial. Diabetes Care 2011;34(2):464‐7. [MEDLINE: ] [DOI] [PMC free article] [PubMed] [Google Scholar]
- Sobel BE, BARI 2DTI. Ancillary studies in the Bypass Angioplasty Revascularization Investigation 2 Diabetes (BARI 2D) Trial: Synergies and opportunities. American Journal of Cardiology 2006;97(12A):53G‐8G. [MEDLINE: ] [DOI] [PubMed] [Google Scholar]
- Sobel BE, Hardison RM, Genuth S, Brooks MM, McBane RD, Schneider DJ, et al. Profibrinolytic, antithrombotic, and antiinflammatory effects of an insulin‐sensitizing strategy in patients in the Bypass Angioplasty Revascularization Investigation 2 Diabetes (BARI 2D) trial. Circulation 2011;124(6):695‐703. [MEDLINE: ] [DOI] [PMC free article] [PubMed] [Google Scholar]
- Tamis‐Holland JE, Lu J, Bittner V, Magee MF, Lopes N, Adler DS, et al. Sex, clinical symptoms, and angiographic findings in patients with diabetes mellitus and coronary artery disease (from the Bypass Angioplasty Revascularization Investigation [BARI] 2 Diabetes trial). American Journal of Cardiology 2011;107(7):980‐5. [MEDLINE: ] [DOI] [PubMed] [Google Scholar]
- Tamis‐Holland JE, Lu J, Korytkowski M, Magee M, Rogers WJ, Lopes N, et al. Sex differences in presentation and outcome among patients with type 2 diabetes and coronary artery disease treated with contemporary medical therapy with or without prompt revascularization: a report from the BARI 2D Trial (Bypass Angioplasty Revascularization Investigation 2 Diabetes). Journal of the American College of Cardiology 2013;61(17):1767‐76. [MEDLINE: ] [DOI] [PubMed] [Google Scholar]
- Thomas SB, Sansing VV, Davis A, Magee M, Massaro E, Srinivas VS, et al. Racial differences in the association between self‐rated health status and objective clinical measures among participants in the BARI 2D trial. American Journal of Public Health 2010;100 Suppl 1:S269‐76. [MEDLINE: ] [DOI] [PMC free article] [PubMed] [Google Scholar]
- Wall BM, Hardison RM, Molitch ME, Marroquin OC, McGill JB, August PA, et al. High prevalence and diversity of kidney dysfunction in patients with type 2 diabetes mellitus and coronary artery disease: the BARI 2D baseline data. American Journal of the Medical Sciences 2010;339(5):401‐10. [MEDLINE: ] [DOI] [PMC free article] [PubMed] [Google Scholar]
Barnett 1984 {published data only}
- Barnett AH, Wakelin K, Leatherdale BA, Britton JR, Polak A, Bennett J, et al. Specific thromboxane synthetase inhibition and albumin excretion rate in insulin‐dependent diabetes. Lancet 1984;1(8390):1322‐5. [MEDLINE: ] [DOI] [PubMed] [Google Scholar]
CANTATA‐SU 2016 {published data only}
- Cefalu WT, Leiter LA, Yoon KH, Arias P, Niskanen L, Xie J, et al. Efficacy and safety of canagliflozin versus glimepiride in patients with type 2 diabetes inadequately controlled with metformin (CANTATA‐SU): 52 week results from a randomised, double‐blind, phase 3 non‐inferiority trial. Lancet 2013;382(9896):941‐50. [MEDLINE: ] [DOI] [PubMed] [Google Scholar]
- Heerspink HJ, Desai M, Jardine M, Balis D, Meininger G, Perkovic V. Canagliflozin slows progression of renal function decline independently of glycemic effects. Journal of the American Society of Nephrology 2017;28(1):368‐75. [MEDLINE: ] [DOI] [PMC free article] [PubMed] [Google Scholar]
- Heerspink HJL, Desai M, Jardine M, Meininger G, Perkovic V. Canagliflozin slows progression of renal function decline independent of glycaemic effects [abstract]. Diabetologia 2016;59(1 Suppl 1):S28. [EMBASE: 612313272] [Google Scholar]
Cao 2005 {published data only}
- Cao WH, Lan CH, Wang XL, Sun JH. The effects of pioglitazone on urinary albumin in excretion rate of early diabetic nephropathy. Chinese General Practice 2005;8(18):1484‐5. [Google Scholar]
Chacra 2009 {published data only}
- Chacra AR, Tan GH, Apanovitch A, Ravichandran S, List J, Chen R, et al. Saxagliptin added to a submaximal dose of sulphonylurea improves glycaemic control compared with uptitration of sulphonylurea in patients with type 2 diabetes: a randomised controlled trial.[Erratum appears in Int J Clin Pract. 2010 Jan;64(2):277]. International Journal of Clinical Practice 2009;63(9):1395‐406. [MEDLINE: ] [DOI] [PMC free article] [PubMed] [Google Scholar]
Chen 2004b {published data only}
- Chen WK. Clinical observation of pioglitazone in diabetic nephropathy. International Medical Healthcare Guiding Journal 2004;10(1):50‐1. [Google Scholar]
Chen 2006h {published data only}
- Chen H, Song QH, Wang ZS, Tan LL. Observation on the therapeutic effect of rosiglitazone combined with metformin on diabetic nephropathy. China Tropical Medicine 2006;6(7):1194‐5. [Google Scholar]
Christensen 1986 {published data only}
- Christensen CK, Christiansen JS, Christensen T, Hermansen K, Mogensen CE. The effect of six months continuous subcutaneous insulin infusion on kidney function and size in insulin‐dependent diabetics. Diabetic Medicine 1986 Jan;3(1):29‐32. [MEDLINE: ] [DOI] [PubMed] [Google Scholar]
Christensen 2001c {published data only}
- Christensen PK, Lund S, Parving HH. The impact of glycaemic control on autoregulation of glomerular filtration rate in patients with non‐insulin dependent diabetes. Scandinavian Journal of Clinical & Laboratory Investigation 2001 Feb;61(1):43‐50. [MEDLINE: ] [DOI] [PubMed] [Google Scholar]
Chu 2006 {published data only}
- Chu P, Chiu Y, Lin J, Chen S, Wu K. The effect of low‐flux and high‐flux dialysers on endothelial dysfunction, oxidative stress and insulin resistance [abstract no: SA‐PO774]. Journal of the American Society of Nephrology 2006;17(Abstracts):738A. [Google Scholar]
- Chu PL, Chiu YL, Lin JW, Chen SI, Wu KD. Effects of low‐ and high‐flux dialyzers on oxidative stress and insulin resistance. Blood Purification 2008;26(2):213‐20. [MEDLINE: ] [DOI] [PubMed] [Google Scholar]
Ciavarella 1985 {published data only}
- Ciavarella A, Vannini P, Flammini M, Bacci L, Forlani G, Borgnino LC. Effect of long‐term near‐normoglycemia on the progression of diabetic nephropathy. Diabete et Metabolisme 1985 Feb;11(1):3‐8. [MEDLINE: ] [PubMed] [Google Scholar]
Dailey 2000 {published data only}
- Dailey GE, Boden GH, Creech RH, Johnson DG, Gleason RE, Kennedy FP, et al. Effects of pulsatile intravenous insulin therapy on the progression of diabetic nephropathy. Metabolism ‐ Clinical & Experimental 2000;49(11):1491‐5. [MEDLINE: ] [DOI] [PubMed] [Google Scholar]
- Weinrauch LA, Bayliss G, Gleason RE, Lee AT, D'Elia JA. A pilot study to assess utility of changes in elements of the Diabetes Impact Management Scale in evaluating diabetic patients for progressive nephropathy. Metabolism ‐ Clinical & Experimental 2009;58(4):492‐6. [MEDLINE: ] [DOI] [PubMed] [Google Scholar]
- Weinrauch LA, Bayliss G, Gleason RE, Lee AT, D'Elia JA. Utilization of an abbreviated diabetes impact management scale to assess change in subjective disability during a trial of pulsatile insulin delivery demonstrates benefit. Metabolism ‐ Clinical & Experimental 2009;58(4):488‐91. [MEDLINE: ] [DOI] [PubMed] [Google Scholar]
- Weinrauch LA, Burger AJ, Aepfelbacher F, Lee AT, Gleason RE, D'Elia JA. A pilot study to test the effect of pulsatile insulin infusion on cardiovascular mechanisms that might contribute to attenuation of renal compromise in type 1 diabetes mellitus patients with proteinuria. Metabolism ‐ Clinical & Experimental 2007 Nov;56(11):1453‐7. [MEDLINE: ] [DOI] [PubMed] [Google Scholar]
Davidson 2007 {published data only}
- Davidson JA, McMorn SO, Waterhouse BR, Cobitz AR. A 24‐week, multicenter, randomized, double‐blind, placebo‐controlled, parallel‐group study of the efficacy and tolerability of combination therapy with rosiglitazone and sulfonylurea in African American and Hispanic American patients with type 2 diabetes inadequately controlled with sulfonylurea monotherapy. Clinical Therapeutics 2007 Sep;29(9):1900‐14. [MEDLINE: ] [DOI] [PubMed] [Google Scholar]
DCCT 1986 {published data only}
- Al‐Kateb H, Boright AP, Mirea L, Xie X, Sutradhar R, Mowjoodi A, et al. Multiple superoxide dismutase 1/splicing factor serine alanine 15 variants are associated with the development and progression of diabetic nephropathy: the Diabetes Control and Complications Trial/Epidemiology of Diabetes Interventions and Complications Genetics study. Diabetes 2008;57(1):218‐28. [MEDLINE: ] [DOI] [PMC free article] [PubMed] [Google Scholar]
- Anonymous. Diabetes Control and Complications Trial (DCCT). Update. DCCT Research Group. Diabetes Care 1990;13(4):427‐33. [MEDLINE: ] [DOI] [PubMed] [Google Scholar]
- Anonymous. Diabetes Control and Complications Trial (DCCT): results of feasibility study. The DCCT Research Group. Diabetes Care 1987;10(1):1‐19. [MEDLINE: ] [DOI] [PubMed] [Google Scholar]
- Anonymous. Effect of intensive diabetes treatment on the development and progression of long‐term complications in adolescents with insulin‐dependent diabetes mellitus: Diabetes Control and Complications Trial. Diabetes Control and Complications Trial Research Group. Journal of Pediatrics 1994;125(2):177‐88. [MEDLINE: ] [DOI] [PubMed] [Google Scholar]
- Anonymous. Effect of intensive therapy on the development and progression of diabetic nephropathy in the Diabetes Control and Complications Trial. The Diabetes Control and Complications (DCCT) Research Group. Kidney International 1995;47(6):1703‐20. [MEDLINE: ] [DOI] [PubMed] [Google Scholar]
- Anonymous. The Diabetes Control and Complications Trial (DCCT). Design and methodologic considerations for the feasibility phase. The DCCT Research Group. Diabetes 1986;35(5):530‐45. [MEDLINE: ] [PubMed] [Google Scholar]
- DCCT/EDIC Research Group. Effect of intensive diabetes treatment on albuminuria in type 1 diabetes: long‐term follow‐up of the Diabetes Control and Complications Trial and Epidemiology of Diabetes Interventions and Complications study. Lancet Diabetes & Endocrinology 2014;2(10):793‐800. [MEDLINE: ] [DOI] [PMC free article] [PubMed] [Google Scholar]
- DCCT/EDIC Research Group, Aiello LP, Sun W, Das A, Gangaputra S, Kiss S, et al. Intensive diabetes therapy and ocular surgery in type 1 diabetes. New England Journal of Medicine 2015;372(18):1722‐33. [MEDLINE: ] [DOI] [PMC free article] [PubMed] [Google Scholar]
- DCCT/EDIC Research Group, Boer IH, Sun W, Cleary PA, Lachin JM, Molitch ME, et al. Intensive diabetes therapy and glomerular filtration rate in type 1 diabetes. New England Journal of Medicine 2011;365(25):2366‐76. [MEDLINE: ] [DOI] [PMC free article] [PubMed] [Google Scholar]
- Diabetes Control and Complications Trial/Epidemiology of Diabetes Interventions and Complications (DCCT/EDIC) Research Group, Nathan DM, Zinman B, Cleary PA, Backlund JY, Genuth S, et al. Modern‐day clinical course of type 1 diabetes mellitus after 30 years' duration: the diabetes control and complications trial/epidemiology of diabetes interventions and complications and Pittsburgh epidemiology of diabetes complications experience (1983‐2005). Archives of Internal Medicine 2009;169(14):1307‐16. [MEDLINE: ] [DOI] [PMC free article] [PubMed] [Google Scholar]
- Diabetes Control and Complications Trial/Epidemiology of Diabetes Interventions and Complications Research Group, Lachin JM, Genuth S, Cleary P, Davis MD, Nathan DM. Retinopathy and nephropathy in patients with type 1 diabetes four years after a trial of intensive therapy.[Erratum appears in N Engl J Med 2000 May 4;342(18):1376]. New England Journal of Medicine 2000;342(6):381‐9. [MEDLINE: ] [DOI] [PMC free article] [PubMed] [Google Scholar]
- Gai N, Turkbey EB, Nazarian S, Geest RJ, Liu CY, Lima JA, et al. T1 mapping of the gadolinium‐enhanced myocardium: adjustment for factors affecting interpatient comparison. Magnetic Resonance in Medicine 2011;65(5):1407‐15. [MEDLINE: ] [DOI] [PMC free article] [PubMed] [Google Scholar]
- Gubitosi‐Klug RA, DCCT/EDIC Research Group. The diabetes control and complications trial/epidemiology of diabetes interventions and complications study at 30 years: summary and future directions. Diabetes Care 2014;37(1):44‐9. [MEDLINE: ] [DOI] [PMC free article] [PubMed] [Google Scholar]
- Hoeldtke RD, Hampe CS, Bekris LM, Hobbs G, Bryner KD, Lernmark A, et al. Antibodies to GAD65 and peripheral nerve function in the DCCT. Journal of Neuroimmunology 2007;185(1‐2):182‐9. [MEDLINE: ] [DOI] [PubMed] [Google Scholar]
- Jacobson AM, Braffett BH, Cleary PA, Gubitosi‐Klug RA, Larkin ME, DCCT/EDIC Research Group. The long‐term effects of type 1 diabetes treatment and complications on health‐related quality of life: a 23‐year follow‐up of the Diabetes Control and Complications/Epidemiology of Diabetes Interventions and Complications cohort. Diabetes Care 2013;36(10):3131‐8. [MEDLINE: ] [DOI] [PMC free article] [PubMed] [Google Scholar]
- Jenkins AJ, Yu J, Alaupovic P, Basu A, Klein RL, Lopes‐Virella M, et al. Apolipoprotein‐defined lipoproteins and apolipoproteins: associations with abnormal albuminuria in type 1 diabetes in the diabetes control and complications trial/epidemiology of diabetes interventions and complications cohort. Journal of Diabetes & its Complications 2013;27(5):447‐53. [MEDLINE: ] [DOI] [PMC free article] [PubMed] [Google Scholar]
- Kilpatrick ES, Rigby AS, Atkin SL. A1C variability and the risk of microvascular complications in type 1 diabetes: data from the Diabetes Control and Complications Trial. Diabetes Care 2008;31(11):2198‐202. [MEDLINE: ] [DOI] [PMC free article] [PubMed] [Google Scholar]
- Kim C, Cleary PA, Cowie CC, Braffett BH, Dunn RL, Larkin ME, et al. Effect of glycemic treatment and microvascular complications on menopause in women with type 1 diabetes in the Diabetes Control and Complications Trial/Epidemiology of Diabetes Interventions and Complications (DCCT/EDIC) cohort. Diabetes Care 2014;37(3):701‐8. [MEDLINE: ] [DOI] [PMC free article] [PubMed] [Google Scholar]
- Klein RL, Hammad SM, Baker NL, Hunt KJ, Al Gadban MM, Cleary PA, et al. Decreased plasma levels of select very long chain ceramide species are associated with the development of nephropathy in type 1 diabetes. Metabolism: Clinical & Experimental 2014;63(10):1287‐95. [MEDLINE: ] [DOI] [PMC free article] [PubMed] [Google Scholar]
- Kramer CK, Retnakaran R. Concordance of retinopathy and nephropathy over time in Type 1 diabetes: an analysis of data from the Diabetes Control and Complications Trial. Diabetic Medicine 2013;30(11):1333‐41. [MEDLINE: ] [DOI] [PubMed] [Google Scholar]
- Ku E, McCulloch CE, Mauer M, Gitelman SE, Grimes BA, Hsu CY. Association between blood pressure and adverse renal events in type 1 diabetes. Diabetes Care 2016;39(12):2218‐24. [MEDLINE: ] [DOI] [PMC free article] [PubMed] [Google Scholar]
- Lachin JM, Bebu I, Bergenstal RM, Pop‐Busui R, Service FJ, Zinman B, et al. Association of glycemic variability in type 1 diabetes with progression of microvascular outcomes in the diabetes control and complications trial. Diabetes Care 2017;40(6):777‐83. [MEDLINE: ] [DOI] [PMC free article] [PubMed] [Google Scholar]
- Lachin JM, McGee P, Palmer JP, DCCT/EDIC Research Group. Impact of C‐peptide preservation on metabolic and clinical outcomes in the Diabetes Control and Complications Trial. Diabetes 2014;63(2):739‐48. [MEDLINE: ] [DOI] [PMC free article] [PubMed] [Google Scholar]
- Larkin ME, Backlund JY, Cleary P, Bayless M, Schaefer B, Canady J, et al. Disparity in management of diabetes and coronary heart disease risk factors by sex in DCCT/EDIC. Diabetic Medicine 2010;27(4):451‐8. [DOI] [PubMed] [Google Scholar]
- Lee CC, Sharp SJ, Wexler DJ, Adler AI. Dietary intake of eicosapentaenoic and docosahexaenoic acid and diabetic nephropathy: cohort analysis of the Diabetes Control and Complications Trial. Diabetes Care 2010;33(7):1454‐6. [MEDLINE: ] [DOI] [PMC free article] [PubMed] [Google Scholar]
- Levey AS, Greene T, Schluchter MD, Cleary PA, Teschan PE, Lorenz RA, et al. Glomerular filtration rate measurements in clinical trials. Modification of Diet in Renal Disease Study Group and the Diabetes Control and Complications Trial Research Group. Journal of the American Society of Nephrology 1993;4(5):1159‐71. [MEDLINE: ] [DOI] [PMC free article] [PubMed] [Google Scholar]
- Lin J, Manson J, Schaumberg D. Inflammation and progressive nephropathy in the diabetes complication and control trial (DCCT) [abstract no: F‐PO1015]. Journal of the American Society of Nephrology 2007;18(Abstracts):325‐6A. [Google Scholar]
- Lopes‐Virella MF, Baker NL, Hunt KJ, Cleary PA, Klein R, Virella G, et al. Baseline markers of inflammation are associated with progression to macroalbuminuria in type 1 diabetic subjects. Diabetes Care 2013;36(8):2317‐23. [MEDLINE: ] [DOI] [PMC free article] [PubMed] [Google Scholar]
- Lopes‐Virella MF, Carter RE, Baker NL, Lachin J, Virella G, DCCT/EDIC Research Group. High levels of oxidized LDL in circulating immune complexes are associated with increased odds of developing abnormal albuminuria in Type 1 diabetes. Nephrology Dialysis Transplantation 2012;27(4):1416‐23. [MEDLINE: ] [DOI] [PMC free article] [PubMed] [Google Scholar]
- McGee P, Steffes M, Nowicki M, Bayless M, Gubitosi‐Klug R, Cleary P, et al. Insulin secretion measured by stimulated C‐peptide in long‐established Type 1 diabetes in the Diabetes Control and Complications Trial (DCCT)/ Epidemiology of Diabetes Interventions and Complications (EDIC) cohort: a pilot study. Diabetic Medicine 2014;31(10):1264‐8. [MEDLINE: ] [DOI] [PMC free article] [PubMed] [Google Scholar]
- Molitch ME, Steffes M, Sun W, Rutledge B, Cleary P, Boer IH, et al. Development and progression of renal insufficiency with and without albuminuria in adults with type 1 diabetes in the diabetes control and complications trial and the epidemiology of diabetes interventions and complications study. Diabetes Care 2010;33(7):1536‐43. [MEDLINE: ] [DOI] [PMC free article] [PubMed] [Google Scholar]
- Nathan DM, Steffes MW, Sun W, Rynders GP, Lachin JM. Determining stability of stored samples retrospectively: the validation of glycated albumin. Clinical Chemistry 2011;57(2):286‐90. [MEDLINE: ] [DOI] [PubMed] [Google Scholar]
- Polak JF, Backlund JY, Cleary PA, Harrington AP, O'Leary DH, Lachin JM, et al. Progression of carotid artery intima‐media thickness during 12 years in the Diabetes Control and Complications Trial/Epidemiology of Diabetes Interventions and Complications (DCCT/EDIC) study. Diabetes 2011;60(2):607‐13. [MEDLINE: ] [DOI] [PMC free article] [PubMed] [Google Scholar]
- Siebert C, Clark CM. Operational and policy considerations of data monitoring in clinical trials: the Diabetes Control and Complications Trial experience. Controlled Clinical Trials 1993;14(1):30‐44. [MEDLINE: ] [DOI] [PubMed] [Google Scholar]
- Tello A, Mondress M, Fan Y, Thomas W, Steffes M, Ibrahim H. The utility of serum creatinine based formulas in predicting the glomerular filtration rate in Type 1 diabetics with normal serum creatinine [abstract no: SU‐PO169]. Journal of the American Society of Nephrology 2004;15(Oct):569A. [Google Scholar]
- Turkbey EB, Backlund JY, Genuth S, Jain A, Miao C, Cleary PA, et al. Myocardial structure, function, and scar in patients with type 1 diabetes mellitus. Circulation 2011;124(16):1737‐46. [MEDLINE: ] [DOI] [PMC free article] [PubMed] [Google Scholar]
- White NH, Sun W, Cleary PA, Danis RP, Davis MD, Hainsworth DP, et al. Prolonged effect of intensive therapy on the risk of retinopathy complications in patients with type 1 diabetes mellitus: 10 years after the Diabetes Control and Complications Trial. Archives of Ophthalmology 2008;126(12):1707‐15. [MEDLINE: ] [DOI] [PMC free article] [PubMed] [Google Scholar]
- White NH, Sun W, Cleary PA, Tamborlane WV, Danis RP, Hainsworth DP, et al. Effect of prior intensive therapy in type 1 diabetes on 10‐year progression of retinopathy in the DCCT/EDIC: comparison of adults and adolescents. Diabetes 2010;59(5):1244‐53. [MEDLINE: ] [DOI] [PMC free article] [PubMed] [Google Scholar]
- Younes N, Cleary PA, Steffes MW, Boer IH, Molitch ME, Rutledge BN, et al. Comparison of urinary albumin‐creatinine ratio and albumin excretion rate in the diabetes control and complications trial/epidemiology of diabetes interventions and complications study. Clinical Journal of The American Society of Nephrology: CJASN 2010;5(7):1235‐42. [MEDLINE: ] [DOI] [PMC free article] [PubMed] [Google Scholar]
- Boer IH, Afkarian M, Rue TC, Cleary PA, Lachin JM, Molitch ME, et al. Renal outcomes in patients with type 1 diabetes and macroalbuminuria. Journal of the American Society of Nephrology 2014;25(10):2342‐50. [MEDLINE: ] [DOI] [PMC free article] [PubMed] [Google Scholar]
- Boer IH, Rue TC, Cleary PA, Lachin JM, Molitch ME, Steffes MW, et al. Long‐term renal outcomes of patients with type 1 diabetes mellitus and microalbuminuria: an analysis of the Diabetes Control and Complications Trial/Epidemiology of Diabetes Interventions and Complications cohort. Archives of Internal Medicine 2011;171(5):412‐20. [MEDLINE: ] [DOI] [PMC free article] [PubMed] [Google Scholar]
- Boer IH, Sun W, Cleary PA, Lachin JM, Molitch ME, Steffes M, et al. Effects of intensive diabetes therapy on glomerular filtration rate of type 1 diabetes: results from the DCCT/EDIC [Diabetes Control and Complications Trial/Epidemiology of Diabetes Interventions and Complications study] [abstract no: LB‐OR05]. Journal of the American Society of Nephrology 2011;22(Abstracts):2B. [Google Scholar]
de Boer 2013 {published data only}
- Boer IH, Sachs M, Hoofnagle AN, Utzschneider KM, Kahn SE, Kestenbaum B, et al. Paricalcitol does not improve glucose metabolism in patients with stage 3‐4 chronic kidney disease. Kidney International 2013;83(2):323‐30. [MEDLINE: ] [DOI] [PMC free article] [PubMed] [Google Scholar]
DeFronzo 2009 {published data only}
- DeFronzo RA, Hissa MN, Garber AJ, Luiz Gross J, Yuyan Duan R, Ravichandran S, et al. The efficacy and safety of saxagliptin when added to metformin therapy in patients with inadequately controlled type 2 diabetes with metformin alone. Diabetes Care 2009;32(9):1649‐55. [MEDLINE: ] [DOI] [PMC free article] [PubMed] [Google Scholar]
Derosa 2004 {published data only}
- Derosa G, Franzetti I, Gadaleta G, Ciccarelli L, Fogari R. Metabolic variations with oral antidiabetic drugs in patients with Type 2 diabetes: comparison between glimepiride and metformin. Diabetes, Nutrition & Metabolism ‐ Clinical & Experimental 2004;17(3):143‐50. [MEDLINE: ] [PubMed] [Google Scholar]
Didjurgeit 2002 {published data only}
- Didjurgeit U, Kruse J, Schmitz N, Stuckenschneider P, Sawicki PT. A time‐limited, problem‐orientated psychotherapeutic intervention in Type 1 diabetic patients with complications: a randomized controlled trial. Diabetic Medicine 2002;19(10):814‐21. [MEDLINE: ] [DOI] [PubMed] [Google Scholar]
Di Mauro 2001 {published data only}
- Mauro M, Papalia G, Moli R, Nativo B, Nicoletti F, Lunetta M. Effect of octreotide on insulin requirement, hepatic glucose production, growth hormone, glucagon and c‐peptide levels in type 2 diabetic patients with chronic renal failure or normal renal function. Diabetes Research & Clinical Practice 2001;51(1):45‐50. [MEDLINE: ] [DOI] [PubMed] [Google Scholar]
DNETT Japan 2010 {published data only}
- Shikata K, Haneda M, Koya D, Suzuki Y, Tomino Y, Yamada K, et al. Diabetic Nephropathy Remission and Regression Team Trial in Japan (DNETT‐Japan): rationale and study design. Diabetes Research & Clinical Practice 2010;87(2):228‐32. [MEDLINE: ] [DOI] [PubMed] [Google Scholar]
Einhorn 2000 {published data only}
- Einhorn D, Rendell M, Rosenzweig J, Egan JW, Mathisen AL, Schneider RL. Pioglitazone hydrochloride in combination with metformin in the treatment of type 2 diabetes mellitus: a randomized, placebo‐controlled study. The Pioglitazone 027 Study Group. Clinical Therapeutics 2000;22(12):1395‐409. [MEDLINE: ] [DOI] [PubMed] [Google Scholar]
Fadini 2016 {published data only}
- Fadini GP, Bonora BM, Cappellari R, Menegazzo L, Vedovato M, Iori E, et al. Acute effects of linagliptin on progenitor cells, monocyte phenotypes, and soluble mediators in type 2 diabetes. Journal of Clinical Endocrinology & Metabolism 2016;101(2):748‐56. [MEDLINE: ] [DOI] [PubMed] [Google Scholar]
Fang 2007 {published data only}
- Fang YJ. Observation of treatment effect of pioglitazone in diabetic kidney disease. Modern Practical Medicine 2007;19(7):555‐6. [CENTRAL: CN‐00783737] [Google Scholar]
Feldt‐Rasmussen 1986 {published data only}
- Feldt‐Rasmussen B, Mathiesen ER, Deckert T. Effect of two years of strict metabolic control on progression of incipient nephropathy in insulin‐dependent diabetes. Lancet 1986;2(8519):1300‐4. [MEDLINE: ] [DOI] [PubMed] [Google Scholar]
- Feldt‐Rasmussen B, Mathiesen ER, Hegedus L, Deckert T. Kidney function during 12 months of strict metabolic control in insulin‐dependent diabetic patients with incipient nephropathy. New England Journal of Medicine 1986;314(11):665‐70. [MEDLINE: ] [DOI] [PubMed] [Google Scholar]
Frederich 2012 {published data only}
- Frederich R, McNeill R, Berglind N, Fleming D, Chen R. The efficacy and safety of the dipeptidyl peptidase‐4 inhibitor saxagliptin in treatment‐naive patients with type 2 diabetes mellitus: a randomized controlled trial. Diabetology & Metabolic Syndrome 2012;4(1):36. [MEDLINE: ] [DOI] [PMC free article] [PubMed] [Google Scholar]
Gadallah 2000b {published data only}
- Gadallah M, Andrews G, Hanna D, Patel A, Po S, Wooldridge T. Role of metformin in treatment of hypertension in patients with insulin resistance mediated hypertension [abstract]. Journal of the American Society of Nephrology 2000;11(Sept):347A. [CENTRAL: CN‐00583336] [Google Scholar]
Gan 2007 {published data only}
- Gan JX, Tang FR. Observation of therapeutic effects of rosiglitazone in type2 diabetic nephropathy. Chinese Medical Journal of Metallurgical Industry 2007;24(1):45‐6. [CENTRAL: CN‐00783735] [Google Scholar]
Gao 2006a {published data only}
- Gao XH, HP X. Short‐term improvement effects of pioglitazone combined prostaglandin E1 in diabetic nephropathy. Clinical Focus 2006;21(20):1497‐8. [CENTRAL: CN‐00784213] [Google Scholar]
Gao 2007a {published data only}
- Gao L, Yu DM. Effects of rosiglitazone on urinary albumin excretion in patients with early diabetic nephropathy. Zhong Guo Man Xing Bing Yu Fang Yu Kong Zhi [Chinese Journal of Prevention and Control of Chronic Non‐communicable Diseases] 2007;15(2):126‐8. [CENTRAL: CN‐00783105] [Google Scholar]
Gao 2007b {published data only}
- Gao MS, Zheng CH, Ke SH. Pioglitazone combined fosinopril in treating 52 patients with type 2 diabetes and microalbuminuria. Journal of New Medicine 2007;17(3):176‐7. [CENTRAL: CN‐00783869] [Google Scholar]
GEMINI 2005 {published data only}
- Bakris GL, Bell DS, Fonseca V, Katholi R, McGill J, Phillips R, et al. The rationale and design of the Glycemic Effects in Diabetes Mellitus Carvedilol‐Metoprolol Comparison in Hypertensives (GEMINI) trial. Journal of Diabetes & its Complications 2005;19(2):74‐9. [MEDLINE: ] [DOI] [PubMed] [Google Scholar]
- Bakris GL, Fonseca V, Katholi RE, McGill JB, Messerli F, Phillips RA, et al. Differential effects of beta‐blockers on albuminuria in patients with type 2 diabetes. Hypertension 2005;46(6):1309‐15. [MEDLINE: ] [DOI] [PubMed] [Google Scholar]
Goicolea 2002 {published data only}
- Goicolea I, Fernandez Gonzalez R, Pinies J, Garrido J, Martinez JM, Armenteros S, et al. Effect of antihypertensive combinations on arterial pressure, albuminuria, and glycemic control in patients with type II diabetic nephropathy: a randomized study [Efecto de dos combinaciones antihipertensivas sobre la presion arterial, albuminuria y control glucemico en pacientes con nefropatia diabetica tipo 2: un estudio aleatorizado]. Nefrologia 2002;22(2):170‐8. [MEDLINE: ] [PubMed] [Google Scholar]
He 2004 {published data only}
- He JP, Zhao Q, Yuan WS, Zeng WX. Observation of therapeutic effects of pioglitazone in early diabetic nephropathy. Journal of Practical Medicine 2004;20(6):704‐5. [CENTRAL: CN‐00783733] [Google Scholar]
Hollander 2009 {published data only}
- Hollander P, Li J, Allen E, Chen R, CV181‐013 Investigators. Saxagliptin added to a thiazolidinedione improves glycemic control in patients with type 2 diabetes and inadequate control on thiazolidinedione alone. Journal of Clinical Endocrinology & Metabolism 2009;94(12):4810‐9. [MEDLINE: ] [DOI] [PubMed] [Google Scholar]
Holman 1983 {published data only}
- Holman RR, Dornan TL, Mayon‐White V, Howard‐Williams J, Orde‐Peckar C, Jenkins L, et al. Prevention of deterioration of renal and sensory‐nerve function by more intensive management of insulin‐dependent diabetic patients. A two‐year randomised prospective study. Lancet 1983;1(8318):204‐8. [MEDLINE: ] [DOI] [PubMed] [Google Scholar]
Hu 2007 {published data only}
- Hu ZY, Zhao JW. Effect of rosiglitazone on serum CRP and plasma PAI‐1 in patients with early type 2 diabetic nephropathy. Central Plains Medical Journal 2007;34(20):27‐8. [CENTRAL: CN‐00783022] [Google Scholar]
Hu 2010 {published data only}
- Hu YY, Ye SD, Zhao LL, Zheng M, Chen Y. Hydrochloride pioglitazone decreases urinary TGF‐beta1 excretion in type 2 diabetics. European Journal of Clinical Investigation 2010;40(7):571‐4. [MEDLINE: ] [DOI] [PubMed] [Google Scholar]
- Hu YY, Ye SD, Zhao LL, Zheng M, Wu FZ, Chen Y. Hydrochloride pioglitazone decreases urinary cytokines excretion in type 2 diabetes. Clinical Endocrinology 2010;73(6):739‐43. [MEDLINE: ] [DOI] [PubMed] [Google Scholar]
Huang 2004 {published data only}
- Huang H, Liu PY. Observation of therapeutic effects of rosiglitazone in diabetic nephropathy. Acta Medicinae Sinica 2004;17(3):324‐5. [CENTRAL: CN‐00783734] [Google Scholar]
Huang 2006 {published data only}
- Huang XX, Zhang JE, Li XF, Li T. Effect of rosiglitazone on urinary monocyte chemoattractant protein‐1 in patients with diabetic nephropathy. Journal of Yunyang Medical College 2006;25(4):211‐3. [CENTRAL: CN‐00783023] [Google Scholar]
Huang 2007 {published data only}
- Huang YY, Liu JH. Effects of pioglitazone on changes of haemorrheology and insulin resistance in patients with early diabetic nephropathy. IMHGN ‐ International Medicine & Health Guidance News 2007;13(7):51‐4. [CENTRAL: CN‐00783093] [Google Scholar]
Imano 1998 {published data only}
- Imano E, Kanda T, Nakatani Y, Nishida T, Arai K, Motomura M, et al. Effect of troglitazone on microalbuminuria in patients with incipient diabetic nephropathy. Diabetes Care 1998;21(12):2135‐9. [MEDLINE: ] [DOI] [PubMed] [Google Scholar]
Inagaki 2014 {published data only}
- Inagaki N, Kondo K, Yoshinari T, Ishii M, Sakai M, Kuki H, et al. Pharmacokinetic and pharmacodynamic profiles of canagliflozin in Japanese patients with type 2 diabetes mellitus and moderate renal impairment. Clinical Drug Investigation 2014;34(10):731‐42. [MEDLINE: ] [DOI] [PMC free article] [PubMed] [Google Scholar]
Jerums 1987 {published data only}
- Jerums G, Murray RM, Seeman E, Cooper ME, Edgley S, Marwick K, et al. Lack of effect of gliclazide on early diabetic nephropathy and retinopathy: a two‐year controlled study. Diabetes Research & Clinical Practice 1987;3(2):71‐80. [MEDLINE: ] [DOI] [PubMed] [Google Scholar]
Kadhim 2006 {published data only}
- Kadhim HM, Ismail SH, Hussein KI, Bakir IH, Sahib AS, Khalaf BH, et al. Effects of melatonin and zinc on lipid profile and renal function in type 2 diabetic patients poorly controlled with metformin. Journal of Pineal Research 2006;41(2):189‐93. [MEDLINE: ] [DOI] [PubMed] [Google Scholar]
Kadowaki 2014 {published data only}
- Kadowaki T, Haneda M, Inagaki N, Terauchi Y, Taniguchi A, Koiwai K, et al. Empagliflozin monotherapy in Japanese patients with type 2 diabetes mellitus: a randomized, 12‐week, double‐blind, placebo‐controlled, phase II trial. Advances in Therapy 2014;31(6):621‐38. [MEDLINE: ] [DOI] [PubMed] [Google Scholar]
Karalliedde 2006 {published data only}
- Karalliedde J, Buckingham R, Starkie M, Lorand D, Stewart M, Viberti G, et al. Effect of various diuretic treatments on rosiglitazone‐induced fluid retention. Journal of the American Society of Nephrology 2006;17(12):3482‐90. [MEDLINE: ] [DOI] [PubMed] [Google Scholar]
Katavetin 2006 {published data only}
- Katavetin P, Eiam‐Ong S, Suwanwalaikorn S. Pioglitazone reduces urinary protein and urinary transforming growth factor‐beta excretion in patients with type 2 diabetes and overt nephropathy. Journal of the Medical Association of Thailand 2006;89(2):170‐7. [MEDLINE: ] [PubMed] [Google Scholar]
Kim 2003 {published data only}
- Do J, Cho K, Park J, Yoon K, Cho D, Kim Y. Local and systemic effects of neutral pH, low GDP dialysate in CAPD patients [abstract no: SA‐FC202]. Journal of the American Society of Nephrology 2002;13(September, Program & Abstracts):41A. [CENTRAL: CN‐00445121] [Google Scholar]
- Park J, Do J, Kim Y, Kim T, Yoon K, Park S. The effect of low GDPs solution on peritoneal fibrosis markers [abstract no: SA‐PO333]. Journal of the American Society of Nephrology 2004;15(Oct):374A. [CENTRAL: CN‐00583515] [Google Scholar]
Kirk 1999 {published data only}
- Kirk JK, Pearce KA, Michielutte R, Summerson JH. Troglitazone or metformin in combination with sulfonylureas for patients with type 2 diabetes?. Journal of Family Practice 1999;48(11):879‐82. [MEDLINE: ] [PubMed] [Google Scholar]
KUMAMOTO 1995 {published data only}
- Ohkubo Y, Kishikawa H, Araki E, Miyata T, Isami S, Motoyoshi S, et al. Intensive insulin therapy prevents the progression of diabetic microvascular complications in Japanese patients with non‐insulin‐dependent diabetes mellitus: a randomized prospective 6‐year study. Diabetes Research & Clinical Practice 1995;28(2):103‐17. [MEDLINE: ] [DOI] [PubMed] [Google Scholar]
- Shichiri M, Kishikawa H, Ohkubo Y, Wake N. Long‐term results of the Kumamoto Study on optimal diabetes control in type 2 diabetic patients. Diabetes Care 2000;23 Suppl 2:B21‐9. [MEDLINE: ] [PubMed] [Google Scholar]
- Wake N, Hisashige A, Katayama T, Kishikawa H, Ohkubo Y, Sakai M, et al. Cost‐effectiveness of intensive insulin therapy for type 2 diabetes: a 10‐year follow‐up of the Kumamoto study. Diabetes Research & Clinical Practice 2000;48(3):201‐10. [MEDLINE: ] [DOI] [PubMed] [Google Scholar]
Lebovitz 2001 {published data only}
- Lebovitz HE, Dole JF, Patwardhan R, Rappaport EB, Freed MI, Rosiglitazone Clinical Trials Study Group. Rosiglitazone monotherapy is effective in patients with type 2 diabetes.[Erratum appears in J Clin Endocrinol Metab. 2002 Feb;2(1):iv.], [Erratum appears in J Clin Endocrinol Metab 2001 Apr;86(4):1659]. Journal of Clinical Endocrinology & Metabolism 2001;86(1):280‐8. [MEDLINE: ] [DOI] [PubMed] [Google Scholar]
Leslie 2008 {published data only}
- Leslie B, Tang W, Tang W, List JF. Renal effects of the sodium‐glucose cotransporter 2 (SGLT2) inhibitor dapagliflozin (BMS‐512148) in patients with type 2 diabetes mellitus (T2DM) [abstract no: TH‐PO1022]. Journal of the American Society of Nephrology 2008;19(Abstracts Issue):341A. [Google Scholar]
Li 2004a {published data only}
- Li X, Duan BH, Wang YW, Feng K, Yang YZ. Observation of effect of rosiglitazone in type 2 diabetes with trace urinary protein. Zhong Guo Wu Zhen Xue Za Zhi [Chinese Journal of Misdiagnostics] 2004;4(9):1432. [CENTRAL: CN‐00783727] [Google Scholar]
Li 2006e {published data only}
- Li ZL. Effects of pioglitazone on microalbuminuria of early diabetic nephropathy. Journal of Medical Forum 2006;27(9):31‐3. [CENTRAL: CN‐00783094] [Google Scholar]
Li 2008f {published data only}
- Li B, Ba HJ, Yun L, Wang SG, Zhao SZ, Yue ZW. Therapeutic effect of captopril combined with rosiglitazone on early diabetic nephropathy. Chinese Journal of Difficult & Complicated Cases 2008;7(2):80‐2. [CENTRAL: CN‐00784501] [Google Scholar]
Li 2008g {published data only}
- Li YL, Wang SJ, Li JZ. Rosiglitazone affect type 2 diabetic nephropathy. Zhong Guo Chang Kuang Yi Xue [Chinese Medicine of Factory and Mine] 2008;21(1):58‐9. [CENTRAL: CN‐00784162] [Google Scholar]
Lu 2010 {published data only}
- Lu WH, Shi BY, Zhang XT, Wei DG, Liu WD, Duan PZ. Significance of intensive glycemic control on early diabetic nephropathy patients with microalbuminuria. Academic Journal of Xi'an Jiaotong University 2010;22(2):135‐8. [EMBASE: 2010319798] [Google Scholar]
Matthews 2005 {published data only}
- Charbonnel B, Schernthaner G, Brunetti P, Matthews DR, Urquhart R, Tan MH, et al. Long‐term efficacy and tolerability of add‐on pioglitazone therapy to failing monotherapy compared with addition of gliclazide or metformin in patients with type 2 diabetes. Diabetologia 2005;48(6):1093‐104. [MEDLINE: ] [DOI] [PubMed] [Google Scholar]
- Matthews DR, Charbonnel BH, Hanefeld M, Brunetti P, Schernthaner G. Long‐term therapy with addition of pioglitazone to metformin compared with the addition of gliclazide to metformin in patients with type 2 diabetes: a randomized, comparative study. Diabetes/Metabolism Research Reviews 2005;21(2):167‐74. [MEDLINE: ] [DOI] [PubMed] [Google Scholar]
MEMO 2011 {published data only}
- Crasto W, Jarvis J, Khunti K, Skinner TC, Gray LJ, Brela J, et al. Multifactorial intervention in individuals with type 2 diabetes and microalbuminuria: the Microalbuminuria Education and Medication Optimisation (MEMO) study. Diabetes Research & Clinical Practice 2011;93(3):328‐36. [MEDLINE: ] [DOI] [PubMed] [Google Scholar]
- Crasto W, Khunti K, Jarvis Kay J, Skinner TC, Gray LJ, Brela J, et al. Impact of intensive multi‐factorial intervention on novel markers of inflammation and vascular stiffness [abstract no: P446]. Diabetic Medicine 2011;28(Suppl 1):166. [EMBASE: 70631246] [Google Scholar]
- Crasto WA, Jarvis J, Brela J, Daly H, Gray LJ, Troughton J, et al. Interim analysis of the effects of a multifactorial intervention in people with Type 2 diabetes and microalbuminuria after twelve months [abstract no: P410]. Diabetic Medicine 2009;26(Suppl 1):160. [EMBASE: 70342536] [Google Scholar]
Miyazaki 2007 {published data only}
- Miyazaki Y, Cersosimo E, Triplitt C, DeFronzo RA. Rosiglitazone decreases albuminuria in type 2 diabetic patients. Kidney International 2007;72(11):1367‐73. [MEDLINE: ] [DOI] [PubMed] [Google Scholar]
Nakamura 2000b {published data only}
- Nakamura T, Ushiyama C, Shimada N, Hayashi K, Ebihara I, Koide H. Comparative effects of pioglitazone, glibenclamide, and voglibose on urinary endothelin‐1 and albumin excretion in diabetes patients. Journal of Diabetes & its Complications 2000;14(5):250‐4. [MEDLINE: ] [DOI] [PubMed] [Google Scholar]
Nakamura 2001b {published data only}
- Nakamura T, Ushiyama C, Suzuki S, Shimada N, Sekizuka K, Ebihara L, et al. Effect of troglitazone on urinary albumin excretion and serum type IV collagen concentrations in Type 2 diabetic patients with microalbuminuria or macroalbuminuria. Diabetic Medicine 2001;18(4):308‐13. [MEDLINE: ] [DOI] [PubMed] [Google Scholar]
Nakamura 2004 {published data only}
- Nakamura T, Matsuda T, Kawagoe Y, Ogawa H, Takahashi Y, Sekizuka K, et al. Effect of pioglitazone on carotid intima‐media thickness and arterial stiffness in type 2 diabetic nephropathy patients. Metabolism: Clinical & Experimental 2004;53(10):1382‐6. [MEDLINE: ] [DOI] [PubMed] [Google Scholar]
Nakamura 2006a {published data only}
- Nakamura T, Sugaya T, Kawagoe Y, Ueda Y, Koide H. Effect of pioglitazone on urinary liver‐type fatty acid‐binding protein concentrations in diabetes patients with microalbuminuria. Diabetes/Metabolism Research Reviews 2006;22(5):385‐9. [MEDLINE: ] [DOI] [PubMed] [Google Scholar]
NCT00708981 {published data only}
- Fogelfeld L, Stroger JH. Combined diabetes‐renal multifactorial intervention in patients with advanced diabetic nephropathy (ADN). www.clinicaltrials.gov/ct2/show/NCT00708981 (first received 3 July 2008).
NCT01245166 {published data only}
- NCT01245166. A phase III randomized, double‐blind, parallel‐group study to evaluate the efficacy and safety of acarmet (metformin HCl 500 mg plus acarbose 50 mg tablets) versus acarbose alone in subjects with type 2 diabetes mellitus. www.clinicaltrials.gov/ct2/show/NCT01245166 (first received 22 November 2010).
Nishimura 2015 {published data only}
- Jinnouchi H, Nozaki K, Watase H, Omiya H, Sakai S, Samukawa Y. Impact of reduced renal function on the glucose‐lowering effects of luseogliflozin, a selective SGLT2 inhibitor, assessed by continuous glucose monitoring in Japanese patients with type 2 diabetes mellitus. Advances in Therapy 2016;33(3):460‐79. [MEDLINE: ] [DOI] [PMC free article] [PubMed] [Google Scholar]
- Nishimura R, Osonoi T, Kanada S, Jinnouchi H, Sugio K, Omiya H, et al. Effects of luseogliflozin, a sodium‐glucose co‐transporter 2 inhibitor, on 24‐h glucose variability assessed by continuous glucose monitoring in Japanese patients with type 2 diabetes mellitus: a randomized, double‐blind, placebo‐controlled, crossover study. Diabetes, Obesity & Metabolism 2015;17(8):800‐4. [MEDLINE: ] [DOI] [PMC free article] [PubMed] [Google Scholar]
OSLO 1986 {published data only}
- Dahl‐Jorgensen K, Brinchmann‐Hansen O, Hanssen KF, Ganes T, Kierulf P, Smeland E, et al. Effect of near normoglycaemia for two years on progression of early diabetic retinopathy, nephropathy, and neuropathy: the Oslo study. British Medical Journal Clinical Research Ed 1986;293(6556):1195‐9. [MEDLINE: ] [DOI] [PMC free article] [PubMed] [Google Scholar]
- Dahl‐Jorgensen K, Hanssen KF, Kierulf P, Bjoro T, Sandvik L, Aagenaes O. Reduction of urinary albumin excretion after 4 years of continuous subcutaneous insulin infusion in insulin‐dependent diabetes mellitus. The Oslo Study. Acta Endocrinologica 1988;117(1):19‐25. [MEDLINE: ] [DOI] [PubMed] [Google Scholar]
Ostman 1998 {published data only}
- Ostman J, Asplund K, Bystedt T, Dahlof B, Jern S, Kjellstrom T, et al. Comparison of effects of quinapril and metoprolol on glycaemic control, serum lipids, blood pressure, albuminuria and quality of life in non‐insulin‐dependent diabetes mellitus patients with hypertension. Swedish Quinapril Group. Journal of Internal Medicine 1998;244(2):95‐107. [MEDLINE: ] [DOI] [PubMed] [Google Scholar]
Pan 2012 {published data only}
- Pan CY, Yang W, Tou C, Gause‐Nilsson I, Zhao J. Efficacy and safety of saxagliptin in drug‐naive Asian patients with type 2 diabetes mellitus: a randomized controlled trial. Diabetes/Metabolism Research Reviews 2012;28(3):268‐75. [MEDLINE: ] [DOI] [PubMed] [Google Scholar]
Petrica 2009 {published data only}
- Petrica L, Petrica M, Vlad A, Dragos Jianu C, Gluhovschi G, Ianculescu C, et al. Nephro‐ and neuroprotective effects of rosiglitazone versus glimepiride in normoalbuminuric patients with type 2 diabetes mellitus: a randomized controlled trial. Wiener Klinische Wochenschrift 2009;121(23‐24):765‐75. [MEDLINE: ] [DOI] [PubMed] [Google Scholar]
Pistrosch 2004 {published data only}
- Pistrosch F, Passauer J, Fischer S, Fuecker K, Hanefeld M, Gross P. In type 2 diabetes, rosiglitazone therapy for insulin resistance ameliorates endothelial dysfunction independent of glucose control. Diabetes Care 2004;27(2):484‐90. [MEDLINE: ] [DOI] [PubMed] [Google Scholar]
Pistrosch 2005 {published data only}
- Pistrosch F, Herbrig K, Kindel B, Passauer J, Fischer S, Gross P. Rosiglitazone improves glomerular hyperfiltration, renal endothelial dysfunction, and microalbuminuria of incipient diabetic nephropathy in patients. Diabetes 2005;54(7):2206‐11. [MEDLINE: ] [DOI] [PubMed] [Google Scholar]
Pistrosch 2012 {published data only}
- Pistrosch F, Passauer J, Herbrig K, Schwanebeck U, Gross P, Bornstein SR. Effect of thiazolidinedione treatment on proteinuria and renal hemodynamic in type 2 diabetic patients with overt nephropathy. Hormone & Metabolic Research 2012;44(12):914‐8. [MEDLINE: ] [DOI] [PubMed] [Google Scholar]
PIVIT 2010 {published data only}
- Weinrauch LA, Sun J, Gleason RE, Boden GH, Creech RH, Dailey G, et al. Pulsatile intermittent intravenous insulin therapy for attenuation of retinopathy and nephropathy in type 1 diabetes mellitus. Metabolism: Clinical & Experimental 2010;59(10):1429‐34. [MEDLINE: ] [DOI] [PubMed] [Google Scholar]
Pomerleau 1993 {published data only}
- Pomerleau J, Verdy M, Garrel DR, Nadeau MH. Effect of protein intake on glycaemic control and renal function in type 2 (non‐insulin‐dependent) diabetes mellitus. Diabetologia 1993;36(9):829‐34. [MEDLINE: ] [DOI] [PubMed] [Google Scholar]
QUARTET 2004 {published data only}
- Charbonnel B, Schernthaner G, Brunetti P, Matthews DR, Urquhart R, Tan MH, et al. Long‐term efficacy and tolerability of add‐on pioglitazone therapy to failing monotherapy compared with addition of gliclazide or metformin in patients with type 2 diabetes. Diabetologia 2005;48(6):1093‐104. [MEDLINE: ] [DOI] [PubMed] [Google Scholar]
- Charbonnel BH, Matthews DR, Schernthaner G, Hanefeld M, Brunetti P, QUARTET Study Group. A long‐term comparison of pioglitazone and gliclazide in patients with Type 2 diabetes mellitus: a randomized, double‐blind, parallel‐group comparison trial. Diabetic Medicine 2005;22(4):399‐405. [MEDLINE: ] [DOI] [PubMed] [Google Scholar]
- Hanefeld M, Brunetti P, Schernthaner GH, Matthews DR, Charbonnel BH, QUARTET Study Group. One‐year glycemic control with a sulfonylurea plus pioglitazone versus a sulfonylurea plus metformin in patients with type 2 diabetes. Diabetes Care 2004;27(1):141‐7. [MEDLINE: ] [DOI] [PubMed] [Google Scholar]
- Schernthaner G, Matthews DR, Charbonnel B, Hanefeld M, Brunetti P, Quartet [corrected] Study Group. Efficacy and safety of pioglitazone versus metformin in patients with type 2 diabetes mellitus: a double‐blind, randomized trial.[Erratum appears in J Clin Endocrinol Metab. 2005 Feb;90(2):746]. Journal of Clinical Endocrinology & Metabolism 2004;89(12):6068‐76. [MEDLINE: ] [DOI] [PubMed] [Google Scholar]
Reinhard 2013 {published data only}
- Reinhard M, Frystyk J, Jespersen B, Bjerre M, Christiansen JS, Flyvbjerg A, et al. Effect of hyperinsulinemia during hemodialysis on the insulin‐like growth factor system and inflammatory biomarkers: a randomized open‐label crossover study. BMC Nephrology 2013;14:80. [MEDLINE: ] [DOI] [PMC free article] [PubMed] [Google Scholar]
Rosenstock 2009 {published data only}
- Rosenstock J, Aguilar‐Salinas C, Klein E, Nepal S, List J, Chen R, et al. Effect of saxagliptin monotherapy in treatment‐naive patients with type 2 diabetes. Current Medical Research & Opinion 2009;25(10):2401‐11. [MEDLINE: ] [DOI] [PubMed] [Google Scholar]
SDIS 1988 {published data only}
- Jensen‐Urstad K, Reichard P, Jensen‐Urstad M. Decreased heart rate variability in patients with type 1 diabetes mellitus is related to arterial wall stiffness. Journal of Internal Medicine 1999;245(1):57‐61. [MEDLINE: ] [DOI] [PubMed] [Google Scholar]
- Johansson J, Reichard P, Jensen‐Urstad K, Rosfors S, Jensen‐Urstad M. Influence of glucose control, lipoproteins, and haemostasis function on brachial endothelial reactivity and carotid intima‐media area, stiffness and diameter in Type 1 diabetes mellitus patients. European Journal of Clinical Investigation 2003;33(6):472‐9. [MEDLINE: ] [DOI] [PubMed] [Google Scholar]
- Rathsman B, Jensen‐Urstad K, Nystrom T. Intensified insulin treatment is associated with improvement in skin microcirculation and ischaemic foot ulcer in patients with type 1 diabetes mellitus: a long‐term follow‐up study. Diabetologia 2014;57(8):1703‐10. [MEDLINE: ] [DOI] [PubMed] [Google Scholar]
- Reichard P. Risk factors for progression of microvascular complications in the Stockholm Diabetes Intervention Study (SDIS). Diabetes Research & Clinical Practice 1992;16(2):151‐6. [MEDLINE: ] [DOI] [PubMed] [Google Scholar]
- Reichard P, Berglund B, Britz A, Cars I, Nilsson BY, Rosenqvist U. Intensified conventional insulin treatment retards the microvascular complications of insulin‐dependent diabetes mellitus (IDDM): the Stockholm Diabetes Intervention Study (SDIS) after 5 years. Journal of Internal Medicine 1991;230(2):101‐8. [MEDLINE: ] [DOI] [PubMed] [Google Scholar]
- Reichard P, Britz A, Carlsson P, Cars I, Lindblad L, Nilsson BY, et al. Metabolic control and complications over 3 years in patients with insulin dependent diabetes (IDDM): the Stockholm Diabetes Intervention Study (SDIS). Journal of Internal Medicine 1990;228(5):511‐7. [MEDLINE: ] [DOI] [PubMed] [Google Scholar]
- Reichard P, Britz A, Cars I, Nilsson BY, Sobocinsky‐Olsson B, Rosenqvist U. The Stockholm Diabetes Intervention Study (SDIS): 18 months' results. Acta Medica Scandinavica 1988;224(2):115‐22. [MEDLINE: ] [DOI] [PubMed] [Google Scholar]
- Reichard P, Jensen‐Urstad K, Ericsson M, Jensen‐Urstad M, Lindblad LE. Autonomic neuropathy‐‐a complication less pronounced in patients with Type 1 diabetes mellitus who have lower blood glucose levels. Diabetic Medicine 2000;17(12):860‐6. [MEDLINE: ] [DOI] [PubMed] [Google Scholar]
- Reichard P, Nilsson BY, Rosenqvist U. The effect of long‐term intensified insulin treatment on the development of microvascular complications of diabetes mellitus. New England Journal of Medicine 1993;329(5):304‐9. [MEDLINE: ] [DOI] [PubMed] [Google Scholar]
- Reichard P, Pihl M. Mortality and treatment side‐effects during long‐term intensified conventional insulin treatment in the Stockholm Diabetes Intervention Study. Diabetes 1994;43(2):313‐7. [MEDLINE: ] [DOI] [PubMed] [Google Scholar]
- Reichard P, Pihl M, Rosenqvist U, Sule J. Complications in IDDM are caused by elevated blood glucose level: the Stockholm Diabetes Intervention Study (SDIS) at 10‐year follow up. Diabetologia 1996;39(12):1483‐8. [MEDLINE: ] [DOI] [PubMed] [Google Scholar]
- Reichard P, Rosenqvist U. Nephropathy is delayed by intensified insulin treatment in patients with insulin‐dependent diabetes mellitus and retinopathy. Journal of Internal Medicine 1989;226(2):81‐7. [MEDLINE: ] [DOI] [PubMed] [Google Scholar]
- Reichard P, Toomingas B, Rosenqvist U. Changes in conceptions and attitudes during five years of intensified conventional insulin treatment in the Stockholm Diabetes Intervention Study (SDIS). Diabetes Educator 1994;20(6):503‐8. [MEDLINE: ] [DOI] [PubMed] [Google Scholar]
Seino 2015 {published data only}
- Seino Y, Inagaki N, Haneda M, Kaku K, Sasaki T, Fukatsu A, et al. Efficacy and safety of luseogliflozin added to various oral antidiabetic drugs in Japanese patients with type 2 diabetes mellitus. Journal of Diabetes Investigation 2015;6(4):443‐53. [MEDLINE: ] [DOI] [PMC free article] [PubMed] [Google Scholar]
SESTA R 2011 {published data only}
- Herz M, Gaspari F, Perico N, Viberti G, Urbanowska T, Rabbia M, et al. Effects of high dose aleglitazar on renal function in patients with type 2 diabetes. International Journal of Cardiology 2011;151(2):136‐42. [MEDLINE: ] [DOI] [PubMed] [Google Scholar]
Shata'er 2007 {published data only}
- Shata'er R. Rosiglitazone in urinary protein of diabetic nephropathy. Chinese Medicine Clinical Research ‐ Chinese Magazine of Clinical Medicinal Professional Research 2007;13(15):2162‐3. [CENTRAL: CN‐00784163] [Google Scholar]
SPEAD‐A 2013 {published data only}
- Katakami N, Mita T, Yoshii H, Onuma T, Kaneto H, Osonoi T, et al. Rationale, design, and baseline characteristics of a trial for the prevention of diabetic atherosclerosis using a DPP‐4 inhibitor: the Study of Preventive Effects of Alogliptin on Diabetic Atherosclerosis (SPEAD‐A). Journal of Atherosclerosis & Thrombosis 2013;20(12):893‐902. [MEDLINE: ] [DOI] [PubMed] [Google Scholar]
Stein 2014 {published data only}
- Stein P, Berg JK, Morrow L, Polidori D, Artis E, Rusch S, et al. Canagliflozin, a sodium glucose co‐transporter 2 inhibitor, reduces post‐meal glucose excursion in patients with type 2 diabetes by a non‐renal mechanism: results of a randomized trial. Metabolism: Clinical & Experimental 2014;63(10):1296‐303. [MEDLINE: ] [DOI] [PubMed] [Google Scholar]
STENO‐2 1999 {published data only}
- Gaede P, Lund‐Andersen H, Parving HH, Pedersen O. Effect of a multifactorial intervention on mortality in type 2 diabetes. New England Journal of Medicine 2008;358(6):580‐91. [MEDLINE: ] [DOI] [PubMed] [Google Scholar]
- Gaede P, Parving H, Pedersen O. Multifactorial intervention in patients with type 2 diabetes: long‐term effects on mortality and vascular complications [abstract no: SA‐FC042]. Journal of the American Society of Nephrology 2007;18(Abstracts):43A. [CENTRAL: CN‐00740461] [Google Scholar]
- Gaede P, Valentine WJ, Palmer AJ, Tucker DM, Lammert M, Parving HH, et al. Cost‐effectiveness of intensified versus conventional multifactorial intervention in type 2 diabetes: results and projections from the Steno‐2 study. Diabetes Care 2008;31(8):1510‐5. [MEDLINE: ] [DOI] [PMC free article] [PubMed] [Google Scholar]
- Gaede P, Vedel P, Larsen N, Jensen G, Parving HH, Pedersen O. The STENO‐2 study: intensified multifactorial intervention reduces the risk of cardiovascular disease in patients with type 2 diabetes and microalbuminuria [abstract no: F‐FC031]. Journal of the American Society of Nephrology 2002;13(September, Program & Abstracts):72A. [CENTRAL: CN‐00445410] [Google Scholar]
- Gaede P, Vedel P, Larsen N, Jensen G, Parving HH, Pedersen O. The Steno‐2 study: intensified multifactorial intervention reduces the risk of cardiovascular disease in patients with Type 2 diabetes and microalbuminuria [abstract no: 181]. 38th Annual Meeting of the European Association for the Study of Diabetes (EASD); 2002 Sep 1‐5; Budapest, Hungary. 2002.
- Gaede P, Vedel P, Larsen N, Jensen GV, Parving HH, Pedersen O. Multifactorial intervention and cardiovascular disease in patients with type 2 diabetes. New England Journal of Medicine 2003;348(5):383‐93. [MEDLINE: ] [DOI] [PubMed] [Google Scholar]
- Gaede P, Vedel P, Obel J, Parving HH, Pedersen O. Intensive multifactorial intervention in NIDDM patients with persistent microalbuminuria [abstract]. Journal of the American Society of Nephrology 1996;7(9):1357. [CENTRAL: CN‐00445411] [Google Scholar]
- Gaede P, Vedel P, Parving HH, Pedersen O. Intensified multifactorial intervention in patients with type 2 diabetes mellitus and microalbuminuria: the Steno type 2 randomised study. Lancet 1999;353(9153):617‐22. [MEDLINE: ] [DOI] [PubMed] [Google Scholar]
- Gaede PH, Jepsen PV, Parving HH, Pedersen OB. Intensified multifactorial intervention in patients with type 2 diabetes mellitus and microalbuminuria: the Steno‐2 study [Intensiveret multifaktoriel intervention hos patienter med type 2‐diabetes mellitus og mikroalbuminuri: Steno‐2‐studiet]. Ugeskrift for Laeger 1999;161(30):4277‐85. [MEDLINE: ] [PubMed] [Google Scholar]
- Oellgaard J, Gaede P, Rossing P, Persson F, Parving HH, Pedersen O. Intensified multifactorial intervention in type 2 diabetics with microalbuminuria leads to long‐term renal benefits Kidney Int. 2017;91:982‐988.[Erratum appears in Kidney Int. 2017 May;91(5):1257; PMID: 28407880]. Kidney International 2017;91(4):982‐8. [MEDLINE: ] [DOI] [PubMed] [Google Scholar]
Strojek 2011 {published data only}
- Strojek K, Yoon KH, Hruba V, Elze M, Langkilde AM, Parikh S. Effect of dapagliflozin in patients with type 2 diabetes who have inadequate glycaemic control with glimepiride: a randomized, 24‐week, double‐blind, placebo‐controlled trial. Diabetes, Obesity & Metabolism 2011;13(10):928‐38. [MEDLINE: ] [DOI] [PubMed] [Google Scholar]
Su 2006 {published data only}
- Su RT, Hang XJ. Pioglitazone affects the urinary protein extracting rate in early diabetic nephropathy. Youjiang Medical Journal 2006;34(6):593‐4. [CENTRAL: CN‐00783868] [Google Scholar]
Sun 2006 {published data only}
- Sun Z, Ren X, Jin H, Gong Y, Li l, Zhang L. Effect of pioglitazone on serum advanced glycosylation end product peptide and monocyte chemoattractant protein‐1 in type 2 diabetic patients. Jiangsu Medical Journal 2006;32(2):101‐3. [CENTRAL: CN‐00783008] [Google Scholar]
Tan 2006 {published data only}
- Tan YH, Zheng W. Observation of therapeutic effect of rosiglitazone in type 2 diabetes with nephropathy. Journal of Modern Clinical Medical Bioengineering 2006;12(2):176‐8. [CENTRAL: CN‐00783732] [Google Scholar]
Tang 2007 {published data only}
- Tang GJ, Zhu GD, Xie NR. Treatment effect of rosiglitazone in type 2 diabetic nephropathy. Clinical Medicine 2007;27(7):47‐8. [CENTRAL: CN‐00784585] [Google Scholar]
Thrasher 2012 {published data only}
- Thrasher J, Daniels K, Patel S, Whetteckey J. Black/African American patients with type 2 diabetes mellitus: study design and baseline patient characteristics from a randomized clinical trial of linagliptin. Expert Opinion on Pharmacotherapy 2012;13(17):2443‐52. [MEDLINE: ] [DOI] [PubMed] [Google Scholar]
UKPDS 1991 {published data only}
- Turner R, Cull C, Holman R. United Kingdom Prospective Diabetes Study 17: a 9‐year update of a randomized, controlled trial on the effect of improved metabolic control on complications in non‐insulin‐dependent diabetes mellitus. Annals of Internal Medicine 1996;124(1 Pt 2):136‐45. [MEDLINE: ] [DOI] [PubMed] [Google Scholar]
UKPDS‐HD 1998 {published data only}
- Efficacy of atenolol and captopril in reducing risk of macrovascular and microvascular complications in type 2 diabetes: UKPDS 39. UK Prospective Diabetes Study Group. BMJ 1998;317(7160):713‐20. [MEDLINE: ] [PMC free article] [PubMed] [Google Scholar]
- Tight blood pressure control and risk of macrovascular and microvascular complications in type 2 diabetes: UKPDS 38. UK Prospective Diabetes Study Group.[Erratum appears in BMJ 1999 Jan 2;318(7175):29.]. BMJ 1998;317(7160):703‐13. [MEDLINE: ] [PMC free article] [PubMed] [Google Scholar]
VA‐CSDM 1992 {published data only}
- Abraira C, Colwell J, Nuttall F, Sawin CT, Henderson W, Comstock JP, et al. Cardiovascular events and correlates in the Veterans Affairs Diabetes Feasibility Trial. Veterans Affairs Cooperative Study on Glycemic Control and Complications in Type II Diabetes. Archives of Internal Medicine 1997;157(2):181‐8. [MEDLINE: ] [PubMed] [Google Scholar]
- Abraira C, Colwell JA, Nuttall FQ, Sawin CT, Nagel NJ, Comstock JP, et al. Veterans Affairs Cooperative Study on glycemic control and complications in type II diabetes (VA CSDM). Results of the feasibility trial. Veterans Affairs Cooperative Study in Type II Diabetes. Diabetes Care 1995;18(8):1113‐23. [MEDLINE: ] [DOI] [PubMed] [Google Scholar]
- Abraira C, Emanuele N, Colwell J, Henderson W, Comstock J, Levin S, et al. Glycemic control and complications in type II diabetes. Design of a feasibility trial. VA CS Group (CSDM). Diabetes Care 1992;15(11):1560‐71. [MEDLINE: ] [DOI] [PubMed] [Google Scholar]
- Abraira C, Henderson WG, Colwell JA, Nuttall FQ, Comstock JP, Emanuele NV, et al. Response to intensive therapy steps and to glipizide dose in combination with insulin in type 2 diabetes. VA feasibility study on glycemic control and complications (VA CSDM). Diabetes Care 1998;21(4):574‐9. [MEDLINE: ] [DOI] [PubMed] [Google Scholar]
- Abraira C, McGuire DK. Intensive insulin therapy in patients with type 2 diabetes: implications of the Veterans affairs (VA CSDM) feasibility trial. American Heart Journal 1999;138(5 Pt 1):S360‐5. [MEDLINE: ] [DOI] [PubMed] [Google Scholar]
- Agrawal L, Emanuele NV, Abraira C, Henderson WG, Levin SR, Sawin CT, et al. Ethnic differences in the glycemic response to exogenous insulin treatment in the Veterans Affairs Cooperative Study in Type 2 Diabetes Mellitus (VA CSDM). Diabetes Care 1998;21(4):510‐5. [MEDLINE: ] [DOI] [PubMed] [Google Scholar]
- Azad N, Emanuele NV, Abraira C, Henderson WG, Colwell J, Levin SR, et al. The effects of intensive glycemic control on neuropathy in the VA cooperative study on type II diabetes mellitus (VA CSDM). Journal of Diabetes & its Complications 1999;13(5‐6):307‐13. [MEDLINE: ] [DOI] [PubMed] [Google Scholar]
- Emanuele N, Azad N, Abraira C, Henderson W, Colwell J, Levin S, et al. Effect of intensive glycemic control on fibrinogen, lipids, and lipoproteins: Veterans Affairs Cooperative Study in Type II Diabetes Mellitus. Archives of Internal Medicine 1998;158(22):2485‐90. [MEDLINE: ] [DOI] [PubMed] [Google Scholar]
- Emanuele N, Klein R, Abraira C, Colwell J, Comstock J, Henderson WG, et al. Evaluations of retinopathy in the VA Cooperative Study on Glycemic Control and Complications in Type II Diabetes (VA CSDM). A feasibility study. Diabetes Care 1996;19(12):1375‐81. [MEDLINE: ] [DOI] [PubMed] [Google Scholar]
- Levin SR, Coburn JW, Abraira C, Henderson WG, Colwell JA, Emanuele NV, et al. Effect of intensive glycemic control on microalbuminuria in type 2 diabetes. Veterans Affairs Cooperative Study on Glycemic Control and Complications in Type 2 Diabetes Feasibility Trial Investigators. Diabetes Care 2000;23(10):1478‐85. [MEDLINE: ] [DOI] [PubMed] [Google Scholar]
- Pitale S, Kernan‐Schroeder D, Emanuele N, Sawin C, Sacks J, Abraira C, et al. Health‐related quality of life in the VA Feasibility Study on glycemic control and complications in type 2 diabetes mellitus. Journal of Diabetes & its Complications 2005;19(4):207‐11. [MEDLINE: ] [DOI] [PubMed] [Google Scholar]
- Pitale SU, Abraira C, Emanuele NV, McCarren M, Henderson WG, Pacold I, et al. Two years of intensive glycemic control and left ventricular function in the Veterans Affairs Cooperative Study in Type 2 Diabetes Mellitus (VA CSDM). Diabetes Care 2000;23(9):1316‐20. [MEDLINE: ] [DOI] [PubMed] [Google Scholar]
Viswanathan 1990 {published data only}
- Viswanathan M, Snehalatha C, Mohan V, Ramachandran A, Mohan R. Comparative study of monocomponent insulins and conventional insulins on the course of diabetic nephropathy. A follow‐up study. Journal of the Association of Physicians of India 1990;38(11):833‐4. [MEDLINE: ] [PubMed] [Google Scholar]
Vos 2011 {published data only}
- Vos FE, Manning PJ, Sutherland WH, Schollum JB, Walker RJ. Anti‐inflammatory effect of an insulin infusion in patients on maintenance haemodialysis: a randomized controlled pilot study. Nephrology 2011;16(1):68‐75. [MEDLINE: ] [DOI] [PubMed] [Google Scholar]
- Vos FE, Manning PJ, Sutherland WHF, Schollum J, Walker RJ. Does insulin have an anti‐inflammatory effect in patients with end‐stage renal disease on haemodialysis?. Nephrology 2009;14(Suppl 1):A4. [Google Scholar]
Wang 2004 {published data only}
- Wang L. Renal protecting effects of pioglitazone in diabetic nephropathy. Clinical Medicine 2004;24(6):13‐4. [CENTRAL: CN‐00784118] [Google Scholar]
Wang 2005b {published data only}
- Wang XQ, Chen JY, Wang YH, Chen JF, Wu G, Jin Y. Rosiglitazone affects albuminuria in type 2 diabetes. Journal of Postgraduates of Medicine 2005;28(11A):36‐7. [CENTRAL: CN‐00784160] [Google Scholar]
Wang 2005c {published data only}
- Wang YW, Duan BH, Feng K, Zhang XL. Effects of rosiglitazone in type 2 diabetic nephropathy. Clinical Medicine of China 2005;21(8):711‐2. [CENTRAL: CN‐00783103] [Google Scholar]
- Wang YW, Duan BH, Feng K, Zhang XL. Rosiglitazone affects urinary protein excretory rate and C‐reactive protein in diabetic nephropathy. Zhong Guo Wu Zhen Xue Za Zhi [Chinese Journal of Misdiagnostics] 2005;5(4):692‐4. [CENTRAL: CN‐00784161] [Google Scholar]
Wang 2006 {published data only}
- Wang JG. Twenty‐two cases diagnosed with diabetic nephropathy treated with pioglitazone combined prostaglandin. Zheng Zhou Da Xue Xue Bao (Yi Xue Ban) [Journal of Zhengzhou University (Medical Science)] 2006;41(4):808‐9. [Google Scholar]
Wang 2008e {published data only}
- Wang XH. Effect of rosiglitazone in early stage of diabetic nephropathy. Journal of Clinical and Experimental Medicine 2008;7(2):95‐6. [CENTRAL: CN‐00783020] [Google Scholar]
Wiseman 1985 {published data only}
- Wiseman MJ, Saunders AJ, Keen H, Viberti G. Effect of blood glucose control on increased glomerular filtration rate and kidney size in insulin‐dependent diabetes. New England Journal of Medicine 1985;312(10):617‐21. [MEDLINE: ] [DOI] [PubMed] [Google Scholar]
Xu 2005 {published data only}
- Xu FJ, Yu FL, Yu FQ, Gu QX, Li Q. Observation of trace urinary protein and C‐reactive protein level of pioglitazone treating early diabetic nephropathy. Chongqin Medicine Journal 2005;34(1):56‐7. [CENTRAL: CN‐00783736] [Google Scholar]
Yang 2011a {published data only}
- Yang W, Pan CY, Tou C, Zhao J, Gause‐Nilsson I. Efficacy and safety of saxagliptin added to metformin in Asian people with type 2 diabetes mellitus: a randomized controlled trial. Diabetes Research & Clinical Practice 2011;94(2):217‐24. [MEDLINE: ] [DOI] [PubMed] [Google Scholar]
Yokoyama 2009 {published data only}
- Yokoyama H, Inoue T, Node K. Effect of insulin‐unstimulated diabetic therapy with miglitol on serum cystatin C level and its clinical significance. Diabetes Research & Clinical Practice 2009;83(1):77‐82. [MEDLINE: ] [DOI] [PubMed] [Google Scholar]
Zhang 2007c {published data only}
- Zhang JD. Clinical observation of treatment effect of enalapril combined rosiglitazone in early stage diabetic nephropathy. Zhong Guo Yi Yuan Yao Xue Za Zhi [Chinese Journal of Hospital Pharmacy] 2007;27(10):1432‐4. [CENTRAL: CN‐00782589] [Google Scholar]
Zhang 2012a {published data only}
- Zhang H, Zhang X, Hu C, Lu W. Exenatide reduces urinary transforming growth factor‐beta1 and type IV collagen excretion in patients with type 2 diabetes and microalbuminuria. Kidney & Blood Pressure Research 2012;35(6):483‐8. [MEDLINE: ] [DOI] [PubMed] [Google Scholar]
Zhao 2007 {published data only}
- Zhao ZG, Liu J, Hou YL. Effect of rosiglitazone in microalbuminuria in type 2 diabetic nephropathy. Clinical Focus 2007;22(14):1037‐8. [CENTRAL: CN‐00783021] [Google Scholar]
Zheng 2006 {published data only}
- Zheng W. The clinical observation of benazepril combined with rosiglitazone in patients with diabetic nephropathy. Academic Journal of GuangZhou Medical College 2006;34(6):36‐8. [CENTRAL: CN‐00784331] [Google Scholar]
Zhou 2003 {published data only}
- Zhou GY, Su XS, Liu Y, Li DT. Renal protection effects of rosiglitazone in diabetic nephropathy. Liaoning Pharmacy and Clinical Remedies 2003;6(2):72‐3. [CENTRAL: CN‐00784119] [Google Scholar]
Zhou 2007 {published data only}
- Zhou DY, Sheng CQ. Observation of treatment effect of rosiglitazone combined irbesartan. Zhong Guo Man Xing Bing Yu Fang Yu Kong Zhi [Chinese Journal of Prevention and Control of Chronic Non‐communicable Diseases] 2007;15(5):480‐1. [CENTRAL: CN‐00783738] [Google Scholar]
Zhu 2007 {published data only}
- Zhu K, Yang BY, Jin Y, Liu W. Metformin treatment of early diabetic nephropathy. JiLin Medical Journal 2007;28(17):1845‐6. [CENTRAL: CN‐00783630] [Google Scholar]
Zou 2005 {published data only}
- Zou XB, Zhou YH. Observation of curative effect of rosiglitazone on delaying progression of type 2 diabetic nephropathy. China Pharmacy 2005;16(12):931‐3. [CENTRAL: CN‐00783726] [Google Scholar]
References to studies awaiting assessment
AWARD‐7 2017 {published data only}
- Tuttle KR, Lakshmanan MC, Gross JL, Rayner B, Busch RS, Woodward DB, et al. Comparable glycaemic control with once weekly dulaglutide versus insulin glargine, both combined with lispro, in type 2 diabetes and chronic kidney disease (AWARD‐7) [abstract]. Diabetologia 2017;60(1 Suppl 1):S3. [EMBASE: 618051873] [Google Scholar]
Chacra 2017 {published data only}
- Chacra A, Gantz I, Mendizabal G, Durlach L, O'Neill EA, Zimmer Z, et al. A randomised, double‐blind, trial of the safety and efficacy of omarigliptin (a once‐weekly DPP‐4 inhibitor) in subjects with type 2 diabetes and renal impairment. International Journal of Clinical Practice 2017;71(6):1. [MEDLINE: ] [DOI] [PMC free article] [PubMed] [Google Scholar]
Chan 2011 {published data only}
- Chan D, Watts G, Irish A, Dogra G. Effect of rosiglitazone on arterial function and stiffness in patients with stage 3 to 4 chronic kidney disease [abstract no: 127]. Nephrology 2008;13(Suppl 3):A133. [Google Scholar]
- Chan D, Watts G, Irish A, Dogra G. Rosiglitazone improves inflammation and in vivo marker of endothelial function but not arterial function and stiffness in patients with stage 3 ‐ 4 chronic kidney disease [abstract no: SA181]. World Congress of Nephrology; 2009 May 22‐26; Milan, Italy. 2009.
- Chan D, Watts G, Irish A, Dogra G. Rosiglitazone lowers insulin resistance, inflammation and von Willebrand factor in patients with stage 1‐4 chronic kidney disease [abstract no: 126]. Nephrology 2008;13(Suppl 3):A132‐3. [Google Scholar]
- Chan D, Watts G, Irish A, Dogra G. Safety and tolerability of rosiglitazone in stage 3‐4 chronic kidney disease [abstract no: 125]. Nephrology 2008;13(Suppl 3):A132. [Google Scholar]
- Chan D, Watts G, Irish A, Lim E, Dogra G. Impact of rosiglitazone on markers of bone metabolism in chronic kidney disease [abstract no: 060]. Nephrology 2010;15(Suppl 4):42. [EMBASE: 70467064] [Google Scholar]
- Chan DT, Watts GF, Irish AB, Dogra GK. Rosiglitazone does not improve vascular function in subjects with chronic kidney disease. Nephrology Dialysis Transplantation 2011;26(11):3543‐9. [MEDLINE: ] [DOI] [PubMed] [Google Scholar]
DEVOTE 2017 {published data only}
- Marso SP, McGuire DK, Zinman B, Poulter NR, Emerson SS, Pieber TR, et al. Design of DEVOTE (Trial Comparing Cardiovascular Safety of Insulin Degludec vs Insulin Glargine in Patients With Type 2 Diabetes at High Risk of Cardiovascular Events) ‐ DEVOTE 1. American Heart Journal 2016;179:175‐83. [MEDLINE: ] [DOI] [PubMed] [Google Scholar]
- Marso SP, McGuire DK, Zinman B, Poulter NR, Emerson SS, Pieber TR, et al. Efficacy and safety of degludec versus glargine in type 2 diabetes. New England Journal of Medicine 2017;377(8):723‐32. [MEDLINE: ] [DOI] [PMC free article] [PubMed] [Google Scholar]
- Pieber TR, Marso SP, McGuire DK, Zinman B, Poulter NR, Emerson SS, et al. DEVOTE 3: temporal relationships between severe hypoglycaemia, cardiovascular outcomes and mortality. Diabetologia 2018;61(1):58‐65. [MEDLINE: ] [DOI] [PMC free article] [PubMed] [Google Scholar]
- Zinman B, Marso SP, Poulter NR, Emerson SS, Pieber TR, Pratley RE, et al. Day‐to‐day fasting glycaemic variability in DEVOTE: associations with severe hypoglycaemia and cardiovascular outcomes (DEVOTE 2). Diabetologia 2018;61(1):48‐57. [MEDLINE: ] [DOI] [PMC free article] [PubMed] [Google Scholar]
EXAMINE 2011 {published data only}
- Cavender MA, White WB, Jarolim P, Bakris GL, Cushman WC, Kupfer S, et al. Serial measurement of high‐sensitivity troponin i and cardiovascular outcomes in patients with type 2 diabetes mellitus in the EXAMINE Trial (Examination of Cardiovascular Outcomes With Alogliptin Versus Standard of Care). Circulation 2017;135(20):1911‐21. [MEDLINE: ] [DOI] [PubMed] [Google Scholar]
- White WB, Bakris GL, Bergenstal RM, Cannon CP, Cushman WC, Fleck P, et al. EXamination of cArdiovascular outcoMes with alogliptIN versus standard of carE in patients with type 2 diabetes mellitus and acute coronary syndrome (EXAMINE): a cardiovascular safety study of the dipeptidyl peptidase 4 inhibitor alogliptin in patients with type 2 diabetes with acute coronary syndrome. American Heart Journal 2011;162(4):620‐6. [MEDLINE: ] [DOI] [PubMed] [Google Scholar]
- White WB, Cannon CP, Heller SR, Nissen SE, Bergenstal RM, Bakris GL, et al. Alogliptin after acute coronary syndrome in patients with type 2 diabetes. New England Journal of Medicine 2013;369(14):1327‐35. [MEDLINE: ] [DOI] [PubMed] [Google Scholar]
- White WB, Kupfer S, Zannad F, Mehta CR, Wilson CA, Lei L, et al. Cardiovascular mortality in patients with type 2 diabetes and recent acute coronary syndromes from the EXAMINE trial. Diabetes Care 2016;39(7):1267‐73. [MEDLINE: ] [DOI] [PubMed] [Google Scholar]
- Zannad F, Cannon CP, Cushman WC, Bakris GL, Menon V, Perez AT, et al. Heart failure and mortality outcomes in patients with type 2 diabetes taking alogliptin versus placebo in EXAMINE: a multicentre, randomised, double‐blind trial. Lancet 2015;385(9982):2067‐76. [MEDLINE: ] [DOI] [PubMed] [Google Scholar]
LEADER 2017 {published data only}
- Daniels GH, Hegedus L, Marso SP, Nauck MA, Zinman B, Bergenstal RM, et al. LEADER 2: baseline calcitonin in 9340 people with type 2 diabetes enrolled in the Liraglutide Effect and Action in Diabetes: Evaluation of cardiovascular outcome Results (LEADER) trial: preliminary observations. Diabetes, Obesity & Metabolism 2015;17(5):477‐86. [MEDLINE: ] [DOI] [PMC free article] [PubMed] [Google Scholar]
- Mann J, Nauck M, Jacob S, Ludemann J, Brown‐Frandsen K, Rieck M, et al. Liraglutide and renal outcomes in type 2 diabetes: Results of the LEADER trial [abstract]. Internist 2017;58(Suppl 1):S8. [EMBASE: 615632528] [Google Scholar]
- Mann JF, Frandsen KB, Daniels G, Kristensen P, Nauck M, Nissen S, et al. Liraglutide and renal outcomes in type 2 diabetes: results of the LEADER trial [abstract no: HI‐OR01]. Journal of the American Society of Nephrology 2016;27(Abstract Suppl):1B. [Google Scholar]
- Mann JF, Orsted DD, Brown‐Frandsen K, Marso SP, Poulter NR, Rasmussen S, et al. Liraglutide and renal outcomes in type 2 diabetes. New England Journal of Medicine 2017;377(9):839‐48. [MEDLINE: ] [DOI] [PubMed] [Google Scholar]
- Marso SP, Daniels GH, Brown‐Frandsen K, Kristensen P, Mann JF, Nauck MA, et al. Liraglutide and cardiovascular outcomes in type 2 diabetes. New England Journal of Medicine 2016;375(4):311‐22. [MEDLINE: ] [DOI] [PMC free article] [PubMed] [Google Scholar]
- Marso SP, Poulter NR, Nissen SE, Nauck MA, Zinman B, Daniels GH, et al. Design of the liraglutide effect and action in diabetes: evaluation of cardiovascular outcome results (LEADER) trial. American Heart Journal 2013;166(5):823‐30. [MEDLINE: ] [DOI] [PubMed] [Google Scholar]
- Petrie JR, Marso SP, Bain SC, Franek E, Jacob S, Masmiquel L, et al. LEADER‐4: blood pressure control in patients with type 2 diabetes and high cardiovascular risk: baseline data from the LEADER randomized trial. Journal of Hypertension 2016;34(6):1140‐50. [MEDLINE: ] [DOI] [PMC free article] [PubMed] [Google Scholar]
- Poulter N, Mann JF, Brown‐Frandsen K, Daniels GH, Kristensen P, Nauck MA, et al. Liraglutide and renal outcomes in Type 2 diabetes: Results of the 'liraglutide effect and action in diabetes: Evaluation of cardiovascular outcome results' (LEADER) trial [abstract]. Diabetic Medicine 2017;34(Suppl 1):23‐4. [EMBASE: 614841222] [Google Scholar]
- Rutten GE, Tack CJ, Pieber TR, Comlekci A, Orsted DD, Baeres FM, et al. LEADER 7: cardiovascular risk profiles of US and European participants in the LEADER diabetes trial differ. Diabetology & metabolic syndrome 2016;8:37. [MEDLINE: ] [DOI] [PMC free article] [PubMed] [Google Scholar]
- Satman I, R Rea R, Eriksson M, Mosenzon O, Pratley R, M Baeres M, et al. LEADER‐6: Baseline renal function and associated factors in a high cardiovascular risk type 2 diabetes population. Journal of Diabetes & its Complications 2016;30(8):1631‐9. [MEDLINE: ] [DOI] [PubMed] [Google Scholar]
- Sesti G, Mann JF, Brown Frandsen K, Daniels G, Kristensen P, Nauck M, et al. Liraglutide and renal outcomes in type 2 diabetes: Results of the LEADER trial [abstract]. High Blood Pressure and Cardiovascular Prevention 2017;24(2):206. [EMBASE: 616801212] [Google Scholar]
- Steinberg WM, Buse JB, Ghorbani ML, Orsted DD, Nauck MA, LEADER Study Committee, et al. Amylase, lipase, and acute pancreatitis in people with type 2 diabetes treated with liraglutide: results from the LEADER randomized trial. Diabetes Care 2017;40(7):966‐72. [MEDLINE: ] [DOI] [PubMed] [Google Scholar]
- Steinberg WM, Nauck MA, Zinman B, Daniels GH, Bergenstal RM, Mann JF, et al. LEADER 3‐‐lipase and amylase activity in subjects with type 2 diabetes: baseline data from over 9000 subjects in the LEADER Trial. Pancreas 2014;43(8):1223‐31. [MEDLINE: ] [DOI] [PMC free article] [PubMed] [Google Scholar]
Li 2012b {published data only}
- Li Y, Xie QH, You HZ, Tian J, Hao CM, Lin SY, et al. Twelve weeks of pioglitazone therapy significantly attenuates dysmetabolism and reduces inflammation in continuous ambulatory peritoneal dialysis patients‐‐a randomized crossover trial. Peritoneal Dialysis International 2012;32(5):507‐15. [MEDLINE: ] [DOI] [PMC free article] [PubMed] [Google Scholar]
MARLINA‐T2D 2015 {published data only}
- Groop PH, Cooper ME, Perkovic V, Hocher B, Kanasaki K, Haneda M, et al. Linagliptin and its effects on hyperglycaemia and albuminuria in patients with type 2 diabetes and renal dysfunction: the randomized MARLINA‐T2D trial. Diabetes, Obesity & Metabolism 2017;19(11):1610‐9. [MEDLINE: ] [DOI] [PMC free article] [PubMed] [Google Scholar]
- Groop PH, Cooper ME, Perkovic V, Sharma K, Schernthaner G, Haneda M, et al. Dipeptidyl peptidase‐4 inhibition with linagliptin and effects on hyperglycaemia and albuminuria in patients with type 2 diabetes and renal dysfunction: Rationale and design of the MARLINA‐T2DTM trial. Diabetes & Vascular Disease Research 2015;12(6):455‐62. [MEDLINE: ] [DOI] [PubMed] [Google Scholar]
- Schernthaner G, Groop P, Cooper ME, Perkovic V, Hocher B, Kanasaki K, et al. Effects of linagliptin on glycaemic control and albuminuria in type 2 diabetes: The MARLINA‐T2DTM trial [abstract]. Diabetologia 2016;59(1 Suppl 1):S360. [EMBASE: 612313287] [Google Scholar]
- Schernthaner G, Groop P‐H, Cooper ME, Perkovic V, Hocher B, Kanasaki K, et al. Effects of linagliptin on glycaemic control and albuminuria in type 2 diabetes‐the MARLINA‐T2DTM trial [abstract]. Nephrology 2016;21(Suppl 2):60. [EMBASE: 612313048] [Google Scholar]
NCT00846716 {published data only}
- Kashiwagi A, Maegawa H. Exploratory study to investigate the suppressive effect of oral anti‐diabetic drug (tzd) on progression of diabetic nephropathy on Japanese type 2 diabetic patients. www.clinicaltrials.gov/ct2/show/NCT00846716 (first received 19 February 2009).
Neff 2016 {published data only}
- Neff KJ, Tobin LM, Hogan AE, Docherty NG, Roux CW, O'Shea D. The effect of low dose liraglutide on renal inflammation in type 2 diabetic kidney disease: a randomised controlled study [abstract]. Diabetic Medicine 2016;33(Suppl 1):64. [EMBASE: 72230717] [Google Scholar]
Ott 2016 {published data only}
- Ott C, Kistner I, Keller M, Friedrich S, Willam C, Bramlage P, et al. Effects of linagliptin on renal endothelial function in patients with type 2 diabetes: a randomised clinical trial. Diabetologia 2016;59(12):2579‐87. [MEDLINE: ] [DOI] [PubMed] [Google Scholar]
- Schmieder RE, Friedrich S, Kistner I, Ott C. Effects of linagliptin on early alterations of renal endothelial function in patients with type‐2 diabetes [abstract]. Nephrology Dialysis Transplantation 2015;30(Suppl 3):iii11. [EMBASE: 72206303] [Google Scholar]
SUSTAIN‐6 2016 {published data only}
- Consoli A, Bain SC, Davies M, Lingvay I, Bergan EQ, Hansen O, et al. Semaglutide provides sustained reductions in body weight over 2 years in subjects with type 2 diabetes (SUSTAIN 6) [abstract]. Diabetologia 2017;60(1 Suppl 1):S4. [EMBASE: 618051943] [Google Scholar]
- Marso SP, Bain SC, Consoli A, Eliaschewitz FG, Jodar E, Leiter LA, et al. Semaglutide and cardiovascular outcomes in patients with type 2 diabetes. New England Journal of Medicine 2016;375(19):1834‐44. [MEDLINE: ] [DOI] [PubMed] [Google Scholar]
- Sanyal AJ, Hansen M, Linder M, Newsome PN. Effect of semaglutide on alanine aminotransferase in subjects with type 2 diabetes and high cardiovascular risk [abstract]. Hepatology 2017;66(Suppl 1):1175A. [EMBASE: 618937026] [Google Scholar]
von Scholten 2017 {published data only}
- Scholten BJ, Persson F, Rosenlund S, Hovind P, Faber J, Hansen TW, et al. The effect of liraglutide on renal function: a randomized clinical trial. Diabetes, Obesity & Metabolism 2017;19(2):239‐47. [MEDLINE: ] [DOI] [PubMed] [Google Scholar]
Xie 2006 {published data only}
- Xie XR, Jiang HY. Rosiglitazone's effect to trace urinary protein and C‐reactive protein in patients with diabetic nephropathy. Chinese Journal of Postgraduate Medicine 2006;29(11A):55‐6. [CENTRAL: CN‐00784164] [Google Scholar]
References to ongoing studies
CARMELINA 2017 {published data only}
- Perkovic V, Rosenstock J, MacGuire DK. CARMELINA trial baseline characteristics: A cardiovascular and renal microvascular outcome trial with linagliptin in patients with type 2 diabetes at high vascular risk [abstract]. Diabetologia 2017;60(1 Suppl 1):S357. [EMBASE: 618052704] [Google Scholar]
- Rosenstock J, Perkovic V, Alexander JH, Cooper ME, Kahn SE, Marx N, et al. CARMELINA trial baseline characteristics: A cardiovascular and renal microvascular outcome trial with linagliptin in patients with type 2 diabetes at high vascular risk [abstract]. Diabetes 2017;66(Suppl 1):A344. [EMBASE: 616960820] [Google Scholar]
NCT02547935 {published data only}
- NCT02547935. A study to evaluate the effect of dapagliflozin with and without saxagliptin on albuminuria, and to investigate the effect of dapagliflozin and saxagliptin on hba1c in patients with type 2 diabetes and CKD3. www.clinicaltrials.gov/ct2/show/NCT02547935 (first received 14 September 2015).
NCT02608177 {published data only}
- Boer I. Continuous glucose monitoring to assess glycemia in chronic kidney disease ‐ changing glucose management (CANDY‐CANE). www.clinicaltrials.gov/ct2/show/NCT02608177 (first received 18 November 2015).
Additional references
ADA 2017
- American Diabetes Association. Standards of medical care in diabetes‐‐2017. Diabetes Care 2017;40(Suppl 1):S1‐135. [MEDLINE: ] [DOI] [PubMed] [Google Scholar]
ADVANCE Group 2008
- ADVANCE Collaborative Group, Patel A, MacMahon S, Chalmers J, Neal B, Billot L, et al. Intensive blood glucose control and vascular outcomes in patients with type 2 diabetes. New England Journal of Medicine 2008;358(24):2560‐72. [MEDLINE: ] [DOI] [PubMed] [Google Scholar]
ALECARDIO 2013
- Nainggolan L. ALECARDIO trial halted for safety. Medscape: News and Perspective: www.medscape.com/viewarticle/793304 July 10, 2013.
Andrianesis 2016
- Andrianesis V, Glykofridi S, Doupis J. The renal effects of SGLT2 inhibitors and a mini‐review of the literature. Therapeutic Advances in Endocrinology & Metabolism 2016; Vol. 7, issue 5‐6:212‐28. [MEDLINE: ] [DOI] [PMC free article] [PubMed]
ANZDATA 2008
- McDonald S, Excell L, Dent H. ANZDATA 32nd Annual Report. 2009 Report: Data to 2008. Chapter 2: New patients commencing treatment in 2008. www.anzdata.org.au/anzdata/AnzdataReport/32ndReport/Ch02.pdf (accessed 9 August 2018).
Bennett 1983
- Bennett WM, Aronoff GR, Morrison G, Golper TA, Pulliam J, Wolfson M, et al. Drug prescribing in renal failure: dosing guidelines for adults. American Journal of Kidney Diseases 1983;3(3):155‐93. [MEDLINE: ] [DOI] [PubMed] [Google Scholar]
Chadban 2003
- Chadban SJ, Briganti EM, Kerr PG, Dunstan DW, Welborn, TA, et al. Prevalence of kidney damage in Australian adults: the AusDiab kidney study. Journal of the American Society of Nephrology 2003;14(7 Suppl 2):S131‐8. [MEDLINE: ] [DOI] [PubMed] [Google Scholar]
Chadban 2010
- Chadban S, Howell M, Twigg S, Thomas M, Jerums G, Cass A, et al. The CARI Guidelines. Prevention and management of chronic kidney disease in type 2 diabetes. Nephrology 2010;15 Suppl 1:S162‐94. [MEDLINE: ] [DOI] [PubMed] [Google Scholar]
Charpentier 2000
- Charpentier G, Riveline JP, Varroud‐Vial M. Management of drugs affecting blood glucose in diabetic patients with renal failure. Diabetes & Metabolism 2000;26 Suppl 4:73‐85. [MEDLINE: ] [PubMed] [Google Scholar]
Cheng 2014
- Cheng D, Fei Y, Liu Y, Li J, Chen Y, Wang X, et al. Efficacy and safety of dipeptidyl peptidase‐4 inhibitors in type 2 diabetes mellitus patients with moderate to severe renal impairment: a systematic review and meta‐analysis. PLoS ONE (Electronic Resource] 2014;9(10):e111543. [MEDLINE: ] [DOI] [PMC free article] [PubMed] [Google Scholar]
Collins 2007
- Collins AJ, Kasiske B, Herzog C, Chavers B, Foley R, Gilbertson D, et al. Excerpts from the United States Renal Data System 2006 Annual Data Report. American Journal of Kidney Diseases 2007;49(1 Suppl 1):A6‐7, S6‐296. [MEDLINE: ] [DOI] [PubMed] [Google Scholar]
Collins 2008
- Collins AJ, Foley R, Herzog C, Chavers B, Gilbertson D, Ishani A, et al. Excerpts from the United States Renal Data System 2007 Annual Data Report. American Journal of Kidney Diseases 2008;51(1 Suppl 1):S1‐320. [MEDLINE: ] [DOI] [PubMed] [Google Scholar]
CONTROL Group 2009
- Control Group, Turnbull FM, Abraira C, Anderson RJ, Byington RP, Chalmers JP, et al. Intensive glucose control and macrovascular outcomes in type 2diabetes.[Erratum appears in Diabetologia. 2009 Nov;52(1):2470 Note: Control Group [added]]. Diabetologia 2009;52(11):2288‐98. [MEDLINE: ] [DOI] [PubMed] [Google Scholar]
Coresh 2003
- Coresh J, Astor BC, Greene T, Eknoyan G, Levey AS. Prevalence of chronic kidney disease and decreased kidney function in the adult US population: Third National Health and Nutrition Examination Survey. American Journal of Kidney Diseases 2003;41(1):1‐12. [MEDLINE: ] [DOI] [PubMed] [Google Scholar]
DCCT Group 1993
- Diabetes Control and Complications Trial Research Group, Nathan DM, Genuth S, Lachin J, Cleary P, Crofford O, et al. The effect of intensive treatment of diabetes on the development and progression of long‐term complications in insulin‐dependent diabetes mellitus. New England Journal of Medicine 1993;329(14):977‐86. [MEDLINE: ] [DOI] [PubMed] [Google Scholar]
DCCT Group 1995
- Anonymous. Effect of intensive therapy on the development and progression of diabetic nephropathy in the Diabetes Control and Complications Trial. The Diabetes Control and Complications (DCCT) Research Group. Kidney International 1995;47(6):1703‐20. [MEDLINE: ] [DOI] [PubMed] [Google Scholar]
Duckworth 2009
- Duckworth W, Abraira C, Moritz T, Reda D, Emanuele N, Reaven PD, et al. Glucose control and vascular complications in veterans with type 2 diabetes.[Erratum appears in N Engl J Med. 2009 Sep 3;361(10):1028], [Erratum appears in N Engl J Med. 2009 Sep 3;361(10):1024‐5; PMID: 19726779]. New England Journal of Medicine 2009;360(2):129‐39. [MEDLINE: ] [DOI] [PubMed] [Google Scholar]
Elashoff 2011
- Elashoff M, Matveyenko AV, Gier B, Elashoff R, Butler PC. Pancreatitis, pancreatic, and thyroid cancer with glucagon‐like peptide‐1‐based therapies. Gastroenterology 2011;141(1):150‐6. [MEDLINE: ] [DOI] [PMC free article] [PubMed] [Google Scholar]
ERBP 2015
- Guideline Development Group. Clinical Practice Guideline on management of patients with diabetes and chronic kidney disease stage 3b or higher (eGFR <45 mL/min). Nephrology Dialysis Transplantation 2015;30 Suppl 2:ii1‐11142. [MEDLINE: ] [DOI] [PubMed] [Google Scholar]
FDA 2000
- US Food, Drug Administration. Rezulin from the market. www.nfb.org/Images/nfb/Publications/vod/vsum0003.htm 21 March 2000.
Feldt‐Rasmussen 2006
- Feldt‐Rasmussen B. Is there a need to optimize glycemic control in hemodialyzed diabetic patients?. Kidney International 2006;70(8):1392‐4. [MEDLINE: ] [DOI] [PubMed] [Google Scholar]
GRADE 2008
- Guyatt GH, Oxman AD, Vist GE, Kunz R, Falck‐Ytter Y, Alonso‐Coello P, et al. GRADE: an emerging consensus on rating quality of evidence and strength of recommendations. BMJ 2008;336(7650):924‐6. [MEDLINE: ] [DOI] [PMC free article] [PubMed] [Google Scholar]
Higgins 2003
- Higgins JP, Thompson SG, Deeks JJ, Altman DG. Measuring inconsistency in meta‐analyses. BMJ 2003;327(7414):557‐60. [MEDLINE: ] [DOI] [PMC free article] [PubMed] [Google Scholar]
Higgins 2011
- Higgins JP, Green S (editors). Cochrane Handbook for Systematic Reviews of Interventions Version 5.1.0 [updated March 2011]. The Cochrane Collaboration, 2011. Available from www.cochrane‐handbook.org.
Holman 2008
- Holman R, Paul SK, Bethel A, Matthews DR, Neil HA. 10‐year follow‐up of intensive glucose control in type 2 diabetes. New England Journal of Medicine 2008;359(15):1577‐89. [MEDLINE: ] [DOI] [PubMed] [Google Scholar]
Howse 2016
- Howse PM, Chibrikova LN, Twells LK, Barrett BJ, Gamble JM. Safety and efficacy of incretin‐based therapies in patients with type 2 diabetes mellitus and CKD: a systematic review and meta‐analysis. American Journal of Kidney Diseases 2016;68(5):733‐42. [MEDLINE: ] [DOI] [PubMed] [Google Scholar]
IDF 2013
- International Diabetes Federation. IDF Diabetes Atlas. 6th edition. 2013. www.idf.org/component/attachments/attachments.html?id=813&task=download (accessed 9 August 2018).
Inzucchi 2012
- Inzucchi SE, Bergenstal RM, Buse JB, Diamant M, Ferrannini E, Nauck M, et al. Management of hyperglycaemia in type 2 diabetes: a patient‐centered approach. Position statement of the American Diabetes Association (ADA) and the European Association for the Study of Diabetes (EASD).[Erratum appears in Diabetologia. 2013 Mar;56(3):680]. Diabetologia 2012;55(6):1577‐96. [MEDLINE: ] [DOI] [PubMed] [Google Scholar]
Ismail‐Beigi 2010
- Ismail‐Beigi F, Craven T, Banerji MA, Basile J, Calles J, Cohen RM, et al. Effect of intensive treatment of hyperglycaemia on microvascular outcomes in type 2 diabetes: an analysis of the ACCORD randomised trial.[Erratum appears in Lancet. 2010 Oct 30;376(9751):1466]. Lancet 2010;376(9739):419‐30. [MEDLINE: ] [DOI] [PMC free article] [PubMed] [Google Scholar]
Jackson 2000
- Jackson MA, Holland MR, Nicholas J, Lodwick R, Forster D, Macdonald IA. Hemodialysis‐induced hypoglycemia in diabetic patients. Clinical Nephrology 2000;54(1):30‐4. [MEDLINE: ] [PubMed] [Google Scholar]
Jun 2012
- Jun M, Lo C, Badve SV, Pilmore H, White SL, Hawley C, et al. Glucose lowering therapies for chronic kidney disease and kidney transplantation. Cochrane Database of Systematic Reviews 2012, Issue 8. [DOI: 10.1002/14651858.CD009966] [DOI] [Google Scholar]
KDIGO 2011
- Levey AS, Jong PE, Coresh J, Nahas M, Astor BC, Matsushita K, et al. The definition, classification, and prognosis of chronic kidney disease: a KDIGO Controversies Conference report.[Erratum appears in Kidney Int. 2011 Nov;80(9):1000], [Erratum appears in Kidney Int. 2011 Nov 1;80(9):1000; PMID: 30036909]. Kidney International 2011;80(1):17‐28. [MEDLINE: ] [DOI] [PubMed] [Google Scholar]
KDOQI 2002
- National Kidney Foundation. K/DOQI clinical practice guidelines for chronic kidney disease: evaluation, classification, and stratification. American Journal of Kidney Diseases 2002;39(2 Suppl 1):S1‐266. [MEDLINE: ] [PubMed] [Google Scholar]
KDOQI 2012
- National Kidney Foundation. KDOQI Clinical Practice Guideline for Diabetes and CKD: 2012 Update.[Erratum appears in Am J Kidney Dis. 2013 Jun;61(6):1049]. American Journal of Kidney Diseases 2012;60(5):850‐86. [MEDLINE: ] [DOI] [PubMed] [Google Scholar]
Kobayashi 2000
- Kobayashi S, Maejima S, Ikeda T, Nagase M. Impact of dialysis therapy on insulin resistance in end‐stage renal disease: comparison of haemodialysis and continuous ambulatory peritoneal dialysis. Nephrology Dialysis Transplantation 2000;15(1):65‐70. [MEDLINE: ] [DOI] [PubMed] [Google Scholar]
Levin 2000
- Levin SR, Coburn JW, Abraira C, Henderson WG, Colwell JA, Emanuele NV, et al. Effect of intensive glycemic control on microalbuminuria in type 2 diabetes. Veterans Affairs Cooperative Study on Glycemic Control and Complications in Type 2 Diabetes Feasibility Trial Investigators. Diabetes Care 2000;23(10):1478‐85. [MEDLINE: ] [DOI] [PubMed] [Google Scholar]
Lo 2017
- Lo C, Jun M, Badve S V, Pilmore H, White S L, Hawley C, et al. Glucose‐lowering agents for treating pre‐existing and new‐onset diabetes in kidney transplant recipients. Cochrane Database of Systematic Reviews 2017, Issue 2. [DOI: 10.1002/14651858.CD009966.pub2] [DOI] [PMC free article] [PubMed] [Google Scholar]
Loipl 2005
- Loipl J, Schmekal B, Biesenbach G. Long‐term impact of chronic hemodialysis on glycemic control and serum lipids in insulin‐treated type 2 diabetic patients. Renal Failure 2005;27(3):305‐8. [MEDLINE: ] [PubMed] [Google Scholar]
Moen 2009
- Moen MF, Zhan M, Hsu VD, Walker LD, Einhorn LM, Seliger SL, et al. Frequency of hypoglycemia and its significance in chronic kidney disease. Clinical Journal of the American Society of Nephrology: CJASN 2009;4(6):1121‐7. [MEDLINE: ] [DOI] [PMC free article] [PubMed] [Google Scholar]
Morioka 2001
- Morioka T, Emoto M, Tabata T, Shoji T, Tahara H, Kishimoto H, et al. Glycemic control is a predictor of survival for diabetic patients on hemodialysis. Diabetes Care 2001;24(5):909‐13. [MEDLINE: ] [DOI] [PubMed] [Google Scholar]
Nathan 2005
- Nathan DM, Cleary PA, Backlund JY, Genuth SM, Lachin JM, Orchard TJ, et al. Intensive diabetes treatment and cardiovascular disease in patients with type 1 diabetes. New England Journal of Medicine 2005;353(25):2643‐53. [MEDLINE: ] [DOI] [PMC free article] [PubMed] [Google Scholar]
Ohkubo 1995
- Ohkubo Y, Kishikawa H, Araki E, Miyata T, Isami S, Motoyoshi S, et al. Intensive insulin therapy prevents the progression of diabetic microvascular complications in Japanese patients with non‐insulin‐dependent diabetes mellitus: a randomized prospective 6‐year study. Diabetes Research & Clinical Practice 1995;28(2):103‐17. [MEDLINE: ] [DOI] [PubMed] [Google Scholar]
Oomichi 2006
- Oomichi T, Emoto M, Tabata T, Morioka T, Tsujimoto Y, Tahara H, et al. Impact of glycemic control on survival of diabetic patients on chronic regular hemodialysis: a 7‐year observational study. Diabetes Care 2006;29(7):1496‐500. [MEDLINE: ] [DOI] [PubMed] [Google Scholar]
Orme 2017
- Orme ME, Nguyen H, Lu JY, Thomas SA. Comparative effectiveness of glycemic control in patients with type 2 diabetes treated with GLP‐1 receptor agonists: a network meta‐analysis of placebo‐controlled and active‐comparator trials. Diabetes, Metabolic Syndrome & Obesity Targets & Therapy 2017;10:111‐22. [MEDLINE: ] [DOI] [PMC free article] [PubMed] [Google Scholar]
Patel 2016
Perkovic 2007
- Perkovic V, Ninomiya T, Arima H, Gallagher M, Jardine M, Cass A, et al. Chronic kidney disease, cardiovascular events, and the effects of perindopril‐based blood pressure lowering: Data from the PROGRESS Study. Journal of the American Society of Nephrology 2007;18(10):2766‐72. [MEDLINE: ] [DOI] [PubMed] [Google Scholar]
Perkovic 2013
- Perkovic V, Heerspink HL, Chalmers J, Woodward M, Jun M, Li Q, et al. Intensive glucose control improves kidney outcomes in patients with type 2 diabetes. Kidney International 2013;83(3):517‐23. [MEDLINE: ] [DOI] [PubMed] [Google Scholar]
Radbill 2008
- Radbill B, Murphy B, LeRoith D. Rationale and strategies for early detection and management of diabetic kidney disease. Mayo Clinic Proceedings 2008;83(12):1373‐81. [MEDLINE: ] [DOI] [PubMed] [Google Scholar]
Rave 2001
- Rave K, Heise T, Pfutzner A, Heinemann L, Sawicki PT. Impact of diabetic nephropathy on pharmacodynamic and pharmacokinetic properties of insulin in type 1 diabetic patients. Diabetes Care 2001;24(5):886‐90. [MEDLINE: ] [DOI] [PubMed] [Google Scholar]
Rehman 2017
- Rehman MB, Tudrej BV, Soustre J, Buisson M, Archambault P, Pouchain D, et al. Efficacy and safety of DPP‐4 inhibitors in patients with type 2 diabetes: Meta‐analysis of placebo‐controlled randomized clinical trials. Diabetes & Metabolism 2017;43(1):48‐58. [MEDLINE: ] [DOI] [PubMed] [Google Scholar]
Ruanpeng 2016
- Ruanpeng D, Ungprasert P, Sangtian J, Harindhanavudhi T. Sodium glucose co‐transporter 2 (SGLT2) inhibitors and fracture risk in patients with type 2 diabetes mellitus: A systemic review and meta‐analysis [abstract]. Diabetes 2016;65(Suppl 1):A288. [EMBASE: 620237755] [DOI] [PubMed] [Google Scholar]
Scheen 2015
Schünemann 2011a
- Schünemann HJ, Oxman AD, Higgins JP, Vist GE, Glasziou P, Guyatt GH. Chapter 11: Presenting results and 'Summary of findings' tables. In: Higgins JP, Green S (editors). Cochrane Handbook for Systematic Reviews of Interventions Version 5.1.0 [updated March 2011]. The Cochrane Collaboration, 2011. Available from www.cochrane‐handbook.org.
Schünemann 2011b
- Schünemann HJ, Oxman AD, Higgins JP, Deeks JJ, Glasziou P, Guyatt GH. Chapter 12: Interpreting results and drawing conclusions. In: Higgins JP, Green S (editors). Cochrane Handbook for Systematic Reviews of Interventions Version 5.1.0 [updated March 2011]. The Cochrane Collaboration, 2011. Available from www.cochrane‐handbook.org.
Shurraw 2010
- Shurraw S, Majumdar SR, Thadhani R, Wiebe N, Tonelli M, Alberta Kidney Disease Network. Glycemic control and the risk of death in 1,484 patients receiving maintenance hemodialysis. American Journal of Kidney Diseases 2010;55(5):875‐84. [MEDLINE: ] [DOI] [PubMed] [Google Scholar]
Shurraw 2011
- Shurraw S, Hemmelgarn B, Lin M, Majumdar SR, Klarenbach S, Manns B, et al. Association between glycemic control and adverse outcomes in people with diabetes mellitus and chronic kidney disease: a population‐based cohort study. Archives of Internal Medicine 2011;171(21):1920‐6. [MEDLINE: ] [DOI] [PubMed] [Google Scholar]
Shyangdan 2016
- Shyangdan DS, Uthman OA, Waugh N. SGLT‐2 receptor inhibitors for treating patients with type 2 diabetes mellitus: a systematic review and network meta‐analysis. BMJ Open 2016; Vol. 6, issue 2:e009417. [MEDLINE: ] [DOI] [PMC free article] [PubMed]
Singh‐Franco 2016
- Singh‐Franco D, Harrington C, Tellez‐Corrales E. An updated systematic review and meta‐analysis on the efficacy and tolerability of dipeptidyl peptidase‐4 inhibitors in patients with type 2 diabetes with moderate to severe chronic kidney disease. SAGE Open Medicine 2016;4:2050312116659090. [MEDLINE: ] [DOI] [PMC free article] [PubMed] [Google Scholar]
Storgaard 2016
- Storgaard H, Gluud LL, Bennett C, Grondahl MF, Christensen MB, Knop FK, et al. Benefits and harms of sodium‐glucose co‐transporter 2 inhibitors in patients with type 2 diabetes: a systematic review and meta‐analysis. PLoS ONE (Electronic Resource] 2016; Vol. 11, issue 11:e0166125. [MEDLINE: ] [DOI] [PMC free article] [PubMed]
Tuttle 2014
- Tuttle KR, Bakris GL, Bilous RW, Chiang JL, Boer IH, Goldstein‐Fuchs J, et al. Diabetic kidney disease: a report from an ADA Consensus Conference. American Journal of Kidney Diseases 2014;64(4):510‐33. [MEDLINE: ] [DOI] [PubMed] [Google Scholar]
UKPDS 33 1998
- Anonynous. Intensive blood‐glucose control with sulphonylureas or insulin compared with conventional treatment and risk of complications in patients with type 2 diabetes (UKPDS 33). UK Prospective Diabetes Study (UKPDS) Group.[Erratum appears in Lancet 1999 Aug 14;354(9178):602]. Lancet 1998;352(9131):857‐53. [MEDLINE: ] [PubMed] [Google Scholar]
UKPDS 34 1998
- Anonymous. Effect of intensive blood‐glucose control with metformin on complications in overweight patients with type 2 diabetes (UKPDS 34). UK Prospective Diabetes Study (UKPDS) Group.[Erratum appears in Lancet 1998 Nov 7;352(9139):1558]. Lancet 1998;352(9131):854‐65. [MEDLINE: ] [PubMed] [Google Scholar]
Vallon 2007
- Vallon V, Thomson SC. Targeting renal glucose reabsorption to treat hyperglycaemia: the pleiotropic effects of SGLT2 inhibition. Diabetologia 2007;60(2):215‐25. [MEDLINE: ] [DOI] [PMC free article] [PubMed] [Google Scholar]
Walker 2017
- Walker SR, Komenda P, Khojah S, Al‐Tuwaijri W, MacDonald K, Hiebert B, et al. Dipeptidyl peptidase‐4 inhibitors in chronic kidney disease: a systematic review of randomized clinical trials. Nephron 2017;136(2):85‐94. [MEDLINE: ] [DOI] [PubMed] [Google Scholar]
Williams 2006
- Williams ME, Lacson EJ Jr, Teng M, Ofsthun N, Lazarus JM. Hemodialyzed type I and type II diabetic patients in the US: characteristics, glycemic control, and survival. Kidney International 2006;70(8):1503‐9. [MEDLINE: ] [DOI] [PubMed] [Google Scholar]
Wu 1997
- Wu MS, Yu CC, Yang CW, Wu CH, Haung JY, Hong JJ, et al. Poor pre‐dialysis glycaemic control is a predictor of mortality in type II diabetic patients on maintenance haemodialysis. Nephrology Dialysis Transplantation 1997;12(10):2105‐10. [MEDLINE: ] [DOI] [PubMed] [Google Scholar]
Wu 2016
- Wu JH, Foote C, Blomster J, Toyama T, Perkovic V, Sundstrom J, et al. Effects of sodium‐glucose cotransporter‐2 inhibitors on cardiovascular events, death, and major safety outcomes in adults with type 2 diabetes: a systematic review and meta‐analysis.[Erratum appears in Lancet Diabetes Endocrinol. 2016 Sep;4(9):e9; PMID: 27174817]. The Lancet Diabetes & Endocrinology 2016; Vol. 4, issue 5:411‐9. [MEDLINE: ] [DOI] [PubMed]
Xu 2017
- Xu S, Zhang X, Tang L, Zhang F, Tong N. Cardiovascular effects of dipeptidyl peptidase‐4 inhibitor in diabetic patients with and without established cardiovascular disease: a meta‐analysis and systematic review. Postgraduate Medicine 2017;129(2):205‐15. [MEDLINE: ] [DOI] [PubMed] [Google Scholar]
Zaccardi 2016
Zanoli 2015
- Zanoli L, Granata A, Lentini P, Rastelli S, Fatuzzo P, Rapisarda F, et al. Sodium‐glucose linked transporter‐2 inhibitors in chronic kidney disease. Thescientificworldjournal 2015; Vol. 2015:317507. [MEDLINE: ] [DOI] [PMC free article] [PubMed]
Zoungas 2017
- Zoungas S, Arima H, Gerstein HC, Holman RR, Woodward M, Reaven P, et al. Effects of intensive glucose control on microvascular outcomes in patients with type 2 diabetes: a meta‐analysis of individual participant data from randomised controlled trials. The Lancet Diabetes and Endocrinology 2017;5(6):431‐7. [MEDLINE: ] [DOI] [PubMed] [Google Scholar]
References to other published versions of this review
Lo 2015
- Lo C, Toyama T, Hirakawa Y, Jun M, Cass A, Hawley C, et al. Insulin and glucose‐lowering agents for treating people with diabetes and chronic kidney disease. Cochrane Database of Systematic Reviews 2015, Issue 8. [DOI: 10.1002/14651858.CD011798] [DOI] [PMC free article] [PubMed] [Google Scholar]