Key Points
Question
In Norway, a country with a largely tax-financed universal health care system and moderate income differences, does life expectancy vary with income, and are differences comparable to differences in the United States?
Findings
In this registry-based study that included data from 3 041 828 persons aged at least 40 years in Norway between 2005 and 2015, the difference in life expectancy between the richest and poorest 1% was 8.4 years for women and 13.8 years for men. The differences widened between 2005 and 2015 and were comparable to those in the United States.
Meaning
Inequalities in life expectancy by income in Norway were substantial and increased between 2005 and 2015.
Abstract
Importance
Examining causes of death and making comparisons across countries may increase understanding of the income-related differences in life expectancy.
Objectives
To describe income-related differences in life expectancy and causes of death in Norway and to compare those differences with US estimates.
Design and Setting
A registry-based study including all Norwegian residents aged at least 40 years from 2005 to 2015.
Exposures
Household income adjusted for household size.
Main Outcomes and Measures
Life expectancy at 40 years of age and cause-specific mortality.
Results
In total, 3 041 828 persons contributed 25 805 277 person-years and 441 768 deaths during the study period (mean [SD] age, 59.3 years [13.6]; mean [SD] number of household members per person, 2.5 [1.3]). Life expectancy was highest for women with income in the top 1% (86.4 years [95% CI, 85.7-87.1]) which was 8.4 years (95% CI, 7.2-9.6) longer than women with income in the lowest 1%. Men with the lowest 1% income had the lowest life expectancy (70.6 years [95% CI, 69.6-71.6]), which was 13.8 years (95% CI, 12.3-15.2) less than men with the top 1% income. From 2005 to 2015, the differences in life expectancy by income increased, largely attributable to deaths from cardiovascular disease, cancers, chronic obstructive pulmonary disease, and dementia in older age groups and substance use deaths and suicides in younger age groups. Over the same period, life expectancy for women in the highest income quartile increased 3.2 years (95% CI, 2.7-3.7), while life expectancy for women in the lowest income quartile decreased 0.4 years (95% CI, −1.0 to 0.2). For men, life expectancy increased 3.1 years (95% CI, 2.5-3.7) in the highest income quartile and 0.9 years (95% CI, 0.2-1.6) in the lowest income quartile. Differences in life expectancy by income levels in Norway were similar to differences observed in the United States, except that life expectancy was higher in Norway in the lower to middle part of the income distribution in both men and women.
Conclusions and Relevance
In Norway, there were substantial and increasing gaps in life expectancy by income level from 2005 to 2015. The largest differences in life expectancy between Norway and United States were for individuals in the lower to middle part of the income distribution.
This population epidemiology study uses Norwegian registry data to describe differences in life expectancy based on income and to compare those differences to income and life expectancy differences in the United States.
Introduction
A study by Chetty et al found that the gaps in life expectancy between the 1% richest and 1% poorest individuals were 14.6 years for men and 10.1 years for women from 2000 to 2014 in the United States.1 Similar income-mortality gradients have been observed in several high-income nations, which has been attributed to differences in access to health care, behavioral risk factors, inequalities in income, social stress, and neighborhood characteristics.1,2,3,4,5 Suggested strategies for reducing income-related inequalities in health include reducing income inequalities, strengthening social insurance programs, and increasing access to health services.6,7
Norway is a high-income nation with a largely tax-funded public health care system and more evenly distributed income and wealth than the United States. In 2014, the top 1% of income earners received 8% of the total income in Norway. In comparison, the top 1% in the United States received 20% of the total income.8 Among the 35 countries in the Organisation for Economic Co-operation and Development, the United States was ranked 4th and Norway was ranked 31st in terms of income inequality measured by the Gini index in 2015.9,10 Despite this ranking, there are pronounced inequalities in health in Norway regarding income, education, and occupation similar to inequalities observed in other high-income countries.2
The 4 aims of this study were to (1) estimate differences in life expectancy at the age of 40 years by income, (2) examine time trends in life expectancy by income, (3) assess the income-related gaps in life expectancy into causes of death by age groups, and (4) compare Norwegian estimates with US estimates reported by Chetty et al.1
Methods
The study was based on deidentified data from 4 Norwegian national registries. The study was approved and participant consent was waived by the Regional Committee for Medical and Health Research Ethics South-East Norway, reference number 2013/2394.
Data Sources and Study Population
Linked individual-level information from the Population Register, the National Registry for Personal Taxpayers, the Cause of Death Registry, and the National Education Database was used. The study contained information on income and population for more than 99% of the official Norwegian population.11 Because household income for children and young adults does not reflect adult lifetime income,12 only the population aged 40 years and older from 2005 to 2015 was included. The population with the lowest 3% of income was excluded, which included individuals who had negative or zero income, income from unregistered sources, or persons in other households who catered their expenses. Some immigrants return to their country of origin prior to death without notifying the Population Register13,14 and more than 70% of individuals with missing household income have been found to have immigrant background.15 Hence, individuals not born in Norway or whose parents were not born in Norway were excluded from the primary study population.
Income Measures
“Household income” included income from wages, self-employment, capital income, pensions, and social benefits. The primary income measure was “equivalized household income,” defined as household income after tax divided by the square root of the number of household members,16 averaged across the 5 preceding years (eMethods part I in the Supplement). Sensitivity analyses of individuals aged 63 years or older (eMethods part III and eFigure 2 in the Supplement) and with alterations of the year of income measurement (eMethods part III and eFigure 3 in the Supplement) were performed.
Individuals were assigned percentile ranks from 1 to 100 based on equivalized household income relative to all other individuals of the same sex and age each calendar year. For some analyses, income was dichotomized into above and below the median income or categorized into quartiles.
Causes of Death
Year and underlying cause of death were obtained from the Cause of Death Registry, which contains 98.5% of all deaths in Norway from 2005 to 2015.17 Underlying cause of death was classified using the International Classification of Diseases, Tenth Revision (ICD-10). Country comparisons from the Global Burden of Disease Study estimated that 83.7% of deaths in Norway from 2005 to 2015 were well-certified deaths.18 Misclassification has been found to be reduced when causes of death were categorized by ICD chapter levels instead of using more detailed ICD-10 classification levels.19 Causes of death were stratified into 12 subgroups based on the ICD-10 chapters and the European shortlist of causes of death (eTable 1 in the Supplement).
Statistical Methods
Expected age at death was calculated as life expectancy at 40 years of age plus 40 years. Death rates were calculated for 1-year age groups by sex and income percentiles.20 The person-years lived between ages x years and x plus 1 year for persons dying in this interval was set to 0.5. For individuals older than 95 years, the mortality rate was set as constant and equal to the crude rate. Chiang's method was used to calculate 95% CIs for life expectancy.21 The absolute life expectancy gaps by income quartiles were decomposed by age and causes of death using Arriaga’s method.22,23,24 To assess the contribution of smoking to absolute life expectancy gaps by income quartiles, age-, sex-, and cause-specific life expectancy differences from Arriaga’s decomposition were multiplied by age-, sex-, and cause of death–specific population attributable fractions (PAF) for smoking from the Global Burden of Disease Risk Factor Study (estimates for Norway from 2011-2015).25
Mortality rate ratios (MRRs) by income were estimated by regressing the total number of deaths in 2015 (for each age, sex, and income combination) on a dichotomous variable for income (above or below median), adjusted for age (cubic-restricted age splines with 5 knots) and using log-transformed total person-years as the offset, with a negative binomial count model.26
When analyzing time trends, life expectancy and mortality rates by income percentiles were calculated by year each year from 2005 through 2015. All other analyses, except for analyses used for the US comparisons, were based on combined data for the period of 2011 to 2015 to reflect the more recent period.
Comparison Between Norway and the United States
For comparisons with the United States, a study population in accordance with the study by Chetty et al1 was used. This population included all residents (including individuals with an immigrant background) for the years 2001 to 2014. Inclusion/exclusion of immigrants from this part of the analyses did not alter the interpretations. Persons in Norway with zero “pensionable earnings” (wages and unemployment benefits) 2 years prior to death were excluded. In analyses of individuals aged 63 to 76 years, individuals with zero pensionable earnings at 61 years of age were excluded. Individuals with the lowest percentiles of income were also excluded because they consisted of individuals with negative income or who may have had unregistered income. Because Chetty et al did not adjust their income measure for family size, this was also not done in the current study when generating the Norwegian life expectancy estimates by income for comparison with the United States (eMethods part II in the Supplement).
To replicate the findings of Chetty et al,1 mortality rates in predetermined age groups were estimated using the following 4 steps: (1) for individuals aged 40 to 62 years, mortality rates were calculated with income from 1 to 5 years earlier, (2) income for individuals aged 63 to 76 years was measured at the ages of 58 to 62 years, (3) mortality rates for individuals aged 77 to 90 years were extrapolated using a Gompertz function fitted to the mortality rates between ages 40 and 76 years, and (4) all individuals aged at least 91 years were assigned sex-specific, income-independent mortality rates based on life tables published by Statistics Norway.11
Descriptions of additional analyses performed to address the consequences of including immigrants and persons with zero pensionable income in the study population, using different methods of lagging income for individuals aged 63 years or older, and using different number of lags for the income variable appear in part II and part III in the eMethods in the Supplement.
The analyses were conducted using Stata, version 15.1, MP-Parallel Edition (StataCorp).
Results
The primary study population consisted of 3 041 828 persons aged at least 40 years, who contributed 25 805 277 person-years and 441 768 deaths from 2005 to 2015. Individuals with immigrant background (11.7%) and individuals with the lowest 3% income were excluded. The mean (SD) age at which individuals were analyzed was 59.3 (13.6) years and the mean (SD) number of household members was 2.5 (1.3) per person. Information on household income was available for 99.6% of the population. The median household income after tax, adjusted for household size, in US purchasing power parity–adjusted dollars for 2011 was $31 749. In additional analyses, individuals with immigrant background were included (eFigure 4 and eTable 2 in the Supplement).
Life Expectancy by Household Income
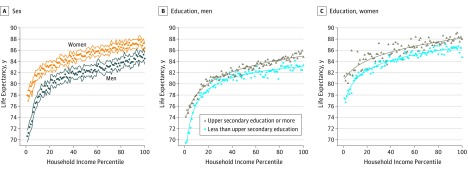
Higher household income was associated with higher life expectancy (Figure 1A). For the years 2011 to 2015, men with income in the bottom 1% had a life expectancy of 70.6 years (95% CI, 69.6-71.6), while men in the top 1% had a life expectancy of 84.4 years (95% CI, 83.4-85.4 years), a difference of 13.8 years (95% CI, 12.3-15.2) (eTable 2 in the Supplement). Women in the bottom 1% had a life expectancy of 78.0 years (95% CI, 77.1-78.9) and women in the top 1% had a life expectancy of 86.4 years (95% CI, 85.7-87.1), a difference of 8.4 years (95% CI, 7.2-9.6) (eTable 2 in the Supplement).
Figure 1. Life Expectancy by Income and Education Level in Norway, 2011-2015.
The solid lines represent predicted life expectancy estimated from a fractional polynomial of income. Panel A shows life expectancy by income percentile with 95% CIs and panels B and C show life expectancy by income percentiles by highest and lowest level of education. Estimated life expectancy was based on actual mortality rates and is presented as expected age at death. Estimates are based on the total Norwegian population aged at least 40 years, excluding individuals with the lowest 3% income and individuals with immigrant background.
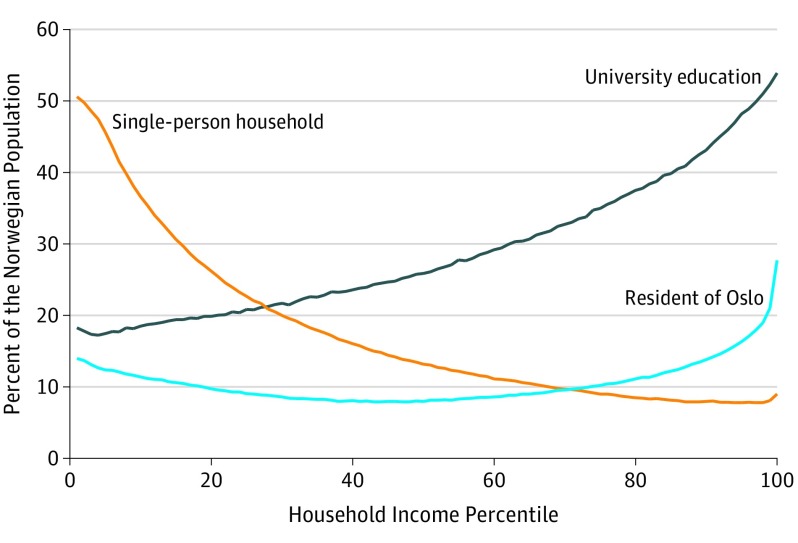
Of individuals with income in the lowest 1%, 50.6% (95% CI, 50.4%-50.8%) lived in single-person households (Figure 2), while only 9% (95% CI, 8.9%-9.1%) of individuals in the top 1% of income were single-person households. Of individuals in the bottom 1% of income, 18.2% (95% CI, 18.0%-18.4%) had a university education, and of individuals in the top 1% of income, 53.9% (95% CI, 53.6%-54.1%) had a university education. Life expectancy was higher for individuals with higher education in all levels of income (Figure 1B and C), and the shape of the curves showing life expectancy by income were similar when stratifying by level of education.
Figure 2. University Education, Residential Status, and Single-Person Households by Income Percentile in Norway, 2011-2015.
Estimates were based on the total Norwegian population aged at least 40 years, excluding individuals with the lowest 3% income and individuals with immigrant background.
Contributions From Age and Causes of Death to the Income-Related Differences in Life Expectancy
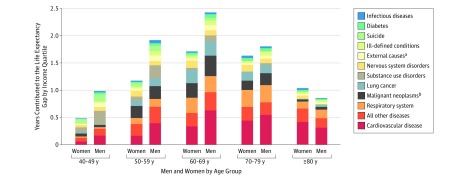
For men, the gap in life expectancy between the top and bottom income quartiles was 8.0 years (95% CI, 7.4-8.6), and 2.4 years of this difference was found in individuals aged 60 to 69 years (Figure 3). For women, the total gap in life expectancy was 6.0 years (95% CI, 5.5-6.5) between the top and bottom income quartiles, and about 1.6 years of this difference was found in individuals aged 60 to 69 years.
Figure 3. Gaps in Life Expectancy Between the Highest and Lowest Income Quartiles by Age and Causes of Death in Norway, 2011-2015.
The vertical length of the bars show the number of years contributed to the difference in life expectancy. Estimated life expectancy was based on actual mortality rates and presented as expected age at death. Estimates were based on the total Norwegian population aged at least 40 years, excluding individuals with the lowest 3% income and individuals with immigrant background. The decomposition was done using Arriaga’s method.22,23,24 Nervous system disorders include Alzheimer disease and dementia.
aInjuries excluding suicide and substance use.
bExcluding lung cancer.
Deaths from cardiovascular disease (CVD) contributed most to the gap in life expectancy, followed by cancers (including lung cancer). In individuals aged 40 to 49 years, deaths from substance use disorders and suicide contributed more than CVD and cancer to the income-related gaps in life expectancy. Applying smoking population–attributable fractions to life expectancy differences suggested that smoking explained 1.7 years of the 8-year difference in life expectancy between lower and upper income quartiles in men and 1.2 years of the 6-year difference in women.
The MRRs compared cause-specific mortality rates in individuals whose income was below the median value with individuals whose income was above the median value (Table). Men and women with income below the median income had significantly higher mortality rates for all causes of death. The most pronounced difference was found in deaths from substance use disorders, with an MRR of 4.1 (95% CI, 3.0-5.5) for men and 2.6 (95% CI, 1.9-3.6) for women. Due to high rates of CVD deaths, CVD contributed to the largest number of years in the life expectancy gap between high-income and low-income men and women (Figure 3). CVD mortality did not, however, have the highest MRRs (Table).
Table. Adjusted Mortality Rate Ratios (MRRs) for Cause-Specific Mortality for Individuals With Below-Median Income Compared With Above-Median Incomea.
| Cause of Death | MRR (95% CI) | |
|---|---|---|
| Men | Women | |
| All deaths | 1.59 (1.22-2.08) | 1.51 (1.19-1.92) |
| Substance use disorders | 4.07 (3.00-5.51) | 2.60 (1.88-3.61) |
| Diseases of the respiratory system | 2.79 (2.09-3.74) | 2.58 (1.97-3.39) |
| Diabetes | 2.68 (2.08-3.45) | 2.48 (1.85-3.33) |
| Infectious diseases | 2.40 (1.72-3.35) | 1.83 (1.43-2.34) |
| Ill-defined conditionsb | 2.10 (1.61-2.75) | 1.88 (1.46-2.43) |
| All other diseases | 1.86 (1.32-2.62) | 1.81 (1.28-2.57) |
| Suicide | 1.80 (1.51-2.16) | 1.87 (1.51-2.32) |
| Cardiovascular diseases | 1.78 (1.55-2.05) | 2.08 (1.75-2.47) |
| Diseases of the nervous systemc | 1.74 (1.39-2.18) | 2.05 (1.63-2.59) |
| Lung cancer | 1.65 (1.41-1.92) | 1.44 (1.23-1.69) |
| External causes (injuries excluding suicide and substance use) | 1.56 (1.31-1.85) | 1.74 (1.40-2.15) |
| Malignant neoplasms (excluding lung cancer) | 1.20 (1.12-1.28) | 1.18 (1.12-1.25) |
Estimations were based on all residents in Norway in the year 2015, excluding individuals with the lowest 3% income and individuals with immigrant background (2 150 707 persons). The MRR was estimated using a negative binomial count model regressing median income on the total number of deaths during 2015 (in each age, sex, and income combination), adjusted for age (cubic-restricted age splines with 5 knots) and using the log-transformed total-person years as an offset.
Symptoms, signs, and abnormal clinical and laboratory findings not elsewhere classified.
Including Alzheimer disease and dementia.
Trends in Life Expectancy by Income, 2005-2015
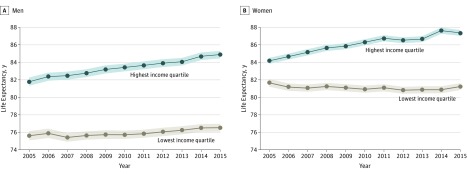
The gap in life expectancy between the bottom and top income quartiles increased from 2.5 years (95% CI, 1.8-3.1) in 2005 to 6.2 years (95% CI, 5.6-6.7) for women and from 6.2 years (95% CI, 5.5-6.9) to 8.4 years (95% CI, 7.7-8.9) for men in 2015 (Figure 4; eTable 3 in the Supplement). Life expectancy for women in the highest income quartile increased 3.2 years (95% CI, 2.7-3.7), while life expectancy for women in the lowest income quartile decreased 0.4 years (95% CI, −1.0 to 0.2). For men, life expectancy increased 3.1 years (95% CI, 2.5-3.7) in the highest income quartile and 0.9 years (95% CI, 0.2-1.6) in the lowest income quartile.
Figure 4. Annual Life Expectancy With 95% CIs for the Highest and Lowest Income Quartiles in Norway, 2005-2015.
Estimated life expectancy was based on actual mortality rates and presented as expected age at death. Estimates were based on the total Norwegian population aged at least 40 years, excluding individuals with the lowest 3% income and individuals with immigrant background.
In 2005, the mortality rate for individuals aged 85 years and older was higher in the top income quartile compared with the bottom income quartile for both men and women. Thus, the older age groups reduced the overall gap in life expectancy by income. In 2015 this trend was reversed, with a higher mortality rate in the bottom income quartile compared with the top income quartile for individuals aged 85 years and older (eTable 3 in the Supplement).
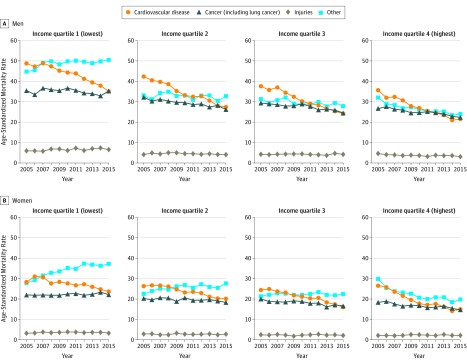
Time trends in age-standardized cause-specific mortality rates varied by income (Figure 5). In low-income groups, cancer mortality (including lung cancer) was stable at 35 deaths per 100 000 men and 22 deaths per 100 000 women from 2005 to 2015. In high-income groups, cancer mortality decreased during that period from 26 (95% CI, 25-27) to 22 (95% CI, 21-23) deaths per 100 000 men and from 18 (95% CI, 17-18) to 15 (95% CI, 14-15) deaths per 100 000 women. CVD mortality decreased from 35 (95% CI, 33-37) to 20 (95% CI, 19-21) deaths per 100 000 high-income men and from 51 (95% CI, 49-53) to 36 (95% CI, 35-38) deaths per 100 000 low-income men. Compared with other detailed causes of death, lung cancer, chronic obstructive pulmonary diseases and dementia (including Alzheimer disease) showed time trends that differed the most by income and sex (eFigure 7 in the Supplement).
Figure 5. Age-Standardized Annual Mortality Rates for Select Causes of Death by Income Quartiles in Norway, 2005-2015.
The age-specific death rates were weighted by the proportion of each group in the mean population in Norway from 2005 to 2011. Estimates were based on the total Norwegian population aged at least 40 years, excluding individuals with the lowest 3% income and individuals with immigrant background.
The life expectancy curve was shifted upward when excluding the population living in households with zero pensionable income, indicating that life expectancy was higher when this group was excluded from analysis (eFigure 1 in the Supplement). Results from analyses in which immigrants were included were similar to results of analyses that excluded immigrants (eTable 2 in the Supplement), except at the lower tail. Measuring income at the age of 61 years for individuals aged 63 years or older, and alterations to the number of lags for the income variable, did not change interpretations of results (eFigures 2 and 3 in the Supplement).
Comparisons Between Norway and the United States
The Norwegian study population that was generated to allow comparison between Norway and the United States excluded households with zero pensionable income (7%) and the 2% of the population with the lowest income, a total exclusion of 9%. Individuals in the excluded 9% accounted for 31% of all deaths from age 40 to 63 years. This exclusion reduced the association between income and life expectancy (eFigure 1 in the Supplement).
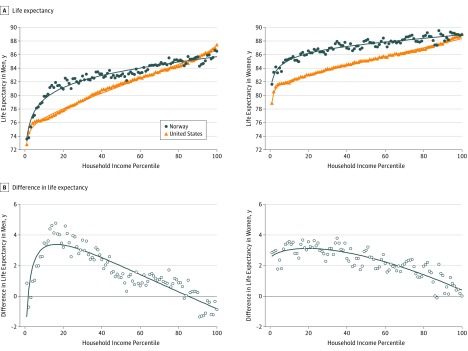
The US estimates from Chetty et al1 showed a near-linear association between income and life expectancy except for with the lowest income percentiles (Figure 6A). Results from Norway showed similar differences in life expectancy with income levels. Life expectancy was higher in Norway than in the United States in all income percentiles, except for the highest income percentiles, in which life expectancies were similar in the 2 countries. The largest differences in life expectancy between the United States and Norway were seen for men in the 5th through the 20th income percentiles and for women in the 10th through the 25th income percentiles (Figure 6B).
Figure 6. Life Expectancy by Income in Norway vs the United States.
The solid lines represent predicted life expectancy estimated from a fractional polynomial of income. Life expectancy was estimated by a combination of actual mortality rates (individuals aged 40-76 years), forecasted mortality rates (individuals aged 77-90 years), and uniform sex-specific mortality rates (individuals aged ≥91 years) and was presented as expected age at death for individuals aged 40 years. Estimates were based on comparable populations in Norway and the United States according to Chetty et al.1
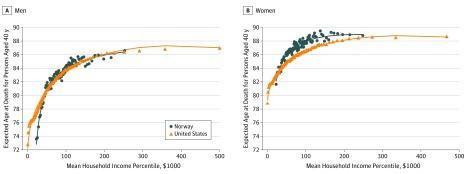
Absolute mean household income (US dollars) was also computed. When comparing absolute income levels (Figure 7), life expectancy in the lowest income percentiles in Norway aligned with somewhat higher income percentiles in the United States, and the differences between Norway and the United States were smaller throughout the distribution in both men and women. Inclusion or exclusion of immigrants in comparisons with the United States did not alter the interpretations.
Figure 7. Life Expectancy by Income in US Dollars in Norway and the United States, 2001-2014.
The solid lines represent predicted life expectancy estimated from a fractional polynomial of income. Life expectancy was estimated by a combination of actual mortality rates (individuals aged 40-76 years), forecasted mortality rates (individuals aged 77-90 years), and uniform sex-specific mortality rates (individuals aged ≥91 years) and was presented as expected age at death for individuals aged 40 years. Estimates were based on comparable populations in Norway and the United States according to Chetty et al.1 The top income percentile was omitted for scaling purposes. The mean household income for US men in the top percentile was US $1.98 million and their expected age at death was 87.3 years. Corresponding numbers in Norwegian men were US $0.53 million and 86.5 years. The mean household income for US women in the top percentile was US $1.92 million and their expected age at death was 88.9 years. Corresponding numbers in Norwegian women were US $0.51 million and 88.9 years. The income variable was pretax household income for both the United States and Norway. Norwegian kroner was translated into US dollars using the 2011 individual consumption expenditure by household value of 9.797 from the International Comparison Program (http://www.worldbank.org/en/programs/icp#5).
Discussion
In Norway, the income-related gap in life expectancy increased from 2005 to 2015. Income-related differences in CVD mortality, followed by cancer mortality, in the individuals aged 60 to 69 years contributed the most to the life expectancy gap. Differences in life expectancy by income percentiles in Norway were similar to differences observed in the United States, although life expectancy was higher in Norway in the lower to middle part of the income distribution.
To construct comparable US and Norwegian study populations, individuals with no income or income solely from disability benefits and other transfers were excluded from both populations. The share of excluded individuals and excluded deaths were of similar magnitude in both countries. The comparison using absolute vs relative income suggests that the difference in life expectancy between Norway and the United States in the lower to middle part of the income distribution might be partly explained by higher absolute income among the individuals in low-income percentiles in Norway. It has been argued that relative, rather than absolute, income is most important for health.27 However, the findings of this study provide support for absolute income being relevant in international comparison studies. Care is required when comparing absolute income across countries. This study relied on purchasing power parities from the International Comparison Programme for comparing US and Norwegian incomes.28 While these estimates constitute a best effort by World Bank researchers, there are still uncertainties related to methodology and data. Moreover, differences in private education, health, and social service expenses are difficult to account for.
In a period with increasing real income and stable income inequalities (eFigure 6 in the Supplement) in Norway, this study shows increasing differences in life expectancy by income in men and women. In the United States there was no apparent increase in life expectancy for individuals in the lowest income quartile from 2001 to 2014.1 In contrast, in Norway, there was an increase in life expectancy for men in the lowest income quartile from 2010 to 2015 but not for women. Smoking contributed to higher mortality in low-income men and women.5 However, the 3-decade lag in the smoking epidemic for women compared with men29 may have contributed to increasing mortality rates for smoking-related causes of death for women in the lowest income quartile from 2005 to 2015 and, hence, the lack of increase in life expectancy for these women.30
The contribution of lung cancer, other cancers, respiratory disease, and CVD to differences in life expectancy between high- and low-income groups points to smoking as a contributing risk factor. Dementia (including Alzheimer disease), which showed similar trends by income quartile as deaths from lung cancer and chronic obstructive pulmonary disease, has been found to be associated with smoking.25 However, only about 20% of the income-related differences in life expectancy were attributed to smoking in this study. Similar estimates of the contribution of smoking to income-related differences in life expectancy were found for Norway from 1995 to 2007 in a 2019 Nordic study.5
This study has several strengths. The use of record linkage at the individual level with nearly complete coverage of the Norwegian population with causes of death, over an extensive time period, allowed analyses and comparisons of different subgroups and investigations of consequences of methodological choices.
Limitations
This study had several limitations. First, national tax records do not capture undeclared income, leading to some misclassification.31 Second, the composition of the top income earners changed in 2005 as a result of a preannounced tax reform implemented in 2006.32 However, by aggregating income across 5 years, the implications of this change were reduced. Third, the approach used in this study did not account for income mobility occurring between the ages of 40 to 63 years (ie, that some individuals move to other income groups during this time). Accounting for income mobility may give less-pronounced income–life expectancy gradients.33 Fourth, income percentile ranks were assigned within age and sex each year. Thus, individuals in the middle income groups at a young age will tend to move to lower income percentiles at higher ages because more low-income individuals died at a younger age. The movement into lower income percentiles is exacerbated by frailty effects, where the most frail individuals die at earlier ages, which can potentially lead to a crossover in mortality rates in which the lowest income groups may appear to have a lower mortality rate than higher income groups at very high ages.34 These effects could have led to underestimation of differences in life expectancy by income. Fifth, there are inaccuracies in information on causes of death due to differences in certification practices between physicians, changes in coding practice over time, and other recognized challenges with using registry information to categorize causes of death.35,36 Sixth, this study is descriptive and further research is required to understand causal mechanisms. For example, education might affect both income and mortality, but the causal link between income, education, and mortality remains to be fully explained.37
Conclusions
In Norway, there were substantial and increasing gaps in life expectancy by income from 2005 to 2015. The largest differences in life expectancy between Norway and the United States were for individuals in the lower to middle part of the income distribution.
eMethods and eResults
References
- 1.Chetty R, Stepner M, Abraham S, et al. . The association between income and life expectancy in the United States, 2001-2014. JAMA. 2016;315(16):1750-1766. doi: 10.1001/jama.2016.4226 [DOI] [PMC free article] [PubMed] [Google Scholar]
- 2.Mackenbach JP, Stirbu I, Roskam A-JR, et al. ; European Union Working Group on Socioeconomic Inequalities in Health . Socioeconomic inequalities in health in 22 European countries. N Engl J Med. 2008;358(23):2468-2481. doi: 10.1056/NEJMsa0707519 [DOI] [PubMed] [Google Scholar]
- 3.Kinge JM, Vallejo-Torres L, Morris S. Income related inequalities in avoidable mortality in Norway: a population-based study using data from 1994-2011. Health Policy. 2015;119(7):889-898. doi: 10.1016/j.healthpol.2015.04.016 [DOI] [PubMed] [Google Scholar]
- 4.Mortensen LH, Rehnberg J, Dahl E, et al. . Shape of the association between income and mortality: a cohort study of Denmark, Finland, Norway and Sweden in 1995 and 2003. BMJ Open. 2016;6(12):e010974. doi: 10.1136/bmjopen-2015-010974 [DOI] [PMC free article] [PubMed] [Google Scholar]
- 5.Östergren O, Martikainen P, Tarkiainen L, Elstad JI, Brønnum-Hansen H. Contribution of smoking and alcohol consumption to income differences in life expectancy: evidence using Danish, Finnish, Norwegian and Swedish register data. J Epidemiol Community Health. 2019:73(4):334-339. doi: 10.1136/jech-2018-211640 [DOI] [PMC free article] [PubMed] [Google Scholar]
- 6.Adler NE, Glymour MM, Fielding J. Addressing social determinants of health and health inequalities. JAMA. 2016;316(16):1641-1642. doi: 10.1001/jama.2016.14058 [DOI] [PubMed] [Google Scholar]
- 7.Marmot M, Atkinson T, Bell J, Black C, Broadfoot P, Cumberlege J. Fair Society, Healthy Lives: Strategic Review of Health Inequalities in England, Post-2010 London, England: The Marmot Review; 2010. [Google Scholar]
- 8.The world wealth and income database. World Inequality Database website. https://wid.world. Published 2016. Accessed March 5, 2019.
- 9.OECD Income inequality. OECD website. https://data.oecd.org/inequality/income-inequality.htm. Accessed February 8, 2018.
- 10.OECD income distribution database (IDD): Gini, poverty, income, methods and concepts. OECD website. http://www.oecd.org/social/income-distribution-database.htm. Accessed February 8, 2018.
- 11.Population. Statistics Norway website. https://www.ssb.no/en/befolkning/statistikker/folkemengde. Published 2017. Accessed April 26, 2019. [Google Scholar]
- 12.Nybom M, Stuhler J. Biases in standard measures of intergenerational income dependence. J Hum Resour. 2017;52(3):800-825. doi: 10.3368/jhr.52.3.0715-7290R [DOI] [Google Scholar]
- 13.Singh GK, Hiatt RA. Trends and disparities in socioeconomic and behavioural characteristics, life expectancy, and cause-specific mortality of native-born and foreign-born populations in the United States, 1979-2003. Int J Epidemiol. 2006;35(4):903-919. doi: 10.1093/ije/dyl089 [DOI] [PubMed] [Google Scholar]
- 14.Kibele E, Scholz R, Shkolnikov VM. Low migrant mortality in Germany for men aged 65 and older: fact or artifact? Eur J Epidemiol. 2008;23(6):389-393. doi: 10.1007/s10654-008-9247-1 [DOI] [PMC free article] [PubMed] [Google Scholar]
- 15.Strøm F. Persons Without Registered Income or Fortune [in Norwegian]. Vol 87 Oslo, Norway: Statistics Norway; 2004. [Google Scholar]
- 16.OECD An overview of growing income inequalities in OECD countries: main findings. Paris, France: OECD; 2011. https://www.oecd.org/els/soc/49499779.pdf. [Google Scholar]
- 17.Dødsårsaksregisteret [Cause of Death Registry]. Norwegian Institute of Public Health. Accessed March 6, 2019.
- 18.GBD 2017 SDG Collaborators Measuring progress from 1990 to 2017 and projecting attainment to 2030 of the health-related Sustainable Development Goals for 195 countries and territories: a systematic analysis for the Global Burden of Disease Study 2017. Lancet. 2018;392(10159):2091-2138. doi: 10.1016/S0140-6736(18)32281-5 [DOI] [PMC free article] [PubMed] [Google Scholar]
- 19.Eriksson A, Stenlund H, Ahlm K, et al. . Accuracy of death certificates of cardiovascular disease in a community intervention in Sweden. Scand J Public Health. 2013;41(8):883-889. doi: 10.1177/1403494813499653 [DOI] [PubMed] [Google Scholar]
- 20.Preston S, Heuveline P, Guillot M. Demography: Measuring and Modeling Population Processes. Oxford, United Kingdom: Blackwell Publisher; 2000. [Google Scholar]
- 21.Chiang CL. Life Table and Its Applications. Malabar: Robert E. Krieger Publishing; 1984. [Google Scholar]
- 22.Arriaga EE. Measuring and explaining the change in life expectancies. Demography. 1984;21(1):83-96. doi: 10.2307/2061029 [DOI] [PubMed] [Google Scholar]
- 23.Arriaga EE. Changing trends in mortality decline during the last decades. In Ruzicka L, Wunsch G, Kane P, eds. Differential Mortality: Methodological Issues and Biosocial Factors. Oxford, England: Clarendon Press; 1989:105-129. [Google Scholar]
- 24.Auger N, Feuillet P, Martel S, Lo E, Barry AD, Harper S. Mortality inequality in populations with equal life expectancy: Arriaga's decomposition method in SAS, Stata, and Excel. Ann Epidemiol. 2014;24(8):575-580.e1. doi: 10.1016/j.annepidem.2014.05.006 [DOI] [PubMed] [Google Scholar]
- 25.GBD 2017 Risk Factor Collaborators Global, regional, and national comparative risk assessment of 84 behavioural, environmental and occupational, and metabolic risks or clusters of risks for 195 countries and territories, 1990-2017: a systematic analysis for the Global Burden of Disease Study 2017. Lancet. 2018;392(10159):1923-1994. doi: 10.1016/S0140-6736(18)32225-6 [DOI] [PMC free article] [PubMed] [Google Scholar]
- 26.Long JS, Freese J. Regression Models for Categorical Dependent Variables Using Stata. College Station, TX: Stata Press; 2006. [Google Scholar]
- 27.Gerdtham U-G, Johannesson M. Absolute income, relative income, income inequality, and mortality. J Hum Resour. 2004;39(1):228-247. doi: 10.2307/3559011 [DOI] [Google Scholar]
- 28.International Comparison Program (ICP) 2011. http://www.worldbank.org/en/programs/icp#5. Accessed March 5, 2019.
- 29.Lund K, Lund M, Bryhni A. Tobacco consumption among men and women 1927-2007 [article in Norwegian]. Tidssk Nor Laegeforen. 2009;129(18):1871-1874. [DOI] [PubMed] [Google Scholar]
- 30.Schaap MM, Kunst AE, Leinsalu M, et al. . Female ever-smoking, education, emancipation and economic development in 19 European countries. Soc Sci Med. 2009;68(7):1271-1278. doi: 10.1016/j.socscimed.2009.01.007 [DOI] [PubMed] [Google Scholar]
- 31.Williams CC, Renooy P. Tackling Undeclared Work in 27 European Union Member States and Norway: Approaches and Measures Since 2008. Dublin, Ireland: Eurofound; 2013. [Google Scholar]
- 32.Aaberge R, Atkinson A, Modalsli J IZA DP No. 7729: the ins and outs of top income mobility. Bonn, Germany: IZA Institute of Labor Economics; 2013. https://www.iza.org/publications/dp/7729/the-ins-and-outs-of-top-income-mobility.
- 33.Kreiner CT, Nielsen TH, Serena BL. Role of income mobility for the measurement of inequality in life expectancy. Proc Natl Acad Sci U S A. 2018;115(46):11754-11759. doi: 10.1073/pnas.1811455115 [DOI] [PMC free article] [PubMed] [Google Scholar]
- 34.Aalen O, Borgan O, Gjessing H. Survival and Event History Analysis: A Process Point of View. Berlin, Germany: Springer Science & Business Media; 2008. doi: 10.1007/978-0-387-68560-1 [DOI] [Google Scholar]
- 35.Wolleswinkel Vanden Bosch JH, VanPoppel FWA, Mackenbach JP. Reclassifying causes of death to study the epidemiological transition in the Netherlands, 1875. European Journal of Population-Revue Europeenne de Demographie. 1992;1996:12. [DOI] [PubMed] [Google Scholar]
- 36.Pedersen AG, Ellingsen CL. Data quality in the Causes of Death Registry. Tidsskr Nor Legeforen. 2015;135(8):768-770. doi: 10.4045/tidsskr.14.1065 [DOI] [PubMed] [Google Scholar]
- 37.Naess O, Claussen B, Thelle DS, Smith GD. Four indicators of socioeconomic position: relative ranking across causes of death. Scand J Public Health. 2005;33(3):215-221. doi: 10.1080/14034940410019190 [DOI] [PubMed] [Google Scholar]
Associated Data
This section collects any data citations, data availability statements, or supplementary materials included in this article.
Supplementary Materials
eMethods and eResults


