Summary
Following Cas9 cleavage, DNA repair without a donor template is generally considered stochastic, heterogeneous, and impractical beyond gene disruption. Here, we show that template-free Cas9 editing is predictable and capable of precise repair to a predicted genotype, enabling correction of human disease-associated mutations. We constructed a library of 2,000 Cas9 guide RNAs (gRNAs) paired with DNA target sites and trained inDelphi, a machine learning model that predicts genotypes and frequencies of 1- to 60-bp deletions and 1-bp insertions with high accuracy (r = 0.87) in five human and mouse cell lines. inDelphi predicts that 5–11% of Cas9 gRNAs targeting the human genome are “precise-50”, yielding a single genotype comprising ≥50% of all major editing products. We experimentally confirmed precise-50 insertions and deletions in 195 human disease-relevant alleles, including correction in primary patient-derived fibroblasts of pathogenic alleles to wild-type genotype for Hermansky-Pudlak syndrome and Menkes disease. This study establishes an approach for precise, template-free genome editing.
Introduction
CRISPR (clustered regularly interspaced short palindromic repeats)-Cas9 has revolutionized genome editing, providing powerful research tools and promising agents for the potential treatment of genetic diseases1–3. The DNA-targeting capabilities of Cas9 have been improved by the development of gRNA design principles4, modeling of factors leading to off-target DNA cleavage, enhancement of Cas9 sequence fidelity by modifications to the nuclease and gRNA, and the evolution or engineering of Cas9 variants with alternative PAM sequences5. Similarly, control over the product distribution of genome editing has been advanced by the development of base editing to achieve precise and efficient single-nucleotide mutations6,7, and the improvement of template-directed homology-directed repair (HDR) of double strand breaks8. Despite these developments, base editing does not mediate insertions or deletions, and HDR is limited by low efficiency especially in non-dividing cells and by undesired byproducts. Since many human genetic variants associated with disease arise from insertions and deletions9,10, methods to efficiently introduce insertions and deletions to alleviate pathogenic mutations in a predictable manner with a major single-genotype outcome would advance the field of genome editing.
Non-homologous end-joining (NHEJ) and microhomology-mediated end-joining (MMEJ) processes are major pathways involved in the repair of Cas9-mediated double-strand breaks that can result in highly heterogeneous repair outcomes comprising hundreds of repair genotypes. While end-joining repair of Cas9-mediated double-stranded DNA breaks has been harnessed to facilitate knock-in of DNA templates11,12 or deletion of intervening sequence between two cleavage sites5, NHEJ and MMEJ are not generally considered useful for precision genome editing applications. Recent work has found that the heterogeneous distribution of Cas9-mediated editing products at a given target site is reproducible and dependent on local sequence context13,14, but no general methods have been described to predict genotypic products following Cas9-induced double-stranded DNA breaks.
In this study we developed a high-throughput Streptococcus pyogenes Cas9 (SpCas9)-mediated repair outcome assay to characterize end-joining repair products at Cas9-induced double-strand breaks using 1,872 target sites based on sequence characteristics of the human genome. We used the resulting rich set of repair product data to train inDelphi, a machine learning algorithm that accurately predicts the frequencies of the substantial majority of template-free Cas9-induced insertion and deletion events at single-base resolution (https://www.crisprindelphi.design). We find that, in contrast to the notion that end-joining repair is heterogeneous, inDelphi identifies that 5–11% of SpCas9 gRNAs in the human genome induce a single predictable repair genotype in ≥50% of editing products. Building on this idea of precision gRNAs, we used inDelphi to design 14 gRNAs for high-precision template-free editing yielding predictable 1-bp insertion genotypes in endogenous human disease-relevant loci and experimentally confirmed highly precise editing (median 61% among edited products) in two human cell lines. We used inDelphi to reveal human pathogenic alleles that are candidates for efficient and precise template-free gain-of-function genotypic correction and achieved template-free correction of 183 pathogenic human microduplication alleles to the wild-type genotype in ≥50% of all editing products. Finally, we integrate these developments to achieve high-precision correction of five pathogenic low-density lipoprotein receptor (LDLR) microduplication alleles in human and mouse cells, as well as correction of endogenous pathogenic microduplication alleles for Hermansky-Pudlak syndrome (HPS1) and Menkes disease (ATP7A) to wild-type sequence in primary patient-derived fibroblasts.
Results
Template-free Cas9 editing is predictable
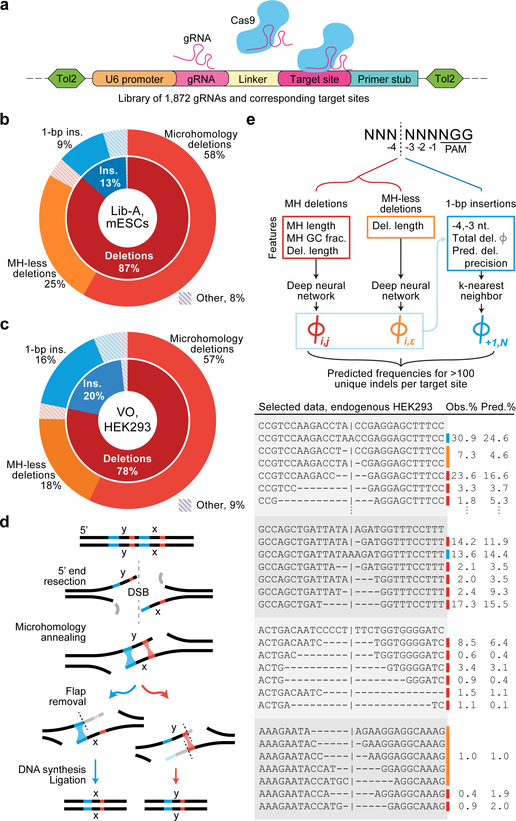
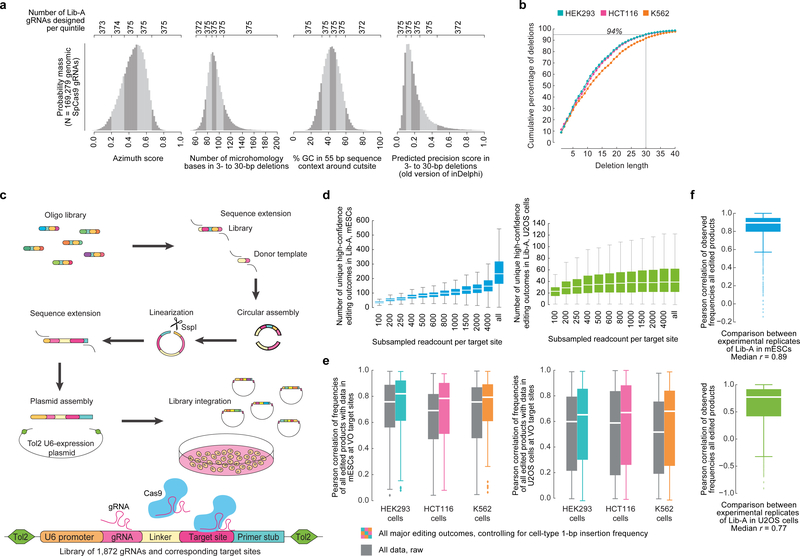
To capture Cas9-mediated end-joining repair products across a wide variety of target sites, we designed a genome-integrated gRNA and target library screen in which many unique gRNAs are paired with 55-bp target sites containing a single canonical “NGG” SpCas9 protospacer-adjacent motif (PAM) that directs cleavage to the center of each target site (Fig. 1a). Previously reported repair products at 90 loci in three human cell lines14 (HCT116, K562, and HEK293; we refer to the collective dataset as VO) showed that 94% of endogenous cut-site proximal Cas9-mediated deletions are ≤ 30 bp (Extended Data Fig. 1), suggesting that our assay can assess the vast majority of cut-site proximal editing products. To explore repair products among sequences representative of the human genome, we designed 1,872 target sites spanning the human genome’s distributions of % GC, number of nucleotides participating in microhomology, predicted Cas9 on-target cutting efficiency4, and estimated precision of deletions14 (Supplementary Methods, Extended Data Fig. 1) in addition to 90 VO target sites to create a library in which each target site is accompanied by a corresponding gRNA on the same DNA molecule (Lib-A). Through a multi-step process (Extended Data Fig. 1), we constructed and cloned Lib-A into a plasmid backbone allowing Tol2 transposon-based integration into the genome15, gRNA expression, and hygromycin selection for cells with library members.
Fig. 1 |. High-throughput assaying of Cas9-mediated DNA repair products supports the design of the inDelphi model.
a, A high-throughput genome-integrated library for assaying Cas9 editing products. b, Categories of editing products at 1,996 Lib-A target sites in mouse embryonic stem cells (mESCs). c, Categories of editing products in 89 VO endogenous target sites in HEK293 cells. d, Mechanism of microhomology-mediated end-joining repair. e, inDelphi uses machine learning to predict the frequencies of editing products from target DNA sequence (selected outcomes depicted in table). Major editing outcomes include +1 to −60 indels.
We stably integrated Lib-A into the genomes of mouse embryonic stem cells (mESCs) and human U2OS cells, then targeted these cells with a Tol2 transposon-based SpCas9 expression plasmid containing a blasticidin expression cassette and selected for cells with stable Cas9 expression while maintaining >2,000-fold coverage of the library. After one week, we collected genomic DNA from these cells (3 independent biological replicates in mESCs, 2 in U2OS) along with control cells not treated with Cas9 (1 in each) and performed paired-end high-throughput DNA sequencing (HTS) to reveal the distribution of cut-site proximal repair products at each target site (Extended Data Fig. 1). We tabulated the resulting 192,055,534 sequencing reads using a sequence alignment procedure (Supplementary Methods) which identified an average of 245 unique repair outcomes with high confidence (Supplementary Methods) per target site in mESCs (45 in U2OS cells) after adjusting with control data. Repair outcomes in experimental replicates within the same cell type were consistent (median r = 0.89 in mESCs, 0.77 in U2OS, Extended Data Fig. 1).
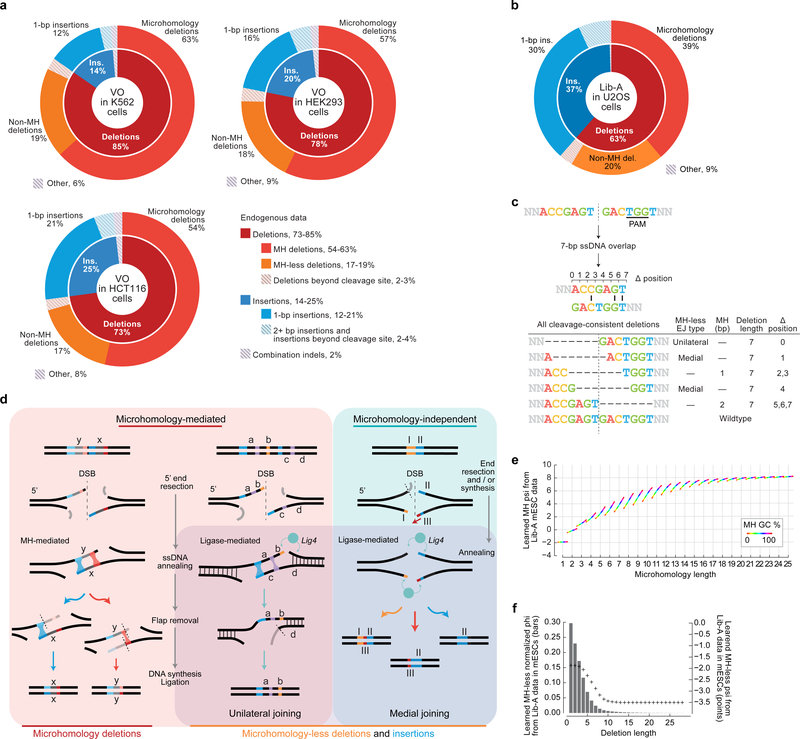
In Lib-A data from mESCs and U2OS cells as well as in endogenous data in HEK293, K562, and HCT116 cells, end-joining repair of Cas9-mediated double-strand breaks primarily caused deletions (on average 63–87% of all edited products across cell types) and insertions (13–37% of all products) (Fig. 1b–c, Extended Data Fig. 2). A large fraction of products were deletions containing microhomology consistent with MMEJ (39–58% of all products, 62–75% of deletions, Fig. 1b–d, Extended Data Fig. 2, Supplementary Discussion). Three repair classes constituted 80–95% of all observed editing products (Fig. 1b–c): microhomology (MH) deletions, microhomology-less (MH-less) deletions, and single-base (1-bp) insertions; we define these three repair classes as constituting all major editing outcomes. The indel frequencies at 86 target sites were consistent between endogenous data in HEK293, K562, and HCT116 cells and Lib-A data in mESCs and U2OS cells (median r = 0.65 to 0.82 for pairs of cell types when adjusting for 1-bp insertion frequencies, median r = 0.52 to 0.76 without adjustment, Extended Data Fig. 1). Together, these data confirm that Cas9-mediated editing products from our library assay reflect previously reported endogenous editing in human cells.
Using Lib-A, we designed a novel machine learning model, inDelphi, to predict the frequency of all major editing outcomes at any given target site. This model consists of three interconnected modules aimed at predicting microhomology (MH) deletions, MH-less deletions, and 1-bp insertions (Fig. 1e).
inDelphi predicts MH deletions using a module that simulates the MMEJ repair mechanism, where 5’-to-3’ end resection at a double-strand break reveals two 3’ ssDNA overhangs that can anneal through sequence microhomology. Extraneous ssDNA overhangs are eliminated, and DNA synthesis and ligation generates a dsDNA repair product16 (Fig. 1d). Through this mechanism, each microhomology results in a distinct deletion genotype (Fig. 1d, Supplementary Discussion). inDelphi assigns a score (phi) to a candidate microhomology based on a neural-network-learned score using its length and % GC with a penalty based on the deletion length. Relative frequencies are obtained by normalizing the phi scores of microhomologies of interest to sum to one, thereby modeling MH deletions as a competitive process.
inDelphi models deletions inconsistent with MMEJ with a second neural network module that predicts the total frequency of groups of MH-less deletion outcomes using the minimum required resection length as the only input feature (Fig. 1e). We hypothesize that MH-less deletions arise primarily from the classical and alternative NHEJ pathways17 (Supplementary Discussion).
The MH and MH-less neural networks were jointly trained using data from 1,095 Lib-A target sites in mESCs with backpropagation in a multitask manner to predict both deletion length frequencies and MH genotype frequencies (Fig. 1e, Supplementary Methods). Computational experiments confirmed that the design of the neural network modules was important for overall performance (Supplementary Methods). From training data, inDelphi learned that strong microhomologies tend to be long and have high GC content and that the frequency of MH-less deletions decays rapidly with increasing length (Extended Data Fig. 2). For 1- to 30-bp deletions, at a typical target site in the human genome, inDelphi makes one prediction for each of 92 possible MH deletions, and 30 predictions for 274 possible MH-less deletion genotypes.
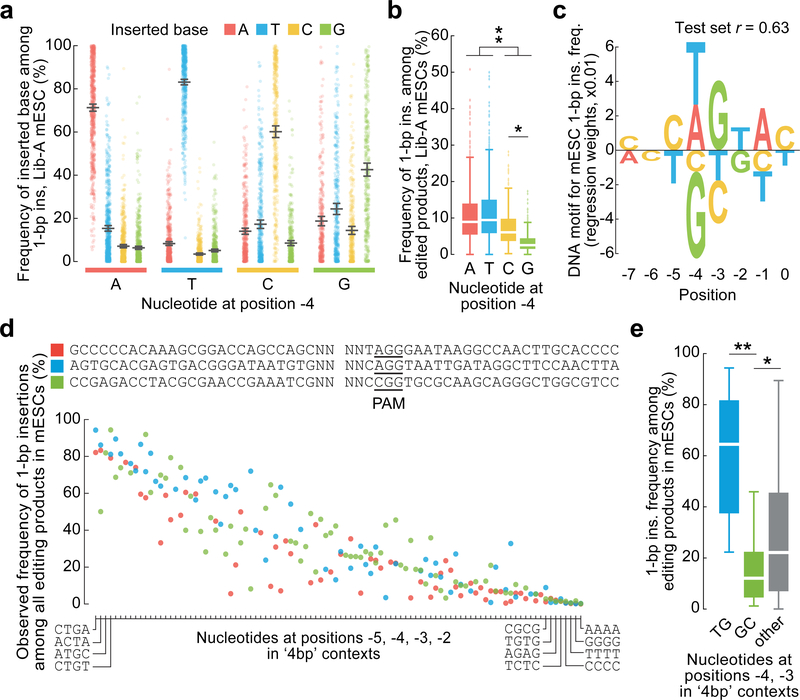
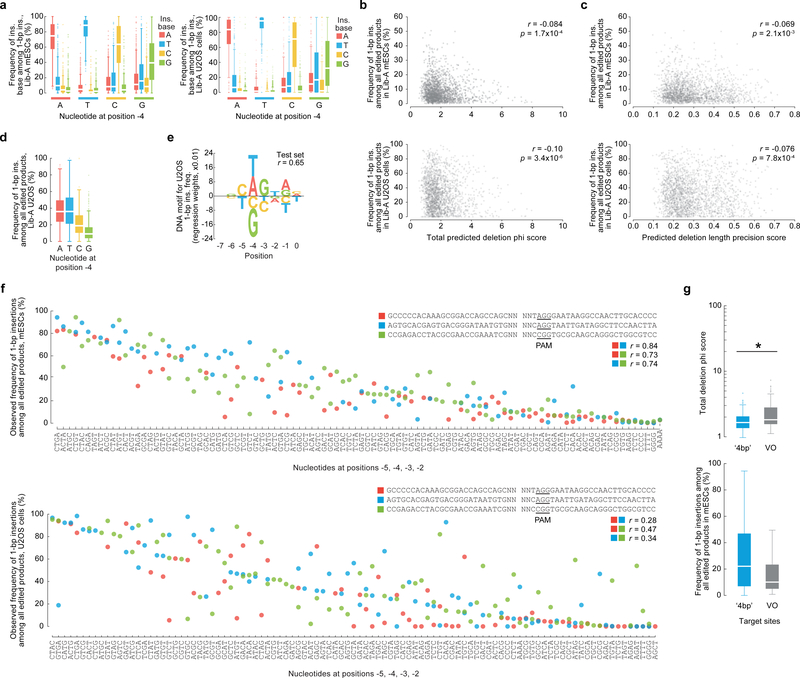
inDelphi contains a third module using k-nearest neighbors to predict 1-bp insertions (Fig. 1e) which represent a major class of edited products (9–30% of all edited products, Fig. 1b, Extended Data Fig. 2). The frequency of 1-bp insertions and their resultant genotypes depend strongly on local sequence context. They are predominantly duplications of the −4 nucleotide (counting the NGG PAM as nucleotides 0–2, Fig. 1e), with higher precision when the −4 nucleotide is an A or T (Fig. 2a). A linear regression model trained to predict the frequency of 1-bp insertions among major editing outcomes from local sequence context performed well on held-out Lib-A target sites in mESCs (n = 499, r = 0.63, Fig. 2c) and U2OS cells (n = 492, r = 0.65, Extended Data Fig. 3). In both cell types, target sites with weak microhomology (low total phi score) or low deletion precision score (Supplementary Methods) were significantly more likely to yield insertions at the expense of deletions (p < 2.0×10⁻³, Extended Data Fig. 3). Randomization of four nucleotides surrounding the Cas9 cleavage site in three constant background sequences with weak microhomology revealed substantial variation in 1-bp insertion frequency (from ≤5% to ≥80% of all edited products, Fig. 2d, Extended Data Fig. 3) and identified mini-motifs consistent with Lib-A (Fig. 2e), suggesting that local sequence context is a highly influential and causal factor for 1-bp insertion repair.
Fig. 2 |. Sequence context influences 1-bp insertions.
a, 1-bp insertion frequencies (mean ± 95% C.I.) among 1,981 Lib-A target sites. b, Comparison of 1-bp insertion frequencies among Cas9-edited products from 1,996 Lib-A target sites. The box denotes the 25th, 50th, and 75th percentiles, whiskers show 1.5 times the interquartile range, and outliers are depicted as fliers. * P = 5.4×10−36; ** P = 8.6×10−70, two-sided t-test. c, DNA motif for 1-bp insertion frequency (Lib-A, mESCs, n = 1,996 target sites). d, Frequencies of 1-bp insertions among 205 target sites with varying −5 to −2 nucleotides (relative to the PAM at positions 0–2) in three low-microhomology contexts. See Extended Data Fig. 5 for full axis labels. e, Comparison of the 1-bp insertion frequency at sequences in (c) with varying positions −4 and −3. Box plot as in (b). *P = 0.03; **P = 2.98 × 10⁻⁷, two-sided t-test.
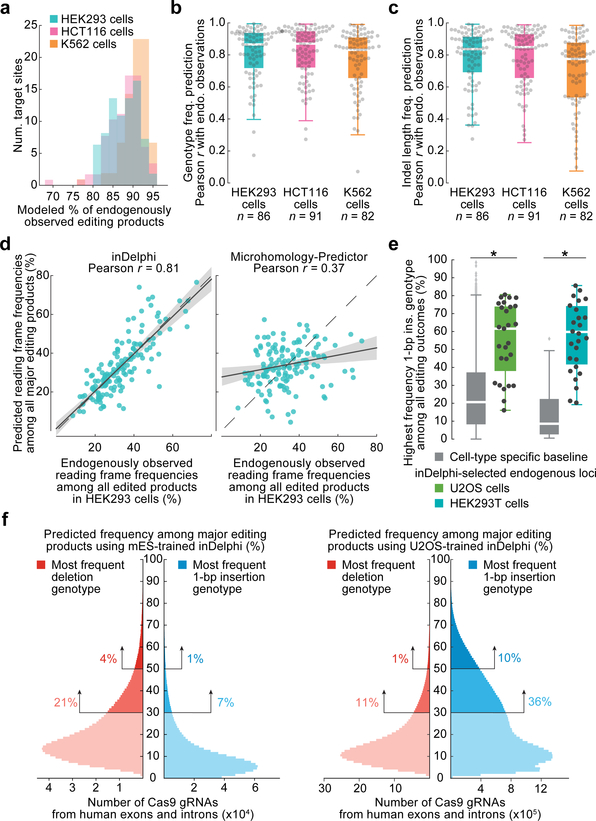
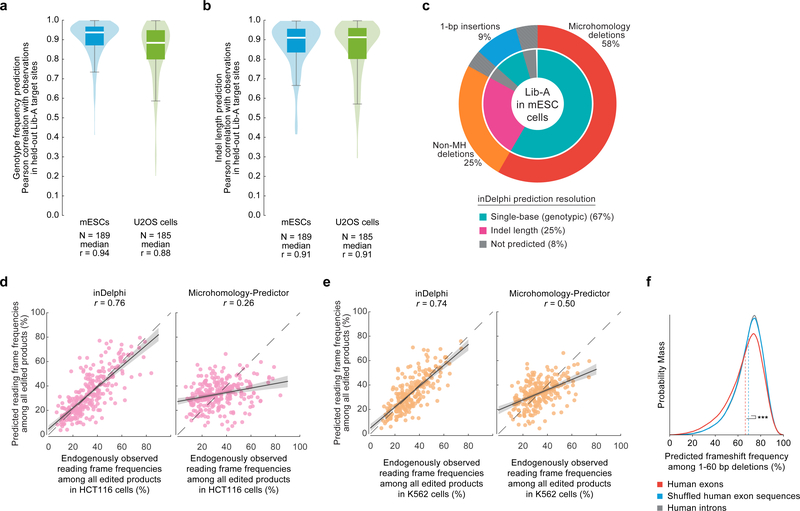
Based on these data, inDelphi models insertions and deletions as competitive processes in which microhomology strength and precision of deletions influence the relative frequency of 1-bp insertions, and local sequence context influences the relative frequency and genotypic outcomes of 1-bp insertions (Fig. 1e). inDelphi makes predictions within each module in a cell-type agnostic manner, only using cell-type specific data to predict the overall ratio of 1-bp insertions to deletions. Collectively across all three modules, inDelphi predicts the indel lengths of 80–95% of Cas9-mediated editing products and the genotypes of 65–80% of all products (Fig. 3a, Extended Data Fig. 4) from sequence context alone.
Fig. 3 |. inDelphi accurately predicts nearly all editing outcomes.
a, Fraction of endogenous editing products given predictions in HEK293 (n = 86 target sites), HCT116 (n = 91), and K562 cells (n = 82). b, c, Predictive performance on endogenously observed frequencies of genotypes (b) and indel lengths (c) in HEK293 (medians = 0.87 and 0.84), HCT116 (medians = 0.87 and 0.85), and K562 (medians = 0.83 and 0.79) cells. The box denotes the 25th, 50th, and 75th percentiles, and whiskers show 1.5 times the interquartile range. d, Comparison of predictions from two methods to observed frame frequencies (n = 86 target sites, HEK293 cells), regression estimate ± 95% C.I. e, 1-bp insertion frequencies among edited outcomes in U2OS and HEK293T cells (n = 27 and 26 observations, baseline n = 1,958 and 89 target sites, P = 4.2×10⁻⁸ and 8.1×10⁻¹² respectively), two-sided Welch’s t-test. f, Smoothed predicted distribution of the highest frequency indel among major editing outcomes (+1 to −60 indels) for SpCas9 gRNAs targeting the human genome.
inDelphi achieves high accuracy at predicting genotype frequencies (median r = 0.94) and indel length frequency distributions (median r = 0.91) in 189 held-out Lib-A target sites in mESCs (Extended Data Fig. 4), with similarly high accuracy in U2OS cells (median r = 0.88 and 0.91, Extended Data Fig. 4). On held-out endogenous data, inDelphi also strongly on the two tasks (median r = 0.87 and 0.84 across 87–90 target sites in K562, HCT116, and HEK293 cells, Fig. 3b–c). Taken together, these results establish that in data from five human and mouse cells, the relative frequencies of most Cas9 nuclease-mediated editing outcomes are highly predictable.
The ability of Cas9-mediated end-joining repair to induce frameshifts enables efficient gene knockout5. We reasoned that inDelphi’s accurate prediction of indel lengths when considering nearly all editing products would enable accurate prediction of Cas9-induced frameshifts. We simulated this task in data from 82–91 endogenous target sites by tabulating the observed frequency of indels resulting in +0, +1, and +2 reading frames. In HEK293 cells, the observed frequency of indels in each frame predicted by inDelphi (median r = 0.81) compare favorably to those generated by Microhomology Predictor (median r = 0.37), a previously published method18 (Fig. 3d), with similar results in HCT116 and K562 (Extended Data Fig. 4). Thus, we expect inDelphi to facilitate Cas9-mediated gene knockout approaches by allowing a priori selection of gRNAs that induce high or low knockout frequencies. We note that microhomology deletions in human exons have a significant tendency to remain in-frame compared to non-coding human DNA (Extended Data Fig. 4).
Highly precise template-free Cas9 editing
While end-joining repair is highly efficient at inducing mutations after Cas9 treatment, its propensity to induce a heterogeneous mixture of repair genotypes has limited applications for precision genome editing19. We used inDelphi to estimate the fraction of SpCas9 gRNAs targeting exons and introns in the human genome that support precise end-joining repair. Defining precision-X gRNAs as those predicted to produce a single genotypic outcome in ≥X% of all major editing outcomes proximal to the cleavage site, inDelphi predicts that 28% and 47% of gRNAs are precision-30, while 5% and 11% of gRNAs are precision-50, when trained on mESC and U2OS data respectively (Fig. 3f, Extended Data Table 1).
To test the accuracy of inDelphi’s predictions of precise repair in endogenous settings, we selected 14 SpCas9 gRNAs predicted to induce precision-40 1-bp insertions. We delivered SpCas9 with gRNAs and performed endogenous HTS in human U2OS and HEK293T cells. We observed that 10/14 predicted precision-40 1-bp insertion gRNAs induced a single 1-bp insertion genotype in ≥40% of edited products with an overall significantly higher precision (p < 4.2×10⁻⁸) than baseline data in HEK293T (median 55% vs. 25% baseline in VO target sites in HEK293) and U2OS cells (median 57% vs. 14% baseline in Lib-A, U2OS, Fig. 3e). We similarly validated 10 gRNAs for high-precision deletions with endogenous HTS in both cell types (Extended Data Table 2). Collectively, these observations establish inDelphi’s ability to identify, from sequence features alone, gRNAs inducing significantly more precise editing than the general population of gRNAs.
Efficient template-free correction of pathogenic alleles
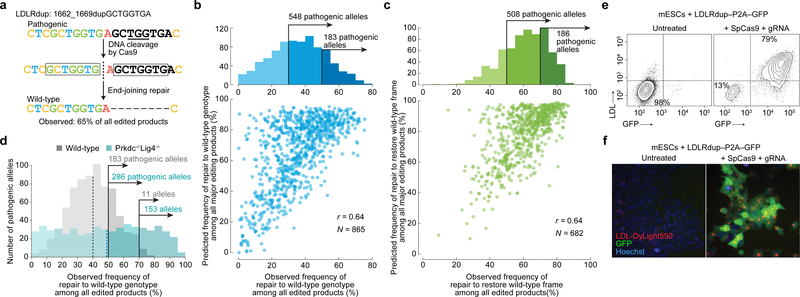
We used inDelphi to identify novel targets for therapeutic genome editing. Starting with 23,018 pathogenic short indels (ClinVar and HGMD databases9,10), we tasked inDelphi with identifying pathogenic alleles that are suitable for template-free Cas9-mediated editing to effect precise gain-of-function editing of the pathogenic genotype. We pursued two genetic disease allele categories that have not been previously identified as targets for Cas9-mediated repair: pathogenic frameshifts in which inDelphi predicts that 50–90% of Cas9-mediated deletion products will correct the reading frame (mean baseline frequency of 34% among disease-associated frameshift mutations) and pathogenic microduplication alleles in which a short sequence duplication leads to a frameshift or disrupts protein function and which inDelphi predicts can be repaired to wild-type genotype in a large fraction of Cas9 editing products (Fig. 4a).
Fig. 4 |. Precise template-free correction of pathogenic alleles.
a, Efficient correction of a pathogenic allele to wild-type. b, c, Comparison among pathogenic alleles of observed and predicted frequencies of repair to wild-type genotype (b) and frame (c). d, Wild-type repair frequencies of pathogenic alleles with predicted frequency ≥50% among all major editing outcomes, in mESCs. Dashes indicate means. e, f, For mESCs containing the LDLRdup1662_1669dupGCTGGTGA–P2A–GFP allele, flow cytometric contour plots (e) and fluorescence microscopy (f). Representative data for n = 2 independent biological replicates. Major editing outcomes include +1 to −60 indels.
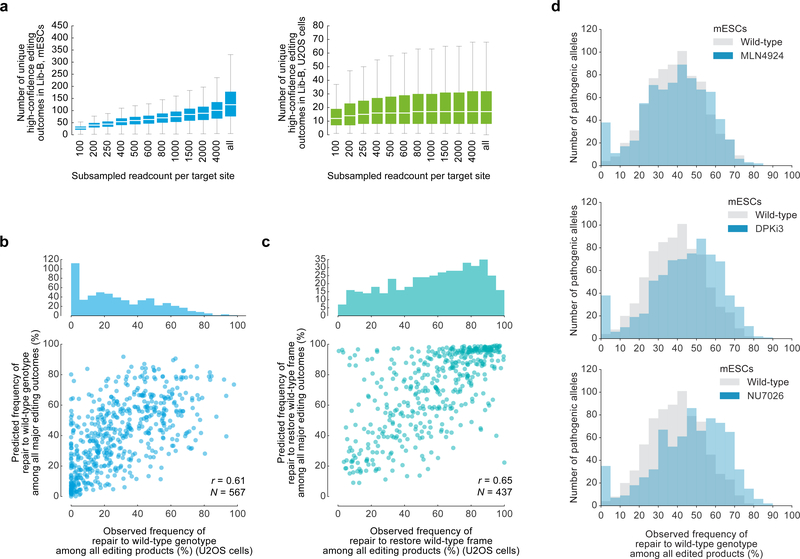
We selected 1,592 pathogenic human loci with high predicted rates of frame correction or microduplication correction to the wild-type sequence for inclusion in a second library (Lib-B). We observed that 183 human disease microduplication alleles included in Lib-B were repaired to wild-type in ≥50% of all products (Fig. 4b), and 508 pathogenic human frameshift alleles were corrected into proper reading frame in ≥50% of all products in mESCs (Fig. 4c), in agreement with inDelphi’s predictions (r = 0.64 and 0.64). We observed similar results in U2OS cells (r = 0.65 for frame correction, r = 0.61 for genotype correction to wild-type, Extended Data Fig. 5). While repair to the wild-type genotype unambiguously restores wild-type protein function, we note that frame correction that alters coding sequence requires case-by-case analysis to validate rescue of protein function.
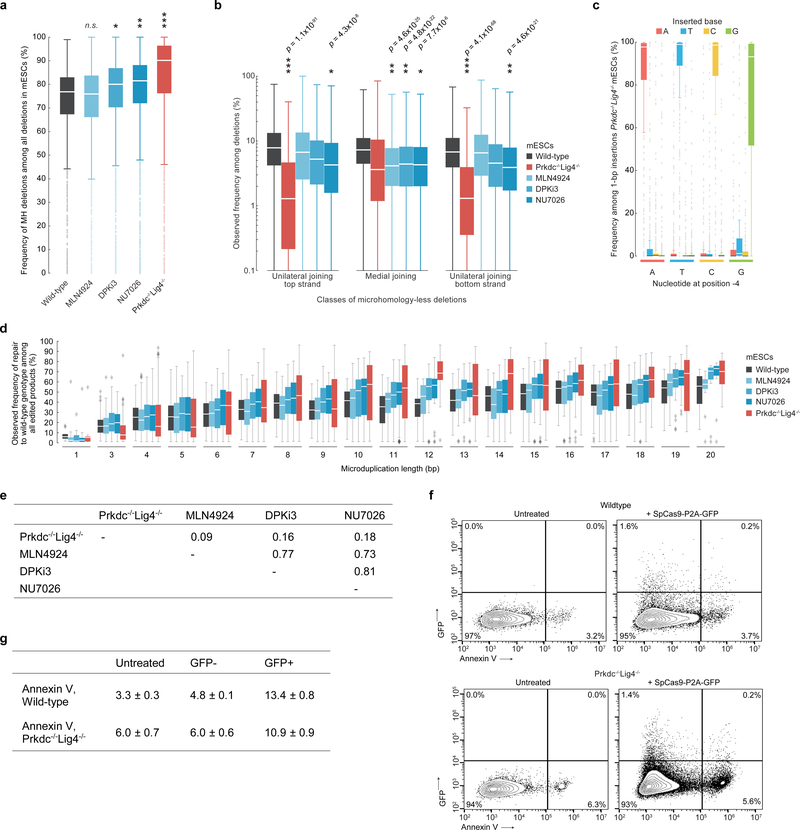
To determine if the efficiency of microduplication repair can be increased by manipulation of DNA repair pathways, we performed Cas9 cleavage of Lib-B in four NHEJ-deficient conditions20: Prkdc–/–Lig4–/– mESCs21, and mESCs treated separately with DNA-Protein Kinase Inhibitor III (DPKi3), NU7026, and MLN4924. In NHEJ-impaired cells, the fraction of deletion outcomes not involving MH significantly decreased (median 23% to 10% with Prkdc−/−Lig4−/−, p = 1.0×10−36, and 23% to 19% with DPKi3 and NU7041, p < 5.5×10⁻⁵) (Extended Data Fig. 6, Supplementary Discussion). In Prkdc–/–Lig4–/– mESCs, the increased propensity towards MH deletions enabled a subset of pathogenic alleles to be repaired to wild-type with strikingly high precision. Compared to wild-type mESCs where 183 pathogenic alleles corrected to wild-type in ≥50% of all edited products and 11 pathogenic alleles corrected to wild-type in ≥70% of all edited products, in Prkdc–/–Lig4–/– mESCs, 286 pathogenic alleles corrected to wild-type in ≥50% of all edited products and 153 pathogenic alleles corrected to wild-type in ≥70% of products (Fig. 4d, Supplementary Table 1) without increase in the rate of apoptosis (Extended Data Fig. 6). DPKi3 or NU7041 treatment also increased precise microduplication repair (Extended Data Fig. 5, 6). Taken together, impairing NHEJ can further increase the precision of wild-type correction for a large subset of pathogenic microduplications in genes such as PKD1 (corrected in 92% of edited Prkdc–/–Lig4–/– mESC alleles), MSH2 (88%), and LDLR (87%), supporting a model of competing end-joining repair mechanisms.
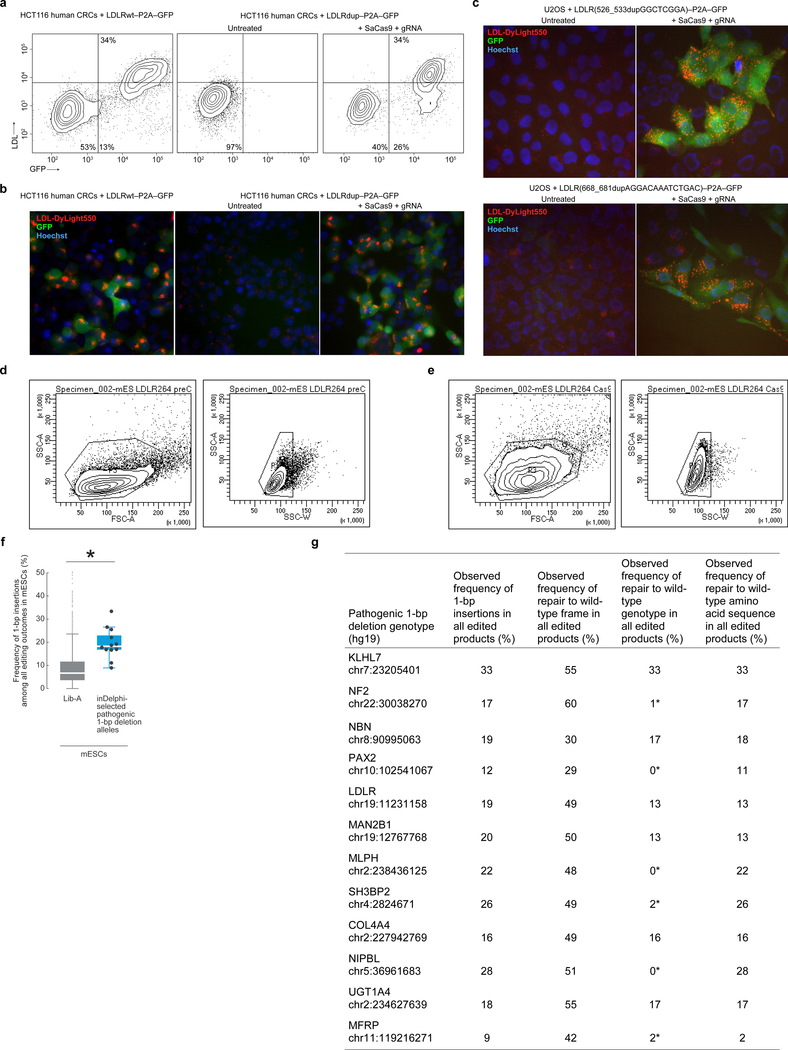
We further tested inDelphi’s prediction of highly efficient correction in a functional assay with pathogenic LDLR microduplication alleles which cause dominantly inherited familial hypercholesterolemia22. We separately introduced five pathogenic LDLR microduplication alleles within a full-length LDLR coding sequence upstream of a P2A-GFP cassette into the genome of human and mouse cells, such that Cas9-mediated repair to the wild-type LDLR sequence should induce phenotypic gain of LDL uptake and restore the reading frame of GFP. We then delivered Cas9 and a gRNA that is specific to each pathogenic allele and does not target the wild-type repaired sequence. We observed robust restoration of LDL uptake as well as restoration of GFP fluorescence in mESCs, U2OS cells, and HCT116 cells in up to 79% of cells following transfection with Cas9 and inDelphi gRNAs (Fig. 4e–f, Extended Data Fig. 7). HTS confirms efficient correction of these five LDLR microduplication alleles to wild-type in human and mouse cells as well as pathogenic microduplication alleles in the GAA, GLB1, and PORCN genes introduced to cells using the same method (Table 1, Extended Data Table 3). Importantly, in these experiments, we observed high-frequency LDLR phenotypic correction when cutting with either SpCas9 or Streptococcus aureus Cas9 (SaCas9)23 (Extended Data Table 3).
Finally, we used precise template-free Cas9-mediated MMEJ to endogenously correct pathogenic microduplication alleles endogenously in patient-derived fibroblasts for Hermansky-Pudlak syndrome (HPS1 gene), which causes blood clotting deficiency and albinism in patients and is particularly common in Puerto Ricans24, and Menkes disease (ATP7A gene), which results in copper deficiency. Simultaneous delivery of Cas9 and gRNA specific to the pathogenic microduplication allele induced high-efficiency correction to the wild-type sequence in HPS1 (mean frequency = 88% of edited alleles, n = 5 independent biological experiments) and ATP7A (frequency = 94% of edited alleles, n = 2). These findings suggest the potential of template-free, precise Cas9 nuclease-mediated repair of microduplication alleles to achieve efficient repair to the wild-type sequence for therapeutic gain-of-function genome editing.
Discussion
We used the Cas9-mediated end-joining repair products of thousands of target DNA loci integrated into mammalian cells to train a machine learning model, inDelphi, that accurately predicts the spectrum of cut-site proximal genotypic products resulting from double-strand break repair at a target DNA site of interest. The ability to predict Cas9-mediated products enables new precision genome editing research applications and facilitates existing applications, such as performing efficient bi-allelic gene knockout and predicting end-joining byproducts of HDR. We provide an online implementation of inDelphi to predict the spectrum of Cas9-mediated products along with predicted frameshift frequencies and precision at any target site (https://www.crisprindelphi.design).
The inDelphi model identifies target loci in which a substantial fraction of all repair products consists of a single genotype. Our findings suggest that 28–47% of SpCas9 gRNAs targeting the human genome yield a single indel genotype in ≥30% of all major repair products (precision-30), and 5–11% yield a single indel genotype in ≥50% of all major repair products (precision-50). We show experimentally that precision template-free Cas9-mediated editing can mediate efficient gain-of-function repair at hundreds of pathogenic alleles including microduplications (Fig. 4b, 4e–f) in cell lines and in patient-derived primary cells (Table 1). We note that each research or therapeutic Cas9-nuclease application may require a different level of precision depending on a variety of factors including risk/reward calculations of the gene and disease in question.
Moreover, we present evidence that suppressing NHEJ augments repair of pathogenic microduplication alleles, suggesting that temporary manipulation of DNA repair pathways could be combined with Cas9-mediated editing to favor specific editing genotypes with high precision. Genome editing currently lacks flexible strategies to correct indels in post-mitotic cells because of the limited efficiency of HDR in non-dividing cells19. As MMEJ is thought to occur throughout the cell cycle25, inDelphi may provide access to predictable and precise post-mitotic genome editing in a wider range of cell states. Incorporating the frequencies of long deletions and translocations26,27 into predictive models of Cas9 outcomes will be an important next step to calculate the overall precision of Cas9-nuclease editing. We anticipate that, given appropriate training data, inDelphi will also be able to accurately predict repair genotypes from other designer nucleases5. This work establishes that the prediction and judicious application of template-free Cas9 nuclease-mediated genome editing offers new capabilities for the study and potential treatment of genetic diseases.
Online Methods
Library cloning
Briefly and informally, the cloning process involves ordering a library of oligonucleotides pairing a gRNA protospacer with its 55-bp target site, centered on an NGG PAM. To insert the gRNA hairpin between the gRNA protospacer and the target site, the library undergoes an intermediate Gibson Assembly circularization step, restriction enzyme linearization, and Gibson Assembly into a plasmid backbone containing a U6-promoter to facilitate gRNA expression, a hygromycin resistance cassette, and flanking Tol2 transposon sites to facilitate integration into the genome.
Specified pools of 2000 oligos were synthesized by Twist Bioscience and amplified with NEBNext polymerase (New England Biolabs) using primers OligoLib_Fw and OligoLib_Rv (see below), to extend the sequences with overhangs complementary to the donor template used for circular assembly. To avoid over-amplification in the library cloning process, we first performed qPCR by addition of SybrGreen Dye (Thermo Fisher) to determine the number of cycles required to complete the exponential phase of amplification. We ran the PCR reaction for half of the determined number of cycles at this stage. Extension time for all PCR reactions was extended to 1 minute per cycle to prevent skewing towards GC-rich sequences. The 246-bp fragment was purified using a PCR purification kit (Qiagen).
Separately, the donor template for circular assembly was amplified with NEBNext polymerase (New England Biolabs) for 20 cycles from an SpCas9 sgRNA expression plasmid (Addgene 71485)21 using primers CircDonor_Fw and CircDonor_Rv (see below) to amplify the sgRNA hairpin and terminator, and extended further with a linker region meant to separate the gRNA expression cassette from the target site in the final library. The 146-bp amplicon was gel-purified (Qiagen) from a 2.5% agarose gel.
The amplified synthetic library and donor templates were ligated by Gibson Assembly (New England Biolabs) in a 1:3 molar ratio for 1 hour at 50°C, and unligated fragments were digested with Plasmid Safe ATP-Dependent DNase (Lucigen) for 1 hour at 37°C. Assembled circularized sequences were purified using a PCR purification kit (Qiagen), linearized by digestion with SspI for ≥3 hours at 37°C, and the 237-bp product was gel purified (Qiagen) from a 2.5% agarose gel.
The linearized fragment was further amplified with NEBNext polymerase (New England Biolabs) using primers PlasmidIns_Fw and PlasmidIns_Rv (see below) for the addition of overhangs complementary to the 5’- and 3’-regions of a Tol2-transposon containing gRNA expression plasmid (Addgene 71485)21 previously digested with BbsI and XbaI (New England Biolabs), to facilitate gRNA expression and integration of the library into the genome of mammalian cells. To avoid over-amplification, we performed qPCR by addition of SybrGreen Dye (Thermo Fisher) to determine the number of cycles required to complete the exponential phase of amplification, and then ran the PCR reaction for the determined number of cycles. The 375-bp amplicon was gel-purified (Qiagen) from a 2.5% agarose gel.
The 375-bp amplicon and double-digested Tol2-transposon containing gRNA expression plasmid were ligated by Gibson Assembly (New England Biolabs) in a 3:1 ratio for 1 hour at 50°C. Assembled plasmids were purified by isopropanol precipitation with GlycoBlue Coprecipitant (Thermo Fisher) and reconstituted in milliQ water and transformed into NEB10beta (New England Biolabs) electrocompetent cells. Following recovery, a small dilution series was plated to assess transformation efficiency and the remainder was grown in liquid culture in DRM medium overnight at 37°C. A detailed step-by-step library cloning protocol is provided in the Supplementary Methods.
The plasmid library was isolated by Midiprep plasmid purification (Qiagen). Library integrity was verified by restriction digest with SapI (New England Biolabs) for 1 hour at 37°C, and sequence diversity was validated by high-throughput sequencing (HTS) as described below.
Library cloning primersOligoLib_Fw: TTTTTGTTTTCTGTGTTCCGTTGTCCGTGCTGTAACGAAAGGATGGGTGCGACGCGTCATOligoLib_Rv: GTTGATAACGGACTAGCCTTATTTAAACTTGCTATGCTGTTTCCAGCATAGCTCTTAAACCircDonor_Fw: GTTTAAGAGCTATGCTGGAAACAGCCircDonor_Rv: ATGACGCGTCGCACCCATCCTTTCGTTACAGCACGGACAACGGAACACAGAAAACAAAAAAGCACCGACTCPlasmidIns_Fw: GTAACTTGAAAGTATTTCGATTTCTTGGCTTTATATATCTTGTGGAAAGGACGAAACACCPlasmidIns_Rv: TTGTGGTTTGTCCAAACTCATCAATGTATCTTATCATGTCTGCTCGAAGCGGCCGTACCTCTAGATTCAGACGTGTGCTCTTCCGATCT
Cloning
A base plasmid was constructed starting from a Tol2-transposon containing plasmid (Addgene 71485)21. The sequence between Tol2 sites was replaced with a CAGGS promoter, multi-cloning site, P2A peptide sequence followed by eGFP sequence, and Puromycin resistance cassette to produce p2T-CAG-MCS-P2A-GFP-PuroR. The full sequence of this plasmid is appended in the Sequences section of the Supplementary Methods, and this plasmid has been submitted to Addgene. Plasmids with this backbone and containing wild-type and micro-duplication mutation versions of LDLR and three other genes, GAA, GLB1, and PORCN, were constructed. Information on cloning these genes is provided below, and the gene sequences are appended in the Supplementary Methods.
LDLR: To generate p2T-CAGGS-LDLRwt-P2A-GFP-PuroR, LDLR (NCBI Gene ID #3949, transcript variant 1 CDS) was PCR amplified from a base plasmid ordered from the Harvard PlasmID resource core and cloned between the BamHI and NheI sites of the base plasmid.
The following mutants were generated through InFusion (Clontech) cloning. Sequences are provided below, and our internal allele nomenclature is in parentheses:
LDLR:c.526_533dupGGCTCGGA (LDLRdup252)LDLR:c.668_681dupAGGACAAATCTGAC (LDLRdup254/255)LDLR:c.669_680dupGGACAAATCTGA (LDLRdup258)LDLR:c.672_683dupCAAATCTGACGA (LDLRdup261)LDLR:c.1662_1669dupGCTGGTGA (LDLRdup264)
PORCN: NCBI Gene ID #64840, transcript variant C CDS was PCR amplified from HCT116 cDNA and cloned between the BamHI and NheI sites of the base plasmid. PORCN:c.1059_1071dupCCTGGCTTTTATC (PORCNdup20) was generated through InFusion cloning.
GLB1: NCBI Gene ID #2720, transcript variant 1 CDS was PCR amplified from HCT116 cDNA and cloned between the BamHI and NheI sites of the base plasmid. GLB1:c.1456_1466dupGGTGCATATAT (GLB1dup84) was generated through InFusion cloning.
GAA: NCBI Gene ID #2548, transcript variant 1 CDS was PCR amplified from a base plasmid ordered from the Harvard PlasmID resource core and cloned between the BamHI and NheI sites of the base plasmid. GAA:c.2704_2716dupCAGAAGGTGACTG (GAAdup327/328) was generated through InFusion cloning.
SpCas91: CDS was amplified from p2T-CAG-SpCas9-BlastR and cloned between the BamHI and NheI sites of the base plasmid by Gibson Assembly.
SpCas91 and KKH SaCas928 were constructed starting from a Tol2-transposon containing plasmid (Addgene 71485)21. The sequence between Tol2 sites was replaced with a CAGGS promoter, Cas9 sequence, and blasticidin resistance cassette to produce p2T-CAG-SpCas9-BlastR and p2T-CAG-KKHSaCas9-BlastR. These plasmids have been submitted to Addgene.
SpCas9 guide RNAs were cloned as a pool into a Tol2-transposon containing gRNA expression plasmid (Addgene 71485)21 using BbsI plasmid digest and Gibson Assembly (NEB). SaCas9 guide RNAs were cloned into a similar Tol2-transposon containing SaCas9 gRNA expression plasmid (p2T-U6-sgsaCas2xBbsI-HygR) which has been submitted to Addgene using BbsI plasmid digest and Gibson Assembly. Protospacer sequences used are listed below, using our internal nomenclature which matches the duplication alleles.
LDLR gRNAs
sgsaLDLRdup252: GCTGCGAAGATGGCTCGGAGGC
sgsaLDLRdup254: GTGCAAGGACAAATCTGACAGG
sgsaLDLRdup255: GTTCCTCGTCAGATTTGTCCTG
sgsaLDLRdup258: GACTGCAAGGACAAATCTGAGG
sgsaLDLRdup261: GTTTTCCTCGTCAGATTTGTCG
sgspLDLRdup264: GACATCTACTCGCTGGTGAGC
PORCN gRNAs
sgspPORCNdup20: GCTGTCCCTGGCTTTTATCCC
GLB1 gRNAs
sgspGLB1dup84: GTGTGAACTATGGTGCATATA
GAA gRNAs
sgsaGAAdup327: GCAGCTGCAGAAGGTGACTGCA
sgspGAAdup328: GCTGCAGAAGGTGACTGCAGA
Cell culture
Mouse embryonic stem cell lines used have been described previously and were cultured as described previously29. HEK293T, HCT116, and U2OS cells were purchased from ATCC and cultured as recommended by ATCC. The following cell lines were obtained and cultured as recommended from the NIGMS Human Genetic Cell Repository at the Coriell Institute for Medical Research: GM14609 Hermansky-Pudlak Syndrome 1 (HPS1) fibroblasts, and GM13672 Menkes Syndrome fibroblasts. Cell lines were authenticated by the suppliers and tested negative for mycoplasma.
For stable Tol2 transposon plasmid integration, cells were transfected using Lipofectamine 3000 (Thermo Fisher) following standard protocols with equimolar amounts of Tol2 transposase plasmid15 (a gift from Koichi Kawakami) and transposon-containing plasmid. For library applications, 15-cm plates with >107 initial cells were used, and for single gRNA targeting, 6-well plates with >106 initial cells were used. To generate lines with stable Tol2-mediated genomic integration, selection with the appropriate selection agent at an empirically defined concentration (blasticidin, hygromycin, or puromycin) was performed starting 24 hours after transection and continuing for >1 week. In cases where sequential plasmid integration was performed such as integrating gRNA/target library and then Cas9 or micro-duplication plasmid and then Cas9 plus gRNA, the same Lipofectamine 3000 transfection protocol with Tol2 transposase plasmid was performed each time, and >1 week of appropriate drug selection was performed after each transfection.
For spCas9 targeting experiments, cells were transduced with a single lentivirus containing an spCas9 and sgRNA expression cassette to target spCas9 cleavage to either the HPS1:c.1472_1487dup16 or ATP7A:c.6913_6917dupCTTAT microduplication locus for use in HPS1 and Menkes Syndrome fibroblasts, respectively. The lentiviral plasmids were obtained from (LV01, Sigma-Aldrich) and lentivirus was produced by the Boston Children’s Hospital Viral Core. Fibroblasts were plated in 12 well plates at 12.5k cells/cm2 one day prior to transduction. Cells were treated with 10 – 20μl of virus in the presence of 8μg/ml Polybrene (Sigma-Aldrich) on two consecutive days and harvested on day 10 post transduction.
Apoptosis analysis
Wildtype and Prkdc−/−Lig4−/− mESCs with stable integrated Lib-A were transfected with p2T-CAG-SpCas9-P2A-GFP-PuroR using Lipofectamine 3000 following standard protocols in 6-well plates with 106 cells. After 24 hours cells were stained with Annexin V Alexa Fluor 568 conjugate (Thermo Fisher) according to manufacturer’s protocols. Fluorescence was detected on a Cytoflex LX (Beckman Coulter) and analyzed using FlowJo (FlowJo LLC).
Deep sequencing
Genomic DNA was collected from cells after >1 week of selection. For library samples, 16 μg gDNA was used for each sample; for individual locus samples, 2 μg gDNA was used; for plasmid library verification, 0.5 μg purified plasmid DNA was used.
For individual locus samples, the locus surrounding CRISPR/Cas9 mutation was PCR amplified in two steps using primers >50-bp from the Cas9 target site. PCR1 was performed using the primers specified below. PCR2 was performed to add full-length Illumina sequencing adapters using the NEBNext Index Primer Sets 1 and 2 (NEB) or internally ordered primers with equivalent sequences. All PCRs were performed using NEBNext polymerase (New England Bioscience). Extension time for all PCR reactions was extended to 1min per cycle to prevent skewing towards GC-rich sequences. The pooled samples were sequenced using NextSeq (Illumina) at the Harvard Medical School Biopolymers Facility, the MIT BioMicro Center, or the Broad Institute Sequencing Facility.
Library prep primers:
For LDLRDup252, 254, 255, 258, 261:
120417_LDLRDup254_r1seq_A: CTTTCCCTACACGACGCTCTTCCGATCTNNNACTCCAGCTGGCGCTGTGAT120417_LDLR254_r2seq_A: GGAGTTCAGACGTGTGCTCTTCCGATCTCAACTTCATCGCTCATGTCCTTG
For LDLRDup264:
120817_LDLR264_r1seq_B: CTTTCCCTACACGACGCTCTTCCGATCTNNNAACTCCCGCCAAGATCAAGAAAG120817_LDLR264_r2seq_B: GGAGTTCAGACGTGTGCTCTTCCGATCTCAGCCTCTTTTCATCCTCCAAGA
For PORCDup20:
120517_PORCN20_r1seq: CTTTCCCTACACGACGCTCTTCCGATCTNNNCCTCCTACATGGCTTCAGTTTCC120517_PORCN20_r2seq: GGAGTTCAGACGTGTGCTCTTCCGATCTCCAGAGCTCCAAAGAGCAAGTTT
For GLB1Dup84:
120517_GLB184_r1seq: CTTTCCCTACACGACGCTCTTCCGATCTNNNAGCCACTCTGGACCTTCTGGTA 120517_GLB184_r2seq: GGAGTTCAGACGTGTGCTCTTCCGATCTCCAGTCCGTGAGGATATTGGAAC
For GAADup327/328:
120517_GAA327_r1seq: CTTTCCCTACACGACGCTCTTCCGATCTNNNGATCGTGAATGAGCTGGTACGTG120517_GAA327_r2seq: GGAGTTCAGACGTGTGCTCTTCCGATCTAACAGCGAGACACAGATGTCCAG
General HTS data analysis and computational modeling
A detailed and thorough description of methods used for data analysis and computational modeling is available in the Supplementary Methods.
Statistical analysis and reproducibility
Python 2.7 and 3.6 were used to analyze data and perform statistical tests using the SciPy library. Data are represented as mean ± s.e.m. with 95% confidence intervals. In box plots, box segments show median, 25th and 75th percentiles, whiskers above and below show 1.5 times the interquartile range. Higher and lower points (outliers) are plotted individually or not plotted. Comparison of means of two independent groups was performed using two-sided two-sample t-tests, where validity of the normal assumption was analyzed using the Shapiro-Wilk tests for small data (n < 50 samples) and/or using the Kolmogorov-Smirnov test on larger data (n > 50) directly, and/or using the Kolmogorov-Smirnov test on bootstrapped means (n = 1000 bootstrapped samples). In all significance tests performed in the study, the data satisfied our normality criteria for t-tests. For comparison of two independent groups, two-sided two-sample t-tests were used for normally distributed data with equal or similar variance (Student’s t-test) or unequal and dissimilar variance (Welch’s t-test). A critical value for significance of P < 0.05 was used throughout the study.
Here, we report detailed statistical parameters (P value, name of statistical test, test statistic value, degrees of freedom, effect size) for all significance tests performed in the study.
Fig. 2b, Comparison of 1-bp insertion frequencies among Cas9-edited products from 1,996 Lib-A target sites. * P = 5.4×10−36; ** P = 8.6×10−70, two-sided two-sample t-test, statistic = −13.0 and −18.4, degrees of freedom (DoF) = 777 and 1,994; Hedges’ g = 0.94 and 0.85, for * and ** respectively.
Fig. 2e, Comparison of the 1-bp insertion frequency at sequences in (c) with varying positions −4 and −3. Box plot as in (b). *P = 0.03; **P = 2.98 × 10⁻⁷, two-sided two-sample t-test, statistic = −2.2 and −6.5, DoF = 185 and 32, Hedges’ g = 0.58 and 2.3, for * and ** respectively.
Fig. 3e, Comparison of 1-bp insertion frequencies among edited outcomes in U2OS (n = 27 observations, baseline n = 1,958 target sites, P = 4.2×10⁻⁸, two-sided Welch’s t-test, test statistic = 7.56, degrees of freedom = 27.78, Hedges’ g = 1.47) and HEK293T cells (n = 26 observations vs. baseline n = 89 target sites, P = 8.1×10⁻¹², two-sided Welch’s t-test, test statistic = 10.40, degrees of freedom = 34.14, Hedges’ g = 2.89).
Extended Data Fig. 3g, Box plots displaying total deletion phi score and 1-bp insertion frequencies in mESCs for 312 ‘4bp’ target sites and 89 VO sequences. * P = 6.1×10⁻⁹; two-sided two-sample t-test, test statistic = −5.94, degrees of freedom = 399, Hedges’ g effect size = 0.49.
Extended Data Fig. 4f, Distribution of predicted frameshift frequencies among 1–60-bp deletions for SpCas9 gRNAs targeting exons (n = 1,000,294 gRNAs, mean = 66.4%) and shuffled versions (mean = 69.3%), and introns (n = 740,759) in the human genome. Dashed lines indicate means. *** P < 10−300, two-sided Welch’s t-test, test statistic = −145.5, DoF = 1,506,304, Hedges’ g = −0.19.
Extended Data Fig. 6a, Comparison of microhomology deletions among all deletions at Lib-B target sites in wild-type (n = 1,909 target sites), DPKi3 (n = 1,999), MLN4924 (n = 1,995), NU7026 (n = 1,999), and Prkdc−/−Lig4−/− (n = 1,446). Statistical tests performed against wild-type population, Welch’s two-sided two-sample t-test. * P = 5.6×10⁻⁵, test statistic = 4.0, DoF = 3,870.8, Hedges’ g effect size = −0.13. ** P = 3.5×10⁻¹³, test statistic = 7.3, DoF = 3,890.8, Hedges’ g effect size = −0.23. *** P = 5.0×10−41, test statistic = 13.6, DoF = 2,651.6, Hedges’ g effect size = −0.46.
Extended Data Fig. 6b, Comparison of the frequency of each class of microhomology-less deletions among all deletion products in wild-type (Lib-A and Lib-B target sites, n = 3,829 target sites), DPKi3 (Lib-B, n = 1,990), MLN4924 (Lib-B, n = 1,980), NU7026 (Lib-B, n = 1,992), and Prkdc−/−Lig4−/− (Lib-A and Lib-B target sites, n = 3,344). P values compare to wild-type, two-sided Welch’s t-test. Comparing among unilateral top strand joining, wild-type vs. Prkdc−/−Lig4−/− (P = 1.1×10−91, test statistic = 20.65, DoF = 6223.97, Hedges’ g = 0.50), vs. NU7026 (P = 4.3×10⁻⁸, test statistic = 5.50, DoF = 2,798.38, Hedges’ g = 0.18). Comparing among unilateral bottom strand joining, wild-type vs. Prkdc−/−Lig4−/− (P = 4.1×10−68, test statistic = 17.65, DoF = 6,479.88, Hedges’ g = 0.42), vs. NU7026 (P = 7.7×10⁻⁶, test statistic = 4.48, DoF = 2,868.90, Hedges’ g = 0.50). Comparing among medial joining, wild-type vs. MLN4924 (P = 4.6×10⁻²⁵, test statistic = 10.43, DoF = 3,240.16, Hedges’ g = 0.31), vs. DPKi3 (P = 4.8×10⁻²², test statistic = 9.72, DoF = 3,231.41, Hedges’ g = 0.29), vs. NU7026 (P = 4.6×10⁻²¹, test statistic = 9.49, DoF = 3,130.82, Hedges’ g = 0.29).
Extended Data Fig. 7f, Box plot comparing observed 1-bp insertion frequency in Lib-A and 12 pathogenic alleles selected by inDelphi in mESCs (combined data from n = 2 independent biological replicates). The box denotes the 25th, 50th, and 75th percentiles, whiskers show 1.5 times the interquartile range, and outliers are depicted as fliers. * P = 1.6×10⁻⁴, Welch’s two-sided two-sample t-test, test statistic = 5.56, degrees of freedom = 11.18, Hedges’ g effect size = 1.47.
Extended Data
Extended Data Figure 1: Design and cloning of a high-throughput library to assess CRISPR-Cas9-mediated editing products, yielding diverse and replicate-consistent data that is concordant with repair spectra at endogenous human genomic loci.
a, Empirical distributions of various predicted and measured properties of DNA from 169,279 SpCas9 gRNA target sites in the human genome. Number of target sites per range used to design Lib-A are indicated. b, Cumulative percentage of endogenous deletions in VO target sites in HEK293 (n = 89 target sites), HCT116 (n = 92), and K562 (n = 86) that delete up to the reported number of nucleotides (X-axis). c, Schematic of the cloning process used to clone Lib-A and Lib-B (Methods, Supplementary Discussion, Supplementary Methods). d, Number of unique high-confidence editing outcomes (Supplementary Methods) called by simulating data subsampling in data in Lib-A (n = 2000 target sites) in mESCs (combined data from n = 3 independent biological replicates) and U2OS cells (combined data from n = 2 independent biological replicates). For “all”, the original non-subsampled data is presented. Each box depicts data for 2,000 target sites. Outliers not depicted. e, Pearson r of genotype frequencies comparing Lib-A in mESCs and U2OS cells with endogenous data in HEK293 (n = 87 target sites), HCT116 (n = 88), and K562 (n = 86). Outliers are depicted as fliers. 1-bp insertion frequency adjustment was performed at each target site by proportionally scaling them to be equal between two cell types. f, Pearson r of genotype frequencies at Lib-A target sites comparing two independent biological replicate experiments in mESCs (n = 1,861 target sites, median r = 0.89) and U2OS cells (n = 1,921, median r = 0.77). Outliers are depicted as fliers. Box plots denote the 25th, 50th, and 75th percentiles and whiskers show 1.5 times the interquartile range.
Extended Data Figure 2: Categorizing and modeling Cas9-mediated DNA repair products with manual data-analysis and automated machine learning through inDelphi.
a, b, Categories of Cas9-mediated genotypic outcomes in data from endogenous contexts at VO target sites in K562 (n = 88 target sites), HCT116 (n = 92), HEK293 (n = 89) (collectively, a) and U2OS cells (b, n = 1,958 Lib-A target sites). c, Categories and defined properties (Supplementary Methods) of all sequence alignments consistent with a Cas9-mediated 7-bp deletion. d, Hypothesized mechanisms for template-free DNA repair at Cas9-mediated DSBs based on c-NHEJ and alt-EJ/MMEJ components (Supplementary Discussion). e, Function learned for modeling MH deletions (Supplementary Methods). f, Function learned for modeling MH-independent deletions (MHless-NN) mapping deletion length to a numeric score (psi, Supplementary Methods, point plot) and with deletion length penalty normalized to sum to 1 (phi, Supplementary Methods, histogram).
Extended Data Figure 3: Influential role of hyperlocal sequence context features in predicting and causing 1-bp insertions.
a, Frequency of 1-bp insertions in mESCs (n = 1,981 Lib-A target sites) and U2OS cells (n = 1,918) with varying −4 nucleotides. b, c, Plot of 1-bp insertion frequency in mESCs (n = 1,996 Lib-A target sites) and U2OS cells (n = 1,966) compared to their total phi score (b) and predicted deletion length precision score (c) with Pearson r. d, Comparison of 1-bp insertion frequencies among all edited products from 1,966 Lib-A target sites in U2OS cells (combined data from n = 2 independent biological replicates). e, Nucleotides and their impact on the frequency of 1-bp insertions in U2OS cells. Only bases with non-zero linear regression weights in 10,000-fold iterative cross-validation are shown. Total n = 1,966 Lib-A target sites. f, Insertion frequency in mESCs (n = 205) and U2OS cells (n = 217) when varying four bases by the cleavage site (positions −5 to −2 counted from the NGG-PAM at positions 0–2) contained within three target sites designed with weak microhomology. g, Microhomology strength (deletion phi score) and 1-bp insertions in mESCs for 312 ‘4bp’ target sites and 89 VO sequences. * P = 6.1×10⁻⁹; two-sided two-sample t-test, test statistic = −5.94, degrees of freedom = 399, Hedges’ g effect size = 0.49. Box plots denote the 25th, 50th and 75th percentiles, whiskers show 1.5 times the interquartile range, and outliers are depicted as fliers.
Extended Data Figure 4: inDelphi predictions represent nearly all editing outcomes and are accurate at predicting the frequencies of genotypes, indel lengths, and frameshift frequencies.
a, b, Pearson r for held-out Lib-A target sites comparing inDelphi predictions with observed frequencies for genotypes (a) and indel lengths (b) in mESCs and U2OS cells. The box denotes the 25th, 50th and 75th percentiles, whiskers show 1.5 times the interquartile range. Densities were smoothed with noise but do not extend beyond the data. c, Pie chart depicting the output of Delphi for specific outcome classes at Lib-A target sites in mESCs. d, e, Comparison of two methods for frameshift predictions to observed values with Pearson r in HCT116 cells (d, n = 91 target sites) and K562 cells (e, n = 82 target sites). The error band represents the 95% C.I. around the regression estimate with 1,000-fold bootstrapping. f, Distribution of predicted frameshift frequencies among 1–60-bp deletions for SpCas9 gRNAs targeting exons (n = 1,000,294 gRNAs, mean = 66.4%) and shuffled versions (mean = 69.3%), and introns (n = 740,759) in the human genome. Dashed lines indicate means. *** P < 10−300, two-sided Welch’s t-test, test statistic = −145.5, DoF = 1,506,304, Hedges’ g = −0.19.
Extended Data Figure 5: Characterization of Lib-B data including pathogenic microduplication repair in wild-type mESCs, wild-type U2OS cells, and mESCs treated with DPKi3, NU7026, and MLN4924.
a, Box plots of the number of unique high-confidence editing outcomes (see Supplementary Methods) called by simulating data subsampling in data at 2,000 Lib-B target sites in mESCs (combined data from n = 2 independent technical replicates) and U2OS cells (combined data from n = 2 independent biological replicates). In “all”, the full non-subsampled data is presented (see Supplementary Table 2 for read counts). Each box depicts data for 2,000 target sites. The box denotes the 25th, 50th, and 75th percentiles and whiskers show 1.5 times the interquartile range. Outliers are not depicted. b, Frequencies of repair to wild-type genotype at 567 ClinVar pathogenic alleles vs. predicted frequencies in Lib-B in human U2OS cells with Pearson r. c, Frequencies of repair to wild-type frame at 437 ClinVar pathogenic alleles vs. predicted frequencies in Lib-B in human U2OS cells with Pearson r. d, Frequency of pathogenic microduplication repair in wild-type mESCs (n = 1,480 target sites) compared to mESCs treated with MLN4924 (n = 1,569), NU7041 (n = 1,561), and DPKi3 (n = 1,563).
Extended Data Figure 6: Altered distributions of Cas9-mediated genotypic products in Prkdc−/−Lig4−/− mESCs and mESCs treated with DPKi3, NU7026, and MLN4924 as compared to wild-type mESCs.
a, Comparison of MH deletions among all deletions at Lib-B target sites in wild-type (n = 1,909 target sites), DPKi3 (n = 1,999), MLN4924 (n = 1,995), NU7026 (n = 1,999), and Prkdc−/−Lig4−/− (n = 1,446). Statistical tests performed against wild-type population. * P = 5.6×10⁻⁵, ** P = 3.5×10⁻¹³, *** P = 5.0×10−41, two-sided Welch’s t-test. b, Comparison of the frequency of each class of MH-less deletions among all deletion products in wild-type (Lib-A and Lib-B target sites, n = 3,829 target sites), DPKi3 (Lib-B, n = 1,990), MLN4924 (Lib-B, n = 1,980), NU7026 (Lib-B, n = 1,992), and Prkdc−/−Lig4−/− (Lib-A and Lib-B target sites, n = 3,344). P values compare to wild-type, two-sided Welch’s t-test. c, Frequency of 1-bp insertions at 1,055 target sites in Lib-A in Prkdc−/−Lig4−/− mESCs. d, Frequencies of deletion repair to wild-type genotype in Lib-B in wild-type mESCs (n = 1,480 target sites, combined data from 2 technical replicates) compared to conditions, with combined data from 2 independent biological replicates for each of Prkdc−/−Lig4−/− (n = 1,041 target sites), MLN4924 (n = 1,569), NU7026 (n = 1,561), and DPKi3 (n = 1,563). e, Table of Pearson r of the change in disease correction frequency compared to wild-type at n = 791 target sites for each pair of conditions. f, g, Annexin V-568 staining flow cytometry contour plots (f) and mean ± s.d. values (g) in wildtype and Prkdc−/−Lig4−/− Lib-A mESCs following transfection with SpCas9-P2A-GFP (representative data for n = 2 experiments). Box plots denote the 25th, 50th, and 75th percentiles, whiskers show 1.5 times the interquartile range, and outliers are depicted as fliers. For detailed statistics on significance tests, see online methods.
Extended Data Figure 7: Template-free Cas9-nuclease editing of human and mouse cells containing pathogenic alleles.
a, b, Flow cytometric contour plots showing GFP fluorescence and LDL-Dylight550 uptake in, (a) and fluorescence microscopy of, HCT116 cells containing the denoted LDLR alleles and treated with SaCas9 and gRNA when denoted (representative data for n = 2 experiments). c, Fluorescence microscopy of U2OS cells containing the denoted LDLR alleles and treated with SaCas9 and gRNA when denoted. (representative data for n = 2 experiments). d, e, Flow cytometry gating strategy used for mESC + LDLRdup–P2A–GFP untreated (d) and treated with SpCas9 + gRNA (e). f, g, Results of 12 pathogenic 1-bp deletion alleles selected by inDelphi for high 1-bp insertion frequency (combined data from n = 2 independent biological replicates) compared to Lib-A (f) and presented in a table (g). The box denotes the 25th, 50th, and 75th percentiles, whiskers show 1.5 times the interquartile range, and outliers are depicted as fliers. * P = 1.6×10⁻⁴, two-sided Welch’s t-test. For detailed statistics, see online methods. In the table, * indicates the most frequent 1-bp insertion genotype predicted by inDelphi does not correspond to the wild-type genotype. In fluorescence microscopy plots, GFP fluorescence is shown in green, LDL-Dylight550 uptake in red, and Hoechst staining nuclei in blue.
Extended Data Table 1:
Frequency of gRNAs in the human genome with denoted Cas9-mediated outcome precision.
| inDelphi trained on Lib-A data from mESCs for 1-bp ins. module |
inDelphi trained on Lib-A data from U2OS cells for 1-bp ins. module |
|||||
|---|---|---|---|---|---|---|
| Precision-X threshold (%) | Precise product is a deletion (% of gRNAs) | Precise product is a 1-bp insertion (% of gRNAs) | Total % of gRNAs that are precise-X | Precise product is a deletion (% of gRNAs) | Precise product is a 1-bp insertion (% of gRNAs) | Total % of gRNAs that are precise-X |
| 10 | 82 | 38 | 93 | 70 | 78 | 97 |
| 15 | 61 | 23 | 75 | 44 | 64 | 87 |
| 20 | 43 | 15 | 55 | 27 | 53 | 72 |
| 25 | 30 | 10 | 39 | 17 | 44 | 58 |
| 30 | 21 | 6.6 | 28 | 11 | 36 | 46 |
| 35 | 15 | 4.4 | 19 | 6.9 | 28 | 34 |
| 40 | 10 | 2.9 | 13 | 4.1 | 21 | 25 |
| 45 | 6.5 | 1.9 | 8.4 | 2.4 | 15 | 18 |
| 50 | 4.3 | 1.3 | 5.6 | 1.4 | 10 | 12 |
| 55 | 2.8 | 0.8 | 3.6 | 0.8 | 6.7 | 7.5 |
| 60 | 1.8 | 0.5 | 2.3 | 0.5 | 4.0 | 4.4 |
| 65 | 1.1 | 0.3 | 1.5 | 0.2 | 2.2 | 2.4 |
| 70 | 0.7 | 0.2 | 0.9 | 0.1 | 1.1 | 1.2 |
| 75 | 0.4 | 0.1 | 0.5 | 0.04 | 0.5 | 0.5 |
| 80 | 0.2 | 0.08 | 0.3 | 0.01 | 0.2 | 0.2 |
| 85 | 0.08 | 0.04 | 0.1 | 0.003 | 0.07 | 0.08 |
| 90 | 0.03 | 0.02 | 0.05 | 0.0007 | 0.03 | 0.03 |
SpCas9 gRNAs in human exons and introns in mESCs (n = 1,003,524 SpCas9 gRNAs) and U2OS cells (n = 4,498,780 SpCas9 gRNAs). Predictions were smoothed with Gaussian noise (Supplementary Methods).
Extended Data Table 2:
Endogenous repair of 24 designed high-precision gRNAs in human cell lines.
| Observed frequency among all edited products from deep sequencing at endogenous loci (%) | ||||
|---|---|---|---|---|
| Gene, exon/chr, cutsite (hg19) | Frameshift, U2OS | Most frequent genotype, U2OS | Frameshift, HEK293T | Most frequent genotype, HEK293T |
| VEGFA exon1: 458 |
72, 72 | 9, 11* | 81, 71 | 28, 9* |
| VEGFR2 exon5: 2 |
91, 91 | 49, 52* | 91,91 | 49, 23* |
| PDCD1 exon5: 208 |
90, 90 | 20, 22* | 91, 91 | 29, 13* |
| APOB exon25: 147 |
83, 83 | 22, 21* | 87, 85 | 36, 17* |
| VEGFA exon3: 127 |
86, 89 | 28, 30* | 92, 91 | 56, 32* |
| CCR5 exon1: 1941 |
83, 81 | 20, 21* | 86, 84 | 43, 27* |
| CD274 exon2: 271 |
85, 86 | 9, 10* | 84, 82 | 31, 14* |
| APOB exon26: 5590 |
91, 89 | 30, 27* | 89 | 40* |
| VEGFR2 exon26: 19 |
82, 82 | 35, 33* | 83, 82 | 41, 23* |
| CXCR4 exon1: 825 |
86, 86 | 32, 33* | 91 | 55* |
| PCSK9 exon11: 15 |
91, 89 | 64, 64† | 89 | 60† |
| CCR5 exon1: 885 |
90, 91 | 74, 71† | 78 | 65† |
| CCR5 exon1: 1027 |
92, 94 | 62, 62† | 91, 92 | 50, 60† |
| APOB exon26: 5573 |
93, 93 | 75, 74† | 93, 95 | 69, 82† |
| CCR5 exon1: 61 |
94, 92 | 21, 16† | 84, 88 | 19, 28† |
| CCR5 exon1: 1577 |
81, 81 | 29, 30† | 80, 84 | 29, 46† |
| APOB exon22: 100 |
89, 90 | 28, 31† | 90, 89 | 26, 40† |
| APOBEC3B exon3: 202 |
83, 83 | 52, 54† | 74, 87 | 52, 62† |
| MACCHC chr1: 45973892 |
97, 95 | 81, 77†‡ | 97, 98 | 79, 86†‡ |
| PROK2 chr3: 71821967 |
92, 93 | 45, 45†‡ | 92, 93 | 49, 58†‡ |
| IDS chrX: 148564700 |
96, 95 | 73, 76†‡ | 93, 95 | 63, 79†‡ |
| ECM1 chr1: 150484936 |
87, 89 | 47, 52†‡ | 88, 89 | 33, 37†‡ |
| KCNH2 chr7: 150644566 |
46 | 30†‡ | 89, 93 | 71, 75†‡ |
| LDLR chr19: 11222303 |
91, 92 | 79, 78†‡ | 90, 96 | 78, 84†‡ |
Deletion
Insertion
Pathogenic 1-bp insertion allele from Clinvar or HGMD. Data from up to two independent biological replicates are depicted.
Extended Data Table 3:
Repair of eight pathogenic microduplication alleles in individual cellular experiments.
| Pathogenic allele | LDLRdup1 | LDLRdup2 | LDLRdup2 | LDLRdup3 | LDLRdup4 | LDLRdup5 | PORCNdup | GAAdup | GAAdup | GLB1dup |
|---|---|---|---|---|---|---|---|---|---|---|
| #AlleleID | 245617 | 245706 | 245706 | 245709 | 245715 | 246266 | 25739 | 354180 | 354180 | 98805 |
| Predicted frequency of deletions restoring frame (%) | 79 | 98 | 96 | 95 | 86 | 94 | 90 | 76 | 93 | 95 |
| Flow cytometric frameshift frequency (%) | 57 | 95 | 57 | 90 | 72 | 87 | ND | 79 | 74 | 85 |
| Predicted frequency of repair to wild-type genotype among all major editing products (%) | 72 | 90 | 83 | 94 | 85 | 86 | 89 | 74 | 91 | 79 |
| Flow cytometric phenotypic repair frequency, mESC (%) | 36 | 69 | 30 | 53 | 33 | 78 | ND | ND | ND | ND |
| Observed frequency of repair to wild-type genotype among all edited products in HTS, mESC (%) | ND | 67 | 39 | 25 | 15 | 65 | 48 | 76 | 59 | 42 |
| Observed frequency of repair to wild-type genotype among all edited products in HTS, U2OS (%) | 100 | 88 | ND | ND | ND | 77 | ND | ND | ND | ND |
| Observed frequency of repair to wild-type genotype among all edited products in HTS, HCT116 (%) | ND | ND | ND | 24 | ND | 89 | ND | ND | ND | ND |
| Observed frequency of repair to wild-type genotype among all edited products in Lib-B, mESCs (%) | ND | ND | ND | ND | ND | 58 | 42 | ND | 63 | 41 |
| CTGCGAA | TGCAAGG | TTCCTCG | ACTGCAA | TTTTCCT | GACATCT | GCTGTCC | CAGCTGC | GCTGCAG | GTGTGAA | |
| GATGGCT | ACAAATC | TCAGATT | GGACAAA | CGTCAGA | ACTCGCT | CTGGCTT | AGAAGGT | AAGGTGA | CTATGGT | |
| CGGAGGC | TGACAGG | TGTCCTG | TCTGAGG | TTTGTCG | GGTGAGC | TTATCCC | GACTGCA | CTGCAGA | GCATATA | |
| gRNA + PAM sequence | TCGGAT | ACAAAT | TCAGAT | ACAAAT | TCAGAT | TGG | TGG | GAAGGT | AGG | TGG |
| KKH | KKH | KKH | KKH | KKH | KKH | |||||
| Cas9 Type | SaCas9 | SaCas9 | SaCas9 | SaCas9 | SaCas9 | SpCas9 | SpCas9 | SaCas9 | SpCas9 | SpCas9 |
ND, not determined. LDLRdup1, LDLR:c.526_533dupGGCTCGGA. LDLRdup2, LDLR:c.668_681dupAGGACAAATCTGAC. LDLRdup3, LDLR:c.669_680dupGGACAAATCTGA. LDLRdup4, LDLR:c.672_683dupCAAATCTGACGA. LDLRdup5, LDLR:c.1662_1669dupGCTGGTGA. PORCNdup, PORCN:c.1059_1071dupCCTGGCTTTTATC. GAAdup, GAA:c.2704_2716dupCAGAAGGTGACTG. GLB1dup, GLB1:c.1456_1466dupGGTGCATATAT.
Supplementary Material
Acknowledgments
The authors thank Oscar Juez, Rikita Jodhani, and Chad Araneo for technical assistance and the MIT Biomicro Center, the Harvard Medical School Biopolymers Facility, and the Broad Institute Genomics Platform for sequencing. The authors acknowledge funding from an NWO Rubicon Fellowship to M.A., an NSF Graduate Research Fellowship to M.S., DARPA HR0011–17-2–0049 (D.R.L.), NIHRM1 HG009490 (D.R.L.), R01 EB022376 (D.R.L.), R35 GM118062 (D.R.L.), HHMI (D.R.L.), 1RO1HG008363 (D.K.G.), 1R01HG008754 (D.K.G.), 1K01DK101684 (R.I.S.) the Human Frontier Science Program, NWO, NSF, Brigham Research Institute, Harvard Stem Cell Institute, and American Cancer Society (R.I.S.).
Footnotes
Competing interests The authors declare competing financial interests: patent applications have been filed on this work. D.R.L. is a consultant and co-founder of Editas Medicine, Beam Therapeutics, and Pairwise Plants, companies that use genome editing technologies.
Additional information
Extended Data is available for this paper.
Supplementary information is available for this paper.
Data availability
High-throughput sequencing data have been deposited in the NCBI Sequence Read Archive database under accession codes SRP141261 and SRP141144. Processed data have been deposited under the following DOIs: 10.6084/m9.figshare.6838016, 10.6084/m9.figshare.6837959, 10.6084/m9.figshare.6837956, 10.6084/m9.figshare.6837953, and 10.6084/m9.figshare.6837947.
Code availability
All data processing, analysis, and modeling code is available at http://www.github.com/maxwshen/inDelphi-dataprocessinganalysis. The inDelphi model is available online at the URL https://www.crisprindelphi.design.
Online Content
Methods, Supplementary Discussion, Supplementary Methods, along with any additional Extended Data display items are available in the online version of the paper; references unique to these sections appear only in the online paper.
References
- 1.Cong L et al. Multiplex Genome Engineering Using CRISPR/Cas Systems. Science 339, 819 (2013). [DOI] [PMC free article] [PubMed] [Google Scholar]
- 2.Mali P et al. RNA-Guided Human Genome Engineering via Cas9. Science 339, 823–826 (2013). [DOI] [PMC free article] [PubMed] [Google Scholar]
- 3.Jinek M et al. RNA-programmed genome editing in human cells. eLife 2, e00471 (2013). [DOI] [PMC free article] [PubMed] [Google Scholar]
- 4.Doench JG et al. Optimized sgRNA design to maximize activity and minimize off-target effects of CRISPR-Cas9. Nat. Biotechnol 34, 1–12 (2016). [DOI] [PMC free article] [PubMed] [Google Scholar]
- 5.Adli M The CRISPR tool kit for genome editing and beyond. Nat. Commun 9, 1911 (2018). [DOI] [PMC free article] [PubMed] [Google Scholar]
- 6.Komor AC, Kim YB, Packer MS, Zuris JA & Liu DR Programmable editing of a target base in genomic DNA without double-stranded DNA cleavage. Nature 533, 420–424 (2016). [DOI] [PMC free article] [PubMed] [Google Scholar]
- 7.Gaudelli NM et al. Programmable base editing of A•T to G•C in genomic DNA without DNA cleavage. Nature 1–27 (2017). doi: 10.1038/nature24644 [DOI] [PMC free article] [PubMed] [Google Scholar]
- 8.Paquet D et al. Efficient introduction of specific homozygous and heterozygous mutations using CRISPR/Cas9. Nature 533, 1–18 (2016). [DOI] [PubMed] [Google Scholar]
- 9.Landrum MJ et al. ClinVar: Public archive of interpretations of clinically relevant variants. Nucleic Acids Res. 44, D862–D868 (2016). [DOI] [PMC free article] [PubMed] [Google Scholar]
- 10.Stenson PD et al. Human Gene Mutation Database: towards a comprehensive central mutation database. J. Med. Genet 45, 124 (2008). [DOI] [PubMed] [Google Scholar]
- 11.Suzuki K et al. In vivo genome editing via CRISPR/Cas9 mediated homology-independent targeted integration. Nature 540, 144–149 (2016). [DOI] [PMC free article] [PubMed] [Google Scholar]
- 12.Nakade S et al. Microhomology-mediated end-joining-dependent integration of donor DNA in cells and animals using TALENs and CRISPR/Cas9. Nat. Commun 5, 5560–5560 (2014). [DOI] [PMC free article] [PubMed] [Google Scholar]
- 13.Koike-Yusa H, Li Y, Tan E-P, Velasco-Herrera MDC & Yusa K Genome-wide recessive genetic screening in mammalian cells with a lentiviral CRISPR-guide RNA library. Nat. Biotechnol 32, 267–273 (2013). [DOI] [PubMed] [Google Scholar]
- 14.van Overbeek M et al. DNA Repair Profiling Reveals Nonrandom Outcomes at Cas9-Mediated Breaks. Mol. Cell 63, 633–646 (2016). [DOI] [PubMed] [Google Scholar]
- 15.Urasaki A, Morvan G & Kawakami K Functional dissection of the Tol2 transposable element identified the minimal cis-sequence and a highly repetitive sequence in the subterminal region essential for transposition. Genetics 174, 639–649 (2006). [DOI] [PMC free article] [PubMed] [Google Scholar]
- 16.Ceccaldi R, Rondinelli B & D’Andrea AD Repair Pathway Choices and Consequences at the Double-Strand Break. Spec. Issue Qual. Control 26, 52–64 (2016). [DOI] [PMC free article] [PubMed] [Google Scholar]
- 17.Deriano L & Roth DB Modernizing the Nonhomologous End-Joining Repertoire: Alternative and Classical NHEJ Share the Stage. Annu. Rev. Genet 47, 433–455 (2013). [DOI] [PubMed] [Google Scholar]
- 18.Bae S, Kweon J, Kim HS & Kim J-S Microhomology-based choice of Cas9 nuclease target sites. Nat Methods 11, 705–706 (2014). [DOI] [PubMed] [Google Scholar]
- 19.Cornu TI, Mussolino C & Cathomen T Refining strategies to translate genome editing to the clinic. Nat. Med 23, 415 (2017). [DOI] [PubMed] [Google Scholar]
- 20.Davis AJ & Chen DJ DNA double strand break repair via non-homologous end-joining. Transl. Cancer Res 2, 130–143 (2013). [DOI] [PMC free article] [PubMed] [Google Scholar]
- 21.Arbab M, Srinivasan S, Hashimoto T, Geijsen N & Sherwood RI Cloning-free CRISPR. Stem Cell Rep 5, 908–917 (2015). [DOI] [PMC free article] [PubMed] [Google Scholar]
- 22.Bourbon M, Alves AC & Sijbrands EJ Low-density lipoprotein receptor mutational analysis in diagnosis of familial hypercholesterolemia. Curr. Opin. Lipidol 28, 120–129 (2017). [DOI] [PubMed] [Google Scholar]
- 23.Ran FA et al. In vivo genome editing using Staphylococcus aureus Cas9. Nature 520, 186 (2015). [DOI] [PMC free article] [PubMed] [Google Scholar]
- 24.Oh J et al. Positional cloning of a gene for Hermansky-Pudlak syndrome, a disorder of cytoplasmic organelles. Nat. Genet 14, 300–306 (1996). [DOI] [PubMed] [Google Scholar]
- 25.Biehs R et al. DNA Double-Strand Break Resection Occurs during Non-homologous End Joining in G1 but Is Distinct from Resection during Homologous Recombination. Mol. Cell 671–684 (2017). doi: 10.1016/j.molcel.2016.12.016 [DOI] [PMC free article] [PubMed] [Google Scholar]
- 26.Shin HY et al. CRISPR/Cas9 targeting events cause complex deletions and insertions at 17 sites in the mouse genome. Nat. Commun 8, 1–10 (2017). [DOI] [PMC free article] [PubMed] [Google Scholar]
- 27.Kosicki M, Tomberg K & Bradley A Repair of double-strand breaks induced by CRISPR–Cas9 leads to large deletions and complex rearrangements. Nat. Biotechnol (2018). [DOI] [PMC free article] [PubMed] [Google Scholar]
Methods References
- 28.Kleinstiver BP et al. Broadening the targeting range of Staphylococcus aureus CRISPR-Cas9 by modifying PAM recognition. Nat. Biotechnol 33, 1293–1298 (2015). [DOI] [PMC free article] [PubMed] [Google Scholar]
- 29.Sherwood RI et al. Discovery of directional and nondirectional pioneer transcription factors by modeling DNase profile magnitude and shape. Nat. Biotechnol 32, 171–178 (2014). [DOI] [PMC free article] [PubMed] [Google Scholar]
Associated Data
This section collects any data citations, data availability statements, or supplementary materials included in this article.


