Abstract
Heparin is a highly sulfated glycosaminoglycan (GAG) of natural origin used as an anticoagulant and antithrombotic drug. These properties are principally based on the binding and activation of antithrombin (AT) through the pentasaccharide sequence GlcNAc/NS,6S-GlcA-GlcNS,3,6S-IdoA2S-GlcNS,6S (AGA*IA). Literature data show that the population of the 2S0 ring conformation of the 2-O-sulfo-α-L-iduronic acid (IdoA2S) motif correlates with the affinity and activation of AT. It was recently demonstrated that two synthetic AGA*IA-containing hexasaccharides (one G unit added at the reducing end), differing in the degree of sulfation of the IdoA unit, show comparable affinity and ability to activate AT, despite a different conformation of the IdoA residue. In this paper, the binding of these two glycans to AT was studied by isothermal titration microcalorimetry (ITC), transferred (tr-) NOESY, saturation transfer difference (STD) NMR spectroscopy and molecular dynamics (MD) simulations. Results indicated that both the IdoA2S and the IdoA units assume a 2S0 conformation when bound with AT, and so present a common binding epitope for the two glycans, centred on the AGA*IA sequence.
Keywords: anticoagulant drugs, antithrombin, conformation analysis, heparin, molecular dynamics, NMR spectroscopy
Introduction
The anticoagulant properties of heparin are principally based on the binding and activation of antithrombin (AT), a major heparin cofactor in the inhibition of several serine proteases of the coagulation system, particularly factors Xa, IXa and IIa.[1] The mechanism of interaction of heparin and AT involves a specific heparin sequence corresponding to the pentasaccharide GlcNAc/NS,6S-GlcA-GlcNS,3,6S-IdoA2S-GlcNS,6S (AGA*IA).[2] The molecular basis of the interaction was originally studied by X-ray crystallography with a synthetic analogue of the natural pentasaccharide[3] and afterwards by NMR and X-ray investigations with the synthetic pentasaccharide Fondaparinux and natural oligosaccharides isolated from low-molecular-weight heparin and containing the natural pentasaccharide sequence.[4–8]
These studies indicated that the interaction is mainly governed by electrostatic forces between sulfate groups and positively charged amino acid residues of the AT heparin binding site (HBS). It occurs through the initial recognition of specific amino acid residues, such as Lys114, by the 3-O-sulfated glucosamine, with subsequent binding of the GlcNAc/NS,6S-GlcA-GlcNS,3,6S-trisaccharide motif and the reducing-end -IdoA2S-GlcNS,6S disaccharide moiety.[9–13] The binding induces allosteric conformational changes in AT, promoting extension of the D helix and expulsion of the N-terminal portion of the reactive central loop from the A β-sheet, therefore rendering the P1 arginine more accessible to target proteinases. Particularly important in this interaction is the conformational plasticity of the iduronic acid residue, which allows the binding of the-IdoA2S-GlcNS,6S disaccharide moiety and the subsequent stabilization of the high-affinity activated conformation of AT.[9,10] The iduronic acid residue, which exists in aqueous solution in equilibrium mostly between the two conformations 1C4 and 2S0,[14,15] adopts the 2S0 conformation when AGA*IA is bound to AT.[4] In contrast, the “locked” 1C4 conformation has been shown to be unable to bind AT.[16]
This behaviour has been observed for all AGA*IA-containing oligosaccharides bound to AT so far described, thus supporting the conjecture of a correlation between the affinity of the oli-gosaccharide and the relative population of the 2S0 form of IdoA2S in solution.[13] It is known that the degree of sulfation of neighbouring residues, in particular the 6-O-sulfation of the reducing glucosamine, affects the ring conformation of IdoA2S, shifting it toward the 2S0 conformation.[14,15,17] Recently, a systematic study conducted on a series of differently sulfated hexasaccharides prepared by chemoenzymatic synthesis demonstrated that the conformation of IdoA/IdoA2S is influenced by a combined effect of three sulfation types: 2-O-, 3-O-and 6-O-sulfation.[18] In particular, with increasing degree of sulfation of the glucosamine moieties adjacent to IdoA2S, the 2S0 conformer population of this last residue increases. Surprisingly, when the degree of sulfation of the glucosamine units that surround a non-sulfated IdoA increases, its conformation shifts toward the chair 1C4. However, the two hexasaccharides containing the specific pentasaccharide sequence (AGA*IA), and an extra GlcA added at the reducing end, but differing in the 2-O-sulfation of the IdoA residue, bind AT with similar affinity, despite having a different conformation of the iduronic acid residue.[18]
In this study, the conformation behaviour of these two synthetic hexasaccharides—GlcNS,6S-GlcA-GlcNS,3S,6S-IdoA2S-GlcNS,6S”-GlcA”-R (hexa-4) and GlcNS,6S-GlcA-GlcNS,3S,6S-IdoA-GlcNS,6S”-GlcA”-R (hexa-8)—in the presence of AT was studied. The analysis was based on isothermal titration micro-calorimetry, saturation transferred difference NMR, transferred-NOEs and molecular dynamics simulation. We demonstrated that both hexasaccharides bind AT with a similar epitope binding and that the conformation of iduronic acid residues is driven towards the 2S0 form, independently of their sulfation state and conformation assumed in the free state.
Results and Discussion
Sample preparations
The hexasaccharides hexa-4 and hexa-8 have the same structure, with the exception of iduronic acid sulfation: hexa-4 has a 2-O-sulfo iduronic acid residue (IdoA2S), whereas hexa-8 has an iduronic acid unit (IdoA, Scheme 1). Both hexasaccharides were synthesized by the chemoenzymatic method published previously.[19] The structural characterization and purity analysis were also previously reported.[18] AT purification is described in the Experimental Section.
Scheme 1.
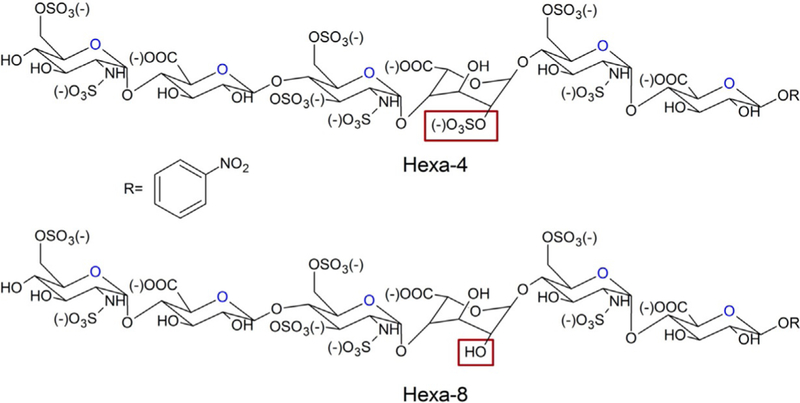
Chemical structures of hexa-4 and hexa-8. The structural difference of these two compounds is the sulfation of IdoA residues, highlighted by a red box. R = 4-nitrophenyl.
ITC
The interaction of the hexasaccharides and Fondaparinux with AT was studied by ITC, under the same conditions as the NMR experiments (see the Experimental Section). The titration iso-therms are given in Figure 1; Table 1 reports the Kd values and thermodynamic parameters obtained upon fitting of the exchanged heat for the oligosaccharides under examination. As expected, due to the high ionic strength, a substantial decrease in Kd values in relation to those published in a previous work was observed.[18] However, these values agree with those for similar oligosaccharides measured at the same ionic strength.[6] Hexa-4 displayed a Kd value about two and six times lower than those of hexa-8 and Fondaparinux, respectively. The enthalpy variation upon binding corresponds to an exothermic process, and it is the highest contribution to the free energy variation for all the ligands tested. Hexa-4 shows higher free energy and enthalpy changes upon binding than hexa-8. In fact, the lower enthalpy variation of hexa-8 in comparison with hexa-4 correlates both with the missing 2-O-sulfo group, corresponding to an electrostatic interaction lost, and possibly with the higher energy cost that has to be paid to drive the conformation of IdoA from 1C4 to 2S0 upon binding.
Figure 1.
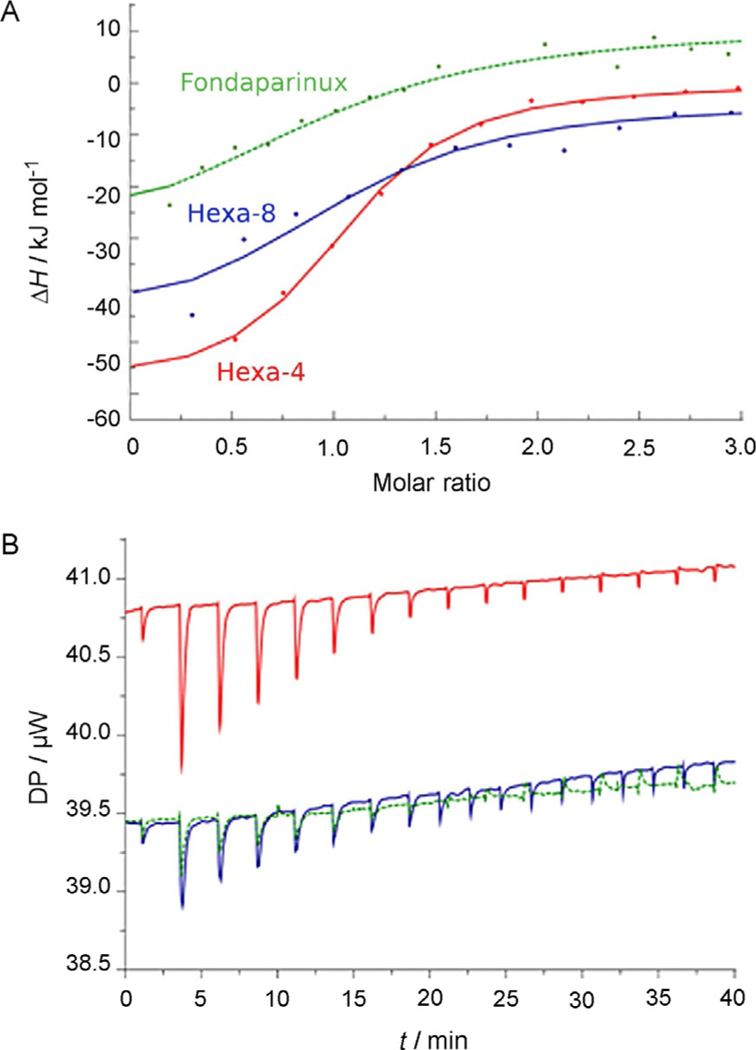
ITC experimental results.
Table 1.
Micro ITC thermodynamic parameters.
| Sample |
T [°C] |
KD [M] |
ΔH [kJ mol–1] |
ΔG [kJ mol–1] |
–TΔS [kJ mol–1] |
|---|---|---|---|---|---|
| hexa-4 | 25.4 | 5.51 × 10⁻⁷ | −59.5 | −35.8 | 23.7 |
| hexa-8 | 25.1 | 1.29 × 10⁻⁶ | −45 | −33.6 | 11.4 |
| Fondaparinux | 25.1 | 3.52 × 10⁻⁶ | −45.1 | −31.1 | 13.9 |
1D NMR
The NMR spectra of both free and AT-bound hexasaccharides were recorded in 0.5 m NaCl solution. The combined use of ionic strength and temperature (30°C) was necessary to increase the dissociation constants (from nanomolar to micro-molar). This achieved faster exchange conditions between the hexasaccharides and AT, as required for the analysis of the complex for reasons relating to NMR timescales. Previous proton and carbon assignments[18] were confirmed by COSY, TOCSY and HSQC experiments (data not reported). The anomeric regions of the 1H NMR spectra of hexa-4 and hexa-8 measured at 600 MHz in the presence of AT are shown in Figure 2A and B (blue lines), respectively, in comparison with the proton spectra of the ligands in the free state (red lines). The small protein-induced shifts and the increased linewidths observed in the spectra of both hexasaccharides, arising from the higher correlation time as a consequence of protein binding, are consistent with an equilibrium regulated by the intermediate dynamic exchange between the free and bound states. In both spectra of glycan-AT complexes, all anomeric protons except H1 of GlcA” showed chemical shift perturbation. Notably, H1 signals of GlcNS3S6S and IdoA2S or IdoA presented the highest chemical shift perturbations, estimated as 10 and 5 Hz for hexa-4·AT, and 9 and 7 Hz for hexa-8·AT. The H5 resonance of IdoA2S in hexa-4·AT also showed a strong perturbation (9 Hz), whereas the corresponding signal for IdoA of hexa-8·AT presented a weaker variation (4 Hz). The disulfated glucosamine units (GlcNS6S and GlcNS6S”) showed weaker chemical shift perturbation than the central GlcNS3S6S-IdoA2S/IdoA moieties, thus suggesting that they are slightly less involved in the binding. The glucuronic acid residue GlcA”, as well as the para-nitrophenyl group near to the glycan reducing end, appear not to be involved in the binding, as was suggested by the unchanged proton chemical shift and signal shape upon binding with AT (data not shown).
Figure 2.
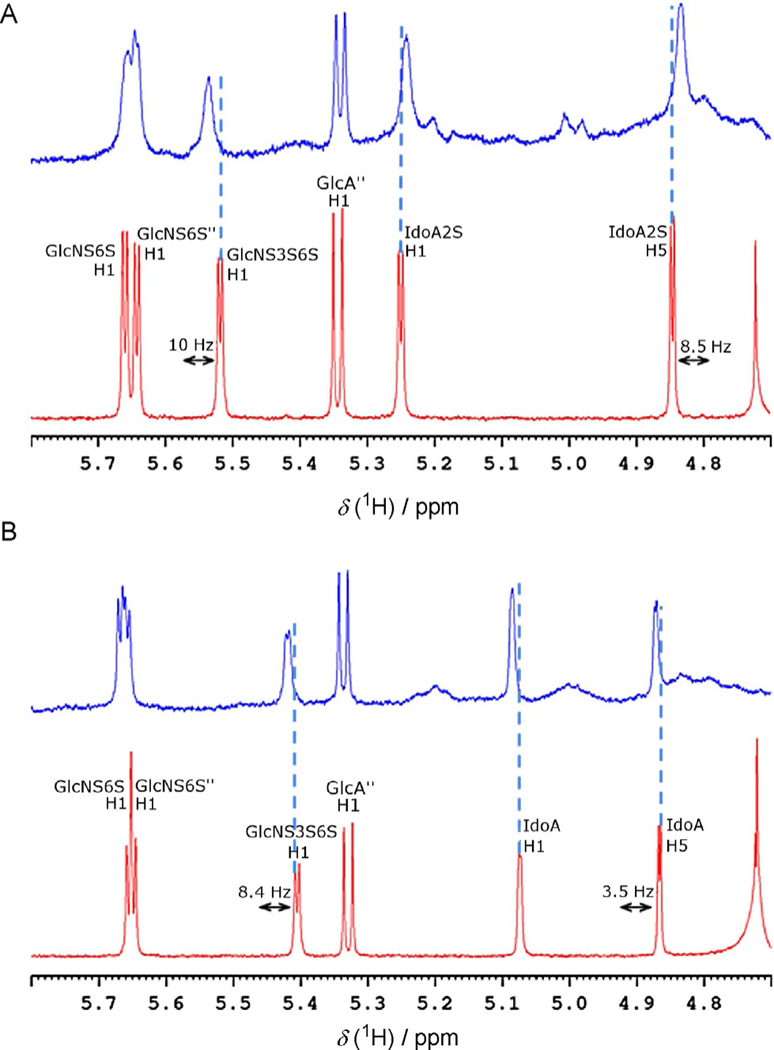
Anomeric region of the proton spectra of A) hexa-4, and B) hexa-8 in bound (blue line) and unbound (red line) forms at a ligand/protein ratio of 5:1. The anomeric signal of the GlcA residue is hidden by the residual water signal in the spectra of both the hexa-4·AT and the hexa-8·AT complexes.
1H-STD NMR
This experiment is based on the transfer of magnetic saturation from the macromolecule to the bound ligand under conditions of fast chemical exchange. The magnitude of the STD signal is related to the proximity of the ligand proton to the protein surface, and analysis of the STD signal pattern enables the mapping of the ligand’s binding epitope.[20] For both hexa-saccharides the reducing-end moiety GlcA”-(4-nitrophenyl) is less involved than the AGA*IA sequence in interaction with AT, as shown by the weakness of the corresponding STD signals, indicating an average greater distance between these residues and AT (Figure 3 and Table 2). STD signals were similar for all hexasaccharide residues despite the sulfation of the iduronic acid, thus indicating that the lack of this specific sulfate group in hexa-8 does not preclude binding to AT
Figure 3.
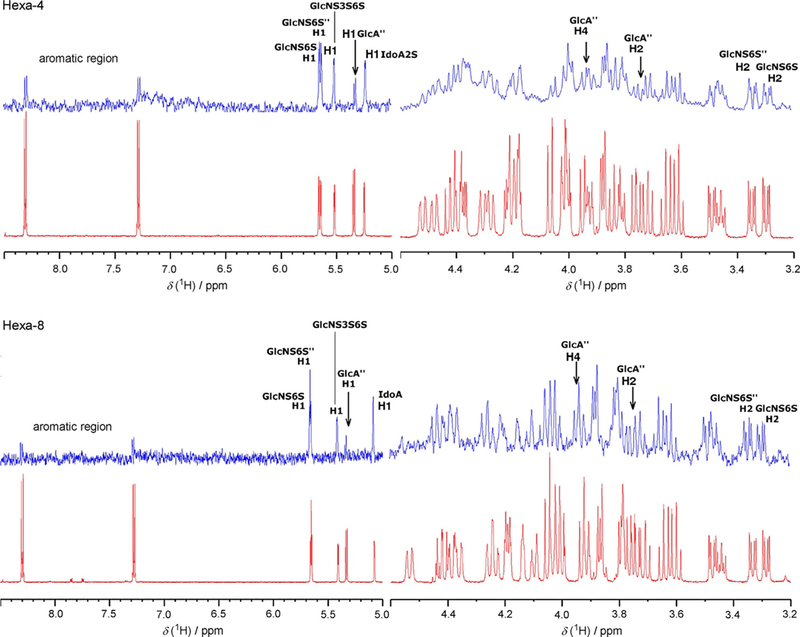
Partial 600 MHz 1H-STD NMR spectra of the hexa-4·AT and hexa-8·ATcomplexes. The experiment was conducted with a glycan/AT molar ratio of 100:1; the temperature was set to 35 °C. STD and reference 1H spectra are depicted in blue and red, respectively.
Table 2.
Selected 1H-STD intensities as percentages relative to H1 of IdoA2S or IdoA in hexa-4 or hexa-8, respectively.
| 1H STD relative intensities [%] | ||||||||
|---|---|---|---|---|---|---|---|---|
| Ligand | H1 GlcNS6S | H1 GlcNS3S6S | H1 IdoA | H1 GlcNS6S” | H2 GlcNS6S” | H1 GlcA” | H2 GlcA” | H4 GlcA” |
| hexa-4 | 98 | 81 | 100 | 97 | 98 | 43 | 64 | 66 |
| hexa-8 | 92 | 92 | 100 | 92 | 89 | 38 | 63 | 56 |
Molecular dynamics
The iduronic acid residue in hexa-4·AT and hexa-8·AT remained in the 2S0 conformation for the whole length of the MD simulation (260 ns approximately), independently of the 2-O-sulfation. MD simulation also allowed sampling of the dihedral angle conformations ϕ/ψ of the glycosidic linkages associated with hexa-4 and hexa-8 in their free and AT-bound states; these results are reported as Ramachandran plots in Figure 4. In the free state, the glycan backbone was characterized by the average values of ϕ/ψ calculated from the MD simulation after a relaxation period of 40 ns; in the bound state, the corresponding properties were calculated based on the sets of tr-NOE-selected glycan·AT complex geometries (see tr-NOESY paragraph). The backbone conformations of hexa-4 and hexa-8 in the free state and in the AT-bound state agreed with the AGA*IA as determined by NMR[4] and summarized in Table S1 in the Supporting Information. Similarly to what was observed for a library of heparin-like trisaccharides, both hexasaccharides in the free state showed greater flexibility of the IdoA-GlcNS6S glycosidic linkage than GlcNS6S-IdoA.[17] The conformational freedom of the glycosidic linkages in hexa-4 and hexa-8 showed a consistent reduction from the free to the bound state, particularly evident for the GlcNS3S6S-IdoA2S/IdoA and IdoA2S/IdoA-GlcNS6S” glycosidic linkages, corresponding to the part of the glycans that better “adapt” to the AT-HBS. Moreover, significant changes in their glycosidic linkage geometries were observed between GlcA-GlcNS3S6S and GlcNS6S”-GlcA” in hexa-4 and between IdoA-GlcNS6S” and GlcNS6S”-GlcA” in hexa-8 (Figure 4, comparison panels B and G, D and I, and E and L; see also Table S1). In hexa-4, R13 of AT interacts with NSO3(–) of GlcNS3S6S, 2-O-SO3(–) of IdoA2S and 6-O-SO3(–) of GlcNS6S”. In hexa-8, in which the IdoA sulfate group is missing, the previously cited triple interactions cannot be present, thus strengthening the repulsion between the 6-O-SO3(–) moiety of GlcNS6S” and the carboxylate group of GlcA” (Figure 5) and forcing the last glycosidic bond to assume a torsional state different from that of hexa-4.
Figure 4.
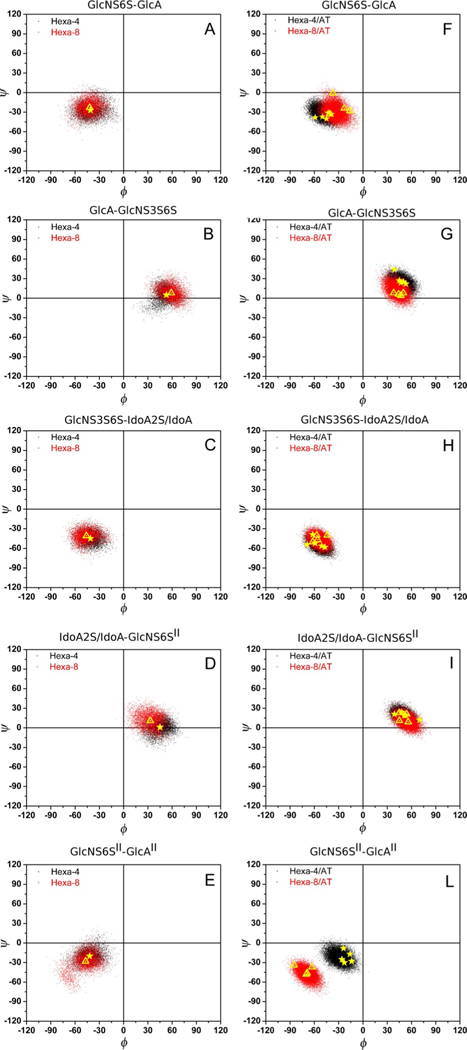
Ramachandran plots of the glycosidic dihedral angles ϕ/ψ for hexa-4 and hexa-8 A)-E) in the free state and F)-L) in the bound state as sampled during MD simulations after a relaxation period of 40 and 80 ns for glycans in the free and the bound state, respectively. From the top to the bottom each panel corresponds to the glycosidic linkage on going from the non-reducing to the reducing end, as labelled on the top of each panel. In panels A)-E) the yellow stars and triangles correspond to the average values ϕ/ψ of hexa-4 and hexa-8, respectively, calculated in the free state from the MD simulation trajectories, skipping the first 40 ns (relaxation, Table S1). In panels F)-L) the yellow stars and triangles indicate ϕ/ψ values of the MD-simulated structures validated by tr-NOEs and corresponding to simulation times of 209, 227, 240, 257, 270 ns for hexa-4·AT and 214, 235, 243, 258 ns for hexa-8·AT (see paragraph on NOESYand tr-NOESY and Table S1).
Figure 5.
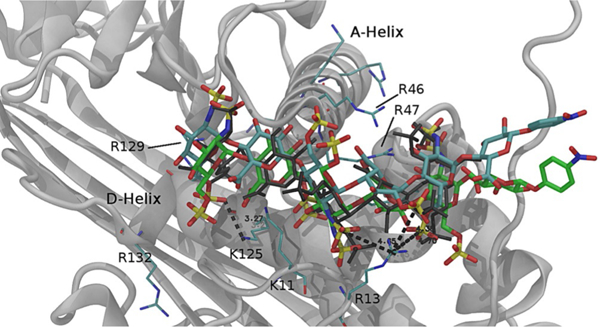
Hexa-4·AT and hexa-8·AT complexes selected from the MD simulation trajectories at 227 and 258 ns, respectively, and validated by the inter-glycosidic tr-NOEs (see text and Table 4). Hexa-4·AT and hexa-8·AT are represented by cyan and green tubes, respectively, whereas the black wireframe represents the reference pentasaccharide as in 1AZX. AT is represented by the grey ribbon of the hexa-4·AT complex only, whereas selected Arg and Lys residues are indicated by thin cyan tubes. The two complexes are super-posed to the reference structure 1AZX through the corresponding Cα back-bone of the A helix (Ca backbone, between amino acids 45 and 70).
These results are better represented by the sub-sets of the glycan-AT structures selected by tr-NOESY analysis, underlined by the yellow symbols in the Ramachandran plots in panels F) to L) of Figure 4. These results suggested that both glycans bind AT from the non-reducing to the reducing end: that is, with involvement of all their pentasaccharide residues constrained in an approximately cylindrical cavity. Only the reducing-end GlcA”-(4-nitrophenyl) moiety is less involved in binding, as shown by the 1H and STD experiments, although it appears to affect the conformation of the pentasaccharide sequence.
NOESY and tr-NOESY
Because the cross-relaxation rates in the free and the bound states differ considerably as a consequence of the binding with AT, the variation in the cross-peak intensities in the two-dimensional NOESY (free state) and tr-NOESY (bound state) spectra was observed (Table 3). The conformation of the iduronic acid residue both in hexa-4 and in hexa-8 was investigated by analysis of the tr-NOESY spectra (Figure 6). Similarly to what was observed for AGA*IA,[4] the interaction between hexa-4 and AT changes the intra-residue NOESY ratio H5-H2/H4-H5 of IdoA2S from 0.5 to 1.3 approximately, thus confirming that the conformation of this residue approaches pure 2S0 upon binding (Table S2). Surprisingly, the conformation of IdoA of hexa-8, which adopts an almost pure 1C4 conformation in free solution, is also shifted toward 2S0 in the bound state to AT, as shown by the change in the H5-H2/H4-H5 NOESY ratio from 0.3 to 0.9 (Figure 6 and Table S2). Comparison between inter-glycosidic NOEs and tr-NOEs, acquired for the glycans in their free and bound states, respectively, allowed the detection of glycan conformational changes upon binding. Pairs of H1-H4 and H1-H3 or H1-H4 and H1-H6 inter-gly-cosidic NOE and tr-NOE intensities and their ratios are reported for both glycans in Table 3.
Table 3.
Selected inter-glycosidic NOEs and tr-NOEs of the glycans in the free and the bound states. The ratios between the tr-NOE and NOE intensities of the pairs H1-H4 and H1-H3 or H1-H4 and H1-H6 are reported in brackets. Significant differences between ratios of the tr-NOE and NOE intensities, indicating glyosidic dihedral angle variation upon binding, are in bold.
| trNOE/NOE selected intensities | ||||||
|---|---|---|---|---|---|---|
|
tmix [ms] |
H1–H4/H1–H3 | H1–H4/H1–H6 | H1–H4/H1–H3 | |||
| Tr-NOE | NOE | Tr-NOE | NOE | Tr-NOE | NOE | |
| Hexa-4·AT | GlcNS3S6S-IdoA2S | IdoA2S-GlcNS6S” | GlcNS6S”-GlcA” | |||
| 200 | 15/13.9 (1.1) | 4.¾.0 (1.1) | 9.8/10.4 (0.9) | 3.2/3.4 (0.9) | 16.2/5.7 (2.8) | 2.3/0.7 (3.3) |
| 300 | 25.5/23.4 (1.1) | 6.2/6.1 (1.0) | 13.3/15.1 (0.9) | 4.9/5.2 (0.9) | 25.1/10.1 (2.5) | 3.7/1.1 (3.4) |
| 500 | 34.9/32.3 (1.1) | 10.5/10.2 (1.0) | 24.½9.8 (0.8) | 8.0/7.8 (1.0) | 43.3/24.4 (1.8) | 6.0/1.9 (3.2) |
| Hexa-8·AT | GlcNS3S6S-IdoA | IdoA-GlcNS6S” | GlcNS6S”-GlcA” | |||
| 200 | 8.6/7.7 (1.1) | 5.4/6.7 (0.8) | 9.8/4.8 (2.0) | 4.0/1.6 (2.5) | 6.1/1.3 (4.7) | 1.4/0.1 (14) |
| 300 | 17.3/14.1 (1.2) | 8.0/10.2 (0.8) | 15.3/6.6 (2.3) | 6.4/2.2 (2.9) | 11.0/2.1 (5.2) | 2.2/0.4 (5.5) |
| 500 | 35.7/28.9 (1.2) | 13.2/16.7 (0.8) | 32/13.5 (2.4) | 10.5/3.6 (2.9) | 24.7/7.7 (3.2) | 4.0/0.7 (5.7) |
Figure 6.
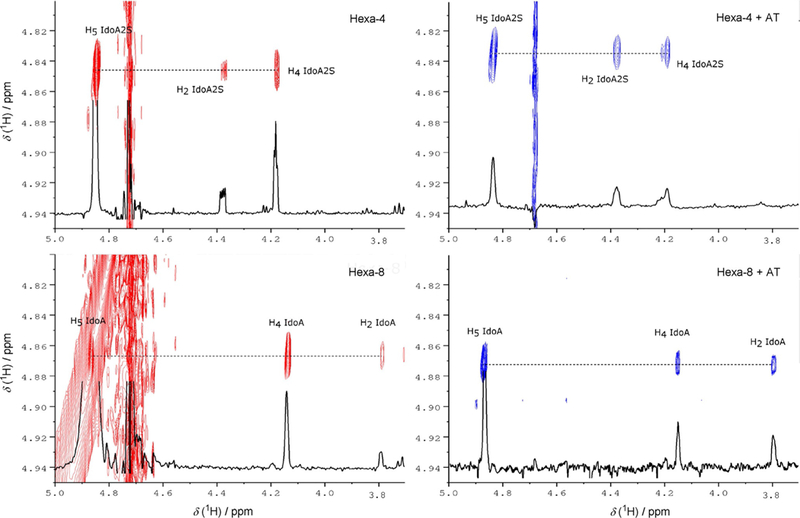
Iduronic acid H5 region of NOESY (red) and tr-NOESY (blue) spectra. The NOESY and tr-NOESY projections of iduronic acid H5 are in black.
As shown by the corresponding Ramachandran plots discussed in the MD simulation paragraph (Figure 4), significant variation in the glycosidic linkage geometry of reducing-end residues upon binding was observed. Notably, hexa-4 showed changes localized at the GlcNS6S”-GlcA” glycosidic linkage, whereas hexa-8 showed variation of both IdoA-GlcNS6S” and GlcNS6S”-GlcA”glycosidic linkages (Table 3). The NOE signals acquired for hexa-4 and hexa-8 glycans allowed us to validate the conformation observed during the MD simulations in the free state. Selected inter-glycosidic NOEs, calculated from optimized glycan conformations (see the Experimental Section), showed partial agreement with the measured NOEs (Table S3).
The glycan conformations in the bound state were determined by selecting structures from MD simulation trajectories after a relaxation period of 80–120 ns and simulating the critical tr-NOEs to be compared with the experimental values. The tr-NOEs were simulated by use of the CORCEMA program[21] with a “two-state” model for the interaction (see the Experimental Section). The thermodynamic dissociation constants for both glycans with AT were estimated by use of micro ITC. To obtain the best agreement with experimentally measured tr-NOEs, the kinetic koff constants (koff hexa-4: 18 s–1; koff hexa-8: 15 s–1) were estimated, reproducing the relatively stable H1-H2 tr-NOEs of the three glucosamines residues—GlcNS6S, GlcNS3S6S and GlcNS6S”—by use of selected glycan·AT structures extracted from the MD simulation (Experimental Section and Table S4). Five selected structures of the hexa-4·AT complex, at simulation times of 209, 227, 240, 257 and 270 ns, as well as four selected structures of hexa-8·AT, corresponding to times of 214, 235, 243 and 258 ns, showed good agreement with the experimentally measured tr-NOEs. The R factors of these geometries averaged on the selected inter-glycosidic H–H correlations, spanned from 0.10 to 0.22 for hexa-4·AT and between 0.22 and 0.27 for hexa-8·AT [Table S5 (a), (b)]. The best agreement was found for the structures at time 227 ns for hexa-4·AT and at 258 ns for hexa-8·AT, as reported in Table 4.
Table 4.
Selected inter-glycosidic tr-NOEs measured and calculated from the structures at simulation times 227 ns and 258 ns for hexa-4 and hexa-8, respectively. Bold numbers in brackets correspond to the tr-NOEs calculated by use of the CORCEMA program. The R factor is calculated according to Eq. (1) and underlined in bold italic.
|
tmix [ms] |
GlcNS6S-GlcA | GlcNS3S6S-IdoA2S | IdoA2S-GlcNS6S” | GlcNS6S”-GlcA” | |||
|---|---|---|---|---|---|---|---|
| H1–H4 | H1–H4 | H1–H3 | H1–H4 | H1–H6 | H1–H4 | H1–H3 | |
| Hexa-4·AT t =227 ns | |||||||
| 200 | 14.9 (10.5) | 15 (5.3) | 13.9 (17.3) | 9.8 (10.0) | 10.4 (9.2) | 16.2 (20.3) | 5.7 (5.1) |
| 300 | 22 (15.5) | 25.5 (8.6) | 23.4 (25.1) | 13.3 (14.5) | 15.1 (13.5) | 25.1 (28.8) | 10.1 (8.2) |
| 500 | 41.5 (26.2) | 34.9 (16.9) | 32.3 (41.0) | 24.1 (23.6) | 29.8 (22.0) | 43.3 (44.7) | 24.4 (16.0) |
| R | 0.12 | 0.34 | 0.05 | 0.00 | 0.05 | 0.01 | 0.10 |
| GlcNS6S-GlcA | GlcNS3S6S-IdoA | IdoA-GlcNS6S” | GlcNS6S”-GlcA” | ||||
| H1–H4 | H1–H4 | H1–H3 | H1–H4 | H1–H6 | H1–H4 | H1–H3 | |
| Hexa-8·AT t =258 ns | |||||||
| 200 | 5.9 (11.3) | 8.6 (5.3) | 7.7 (15.9) | 9.8 (7.3) | 4.8 (8.1) | 6.1 (2.9) | 1.3 (2.7) |
| 300 | 9.8 (16.0) | 17.3 (8.1) | 14.1 (22.4) | 15.3 (10.5) | 6.6 (11.4) | 11.0 (4.6) | 2.1 (4.3) |
| 500 | 21.1 (25.5) | 35.7 (14.9) | 28.9 (35.1) | 32 (17.1) | 13.5 (18.1) | 24.7 (9.2) | 7.7 (8.5) |
| R | 0.15 | 0.32 | 0.16 | 0.19 | 0.22 | 0.38 | 0.11 |
To compare the relative positions of hexa-4 and hexa-8 in the AT HBS graphically, the corresponding A helix of the tr-NOE-validated complexes and that of the reference complex (AGA*IA-AT; PDB ID: 1AZX) were superposed (Cα backbone, between amino acids 45 and 70 in 1AZX numbering) and are reported in Figure 5. These operations were repeated for the whole sets of hexasaccharide·AT validated structures, and the average root mean square distance (RMSD) of each glycan residue and the corresponding residue of the reference complex was calculated (Tables 5 and S6). The AGA*IA sequence in both hexa-4·AT and hexa-8·AT, qualitatively matches the corresponding glycan in AGA*IA·AT, even if this similarity improves toward the reducing end (IdoA2S, GlcNS6S”) for hexa-4 and in a more extended region including GlcA and GlcNS3S6S for hexa-8. This result was unexpected because hexa-4 has the AGA*IA sequence closer to that of the active pentasaccharide than hexa-8; this possibly indicates that the reducing GlcA”-(4-nitrophenyl) terminal end of these hexasaccharides might affect the binding of the AGA*IA sequence to AT.
Table 5.
Average values of the RMSDs calculated between residue pairs of the common sequence (AGA*IA) with regard to hexa-4·AT, hexa-8·AT and AGA*IA·AT after superposition of the A helix (see the Experimental Section.)
| Average RMSD (C1, C2, C3, C4, C5, O5) [Å] | ||||||
|---|---|---|---|---|---|---|
| A helix | GlcNS6S | GlcA | GlcNS3S6S | IdoA2S/IdoA | GlcNS6S” | |
| hexa-4·AT | 0.46 | 1.84 | 2.15 | 1.98 | 1.23 | 0.66 |
| hexa-8·AT | 0.67 | 1.81 | 1.30 | 1.08 | 1.40 | 1.37 |
Distances between selected interacting groups of the hexa-4·AT and hexa-8·AT models (lowest R score) and the corresponding AGA*IA·AT, determined by NMR methods[4] and by X-ray diffraction (“1AZX”, “3KCG” and “2GD4”), are reported in Table S7,[3,7,22] In hexa-4 and hexa-8, the GlcNS3S6S, IdoA2S/ IdoA and GlcNS6S” residues are in closer proximity to AT than GlcNS6S and GlcA”, as shown in Figure 7 and Table S7. Independently of the degree of sulfation of the iduronic acid moiety, the interatomic distances in the regions surrounding GlcNS3S6S-Ido2S/IdoA of hexa-4 and hexa-8 and AT are similar to those found in NMR and crystal-state models (Table S7). K114 was confirmed as one of the key residues, being in contact with GlcNS3S6S (NS, 3S), IdoA2S/IdoA (COO–) and, to a lesser extent, GlcNS6S”(6S), as observed for the AGA*IA specific pentasaccharide·AT complexes,[4,9,23] Additionally, R13 in hexa-4·AT was near to GlcNS3S6S (NS) and IdoA2S (2S; 4.7 and 4.4 Å, respectively). This finding does not exclude partial involvement of the 2-O-sulfo group of IdoA2S in interaction with AT, as supported by AT X-ray structures in “Latent”, “Intermediate”, and “Activated” conformations (PDB IDs: 1E03, 1NQ9, and 3KCG),[22‘24‘25] but in partial disagreement with what was previously discussed[4] and with the X-ray-resolved structure of AGA*IA·AT in PDB ID 2GD4.
Figure 7.
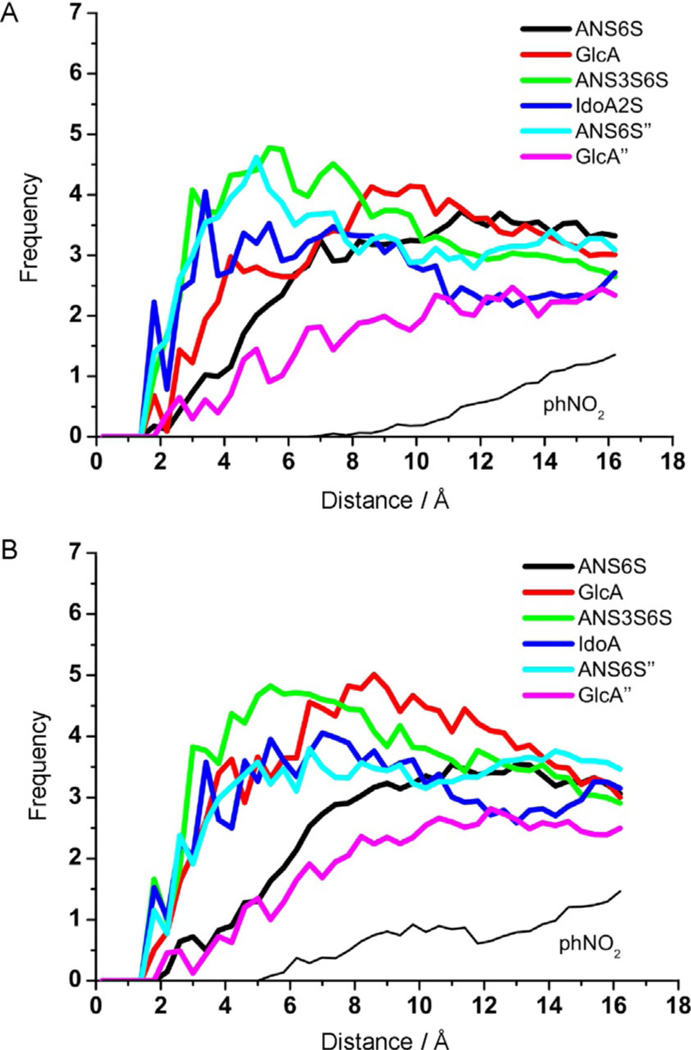
Diagram of the contacts (histograms of the distances) between each residue and the hydrogen atoms belonging to AT. The diagrams were calculated by using a subset of the tr-NOE-validated structures for A) hexa-4·AT, and B) hexa-8·AT complexes, that correspond to MD simulation times of 209, 227, 257 and 270 ns and of 214, 235, 243 and 258 ns, respectively (Table S6).
The tr-NOE-validated complex structures allowed determination of more refined details of the glycan-AT complexes, such as the histograms of the distances between the atoms of each of the glycan residues and the hydrogen AT atoms (Figure 7). The histograms show the frequencies of population for the distances between the indicated atom pairs, as determined in the tr-NOEs of selected complexes. As previously observed in terms of chemical shift perturbation (Figure 2) and of the glycosidic linkage ϕ/ψ distribution analysis (Figure 4), in both hexasaccharides the four central residues GlcA, GlcNS3S6S, IdoA2S/IdoA and GlcNS6S” have closer contacts with the AT HBS than the reducing-and non-reducing-end GlcA” and GlcNS6S units. Notably, the histogram clearly shows that the 4-nitrophenyl group is further away from the AT HBS than the GlcA” residue. The hexa-4-AT complex shows slightly closer contacts between the GlcNS3S6S and IdoA2S residues and AT than in the case of hexa-8-AT, as underlined by the slightly greater population at distances smaller than 4 Å observed for hexa-4 (green and blue lines in Figure 7).
Conclusion
Chemo-enzymatic synthesis has allowed the preparation of a wide range of high-purity artificial GAG oligosaccharides reproducing both natural and other possible sequences occurring in heparan sulfate and heparin. This gives the unique opportunity to obtain variants of AT-binding oligosaccharides, the compositions of which can be controlled in terms of position and modification of the AGA*IA sequence.[19] Recently, it was demonstrated that two AGA*IA-containing hexasaccharides, terminated at the reducing end by the remnant GlcA-R (R = 4-nitro-phenyl) and differing in the sulfation at the 2-O position of the iduronic acid residue, have comparable abilities to bind and activate AT.[18] In this paper the interaction of these two hexa-saccharides with AT was studied, with comparison of results with those previously obtained by crystallography and NMR techniques on complexes between AGA*IA-containing oligo-saccharides and AT. The AGA*IA specific binding is dominated, at least for long-range distances, by electrostatic interactions involving negatively charged groups (sulfate and carboxylate) of the glycan and the positively charged residues (mainly Arg and Lys) that characterize the HBS of AT across the D helix sub-unit,[2,3‘12‘23] Convergent studies by several groups,[3,9,10,12]based on structural and kinetic investigations, described the AGA*IA-AT binding as a two-step process. In the first step the rigid trisaccharide AGA* approaches the HBS of AT, driven mainly by Lys125 and Lys114, to form a low-affinity complex.[10] In the second step, the HBS of AT undergoes a conformational change that allows the positioning of Lysl 14 and Arg129 in proximity to GlcNS3S6S, thus driving the conformation of IdoA2S toward the 2S0 form and allowing the subsequent binding of the reducing-end -IdoA2S-GlcNS6S” disaccharide motif.[10]
For both hexasaccharides, STD-NMR experiments and MD simulations indicated a glycan-binding epitope extending from the non-reducing-end GlcNS6S to the reducing-end GlcNS6S”-GlcA” residues. In particular, the two central GlcNS3S6S and IdoA2S/IdoA residues showed the stronger interaction with AT for both glycans, whereas the reducing-end GlcA” appeared less involved in binding with AT. MD simulations with use of explicit solvent were employed to characterize the conformational properties of hexa-4 and hexa-8 in their free and AT-bound states, spanning approximately 100 and 260 ns, respectively. IdoA2S and IdoA remained in the 2S0 conformation during the MD simulations in the cases both of hexa-4·AT and of hexa-8-AT, independently of the 2-O-sulfation state, thus supporting the idea that the HBS surface enforces the 1C4 to 2S0 transition upon binding.[4] All glycosidic linkages of both glycans experience decreased conformational freedom on going from the free to the bound state, but this was observed to a greater extent with their central -GlcNS3S6S-IdoA2S/IdoA-GlcNS6S”-residues, indicating their closer contacts with the HBS, as inferred previously from 1H and 1H-STD interaction studies.
These results are reinforced by considering the glycosidic dihedral angles (yellow symbols in Figure 4) of the subsets of hexa-4·AT and hexa-8·AT geometries in agreement with tr-NOE ratios, and additionally by the histogram contacts between the glycan residues and the HBS of AT. For residues at the reducing end, the glycosidic linkage conformations change upon binding. This was more evident in hexa-8, in which the missing 2-O-sulfation of IdoA affects the nearest-neighbour IdoA-GlcNS6S” linkage only weakly, but the next GlcNS6S”-GlcA” greatly (Figure 4 and Table S1). This could be explained in terms of a possible contribution by the reducing GlcA” residue to allow better adjustment of the pentasaccharide in the HBS of AT; it also agrees with the higher affinity of hexa-8 in relation to the pentasaccharide containing the 2-O-desulfated IdoA residue.1261 Intra-residue tr-NOE ratio analysis clearly illustrates that both IdoA2S and IdoA move the conformation towards 2S0 upon binding, independently of their sulfation states. The tr-NOE-validated geometries of hexa-4·AT and hexa-8·AT showed comparable positioning of the AGA*IA sequence once superposed through the A-helix on the AGA*IA·AT (1AZX). In this description the analysis of the glycan-AT contacts indicated that GlcNS3S6S, IdoA2S/IdoA and, to a lesser extent, the reducing-end GlcNS6S” preserve the contacts previously observed in the reference NMR and X-ray diffraction AGA*IA-AT complexes (Table S7). These results also confirm the significant role of the contact network between AT HBS and residues surrounding the trisaccharide sequence GlcNS3S6S-IdoA2S/IdoA-GlcNS6S” in changing the IdoA conformation from 1C4 to 2S0 upon binding, independently of the 2-O-sulfation state of IdoA.
Experimental Section
AT purification:
Pasteurized antithrombin (Kybernin P) was solubilized in buffer A [pH 7.4, 10 mL, phosphate-buffered saline (PBS, 10 mM), NaCl (0.25 m)] and loaded onto an XK 16/40 column (GE Healthcare) previously prepared with heparin sepharose 6-Fast Flow (50 mL) and equilibrated at 4°C in the same buffer. A low-af-finity fraction was eluted with buffer A (300 mL), whereas the high-affinity fraction was eluted with the same volume of elution buffer [PBS, pH 7.4, NaCl (2.5 M)]. The fractions were loaded onto 3 KDa MWCO filters (Millipore) in a stirred ultra-filtation cell (Millipore, Italy) for desalting and buffer-exchanged with phosphate buffer (pH 7.4, 20 mM). The final concentrations of the solutions were determined by using the bicinchoninic acid assay following the manufacturer’s instructions.
ITC:
The equilibrium dissociation constant (Kd) was assessed at 25°C in PBS (pH 7.1, 10 mM) and NaCl (0.5 M). The Kd value was obtained by MicroCal ITC, with monitoring of the heat released during a biomolecular binding event and obtaining of a direct measure of binding affinity and thermodynamics parameters. The sample cell was filled with protein solution (200 μL, 6× 10⁻⁶ M) whereas the syringe released an aliquot of ligand (2 μL, 1.4× 10⁻⁶ M) every 150 s to perform the titration. Kd values were measured with a MicroCal PEAQ-ITC and ITC200 (Malvern). The titration curve of kcalmor–1 versus molar ratio (ligand/sample) was obtained by sampling the heat pulse generated after every injection of 2 μL aliquot, integrating with respect to time and normalizing for concentration. The Kd values were determined by fitting the thermodynamics data for the binding enthalpy (ΔH) during titration. From this fitting the free energy of binding (ΔG) and the variation of entropy (ΔS) could be estimated. Thermodynamics data were elaborated with MicroCal PEAQ-ITC Analysis Software. In this study the stoichiometry parameter n was set to 1 in view of the 1:1 glycan/ AT ratio.
NMR:
NMR spectra were recorded at 303 K with a Bruker Avance III spectrometer operating at 600.13 MHz and equipped with a high-sensitivity 5 mm TCI cryoprobe. Samples were lyophilized twice to remove residual solvents and were then dissolved in phosphate buffer (10 mM, 220 μL), NaCl (pH 7.4, 0.5 M) and EDTA (3mM) in D2O (99.996%) and placed in 3 mm NMR tubes. For the experiments involving free ligands, the samples were prepared to obtain a final concentration of 1.2× 10⁻³ M by dissolving hexasaccharide (500 μg) in phosphate buffer. Proton spectra were recorded with water presaturation with a recycle delay of 12 s and 16 scans. HSQC (heteronuclear single quantum coherence) experiments were performed in phase-sensitivity-enhanced pure-absorption mode by using 16 dummy scans, four scans with decoupling during acquisition period and 2.5 s relaxation delay. The matrix size of 2048 × 128 datapoints was increased to 4096× 1024 by linear prediction and zero-filling.
2D homonuclear correlation COSY experiments were obtained in phase sensitivity mode with use of eight scans with water presaturation during acquisition. The matrix size of 2048× 128 data points was zero-filled to 2048× 1024. Bidimensional TOCSY data were acquired by use of eight scans per increment of 1024×320 data-points with zero-filling in F1 (2048× 1024). HSQC spectra were obtained in phase-sensitivity-enhanced pure-absorption mode with decoupling in the acquisition period. The matrix size of 2048× 128 data points was zero-filled to 4096×1024.
For the tr-NOE experiments the samples were prepared by dissolving AT (1.61 mg) and hexasaccharide (250 μg) in phosphate buffer, reaching a molar ratio of AT/hexasaccharide 1:5. All bidimensional NOESY and tr-NOESY experiments were performed at 303 and 308 K, respectively, in order to observe suitable ligand exchange upon binding. A total of 16 scans was collected for each free induction decay (matrix 2048×320 points), the data were zero-filled to 2048× 1024 points before Fourier transformation, and mixing time values of 200, 300 and 500 ms were used.
1H-STD experiments involving hexasaccharide-AT interaction were prepared so that the final protein concentration was 6.3× 10⁻⁶ m with a ligand/AT molar ratio of 100:1. To remove broad resonances of protein, the pulse sequence used for monodimensional 1H-STD experiments includes a 10 ms spin-lock pulse. The on-resonance irradiation was performed at the high-field protein resonances (548 Hz) whereas the off-resonance control irradiation was performed at 644000 Hz. The 1H-STD spectrum was obtained by phase cycling subtraction of the on-resonance and off-resonance data acquired in interleaved mode. The numbers of scans and dummy scans were 128 and 32, respectively, with a recycle delay of 8 s and saturation times of 1, 1.5 and 3 s.
MD simulation:
Atomic-scale models for hexa-4 and hexa-8 in free and AT-bound states were built with use of the “state-of-the-art“ GLYCAM06 Force Field,[27] whereas AT was described by use of the Amber Force Field.[28] Explicit solvent TIP3P water models were used in all cases.[29] The parameters of the terminal 4-nitrophenyl residue at the reducing end of each of the glycans were obtained from Amber parameters and added to the GLYCAM06 Force Field. The partial charges of this residue were calculated after geometry optimization with the quantum chemical software General Atomic and Molecular Electronic Structure System (GAMESS)[30] and use of the HF/6–31G* level of theory, whereas the Restrained Electrostatic Potential (RESP) method was applied for charge determination as in GLYCAM06. Ambertools 1.4[29] was used to build the parameters and topology files for MD simulation. The initial conformation of the free-state hexasaccharides was given as per previous studies on heparin-like oligosaccharides,[6,31] The initial dihedrals for the glycosidic linkages—GlcNS6S-GlcA, GlcA-GlcNS3S6S, GlcNS3S6S-IdoA2S/IdoA, IdoA2S/IdoA-GlcNS6S”, GlcNS6S”-GlcA” and GlcA”-(4-nitrophenyl)—were defined as –49/–14, 59/–6, –59/–26, 57/11, –59/–26, 50, in that order. The conformation of each residue was 4C1 chair for GlcNS6S, GlcNS3S6S and GlcA, whereas the IdoA2S and IdoA were set in 2S0 and 1C4 conformations for hexa-4 and hexa-8 in the free state. In fact, in accordance with Hsieh et al.[18] and Ferro etal.,[14] hexa-4 and hexa-8 showed IdoA2S and IdoA conformation dominated by 2S0 and 1C4 respectively. Differently, in the AT-bound state the IdoA2S and IdoA residues of hexa-4 and hexa-8 were set in the 2S0 conformation consistently with the tr-NOE results. The AT model was built by using the 3D structure of the L chain (Latent AT) in PDB ID: 1AZX. The specific pentasaccharide sequence AGA*IA defined the initial glycosidic linkage conformations and positions for hexa-4 and hexa-8 in the AT-bound state. The L chain rather than the I chain (inhibitory AT) was used to model AT, because the initial idea was to reproduce the glycan AT complex at early time instants of the interaction. This was justified because contacts between AGA*IA and AT HBS do not change significantly during AT conformational rearrangement.[3] Before MD simulation the values of glycosidic linkage dihedrals in hexa-4·AT and hexa-8·AT—GlcNS6S-GlcA, GlcA-GlcNS3S6S, GlcNS3S6S-IdoA2S/IdoA, IdoA2S/IdoA-GlcNS6S”, GlcNS6S”-GlcA”, and GlcA”-(4-nitrophenyl)—were set up as –31/–35, 41/1, –71/ –33, 44/16, –59/–26, 50. The missing amino acids between 26 and 38 (1AZX sequence numbering) were added by molecular editing, using as template the 3D structure of the corresponding sequence in PDB ID 1E03, in which only amino acids 27–31 are missing. These last missing residues were then included by molecular editing (MAESTRO 9.8 graphical interface), with adjustment of the polypeptide dihedral angles ϕ/ψ until the two terminals matched. Hexa-4 and hexa-8 were superposed on the AGA*IA sequence (1AZX) by matching the H1 positions of GlcA, GlcNS3S6S and IdoA2S/IdoA, achieving a RMSD of 1.74 Å. The simulation cell was set by enveloping each macromolecule with a water layer 15 Å wide in the three directions, resulting in an orthogonal cell with edge lengths of approximately 100 Å. For the non-bonding potential energy the standard cut-off technique (12 Å) was applied for both electrostatic and dispersive interactions. Each cell was minimized by use of 100 K steps of the default minimization algorithm included in the NAMD2.12 simulation engine.[32] The MD simulations were run by sampling the constant number of particles, pressure and temperature (NPT) ensemble for the whole length, even though cell density equilibration required approximately 3 ns. The simulation temperature was set at 300 K and maintained with a Lowe-Andersen thermostat as implemented in NAMD 2.12, where-as the Nosé-Hoover-Langevin piston algorithm controlled the pressure (1.01325 bar) applied on the cell walls. During the cell density equilibration steps (3 ns), a harmonic potential energy restraint was applied (harmonic constant of 5 kcalmol–1) to all atoms of the complex, whereas water molecules were allowed to move freely. The total length of the MD simulations were 100 ns and 270–260 ns for both glycans in the free state and in the AT-bound state, respectively. The glycan-AT complex relaxation could be visualized by plotting the RMSD distance between the two glycans upon superposition of the A helix of AT (Cα backbone, between amino acids 45 and 70). The ligands’ RMSD showed oscillation behaviour that decreased after 80–120 ns (approximately), indicating a convergence to relative “more relaxed” distances (Figure S1).
The RMSDs reported in Table 5 correspond to average values calculated between residue pairs of the sequence (AGA*IA), which is common to hexa-4·AT, hexa-8·AT and AGA*IA-AT after A helix super-position. This analysis involves the set of hexasaccharide-AT complexes validated by the tr-NOEs, and corresponds to geometries at instant times of 209, 227, 240, 257 and 270 ns for hexa-4·AT and of 214, 235, 243 and 258 ns for hexa-8·AT. The five hexa-4·AT and the four hexa-8·AT complexes were superposed through the Cα backbone of the A helix (45 to 70 amino acids in 1AZX sequence), and the corresponding average RMSD values are reported in the second column of Table 5. The residue ring atoms C1, C2, C3, C4, C5 and O5 were used for the RMSD calculation.
NOE simulation (NOEPROM):
Intra-residue and inter-glycosidic NOEs were simulated by using NOEPROM software[33] with the isotropic model of motion; the single correlation times (tc = 700 ps) were estimated by matching the simulated H1-H2 intra-residue NOEs of the glucosamines with the corresponding experimental values. The hexa-4 and hexa-8 geometries were obtained at the end of the MD simulations by adjusting the ϕ/ψ glycosidic dihedrals with the averages calculated on the MD simulation trajectories after a relaxation period of 40 ns. The selected simulated and experimental inter-glycosidic NOEs are reported in Table S3.
tr-NOE simulation (CORCEMA):
The tr-NOE simulation applied CORCEMA software[21] to hexa-4·AT and hexa-8·AT complex geometries selected from the MD simulation, after a relaxation time of between 80 and 120 ns. A “two-state” model for the interaction, in which no significant conformational changes are predicted for the AT HBS, was used. The kinetics parameters were estimated by matching the H1–H2 intra-residue tr-NOEs of the glucosamines residues, with use of trial values from previous experiments involving octasaccharide-AT complexes.[31] The kinetic parameters for hexa-4 were set to koff = 18s–1 and kon = 3.27 × 10⁷ m–1s–1; for hexa-8 they were koff = 15 s—1 and kon = 2.68 × 10⁶ M–1s–1. From these kinetic constants, the corresponding thermodynamic dissociation constants (Kd) were 5.5× 10⁻⁷ and 5.6× 10⁻⁶ M for hexa-4·AT and hexa-8·AT, respectively, in accordance with the ITC-estimated values. The initial concentration of both hexa-4 and hexa-8 was 5.84× 10⁻⁴ M with a glycan-AT (L/E) ratio of 5:1; the total AT concentration for both tr-NOE experiments was Etot = 1.12× 10⁻⁴ M. The equilibrium concentrations of the AT in hexa-4·AT and hexa-8·AT tr-NOE experiments were 1.10× 10⁻⁷ and 1.11 × 10⁻⁶ M respectively. Finally, the estimated time decay constants for the CORCEMA simulation were τE = 5.48 × 10⁻⁵s–1, τL* = 0.278 s–1 and τEL =0.0556 s–1 for hexa-4·AT and τE = 6.69 × 10⁻⁴s–1, τL* = 0.337 s–1 and τEL =0.0667 s–1 for hexa-8·AT. The agreement between the theoretical and experimental tr-NOEs was evaluated by calculating the fitting quality parameter R factors as defined in Equation (1).
| (1) |
R factor values higher than 0.3 are indicative of a poor local structure description.
Supplementary Material
Acknowledgements
The authors warmly thank Dr. Maurice Petitou for critical reading of the manuscript and useful discussion and Anthony Devlin for manuscript revision. The authors are also very thankful to Dr. S. Bertini for the critical discussion of ITC results and to Prof. R. J. Woods and Dr. D. F. Thieker for the GLYCAM06 parameters of the iduronic acid residue in both 2-O-sulfated and -unsulfated states.
Footnotes
Supporting information and the ORCID identification numbers for the authors of this article can be found under https://doi.org/10.1002/cbic.201800095.
Conflict of Interest
The authors declare no conflict of interest.
References
- [1].Gray E, Hogwood J, Mulloy B in Heparin—A Century of Progress, 1st ed (Eds.: Lever R, Mulloy B, Page CP), Springer, Berlin, 2012, p. 43. [Google Scholar]
- [2].Casu B in Chemistry and Biology of Heparin and Heparan Sulphate, 1st ed (Eds.: Garg HG, Linhardt RJ, Hales CA), Elsevier, Oxford, 2005, pp. 1–28. [Google Scholar]
- [3].Jin L, Abrahams JP, Skinner R, Petitou M, Pike RN, Carrell RW, Proc. Natl. Acad. Sci. USA 1997, 94, 14683–14688. [DOI] [PMC free article] [PubMed] [Google Scholar]
- [4].Hricovini M, Guerrini M, Bisio A, Torri G, Petitou M, Casu B, Biochem. J. 2001, 359, 265–272. [DOI] [PMC free article] [PubMed] [Google Scholar]
- [5].Hricovini M, Guerrini M, Bisio A, Eur. J. Biochem. 1999, 261, 789–801. [DOI] [PubMed] [Google Scholar]
- [6].Guerrini M, Guglieri S, Casu B, Torri G, Mourier P, Boudier C, Viskov C, J. Biol. Chem. 2008, 283, 26662–26675. [DOI] [PMC free article] [PubMed] [Google Scholar]
- [7].Johnson DJ, Li W, Adams TE, Huntington JA, EMBO J. 2006, 25, 2029–2037. [DOI] [PMC free article] [PubMed] [Google Scholar]
- [8].Viskov C, Elli S, Urso E, Gaudesi D, Mourier P, Herman F, Boudier C, Casu B, Torri G, Guerrini M, J. Biol. Chem. 2013, 288, 25895–25907. [DOI] [PMC free article] [PubMed] [Google Scholar]
- [9].Petitou M, Barzu T, Herault JP, Herbert JM, Glycobiology 1997, 7, 323–327. [DOI] [PubMed] [Google Scholar]
- [10].Desai UR, Petitou M, Björk I, Olson ST, J. Biol. Chem. 1998, 273, 7478–7487. [DOI] [PubMed] [Google Scholar]
- [11].van Boeckel CAA, Petitou M, Angew. Chem. Int. Ed. Engl. 1993, 32, 1671–1818; Angew. Chem. 1993, 105, 1741 −1761. [Google Scholar]
- [12].a) van Boeckel CAA, Grootenhuis PDJ, Visser A, Nat. Struct. Biol. 1994, 1, 423–425; [DOI] [PubMed] [Google Scholar]; b) Grootenhuis PDJ, van Boeckel CAA, J. Am. Chem. Soc. 1991, 113, 2743–2747. [Google Scholar]
- [13].Guerrini M, Mourier PAJ, Torri G, Viskov C, Glycoconjugate J. 2014, 31, 409–416. [DOI] [PubMed] [Google Scholar]
- [14].Ferro DR, Provasoli A, Ragazzi M, Torri G, Casu B, Gatti G, Jac-quinet JC, Sinay P, Petitou M, Choay J, J. Am. Chem. Soc. 1986, 108, 6773–6778. [Google Scholar]
- [15].Ferro DR, Provasoli A, Ragazzi M, Casu B, Torri G, Bossennec V, Perly B, Sinay P, Petitou M, Choay J, Carbohydr. Res. 1990, 195, 157–167. [DOI] [PubMed] [Google Scholar]
- [16].Das SK, Mallet JM, Esnault J, Driguez PA, Duchaussoy P, Sizun P, Hérault JP, Hérbert JM, Petitou M, Sinay P, Angew. Chem. Int. Ed. 2001, 40, 1670–1673; Angew. Chem. 2001, 113, 1723–1726. [PubMed] [Google Scholar]
- [17].Muñoz-García JC, López-Prados J, Angulo J, Díaz-Contreras I, Reichardt N, de Paz JL, Martin-Lomas M, Nieto PM, Chem. Eur. J. 2012, 18, 16319–16331. [DOI] [PubMed] [Google Scholar]
- [18].Hsieh PH, Thieker DF, Guerrini M, Woods RJ, Liu J, Sci. Rep. 2016, 6, 29602. [DOI] [PMC free article] [PubMed] [Google Scholar]
- [19].Xu Y, Masuko S, Takieddin M, Xu H, Liu R, Jing J, Mousa SA, Lin-hardt RJ, Liu J, Science 2011, 334, 498–501. [DOI] [PMC free article] [PubMed] [Google Scholar]
- [20].Mayer M, Meyer B, Angew. Chem. Int. Ed. 1999, 38, 1784–1788; Angew. Chem. 1999, 111, 1902–1906. [DOI] [PubMed] [Google Scholar]
- [21].Moseley HN, Curto EV, Krishna NR, J. Magn. Reson. Ser. B 1995, 108, 243–261. [DOI] [PubMed] [Google Scholar]
- [22].Johnson DJD, Langdown J, Huntington JA, Proc. Natl. Acad. Sci. USA 2010, 107, 645–650. [DOI] [PMC free article] [PubMed] [Google Scholar]
- [23].Olson ST, Björk I, Bock SC, Trends Cardiovasc. Med. 2002, 12, 198–205. [DOI] [PubMed] [Google Scholar]
- [24].McCoy AJ, Pei XY, Skinner R, Abrahams JP, Carrell RW, J. Mol. Biol. 2003, 326, 823–833. [DOI] [PubMed] [Google Scholar]
- [25].Johnson DJD, Huntington JA, Biochemistry 2003, 42, 8712–8719. [DOI] [PubMed] [Google Scholar]
- [26].Petitou M, Lormeau JC, Choay J, Eur. J. Biochem. 1988, 176, 637–640. [DOI] [PubMed] [Google Scholar]
- [27].Kirschner KN, Yongye AB, Tschampel SM, Gonzalez-Outeirino J, Daniels CR, Foley BL, Woods RJ, J. Comput. Chem. 2008, 29, 622–655. [DOI] [PMC free article] [PubMed] [Google Scholar]
- [28].Case DA, Darden TA, Cheatham TE, Simmerling CL, Wang J, Duke RE, Luo R, Walker RC, Zhang W, Merz KM, Roberts BP, Wang B, Hayik S, Roitberg A, Seabra G, Kolossvai I, Wong KF, Paesani F, Vanicek J, Liu J, Wu X, Brozell SR, Steinbrecher T, Gohlke H, Cai Q, Ye J, Wang J, Hsieh MJ, Cui G, Roe DR, Mathews DH, Seetin MG, Sagui C, Babin V, Luchko T, Gusarov S, Kovalenko A, Kollman PA, AMBER 11, University of California, San Francisco, 2010. [Google Scholar]
- [29].Jorgensen WL, Chandrasekhar J, Madura JD, J. Chem. Phys. 1983, 79, 926–935. [Google Scholar]
- [30].Schmidt MW, Baldridge KK, Boatz JA, Elbert ST, Gordon MS, Jensen JH, Koseki S, Matsunaga N, Nguyen KA, Su S, Windus T, Dupuis M, Montgomery JAJ, Comput. Chem. 1993, 14, 1347–1363. [Google Scholar]
- [31].Guerrini M, Elli S, Gaudesi D, Torri G, Casu B, Mourier P, Herman F, Boudier C, Lorenz M, Viskov C, J. Med. Chem. 2010, 53, 8030–8040. [DOI] [PubMed] [Google Scholar]
- [32].Phillips JC, Braun R, Wang W, Gumbart J, Tajkhorshid E, Villa E, Chipot C, Skeel RD, Kale L, Schulten K, J. Comput. Chem. 2005, 26, 1781–1802. [DOI] [PMC free article] [PubMed] [Google Scholar]
- [33].Martin-Pastor M, NOEPROM, 2005. [Google Scholar]
Associated Data
This section collects any data citations, data availability statements, or supplementary materials included in this article.


