

Abstract
Astrocytes are critical regulators of neuroinflammation in multiple sclerosis (MS) and its animal model experimental autoimmune encephalomyelitis (EAE). Growing evidence indicates that ubiquitination of signaling molecules is an important cell‐intrinsic mechanism governing astrocyte function during MS and EAE. Here, we identified an upregulation of the deubiquitinase OTU domain, ubiquitin aldehyde binding 1 (OTUB1) in astrocytes during MS and EAE. Mice with astrocyte‐specific OTUB1 ablation developed more severe EAE due to increased leukocyte accumulation, proinflammatory gene transcription, and demyelination in the spinal cord as compared to control mice. OTUB1‐deficient astrocytes were hyperactivated in response to IFN‐γ, a fingerprint cytokine of encephalitogenic T cells, and produced more proinflammatory cytokines and chemokines than control astrocytes. Mechanistically, OTUB1 inhibited IFN‐γ‐induced Janus kinase (JAK)/signal transducer and activator of transcription (STAT) signaling by K48 deubiquitination and stabilization of the JAK2 inhibitor suppressor of cytokine signaling 1 (SOCS1). Thus, astrocyte‐specific OTUB1 is a critical inhibitor of neuroinflammation in CNS autoimmunity.
Keywords: astrocyte, experimental autoimmune encephalomyelitis, multiple sclerosis, neuroinflammation, OTUB1, ubiquitination
Subject Categories: Immunology, Neuroscience
Introduction
Multiple sclerosis (MS) and its animal model experimental autoimmune encephalomyelitis (EAE) are autoimmune diseases of the central nervous system (CNS) characterized by infiltration of inflammatory cells, demyelination, and axonal damage. Interferon (IFN)‐γ‐producing T helper (Th)1, interleukin (IL)‐17‐producing Th17, and granulocyte‐macrophage colony‐stimulating factor (GM‐CSF)‐producing CD4+ T cells are shown to be key mediators of EAE, and all of them can induce EAE individually (Stromnes et al, 2008; Domingues et al, 2010; Codarri et al, 2011). Upon immunization with myelin oligodendrocyte glycoprotein (MOG) peptide, myelin‐reactive T cells are primed in lymphatic organs and enter the subarachnoid/perivascular space through the choroid plexus or the leptomeningeal vessels (wave 1), where they are reactivated by antigen‐presenting cells including dendritic cells and macrophages (Engelhardt & Sorokin, 2009; Engelhardt et al, 2016). Subsequently, T cells undergo clonal expansion and produce proinflammatory cytokines, including IFN‐γ, IL‐17, and tumor necrosis factor (TNF), which stimulate CNS‐resident cells. Activated astrocytes produce large amounts of leukocyte‐recruiting chemokines and cytokines leading to an explosive recruitment of leukocytes to the CNS (wave 2) that is associated with clinical EAE onset and demyelination (Sofroniew, 2015).
In astrocytes, IL‐17‐ and TNF‐induced NF‐κB activation and IFN‐γ‐mediated JAK‐STAT1 signaling are crucial for proinflammatory gene induction and EAE development. Astrocyte‐specific overexpression of the NF‐κB inhibitor IκBα‐dn or deletion of pivotal molecules of NF‐κB and JAK‐STAT1 signaling pathways including Act1, IKK2, NEMO, and IFN‐γR, respectively, ameliorates EAE (van Loo et al, 2006; Brambilla et al, 2009; Kang et al, 2010; Ding et al, 2015). Of note, activation of NF‐κB and JAK‐STAT1 signaling is tightly controlled by ubiquitination. Ubiquitination is an important posttranslational modification in which ubiquitin, a protein consisting of 76 amino acids, is covalently attached to target proteins (Mevissen & Komander, 2017). Ubiquitination is catalyzed by a cascade of three different ubiquitinating enzymes: ubiquitin‐activating enzymes (E1s), ubiquitin‐conjugating enzymes (E2s), and ubiquitin ligases (E3s; Deshaies & Joazeiro, 2009). Ubiquitination of a substrate can be implemented by either single ubiquitin molecules (monoubiquitination or multi‐monoubiquitination) or a chain of polyubiquitin molecules (polyubiquitination), which are covalently linked by one of the seven lysine residues, i.e., K6, K11, K27, K29, K33, K48, and K63. Another type of polyubiquitination, the linear polyubiquitination, is generated via linkage between the carboxyl group of an ubiquitin molecule and an N‐terminal Met residue of another ubiquitin monomer (Hrdinka & Gyrd‐Hansen, 2017). Functionally, ubiquitination was initially identified as a mechanism for protein degradation. However, it also participates in non‐degradative cellular activities including membrane trafficking, endocytosis, and, in particular, signal transduction. K48 polyubiquitination triggers the degradation of target proteins by the 26S proteasome. In contrast, linear and K63 polyubiquitination is required for the activation of multiple signaling molecules and pathways (Hu & Sun, 2016).
Ubiquitination is a reversible process and can be counter‐regulated by deubiquitinating enzymes (DUBs; Mevissen & Komander, 2017). Previously, we have shown that A20, a DUB belonging to the ovarian tumor domain protease family, inhibits EAE by suppressing proinflammatory gene production in astrocytes (Wang et al, 2013a). OTU domain, ubiquitin aldehyde binding 1 (OTUB1), another DUB of the ovarian tumor domain protease family, can reduce both K48 and K63 polyubiquitination, although it has a preference for K48 polyubiquitin chains (Edelmann et al, 2009). OTUB1 regulates various signaling pathways by deubiquitinating and stabilizing multiple molecules including c‐IAP1, SMAD2/3, p53, MDMX, FOXM1, and YB‐1 (Sun et al, 2012; Goncharov et al, 2013; Herhaus et al, 2013; Dong et al, 2015; Wang et al, 2016; Chen et al, 2017). A recent study showed that OTUB1 increases Tau stability by removing K48‐linked polyubiquitin chains from this protein in neurons (Wang et al, 2017a). However, so far, the function of OTUB1 in CNS autoimmune disease has not been studied.
Here, we demonstrate that astrocytes upregulate OTUB1 protein expression in MS and EAE. To decipher the role of astrocyte‐derived OTUB1 in EAE, we generated conditional GFAP‐Cre OTUB1fl/fl mice that are specifically deficient of OTUB1 in astrocytes. As compared to OTUB1fl/fl mice, GFAP‐Cre OTUB1fl/fl mice developed significantly more severe EAE, which was caused by increased proinflammatory gene production in OTUB1‐deficient astrocytes. We further demonstrate that OTUB1 inhibited IFN‐γ‐induced JAK‐STAT1 signaling in astrocytes by K48 deubiquitination and stabilization of SOCS1, a key inhibitor of JAK‐STAT1 signaling. Thus, the present study identifies OTUB1 as a key regulator of astrocyte activation, further stressing the decisive role of astrocytes in the development of CNS autoimmunity.
Results
OTUB1 expression is induced in astrocytes during MS
Several studies have demonstrated the regulation of important signaling pathways by OTUB1 in vitro, but the in vivo function of OTUB1 is largely unknown. To decipher a potential function of OTUB1 in vivo in CNS autoimmunity, we first analyzed OTUB1 protein expression in white matter brain biopsy tissue of treatment‐naïve MS patients by immunohistochemistry. Interestingly, in all of 10 MS cases (Table EV1) analyzed, activated astrocytes adjacent to inflammatory demyelination expressed OTUB1 in the nucleus and cytoplasm (Fig 1A and B). Some oligodendrocytes also expressed OTUB1 (Fig EV1A), whereas neurons were absent from the white matter biopsy tissue. Since brain biopsy tissue from healthy individuals is not available for comparison, we studied the peritumoral area of three brain biopsies from patients with astrocytoma (WHO grade II; Table EV1) for OTUB1 expression. In contrast to neurons, resting and activated astrocytes located in the peritumoral brain tissue did not express OTUB1 (Fig EV1B).
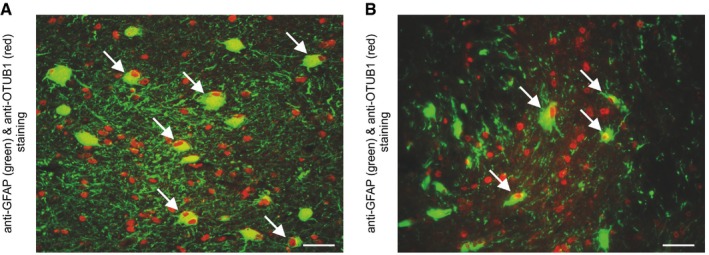
Figure 1. Upregulation of OTUB1 in astrocytes in MS lesions.
-
A, BActivated GFAP+ astrocytes in white matter MS lesions with inflammatory infiltrates and demyelination show an upregulation of OTUB1 (arrows). Photomicrographs are obtained from case 9 (A) and case 5 (B) listed in Table EV1. Data are representative for all 10 MS patients analyzed. Double immunofluorescence with rabbit anti‐OTUB1 (Cy3) and mouse anti‐GFAP (FITC); original magnification ×400; scale bars correspond to 50 μm.
Figure EV1. Single oligodendrocytes express OTUB1 in MS, while astrocytes do not express OTUB1 in the peritumoral tissue of astrocytoma.
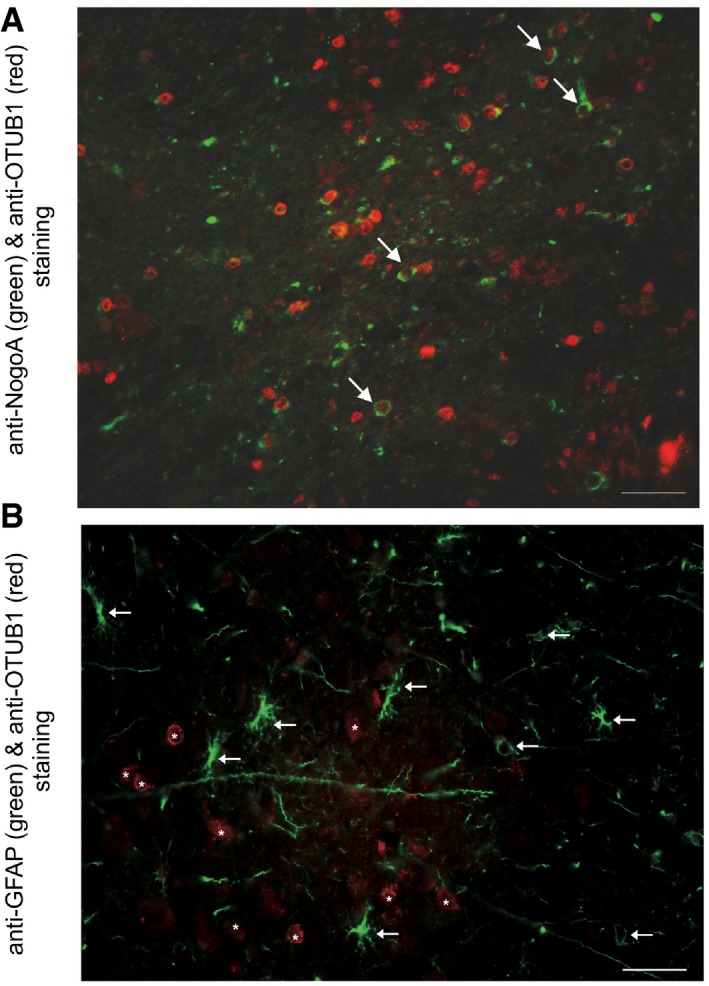
- NogoA+ oligodendrocytes in a white matter MS lesion (case 5, Table EV1) with inflammatory infiltrates and demyelination express OTUB1 (arrows). This pattern is representative for all 10 patients analyzed. Double immunofluorescence with rabbit anti‐OTUB1 (Cy3) and mouse anti‐NogoA (Alexa Fluor 488); original magnification ×400; scale bar corresponds to 50 μm.
- In the gray matter and the subcortical region adjacent to an astrocytoma (WHO grade II), GFAP+ astrocytes do not express OTUB1 (arrows). Neurons are OTUB1‐positive (asterisks). Data are representative for three cases of peritumoral tissue of astrocytomas (WHO grade II). Double immunofluorescence with mouse anti‐GFAP (FITC) and rabbit anti‐OTUB1 (Cy3); original magnification ×400; scale bar corresponds to 50 μm.
To study the in vivo function of OTUB1, we generated OTUB1fl/fl mice, in which exons 2 and 3 of OTUB1 were flanked by LoxP sites (Appendix Fig S1A). OTUB1fl/fl mice were crossed with Rosa26‐Cre mice to delete OTUB1 in all cells and with Nestin‐Cre mice to delete OTUB1 in neuroectodermal cells including astrocytes, neurons, and oligodendrocytes. Of note, mice lacking OTUB1 in all cells or only in neuroectodermal cells were embryonic lethal (Appendix Fig S1B and C). To further study the function of OTUB1 in the CNS, we selectively deleted OTUB1 in astrocytes. In these GFAP‐Cre OTUB1fl/fl mice, OTUB1 expression in astrocytes was efficiently removed (Fig 2A and B). These mice were born in a normal Mendelian ratio and reached adulthood without obvious CNS defects including a normal myelination in the brain and spinal cord (Fig 2C). In addition, OTUB1 deletion in astrocytes did not result in spontaneous neuroinflammation and preserved the low numbers of leukocytes in the CNS (Figs 2D and E, and EV2A). Furthermore, astrocytic OTUB1‐deficiency did not alter the composition of major leukocyte populations in the lymph node and spleen (Fig EV2B and C).
Figure 2. Characterization of astrocyte‐specific OTUB1 knockout mice.
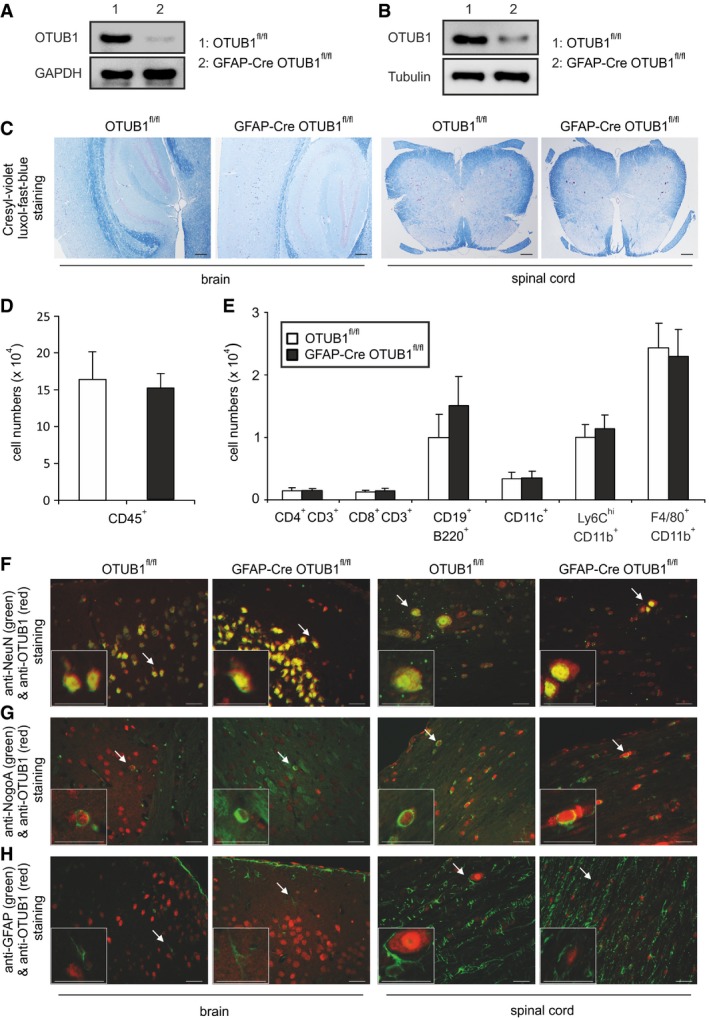
- WB analysis of OTUB1 expression in cultured primary astrocytes from OTUB1fl/fl and GFAP‐Cre OTUB1fl/fl mice.
- Direct ex vivo WB analysis of OTUB1 expression in astrocytes isolated from adult OTUB1fl/fl and GFAP‐Cre OTUB1fl/fl mice.
- Normal CNS architecture in OTUB1fl/fl and GFAP‐Cre OTUB1fl/fl mice. Myelination is normal in the brain and spinal cord of an OTUB1fl/fl and a GFAP‐Cre OTUB1fl/fl mouse. CV‐LFB staining; original magnification ×50; scale bars correspond to 100 μm. All photographs are representative of three mice per group.
- Absolute numbers of CD45+ cells in the spinal cord of OTUB1fl/fl and GFAP‐Cre OTUB1fl/fl mice (n = 5 for both groups, mean + SEM).
- Absolute numbers of different subpopulations of leukocytes infiltrating the spinal cord of OTUB1fl/fl and GFAP‐Cre OTUB1fl/fl mice were analyzed by flow cytometry (n = 5 for both groups, mean + SEM).
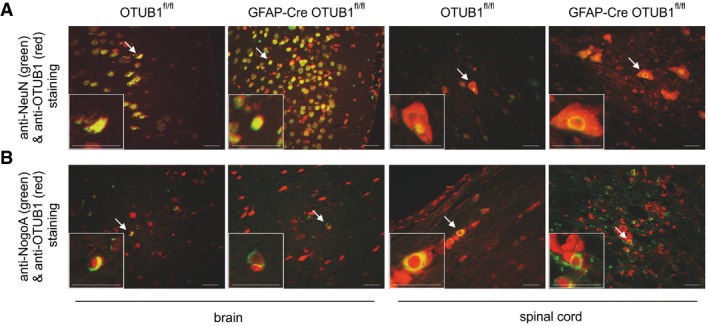
- In an OTUB1fl/fl and a GFAP‐Cre OTUB1fl/fl mouse, OTUB1 is strongly expressed by NeuN+ neurons in the brain and spinal cord. Double immunofluorescence with rabbit anti‐OTUB1 (Cy3) and mouse anti‐NeuN (FITC).
- Single NogoA+ oligodendrocytes in the brain and spinal cord (arrows) of an OTUB1fl/fl and a GFAP‐Cre OTUB1fl/fl mouse express OTUB1. Double immunofluorescence with rabbit anti‐OTUB1 (Cy3) and mouse anti‐NogoA (Alexa Fluor 488).
- GFAP+ astrocytes are of normal morphology and distribution in the brain and spinal cord of a non‐immunized OTUB1fl/fl mouse and a GFAP‐Cre OTUB1fl/fl mouse. Note that GFAP+ astrocytes of an OTUB1fl/fl mouse do not express OTUB1. GFAP+ astrocytes of a GFAP‐Cre OTUB1fl/fl mouse are also OTUB1‐negative and represent a negative control for OTUB1 staining. Double immunofluorescence with rabbit anti‐OTUB1 (Cy3) and mouse anti‐GFAP (FITC).
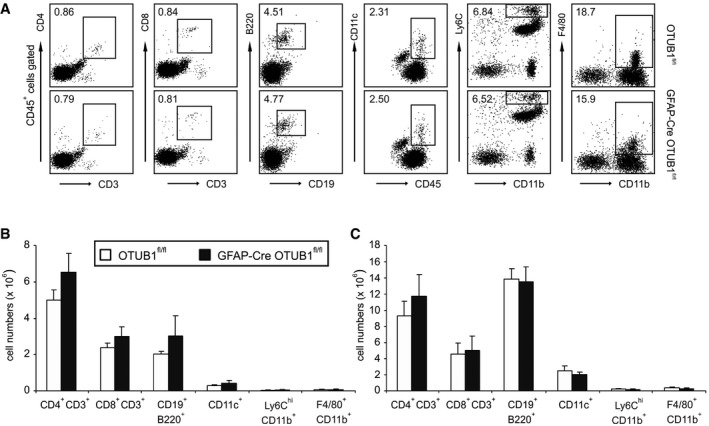
Figure EV2. Normal composition of leukocytes in GFAP‐Cre OTUB1fl/fl mice.
-
ACD45+ leukocytes were isolated from the spinal cord of GFAP‐Cre OTUB1fl/fl mice and control mice by Percoll gradients. The percentages of CD4+ T cells (CD4+ CD3+), CD8+ T cells (CD8+ CD3+), B cells (CD19+ B220+), dendritic cells (CD11c+), inflammatory monocytes (Ly6Chigh CD11b+), and macrophages (F4/80+ CD11b+) were analyzed by flow cytometry. Representative dot plots are shown.
-
B, CCD45+ leukocytes were isolated from the lymph node (B) and spleen (C) of GFAP‐Cre OTUB1fl/fl mice (n = 4) and control mice (n = 4). Cells were counted with the hemocytometer and analyzed by flow cytometry. Data show the absolute number of indicated cell populations (mean + SEM).
A detailed morphological analysis of OTUB1fl/fl and GFAP‐Cre OTUB1fl/fl mice revealed that (i) OTUB1 was expressed by NeuN+ neurons and single Nogo2A+ oligodendrocytes in the normal brain and spinal cord of both mouse strains and (ii) neurons and oligodendrocytes were morphologically normal in GFAP‐Cre OTUB1fl/fl mice (Fig 2F and G). Noteworthy, astrocytes of OTUB1fl/fl and GFAP‐Cre OTUB1fl/fl mice were of normal morphology and distribution throughout the brain and spinal cord as assessed by their regular GFAP expression and OTUB1fl/fl astrocytes consistently lacked OTUB1 expression (Fig 2H).
Ablation of OTUB1 in astrocytes aggravates EAE
Since OTUB1 regulates immunologically important signaling pathways (Li et al, 2010; Goncharov et al, 2013; Herhaus et al, 2013; Peng et al, 2014) and was strongly expressed in activated astrocytes of MS lesions (Fig 1A and B), we investigated its expression and function in astrocytes after EAE induction. Upon immunization with MOG35–55 peptide and a pertussis toxin boost, OTUB1 expression was induced in activated spinal cord astrocytes of OTUB1fl/fl mice but not of GFAP‐Cre OTUB1fl/fl mice at day 15 p.i. (Fig 3A). At this stage of EAE, both strains of mice harbored large inflammatory infiltrates in the spinal cord (Fig 3B). At later stages of EAE, i.e., day 22 p.i., OTUB1 expression in astrocytes strongly declined in OTUB1fl/fl mice and, as expected, remained negative in GFAP‐Cre OTUB1fl/fl mice (Fig 3C). Interestingly, inflammation regressed in parallel in OTUB1fl/fl mice as indicated by the reduced leukocyte infiltration and demyelination, whereas inflammatory infiltrates and demyelination persisted in GFAP‐Cre OTUB1fl/fl mice (Fig 3D). In contrast to the upregulation of OTUB1 expression in astrocytes, OTUB1 expression of NeuN+ neurons and NogoA+ oligodendrocytes remained unchanged in both OTUB1fl/fl and GFAP‐Cre OTUB1fl/fl mice (Fig EV3A and B).
Figure 3. Upregulation of OTUB1 in astrocytes limits EAE severity.
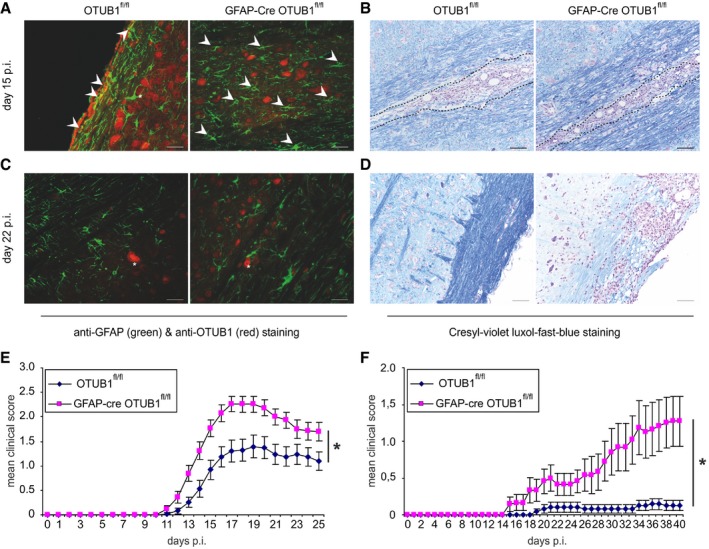
- Activated GFAP+ astrocytes in the spinal cord upregulate OTUB1 in EAE at maximal disease activity (day 15 p.i.) in an OTUB1fl/fl mouse (arrowheads), but not in a GFAP‐Cre OTUB1fl/fl mouse. Note the OTUB1‐expressing neuron in an OTUB1fl/fl mouse which is surrounded by GFAP‐expressing processes of an activated astrocyte (asterisk).
- Inflammatory infiltrates in the spinal cord (encircled by a dotted line) of an OTUB1fl/fl and GFAP‐Cre OTUB1fl/fl mouse at day 15 p.i.
- At day 22 p.i., astrocytes have downregulated OTUB1 expression while neurons express OTUB1 in an OTUB1fl/fl mouse (asterisk). Astrocytes in a GFAP‐Cre OTUB1fl/fl mouse are OTUB1‐negative while neurons express OTUB1 (asterisk).
- At day 22 p.i., demyelination in a GFAP‐Cre OTUB1fl/fl mouse is much more severe and extended as compared to an OTUB1fl/fl mouse. Inflammation persists in the GFAP‐Cre OTUB1fl/fl mouse, whereas it has resolved in an OTUB1fl/fl mouse.
- EAE was induced in GFAP‐Cre OTUB1fl/fl mice (n = 29) and OTUB1fl/fl control littermates (n = 29) by MOG35–55 peptide immunization with pertussis toxin. Graph represents data pooled from four experiments with seven to eight mice per group and shows the mean clinical scores ± SEM. Statistical analysis was performed using Mann–Whitney U‐test; *P < 0.05.
- EAE was induced in GFAP‐Cre OTUB1fl/fl mice (n = 12) and OTUB1fl/fl control littermates (n = 12) by MOG35–55 peptide immunization without pertussis toxin. Graph represents the mean clinical scores ± SEM. Statistical analysis was performed using Mann–Whitney U‐test; *P < 0.05.
Figure EV3. OTUB1 expression in the brain and spinal cord of OTUB1fl/fl and GFAP‐Cre OTUB1fl/fl mice at day 22 p.i.
- NeuN+ neurons of an OTUB1fl/fl and a GFAP‐Cre OTUB1fl/fl mouse equally express OTUB1 (arrows) in the brain and spinal cord. Double immunofluorescence with rabbit anti‐OTUB1 (Cy3) and mouse anti‐NeuN (FITC).
- Some NogoA+ oligodendrocytes (arrows) in the brain and spinal cord express OTUB1 in an OTUB1fl/fl and a GFAP‐Cre OTUB1fl/fl mouse. Double immunofluorescence with rabbit anti‐OTUB1 (Cy3) and mouse anti‐NogoA (Alexa Fluor 488).
In good agreement with the different kinetic of inflammation, GFAP‐Cre OTUB1fl/fl mice showed significantly worsened course of EAE symptoms (Fig 3E) with an earlier disease onset (Table 1), significantly higher maximal clinical scores (Table 1), and significantly enlarged areas of demyelination in the spinal cord (Table 2) as compared to OTUB1fl/fl mice. Interestingly, numbers of GFAP+ astrocytes were also significantly increased in GFAP‐Cre OTUB1fl/fl mice at days 15 and 22 p.i. (Table 3), indicating that OTUB1 expression in astrocytes critically regulates their activation.
Table 1.
OTUB1 deletion in astrocytes expedites disease onset and exacerbates symptoms of EAE
| Genotype | Disease incidencea | Day of disease onsetb | Maximal clinical scorec |
|---|---|---|---|
| OTUB1fl/fl | 26/29 (89.7%) | 16.2 ± 1.2 | 2.2 ± 0.2 |
| GFAP‐Cre OTUB1fl/fl | 29/29 (100%) | 13.2 ± 0.8 | 3.0 ± 0.1 |
| Statisticsd | P < 0.05 | P < 0.05 |
EAE was induced by MOG35–55 peptide immunization with pertussis toxin in GFAP‐Cre OTUB1fl/fl mice (n = 29, pooled from four experiments with seven to eight mice per group) and OTUB1fl/fl control littermates (n = 29, pooled from four experiments with seven to eight mice per group). Data show absolute numbers of mice with disease versus all mice of one group and additionally the percentage of mice with disease.
The day of disease onset was defined as the first day with a clinical score of at least 0.5. Data show the mean ± SD of the day of disease onset of GFAP‐Cre OTUB1fl/fl mice (n = 29) and OTUB1fl/fl control mice (n = 29).
The maximal clinical score of each mouse was recorded. Data show the mean ± SD of the maximal clinical score of GFAP‐Cre OTUB1fl/fl mice (n = 29) and OTUB1fl/fl control mice (n = 29).
Differences between GFAP‐Cre OTUB1fl/fl and OTUB1fl/fl were analyzed using Mann–Whitney U‐test (for maximal clinical score) and Kaplan–Meier survival curve followed by Gehan–Breslow–Wilcoxon test (for day of disease onset).
Table 2.
OTUB1 reduces demyelination in the spinal cord of mice with EAE
| Genotype | Demyelinated area (%)a | |
|---|---|---|
| Day 0 | Day 22 p.i. | |
| OTUB1fl/fl | 0b | 1.9 ± 0.2 |
| GFAP‐Cre OTUB1fl/fl | 0 | 10.4 ± 0.3 |
| Statisticsc | P > 0.05 | P < 0.0001 |
Cervical spinal cord serial cross sections (≥ 10 per mouse) were stained with CV‐LFB. The demyelinated area was defined as the area lacking CV‐LFB staining and was measured using ZEN imaging software. The demyelinated area is expressed as the percentage of the total spinal cord area of the same section, which is set as 100%.
Data show the mean of demyelinated areas of three mice per group ± SD at days 0 (non‐immunized) and 22 p.i., respectively.
Differences between GFAP‐Cre OTUB1fl/fl and OTUB1fl/fl mice were analyzed using two‐tailed Student's t‐test.
Table 3.
OTUB1 inhibits astrocyte activation in EAE
| Genotype | GFAP+ astrocytes/HPFa | ||
|---|---|---|---|
| Day 0 | Day 15 p.i. | Day 22 p.i. | |
| OTUB1fl/fl | 17.71 ± 0.9b | 47.9 ± 1.2 | 49.81 ± 0.9 |
| GFAP‐Cre OTUB1fl/fl | 20.6 ± 1.2 | 71.6 ± 1.6 | 71.7 ± 1.4 |
| Statisticsc | P > 0.05 | P < 0.0001 | P < 0.0001 |
The number of activated astrocytes was determined microscopically by counting GFAP+ astrocytic cell bodies in 20 high‐power fields (HPF, magnification ×400) of the longitudinally orientated cervical spinal cord of individual mouse at days 0 (non‐immunized), 15, and 22 p.i., respectively.
Data show the mean number of activated GFAP+ astrocytes of three mice per experimental group ± SD.
Differences between GFAP‐Cre OTUB1fl/fl and OTUB1fl/fl mice were analyzed using two‐tailed Student's t‐test.
Astrocytes are an integral part of the blood–brain barrier (BBB) and critically regulate the recruitment of autoimmune CD4+ T cells into the CNS. To further analyze the effect of astrocyte‐specific OTUB1 on the development of EAE, we additionally induced EAE without pertussis toxin, which contributes to the disruption of the BBB in EAE (Linthicum et al, 1982). Upon immunization of GFAP‐Cre OTUB1fl/fl mice and OTUB1fl/fl control mice with MOG35–55 peptide without pertussis toxin, control mice did not develop EAE, whereas GFAP‐Cre OTUB1fl/fl mice gradually developed EAE symptoms over a period of 40 days (Fig 3F). Thus, GFAP‐Cre OTUB1fl/fl mice are more susceptible to EAE even in the absence of the BBB disturbing pertussis toxin, suggesting that OTUB1 may regulate invasion of autoreactive T cells into the CNS.
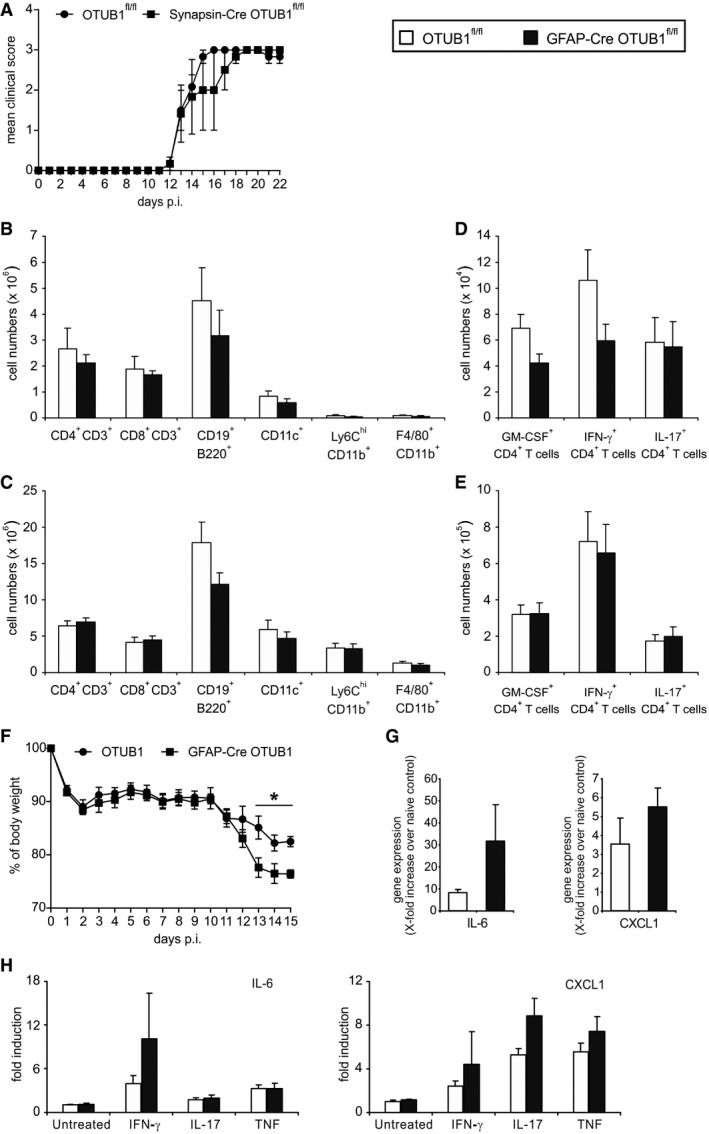
Of note, we have previously shown that the GFAP‐Cre transgene does not contribute to EAE, ruling out the possibility that the more severe EAE of GFAP‐Cre OTUB1fl/fl mice is caused by the GFAP‐Cre transgene (Wang et al, 2013a). The fact of low‐level GFAP‐Cre expression in a few neurons raises the possibility that the deletion of OTUB1 in neurons might cause the more severe EAE in GFAP‐Cre OTUB1fl/fl mice. However, Synapsin‐Cre OTUB1fl/fl mice, which were deficient of OTUB1 selectively in neurons, displayed comparable EAE as control mice, showing that neuron‐specific OTUB1 has no influence on EAE (Fig EV4A).
Figure EV4. GFAP‐Cre OTUB1fl/fl but not Synapsin‐Cre OTUB1fl/fl mice develop more severe EAE .
-
AEAE was induced in Synapsin‐Cre OTUB1fl/fl mice (n = 5) and OTUB1fl/fl control littermates (n = 5) by MOG35–55 peptide immunization with pertussis toxin. Graph shows the mean clinical scores ± SEM.
-
B, CLeukocytes were isolated from the lymph node (B) and spleen (C) of OTUB1fl/fl (n = 7) and GFAP‐Cre OTUB1fl/fl (n = 7) mice at day 15 p.i. Cells were counted with the hemocytometer and analyzed with flow cytometry. Data show the absolute number of indicated cell populations (mean + SEM).
-
D, EAbsolute numbers of GM‐CSF‐, IFN‐γ‐, and IL‐17‐producing CD4+ T cells in the lymph node (D) and spleen (E) of OTUB1fl/fl (n = 7) and GFAP‐Cre OTUB1fl/fl (n = 7) mice were calculated based on flow cytometry results. Data show the mean + SEM at day 15 p.i.
-
FBody weight of OTUB1fl/fl (n = 7) and GFAP‐Cre OTUB1fl/fl (n = 7) mice was monitored daily after EAE induction. Data show the relative change in body weight normalized to that on day 0 (mean + SEM). Two‐tailed Student's t‐test was used, *P < 0.05.
-
GAstrocytes were selectively isolated by MACS from unimmunized and diseased (day 15 p.i.) OTUB1fl/fl and GFAP‐Cre OTUB1fl/fl mice, respectively. Relative expression of IL‐6 and CXCL1 mRNA was determined by quantitative real‐time PCR. Data are presented as relative increase in genes at day 15 p.i. over gene expression of astrocytes from unimmunized control mice (n = 3 for all groups; mean + SEM).
-
HPrimary astrocytes isolated from OTUB1fl/fl (n = 3) and GFAP‐Cre OTUB1fl/fl (n = 3) mice were left untreated or stimulated with IFN‐γ (10 ng/ml), IL‐17 (50 ng/ml), and TNF (10 ng/ml), respectively, for 16 h. mRNA levels of IL‐6 and CXCL1 were detected by quantitative real‐time PCR. Data are shown as relative increase over untreated controls (mean + SEM).
OTUB1 inhibits proinflammatory gene expression in astrocytes and invasion of encephalitogenic T cells in the spinal cord during EAE
Autoimmune CD4+ T cells are critical mediators of EAE. Therefore, we analyzed the infiltration of CD4+ T cells and other leukocyte populations in the spinal cord during EAE. Higher percentages and absolute numbers of CD4+ T cells were detected in the spinal cord of GFAP‐Cre OTUB1fl/fl mice at both days 15 and 22 p.i. (Fig 4A and B). In addition to CD4+ T cells, significantly more CD8+ T cells, dendritic cells, and macrophages were present in the spinal cord of GFAP‐Cre OTUB1fl/fl mice during EAE, whereas equal numbers of these leukocyte populations were detected in the spleen and lymph node between the two mouse strains (Fig EV4B and C). With respect to encephalitogenic IFN‐γ‐producing Th1 cells, IL‐17‐producing Th17 cells, and GM‐CSF‐producing CD4+ T cells, the percentages of these three subpopulations did not differ between the two genotypes (Fig 4C), indicating that OTUB1 deficiency in astrocytes does not affect the composition of these CD4+ T‐cell subsets in the CNS. However, due to the increased numbers of CD4+ T cells in the spinal cord of GFAP‐Cre OTUB1fl/fl mice during EAE (Fig 4B), the absolute number of all three CD4+ T‐cell subpopulations was increased in the spinal cord of GFAP‐Cre OTUB1fl/fl mice (Fig 4D), explaining the more severe EAE of these mice. Besides, at day 15 p.i., when GFAP‐Cre OTUB1fl/fl mice displayed significantly higher clinical scores and more weight loss (Figs 3E and EV4F), numbers of encephalitogenic T cells in the spleen and lymph node were comparable between the two genotypes (Fig EV4D and E), indicating that the increased infiltration of leukocytes in the spinal cord GFAP‐Cre OTUB1fl/fl mice is exclusively mediated by OTUB1 deficiency in astrocytes.
Figure 4. Increased leukocyte infiltration and proinflammatory gene transcription in the spinal cord of GFAP‐Cre OTUB1fl/fl mice during EAE .
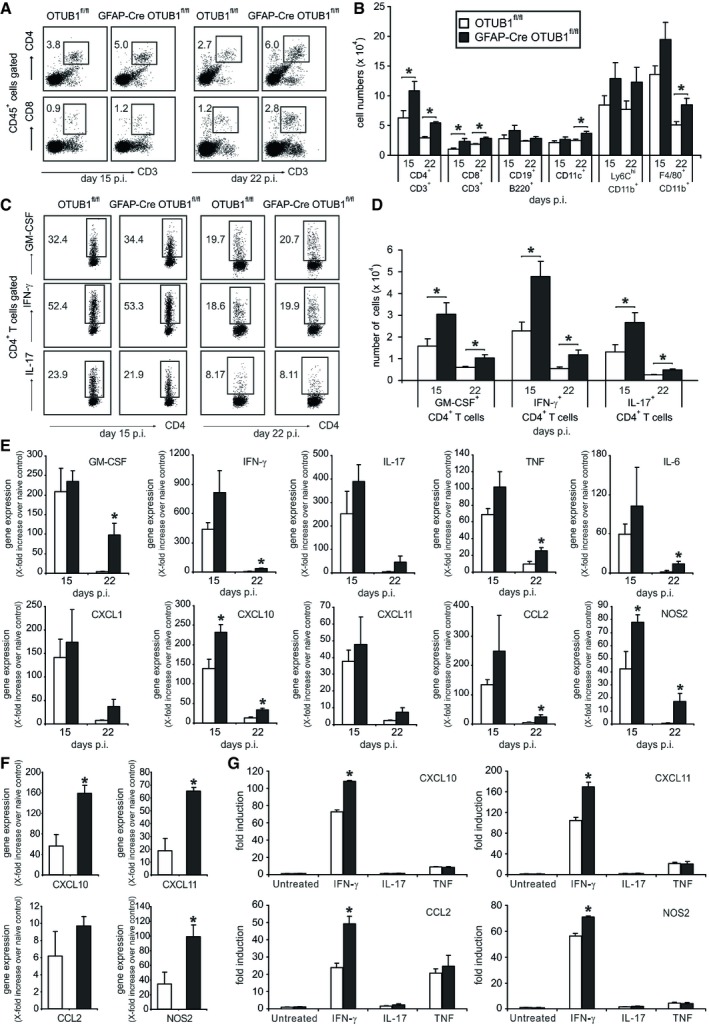
- Percentages of CD4+ and CD8+ T cells infiltrating the spinal cord of OTUB1fl/fl and GFAP‐Cre OTUB1fl/fl mice were analyzed by flow cytometry at days 15 (n = 7 for OTUB1fl/fl group; n = 9 for GFAP‐Cre OTUB1fl/fl group) and 22 (n = 4 for OTUB1fl/fl group; n = 5 for GFAP‐Cre OTUB1fl/fl group) p.i. Representative dot plots are shown.
- Absolute number of infiltrating leukocytes in the spinal cord of OTUB1fl/fl and GFAP‐Cre OTUB1fl/fl mice at days 15 (n = 7 for OTUB1fl/fl group; n = 9 for GFAP‐Cre OTUB1fl/fl group) and 22 (n = 4 for OTUB1fl/fl group; n = 5 for GFAP‐Cre OTUB1fl/fl group) p.i. was calculated based on flow cytometry results. Data show mean + SEM. Two‐tailed Student's t‐test was used, *P < 0.05.
- Infiltrating CD4+ T cells were further analyzed by flow cytometry for their ability to produce GM‐CSF, IFN‐γ, and IL‐17 at days 15 and 22 p.i., respectively. Representative dot plots are shown.
- Absolute number of infiltrating GM‐CSF‐, IFN‐γ‐, and IL‐17‐producing CD4+ T cells at days 15 (n = 7 for OTUB1fl/fl group; n = 9 for GFAP‐Cre OTUB1fl/fl group) and 22 (n = 4 for OTUB1fl/fl group; n = 5 for GFAP‐Cre OTUB1fl/fl group) p.i. was calculated based on flow cytometry results (mean + SEM). Two‐tailed Student's t‐test was used, *P < 0.05.
- Relative expression of GM‐CSF, IFN‐γ, IL‐17, TNF, IL‐6, CXCL1, CXCL10, CXCL11, CCL2, and NOS2 mRNA in the spinal cord of OTUB1fl/fl and GFAP‐Cre OTUB1fl/fl mice at days 15 and 22 p.i. was determined by quantitative real‐time PCR. Data are presented as the relative increase over unimmunized control mice (n = 3 for all groups). Data show mean + SEM. Two‐tailed Student's t‐test was used, *P < 0.05.
- Astrocytes were isolated from unimmunized and diseased OTUB1fl/fl and GFAP‐Cre OTUB1fl/fl mice at day 15 p.i., respectively. Relative expression of CXCL10, CXCL11, CCL2, and NOS2 mRNA was determined by quantitative real‐time PCR. Data are presented as relative increase in genes at day 15 p.i. over gene expression of astrocytes from unimmunized control mice (n = 3 for all groups). Data show mean + SEM. Statistical analysis was performed using two‐tailed Student's t‐test; *P < 0.05.
- Primary astrocytes isolated from OTUB1fl/fl (n = 3) and GFAP‐Cre OTUB1fl/fl (n = 3) mice were left untreated or stimulated with IFN‐γ (10 ng/ml), IL‐17 (50 ng/ml), and TNF (10 ng/ml), respectively, for 16 h. mRNA levels of CXCL10, CXCL11, CCL2, and NOS2 were detected by quantitative real‐time PCR. Data are shown as relative increase over untreated controls (mean + SEM). Two‐tailed Student's t‐test was used, *P < 0.05.
Transcription of CXCL10 and NOS2 at day 15 p.i. and transcription of TNF, IFN‐γ, GM‐CSF, IL‐6, CXCL10, CCL2, and NOS2 at day 22 p.i. were significantly increased in GFAP‐Cre OTUB1fl/fl mice (Fig 4E). Given that astrocytes are the major inducible source of IL‐6, CXCL10, CCL2, and NOS2 in the CNS during neuroinflammation and that astrocyte‐mediated cytokine and chemokine production is associated with EAE pathogenesis and development, the enhanced expression of these proinflammatory genes in GFAP‐Cre OTUB1fl/fl mice implies that astrocyte‐derived OTUB1 limits EAE severity by inhibiting proinflammatory gene production in astrocytes. In good agreement, expression of CXCL10, CXCL11, and NOS2 was significantly increased in astrocytes isolated from GFAP‐Cre OTUB1fl/fl mice at day 15 p.i. (Fig 4F). In addition, expression of CXCL1, CCL2, and IL‐6 was slightly increased in astrocytes of GFAP‐Cre OTUB1fl/fl mice (Figs 4F and EV4G). Collectively, these data show that OTUB1 inhibits expression of proinflammatory genes in astrocytes during EAE.
To understand how OTUB1 inhibits proinflammatory gene expression in astrocytes, we stimulated cultured primary astrocytes with IFN‐γ, IL‐17, and TNF, which are detrimental cytokines secreted by autoimmune CD4+ T cells in EAE, respectively. IL‐17 and TNF induced nearly equal amounts of gene transcription in OTUB1‐sufficient and OTUB1‐deficient astrocytes (Figs 4G and EV4H), suggesting that OTUB1 has no influence on IL‐17‐ and TNF‐mediated astrocyte activation. However, upon IFN‐γ stimulation, OTUB1‐deficient astrocytes produced significantly more CXCL10, CXCL11, CCL2, and NOS2 (Fig 4G), indicating that OTUB1 negatively regulates IFN‐γ‐activated signaling pathways. Interestingly, OTUB1 mRNA levels were downregulated in a time‐dependent manner upon IFN‐γ stimulation (Fig EV5A), further illustrating that IFN‐γ signaling and OTUB1 act antagonistically. Taken together, these results show that astrocytic OTUB1 ameliorates EAE by inhibiting IFN‐γ‐induced proinflammatory gene production in astrocytes.
Figure EV5. OTUB1 mRNA levels are downregulated by IFN‐γ treatment, and OTUB1 does not interfere with TNF‐induced signaling pathways.
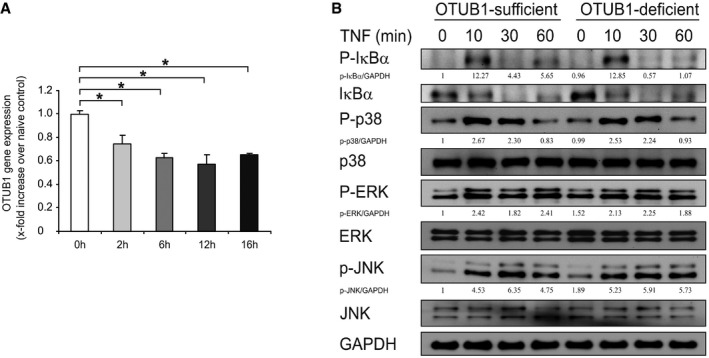
- Primary astrocytes from wild‐type C57BL/6 mice were stimulated with IFN‐γ (10 ng/ml) for indicated times. Thereafter, mRNA was isolated and analyzed by quantitative real‐time PCR. Data show the relative expression of OTUB1 mRNA compared to untreated controls (n = 3 for all groups). Data represent mean + SEM. Two‐tailed Student's t‐test was used, *P < 0.05.
- Primary astrocytes from OTUB1fl/fl and GFAP‐Cre OTUB1fl/fl mice were stimulated with TNF (10 ng/ml) for indicated times. Whole cell lysates were analyzed by WB with indicated antibodies.
Source data are available online for this figure.
OTUB1 inhibits IFN‐γ‐activated signaling by targeting SOCS1
To analyze the molecular mechanism of the inhibitory activity of OTUB1 on IFN‐γ‐mediated astrocyte activation, we studied the IFN‐γ‐activated JAK2‐STAT1 signaling pathway by WB analysis. As illustrated in Fig 5A, phosphorylation of STAT1 at both tyrosine 701 and serine 727 sites was strongly increased in IFN‐γ‐stimulated OTUB1‐deficient astrocytes. Consistently, WB analysis of cytosolic and nuclear fractions of IFN‐γ‐activated astrocytes showed that the increased phosphorylation of STAT1 was detected in both the cytoplasm and the nucleus, resulting in increased nuclear translocation of STAT1 in OTUB1‐deficient astrocytes (Fig 5B). In good agreement, in vivo STAT1 mRNA expression of astrocytes was induced in both mouse strains by EAE with significantly higher levels in OTUB1‐deficient astrocytes at day 15 p.i. (Fig 5C). In addition, phosphorylation of JAK2, which is the upstream kinase of STAT1, was strongly elevated in the OTUB1‐deficient astrocytes (Fig 5A), indicating that the increased STAT1 activation is caused by the hyperactivation of JAK2.
Figure 5. OTUB1 inhibits IFN‐γ‐activated JAK2‐STAT1 signaling pathway by manipulating SOCS1.
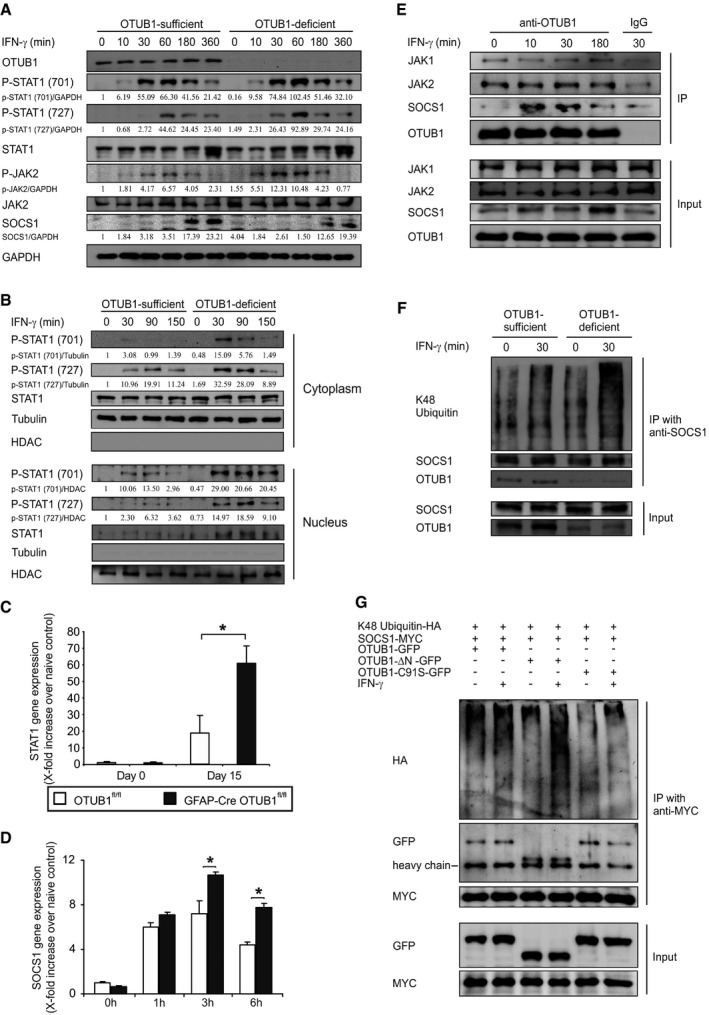
- Primary astrocytes from OTUB1fl/fl and GFAP‐Cre OTUB1fl/fl mice were treated with IFN‐γ (10 ng/ml) for indicated times and analyzed by Western blot with indicated antibodies.
- Primary astrocytes from OTUB1fl/fl and GFAP‐Cre OTUB1fl/fl mice were treated with IFN‐γ (10 ng/ml) for indicated times. Cytoplasmic and nuclear extracts were separated and analyzed by WB with indicated antibodies.
- Astrocytes were selectively isolated by MACS from OTUB1fl/fl and GFAP‐Cre OTUB1fl/fl mice at days 0 and 15 p.i., respectively. Relative expression of STAT1 mRNA was determined by quantitative real‐time PCR. Data show the relative increase in STAT1 mRNA over that of unimmunized control mice (n = 3 for all groups; mean + SEM). Two‐tailed Student's t‐test was used, *P < 0.05.
- Primary astrocytes from OTUB1fl/fl (n = 3) and GFAP‐Cre OTUB1fl/fl (n = 3) mice were stimulated with IFN‐γ (10 ng/ml) for indicated times. mRNA was isolated and analyzed by quantitative real‐time PCR for SOCS1. Data show the relative increase over untreated controls (mean + SEM). Statistical analysis was performed using two‐tailed Student's t‐test; *P < 0.05.
- Primary astrocytes from wild‐type mice were stimulated with IFN‐γ (10 ng/ml) for indicated times. Proteins were immunoprecipitated from whole cell lysates with anti‐OTUB1 antibody and analyzed by WB with antibodies against JAK1, JAK2, SOCS1, and OTUB1.
- Primary astrocytes from OTUB1fl/fl and GFAP‐Cre OTUB1fl/fl mice were left untreated or treated with IFN‐γ (10 ng/ml) for 30 min. Proteins were immunoprecipitated with anti‐SOCS1 antibody and analyzed by WB for SOCS1, OTUB1, and K48 ubiquitin.
- Primary astrocytes from GFAP‐Cre OTUB1fl/fl mice were cotransfected with SOCS1‐MYC, K48 ubiquitin‐HA, and OTUB1‐GFP/OTUB1‐∆N‐GFP/OTUB1‐C91S‐GFP plasmids. Twenty‐four hours after transfection, cells were left untreated or stimulated with IFN‐γ (10 ng/ml) for 30 min before lysation. Proteins were immunoprecipitated with anti‐MYC antibody and analyzed by WB for MYC, GFP, and HA.
Source data are available online for this figure.
SOCS1, an inhibitor of JAK2, was very weakly present in unstimulated cells of both OTUB1‐sufficient and OTUB1‐deficient astrocytes (Fig 5A). Upon IFN‐γ stimulation, SOCS1 protein expression was induced in both genotypes with higher levels in OTUB1‐sufficient astrocytes (Fig 5A). In sharp contrast, higher levels of SOCS1 mRNA were induced in OTUB1‐deficient astrocytes upon IFN‐γ treatment (Fig 5D), which may be caused by the elevated activity of the SOCS1‐inducing transcription factor STAT1 (Fig 5A). Given that STAT1 mediates its own transcription and its transcription is elevated in astrocytes during EAE (Maier et al, 2002; Itoh et al, 2018), the significantly increased transcription of STAT1 in OTUB1‐deficient astrocytes as compared to OTUB1‐sufficient astrocytes in EAE (Fig 5C) shows that the JAK‐STAT1 signaling is more activated in the absence of OTUB1 in vivo.
As shown in Fig 4G, TNF and IL‐17 stimulation induced equal gene transcription in OTUB1‐sufficient and OTUB1‐deficient astrocytes, suggesting that OTUB1 plays only a minor or even no role in signaling pathways regulated by these cytokines. Indeed, activation of NF‐κB and MAPK signaling pathways was equally induced in OTUB1‐sufficient and OTUB1‐deficient astrocytes upon TNF stimulation (Fig EV5B). Collectively, these data indicate that OTUB1 negatively regulates IFN‐γ‐induced STAT1 activation potentially by regulation of SOCS1.
To further explore the mechanism of action by OTUB1, we investigated the interaction of OTUB1 with SOCS1 in unstimulated and IFN‐γ‐stimulated astrocytes by immunoprecipitation of OTUB1 and WB for SOCS1. The interaction of OTUB1 with SOCS1 was induced by IFN‐γ in a time‐dependent manner (Fig 5E). In addition, OTUB1 was found to interact with JAK1 and JAK2 constitutively, but this interaction was independent of IFN‐γ treatment (Fig 5E). Since (i) JAK2 activity is negatively regulated by SOCS1 (Narazaki et al, 1998), (ii) SOCS1 protein levels are critically regulated by K48 ubiquitination‐mediated proteasomal degradation (Wang et al, 2017b), and (iii) OTUB1 can stabilize target proteins by reducing K48 ubiquitination (Edelmann et al, 2009), we hypothesized that OTUB1 inhibits JAK2‐STAT1 signaling indirectly by regulating SOCS1 stability. To confirm this hypothesis, SOCS1 was immunoprecipitated from IFN‐γ‐stimulated OTUB1‐sufficient and OTUB1‐deficient astrocytes. WB analysis of the immunocomplex revealed that K48‐specific ubiquitination of SOCS1 was strongly increased in the absence of OTUB1 (Fig 5F). Transfection of astrocytes with SOCS1‐MYC, K48 ubiquitin‐HA, and OTUB1‐GFP plasmids followed by immunoprecipitation with anti‐MYC antibody further confirmed that OTUB1 reduces the K48‐specific ubiquitination of SOCS1 upon IFN‐γ stimulation (Appendix Fig S2A). Of note, in the overexpression system, OTUB1 constantly interacted with SOCS1. No interaction was observed between SOCS1‐MYC and GFP (Appendix Fig S2B), excluding the possibility that OTUB1‐GFP interacts with SOCS1‐MYC through GFP.
Structurally, OTUB1 contains an N‐terminal ubiquitin‐binding domain (amino acid 1–47) and a C‐terminal OTU domain (amino acid 85–270), which harbors the catalytic cysteine C91. To investigate which domain of OTUB1 is required for the binding and deubiquitination of SOCS1, we generated two OTUB1 mutants. The N terminus of OTUB1 is deleted in the OTUB1‐∆N‐GFP mutant, and the OTUB1‐C91S‐GFP mutant is catalytically inactive. Both OTUB1‐∆N‐GFP and OTUB1‐C91S‐GFP mutants interacted with SOCS1 (Fig 5G), indicating that the N terminus is not essential for the interaction between OTUB1 and SOCS1. However, IFN‐γ‐induced K48 ubiquitination of SOCS1 was strongly enhanced in the presence of OTUB1‐∆N‐GFP, suggesting that the N terminus of OTUB1 is required for reducing K48 ubiquitination of SOCS1.
OTUB1 inhibits IFN‐γ‐induced astrocyte activation by stabilizing SOCS1
Consistent with the well‐established mechanism that K48 ubiquitination is associated with proteasomal degradation, we found that the stability of overexpressed SOCS1 protein was strongly compromised in the absence of OTUB1 (Figs 6A and B, and Appendix Fig S2C). Since the OTUB1‐∆N‐GFP mutant did not reduce K48 ubiquitination of SOCS1 (Fig 5G), this mutant failed to stabilize overexpressed SOCS1 as efficiently as wild‐type OTUB1 and the OTUB1‐C91S‐GFP mutant (Fig 6C).
Figure 6. OTUB1 inhibits IFN‐γ‐induced proinflammatory gene expression in astrocytes by stabilizing SOCS1.
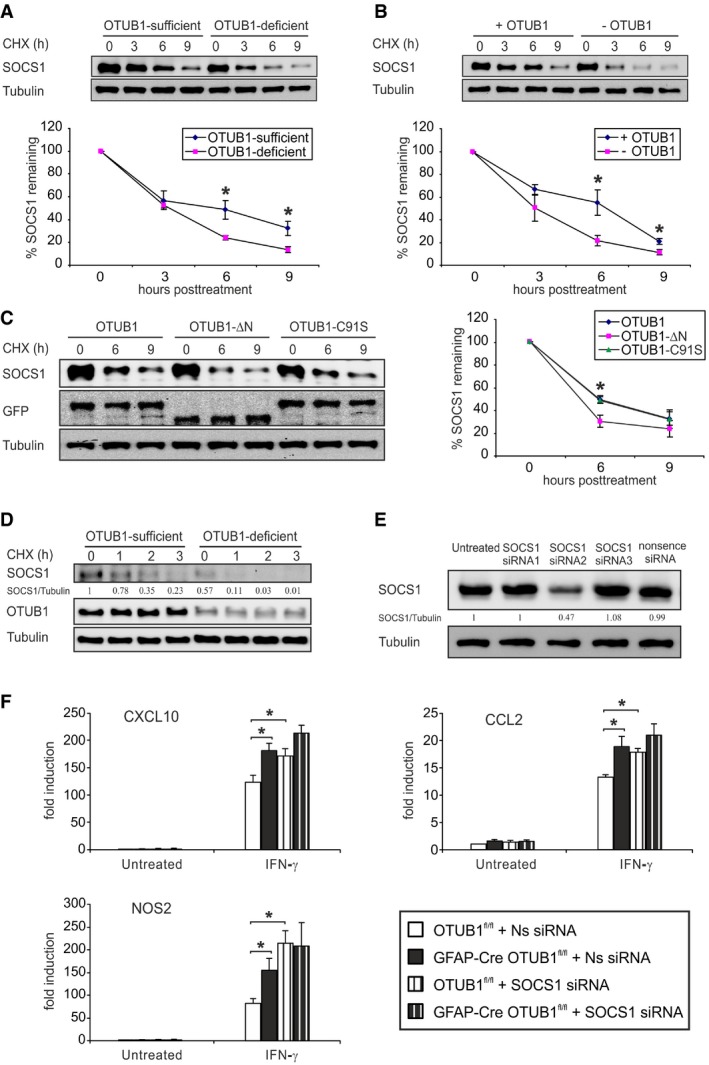
- Primary astrocytes from OTUB1fl/fl and GFAP‐Cre OTUB1fl/fl mice were transfected with SOCS1‐MYC plasmids. Twenty‐four hours after transfection, cells were treated with cycloheximide (CHX, 100 μg/ml) for indicated times. SOCS1 protein levels were analyzed by WB (upper panel). The lower panel shows the relative protein levels of SOCS1 normalized to Tubulin (n = 3 for both groups). Data show mean ± SEM. Statistical analysis was performed using two‐tailed Student's t‐test; *P < 0.05.
- Primary astrocytes from GFAP‐Cre OTUB1fl/fl mice were transfected with SOCS1‐MYC plasmids or cotransfected with SOCS1‐MYC + OTUB1‐GFP plasmids. Twenty‐four hours after transfection, cells were treated with CHX (100 μg/ml) for indicated times. SOCS1 protein levels were analyzed by WB (upper panel). The lower panel shows the relative protein levels of SOCS1 normalized to Tubulin (n = 3 for both groups; mean ± SEM). Two‐tailed Student's t‐test was used, *P < 0.05.
- Primary astrocytes from GFAP‐Cre OTUB1fl/fl mice were cotransfected with SOCS1‐MYC and OTUB1‐GFP/OTUB1‐∆N‐GFP/OTUB1‐C91S‐GFP plasmids. Twenty‐four hours after transfection, cells were treated with CHX (100 μg/ml) for indicated times. SOCS1 protein levels were analyzed by WB (left panel). The right panel shows the relative protein levels of SOCS1 normalized to Tubulin (n = 4 for both groups). Data represent mean ± SEM. Two‐tailed Student's t‐test was used, *P < 0.05.
- Primary astrocytes from OTUB1fl/fl and GFAP‐Cre OTUB1fl/fl mice were stimulated with IFN‐γ (10 ng/ml) for 4 h. Thereafter, cells were treated with CHX (100 μg/ml) for indicated times. Whole cell lysates were analyzed by WB with indicated antibodies.
- Primary astrocytes from OTUB1fl/fl mice were transfected with SOCS1‐MYC plasmids. Five hours later, astrocytes were subsequently transfected with different siRNAs or left untreated. Twenty‐four hours after siRNA transfection, protein was isolated and analyzed by WB for SOCS1 expression.
- Primary astrocytes from OTUB1fl/fl and GFAP‐Cre OTUB1fl/fl mice were transfected with nonsense siRNA and SOCS1 siRNA‐2. Twenty‐four hours after transfection, cells were stimulated with IFN‐γ (10 μg/ml) for 16 h before mRNA isolation. Quantitative real‐time PCR was performed to detect mRNA levels of CXCL10, CCL2, and NOS2 (n = 4 for all groups). Data show mean + SEM. Statistical analysis was performed using two‐tailed Student's t‐test; *P < 0.05.
Source data are available online for this figure.
To study the impact of OTUB1 on endogenous SOCS1, OTUB1‐sufficient and OTUB1‐deficient astrocytes were stimulated with IFN‐γ for 4 h followed by cycloheximide treatment. Consistent with Fig 5A, less amount of SOCS1 protein was induced in OTUB1‐deficient astrocytes by IFN‐γ (Fig 6D). The newly synthesized SOCS1 was degraded rapidly, and this process was further accelerated in the absence of OTUB1 (Fig 6D), showing that the reduced induction of SOCS1 protein in OTUB1‐deficient astrocytes is caused by the increased degradation. The induction of endogenous SOCS1 by IFN‐γ was strongly reduced in the absence of the N terminus of OTUB1 (Appendix Fig S2D), which is consistent with the observation that the N terminus of OTUB1 is required for the stability of overexpressed SOCS1 (Fig 6C). These findings demonstrate that OTUB1 negatively regulates IFN‐γ‐activated JAK2‐STAT1 signaling by K48 deubiquitination and stabilization of SOCS1.
To directly confirm that OTUB1 inhibits IFN‐γ‐induced gene production by targeting SOCS1, we knocked down SOCS1 in primary astrocytes isolated from OTUB1fl/fl and GFAP‐Cre OTUB1fl/fl mice with siRNA. Among the three SOCS1 siRNAs tested, SOCS1 siRNA‐2 reduced SOCS1 protein levels by almost 60% as compared to nonsense siRNA and it was chosen for further experiments (Fig 6E). SOCS1 knockdown significantly increased the transcription of CXCL10, CCL2, and NOS2 in OTUB1‐sufficient astrocytes (Fig 6F). In contrast, these genes were not significantly upregulated in SOCS1 siRNA‐treated OTUB1‐deficient astrocytes as compared to nonsense siRNA‐treated OTUB1‐deficient cells. The failure to upregulate gene expression in OTUB1‐deficient astrocytes further indicates that the increased K48 ubiquitination‐mediated degradation of SOCS1 limits the immunostimulatory effect of SOCS1 inhibition. Taken together, our results show that OTUB1 inhibits IFN‐γ‐induced astrocyte activation by stabilizing SOCS1, thereby suppressing the production of proinflammatory genes, in particular, chemokines, in astrocytes.
OTUB1 inhibits type I IFN‐dependent astrocyte activation
Since SOCS1 inhibits type I IFN‐induced signaling and type I IFN signaling in astrocytes regulates neuroinflammation in EAE (Rothhammer et al, 2016; Torre et al, 2017), we studied the impact of OTUB1 on IFN‐β‐induced astrocyte activation. Upon IFN‐β stimulation, phosphorylation of STAT1 was induced in both OTUB1‐competent and OTUB1‐deficient astrocytes with a stronger induction in OTUB1‐deficient cells (Fig 7A). In contrast to IFN‐γ, type I IFN did not reduce OTUB1 mRNA expression (Fig 7B). Expression of CXCL10, CXCL11, NOS2, and CCL2 mRNA was induced in both genotypes upon IFN‐β stimulation (Fig 7C–F). In contrast to IFN‐γ, IFN‐β treatment induced only significantly elevated CXCL11 and CCL2 mRNA production in OTUB1‐deficient as compared to OTUB1‐expressing astrocytes. Collectively, these data show that STAT1 activation and chemokine mRNA production of astrocytes induced by IFN‐β can also be partially suppressed by OTUB1. Interestingly, Torre et al (2017) showed that a loss‐of‐function mutation in USP15 ameliorates EAE by dampening type I interferon signaling, which drives the production of chemokines and cytokines in the spinal cord. Therefore, OTUB1 might ameliorate EAE by inhibiting both type I and type II interferon responses in astrocytes.
Figure 7. OTUB1 inhibits IFN‐β‐induced STAT1 activation and gene transcription.
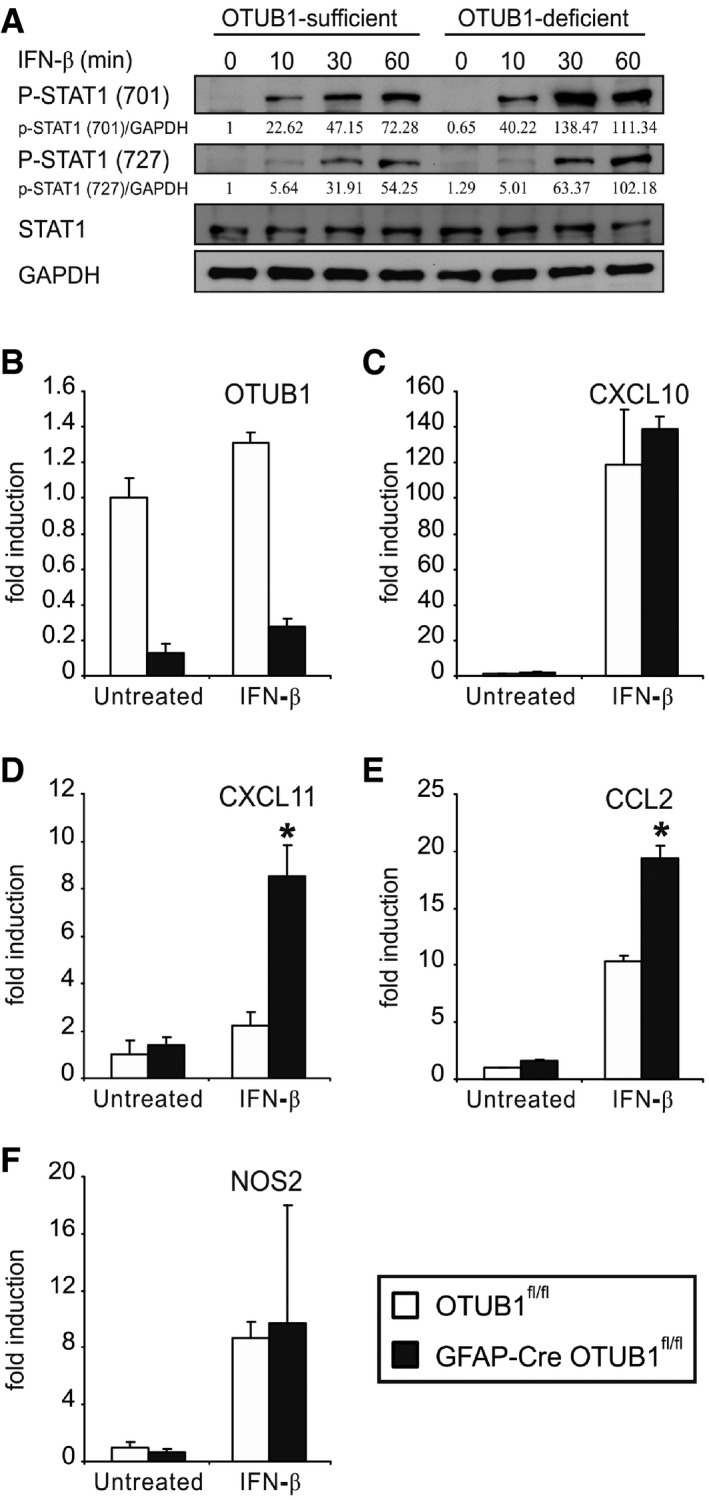
-
APrimary astrocytes from OTUB1fl/fl and GFAP‐Cre OTUB1fl/fl mice were treated with IFN‐β (10 ng/ml) for indicated times. Whole cell lysates were analyzed by WB with indicated antibodies.
-
B–FPrimary astrocytes from OTUB1fl/fl (n = 3) and GFAP‐Cre OTUB1fl/fl (n = 3) mice were treated with IFN‐β (10 ng/ml) for 16 h. Quantitative real‐time PCR was performed to detect OTUB1 (B), CXCL10 (C), CXCL11 (D), CCL2 (E), and NOS2 (F) mRNA levels. Data show mean + SEM. Two‐tailed Student's t‐test was used, *P < 0.05.
Source data are available online for this figure.
Discussion
IFN‐γ plays both detrimental and protective roles in MS and EAE, which are critically dependent on cell type, cell maturation status, dosage, and disease stage (Arellano et al, 2015; Ottum et al, 2015). Interestingly, studies have shown that high amounts of IFN‐γ in the CNS are disease‐promoting in both MS and EAE (Ottum et al, 2015). Elevated levels of IFN‐γ are found in MS lesions, and cerebrospinal fluid levels of IFN‐γ correlate with MS severity (Vartanian et al, 1995; Khaibullin et al, 2017). Th1 cells are the primary source of IFN‐γ in EAE, and adoptive transfer of encephalitogenic Th1 cells induces EAE in recipient mice (Axtell et al, 2010). IFN‐γ induces the production of various cytokines and chemokines in astrocytes, and targeted silencing of IFN‐γ signaling in astrocytes ameliorates EAE. Here, we identified upregulation of OTUB1 in activated astrocytes in demyelinating lesions of treatment‐naïve MS patients and in mice with EAE. We propose that the astrocyte‐specific upregulation of OTUB1 in MS and EAE is induced by inflammatory stimuli, since in vivo astrocyte activation, severity of inflammation, and OTUB1 expression of activated astrocytes correlated positively. Interestingly, human and murine neurons and some oligodendrocytes expressed OTUB1 in the normal CNS without obvious upregulation in CNS autoimmunity. In neurons, OTUB1 has been shown to stabilize Tau (Wang et al, 2017a), indicating that neuron‐specific OTUB1 might participate in neurodegenerative diseases. It is probable that, in neurons and oligodendrocytes, OTUB1 function is not regulated by proinflammatory stimuli.
OTUB1 served as a crucial negative regulator of IFN‐γ‐mediated astrocyte activation, and targeted deletion of OTUB1 in astrocytes exacerbated EAE. In vitro, OTUB1 deficiency increased the IFN‐γ‐induced production of leukocyte‐recruiting chemokines (CXCL10, CXCL11, and CCL2) and proinflammatory molecules (NOS2) of astrocytes, which is consistent with the in vivo data of increased transcription of CXCL10, CXCL11, and NOS2 in EAE of GFAP‐Cre OTUB1fl/fl mice. The increased production of chemokines leads to an augmented recruitment of encephalitogenic IFN‐γ‐, IL‐17‐, and GM‐CSF‐producing CD4+ T cells to the CNS. Of note, stimulation with IL‐17, which activates the NF‐κB pathway in astrocytes and contributes to the astrocyte‐dependent induction of EAE (Kang et al, 2010), did not result in an increased CXCL1 and IL‐6 production in OTUB1‐deficient astrocytes. This stresses the importance of OTUB1‐regulated IFN‐γ signaling in astrocytes and indicates that OTUB1 ameliorates EAE by suppressing IFN‐γ‐induced production of proinflammatory chemokines and molecules in astrocytes.
In EAE, OTUB1 limited mRNA production of STAT1, which is the key transcription factor induced by IFN‐γ and, furthermore, inhibited IFN‐γ‐induced JAK‐STAT1 signaling indirectly by stabilization of SOCS1. SOCS1 is an inhibitor of IFN‐γ‐induced signaling, and it functions by (i) binding to the phosphorylated Tyr1007 residue of JAK2 and inhibiting JAK2 kinase activity (Narazaki et al, 1998; Yasukawa et al, 1999); and (ii) binding to the phosphotyrosine residues of the IFN‐γ receptor. In addition, SOCS1 induces K48 ubiquitination and proteasomal degradation of phosphorylated JAK2 by recruiting the Elongin BC complex (Kamizono et al, 2001). The activity of SOCS1 is strongly diminished by degradation of SOCS1 protein. SOCS1 protein levels are markedly reduced in the absence of the carboxy‐terminal SOCS box, and this reduction can be reversed by proteasome inhibitors, suggesting that the SOCS box protects SOCS1 protein from proteasome‐mediated degradation (Narazaki et al, 1998). The Elongin BC complex, which plays a role in ubiquitin‐mediated degradation, interacts with SOCS1 and also regulates its stability. The E3 ligase TRIM8, which has been shown to ubiquitinate target proteins for proteasomal degradation, induces the degradation of SOCS1. However, we did not detect an interaction of OTUB1 with TRIM8 excluding that OTUB1 regulated SOCS1 stability via TRIM8 (data not shown). A recent study confirmed that K48‐linked ubiquitination was the cause for SOCS1 degradation (Wang et al, 2017b). In the present study, we identified that OTUB1, which preferentially prevents K48 polyubiquitination of target proteins (Edelmann et al, 2009; Wang et al, 2009), physically interacts with SOCS1 and reduces its K48 ubiquitination, thereby stabilizing SOCS1 protein.
In contrast to the IFN‐γ‐induced interaction between OTUB1 and SOCS1 in untransfected astrocytes, overexpression of OTUB1 and SOCS1 leads to interaction of the two proteins even in the absence of IFN‐γ. This observation is consistent with a previous study showing that OTUB1 constantly interacts with SMAD3 under overexpression conditions (Herhaus et al, 2013). Both OTUB1 mutants, i.e., the ∆N OTUB1 mutant lacking the N‐terminal ubiquitin‐binding domain and the C91S OTUB1 mutant lacking catalytic activity, still interacted with SOCS1, indicating that the N terminus and the catalytic residue C91 of OTUB1 are not essential for the association with SOCS1. In contrast, the C91 residue, but not the N terminus, of OTUB1 was required for interaction of OTUB1 with SMAD3 (Herhaus et al, 2013), whereas both the N‐terminal (amino acids 1–160) and C‐terminal (amino acids 161–271) domains of OTUB1 bind to p53 (Sun et al, 2012). These data show that OTUB1 uses different domains for binding to different substrates. Although the ∆N OTUB1 mutants interacted with SOCS1, it failed to reduce K48‐linked ubiquitination and degradation of SOCS1, suggesting that the N terminus of OTUB1 is critical for SOCS1 stability.
In addition to acting as a canonical DUB that directly removes ubiquitin from substrates, OTUB1 can prevent the formation of polyubiquitin chains through a non‐canonical DUB activity, which inhibits ubiquitination of target proteins by obstructing E2 enzyme/E3 ligase‐dependent ubiquitin transfer (Nakada et al, 2010; Juang et al, 2012; Sato et al, 2012; Wiener et al, 2012). The canonical DUB activity is mainly exerted by the catalytic residue C91, and the non‐canonical DUB activity requires the N‐terminal ubiquitin‐binding domain, which recognizes E2 and polyubiquitin chains (Juang et al, 2012; Wiener et al, 2012). The canonical DUB activity of OTUB1 cleaves K48‐linked polyubiquitin chains from Tau, MDMX, FOXM1, and c‐IAP1, while the non‐canonical activity is essential for inhibiting the ubiquitination of SMAD3, chromatin, and p53 (Nakada et al, 2010; Sun et al, 2012; Herhaus et al, 2013). Our finding that K48‐linked ubiquitination of SOCS1 was not inhibited by the OTUB1 ∆N mutant indicates that OTUB1 might directly block the ubiquitination of SOCS1 in astrocytes.
In contrast to the protective function of astrocyte‐derived OTUB1 in EAE, the catalytic activity of OTUB1 mediates K48 deubiquitination of Tau resulting in the stabilization and aggregation of Tau and exacerbation of neurodegeneration (Wang et al, 2017a). Thus, both the catalytic and the ubiquitination blocking mechanisms of OTUB1‐mediated protein stabilization play important, yet distinct roles in CNS pathologies. This indicates that the function of OTUB1 is strongly influenced by the K48‐polyubiquitinated target protein, the affected cell type, and the underlying disease. The latter assumption is also supported by our observation that OTUB1 expression in neuroectodermal cells is required for embryogenic development. The strong expression of OTUB1 in astrocytes of MS patients is potentially a mechanism to ameliorate the neuroinflammation, and it will be interesting to determine whether different types of MS, i.e., relapsing–remitting versus chronic progressive, show a different pattern of astrocytic OTUB1 expression.
With respect to neuroinflammation, recent studies point to DUBs as critical regulators of autoimmune CNS disorders. Polymorphisms in or close to the human genes USP18 and TNFAIP3 are associated with MS susceptibility (De Jager et al, 2009; Malhotra et al, 2013). In good agreement, USP18 expression of microglia (Goldmann et al, 2015) and, as we have shown previously, TNFAIP3 expression of astrocytes ameliorated EAE. These data together with the expression of OTUB1 in astrocytes of MS patients and the inhibitory role of astrocytic OTUB1 on EAE may suggest manipulation of DUBs as an attractive strategy to tackle neuroinflammation.
Materials and Methods
Mice
To obtain OTUB1‐deficient mice, we generated a targeting vector, in which exons 2 and 3 of OTUB1 were flanked by LoxP sites. A 3.1‐kb fragment was used as 5′ homology region, and a 4.0‐kb fragment was used as 3′ homology region. Art B6/3.6 embryonic stem cells derived from C57BL/6 NTac mice were transfected with the targeting vector and positively selected by neomycin and puromycin resistance. The FRT‐flanked NeoR and F3‐flanked PuroR cassettes were subsequently removed from correctly targeted clones by crossing with a FLP‐deleter strain, generating OTUB1wt/fl mice. OTUB1wt/fl mice were crossed with C57BL/6 Rosa26‐Cre mice to generate Rosa26‐Cre OTUB1wt/fl mice, which were further crossed with C57BL/6 mice to remove the Rosa 26‐Cre, producing OTUB1wt/∆ mice. Nestin‐Cre OTUB1wt/fl mice were generated by crossing C57BL/6 Nestin‐Cre mice (Tronche et al, 1999) with OTUB1fl/fl mice. OTUB1fl/fl mice were also crossed with C57BL/6 GFAP‐Cre (Bajenaru et al, 2002) and Synapsin‐Cre (Zhu et al, 2001) mice to obtain GFAP‐Cre OTUB1fl/fl and Synapsin‐Cre OTUB1fl/fl mice, respectively. Genotyping of offsprings was carried out by PCR of tail DNA with primers targeting Rosa26‐Cre, Nestin‐Cre, GFAP‐Cre, Synapsin‐Cre, and OTUB1fl/fl, respectively. Wild‐type C57BL/6J mice were obtained from Janvier (Le Genest‐Saint‐Isle, France). Animal care and experimental procedures were performed under SPF conditions in the animal facility of the Otto‐von‐Guericke University Magdeburg according to European regulations and approved by state authorities (Landesverwaltungsamt Halle, Germany).
EAE induction and assessment
EAE was induced in 8‐ to 12‐week‐old female mice by subcutaneous immunization with 200 μg of myelin oligodendrocyte glycoprotein (MOG)35–55 peptide (JPT, Berlin, Germany) emulsified in complete Freund's adjuvant (Merck, Darmstadt, Germany) supplemented with 800 μg of killed Mycobacterium tuberculosis (Merck). As indicated in the experiments, mice were additionally challenged with two intraperitoneal injections of 200 ng pertussis toxin (Sigma‐Aldrich), dissolved in 200 μl PBS, on days 0 and 2 p.i. EAE symptoms were scored daily in a double‐blinded way according to a scale of increasing severity from 0 to 5 as follows: 0, no signs; 0.5, partial tail weakness; 1, limp tail or slight slowing of righting from supine position; 1.5, limp tail and slowing of righting; 2, partial hind limb weakness; 2.5, dragging of hind limb(s) without complete paralysis; 3, complete paralysis of at least one hind limb; 3.5, hind limb paralysis and slight weakness of forelimbs; 4, severe forelimb weakness; and 5, moribund or dead. Daily clinical scores were displayed as the mean of all individual disease scores within each group.
Leukocyte isolation and flow cytometry
Leukocytes were isolated from the spinal cord by Percoll gradients (GE Healthcare, Munich, Germany) and counted with the hemocytometer. Leukocytes were stained for CD4 (GK1.5), CD8 (53‐6.7), CD3 (145‐2C11), CD45 (30‐F11), CD19 (1D3), B220 (RA3‐6B), CD11c (N418), Ly6C (AL‐21), CD11b (M1/70), and F4/80 (T45‐2342) followed by flow cytometry. The absolute numbers of individual leukocyte populations were calculated based on the number of total leukocytes and the percentage of each population acquired by flow cytometry. For the detection of intracellular cytokines, isolated leukocytes were treated with 50 ng/ml PMA, 500 ng/ml ionomycin, and 1 μl/ml brefeldin A in RPMI 1640 medium supplemented with 10% FCS, 1% NEAA, and 1% l‐glutamine at 37°C for 4 h. After cell surface staining with CD3 (145‐2C11), CD4 (RM4‐5), and CD45 (30‐F11) antibodies, cells were fixed and permeabilized with Intracellular Fixation/Permeabilization Kit (Thermo Fisher Scientific, Dreieich, Germany), and then stained with IL‐17 (TC11‐18H10), IFN‐γ (XMG1.2), and GM‐CSF (MP1‐22E9) antibodies, respectively. All antibodies were purchased from BD Biosciences (Heidelberg, Germany). Flow cytometry was performed with a FACSCanto II (BD Biosciences), and data were analyzed with FlowJo software.
Histopathology
Mice anesthetized with methoxyflurane were perfused with 0.1 M PBS followed by 4% paraformaldehyde in PBS. After embedding in paraffin, sections of brains and spinal cords were used for hemalum and eosin and cresyl violet–luxol fast blue (CV‐LFB) staining. Expression of CD45 (BD Biosciences, HI30), CD3 (Thermo Fisher Scientific, PA1‐37282), Mac3 (BD Biosciences, M3/84), and rabbit glial fibrillary acidic protein (GFAP; Dako, Waldbronn, Germany, GA52461‐2) was demonstrated in an ABC protocol with 3,3′ diaminobenzidine (Merck) and H2O2 as substrate.
For double immunofluorescence studies, mouse brain and spinal cord sections were consecutively stained with rabbit anti‐OTUB1 (Thermo Fisher Scientific, PA5‐58684), goat anti‐rabbit‐Cy3 (Dianova, Hamburg, Germany), mouse anti‐GFAP (Merck Millipore, GA5), or mouse anti‐NeuN (Merck Millipore, A60) with M.O.M. Kit (Vectastain, Vector, Burlingame, CA) with Streptavidin‐FITC according to manufacturer's instructions (Vector). In addition, OTUB1 staining was followed by incubation of sections with mouse anti‐NogoA detected by goat anti‐mouse Alexa Fluor 488.
Formalin‐fixed, paraffin‐embedded archival brain biopsy tissue of 10 human MS cases (Table EV1) was stained with rabbit anti‐OTUB1 plus goat anti‐rabbit‐Cy3 (Dianova), and mouse anti‐GFAP (Merck Millipore) plus rat anti‐mouse‐BSP (Dianova) followed by Extravidin‐FITC (Merck). In addition, OTUB1 staining was followed by incubation of sections with mouse anti‐NogoA detected by goat anti‐mouse Alexa Fluor 488 (Dianova). Control stainings were performed by omission of the primary anti‐OTUB1 and anti‐GFAP antibodies, respectively. Human brain biopsy tissue was obtained from the CNS tissue collection of the Department of Neuropathology, University of Cologne (Germany; Table EV1, cases 1–5, 11–13), and the Institute of Neuropathology of the University Medical Center Göttingen (Germany; Table EV1, cases 6–10). The study was performed in accordance with national and local ethics regulations and followed the rules of the Declaration of Helsinki of 1975, revised in 2008.
Histological quantification of demyelination and astrocyte activation
To determine the extent of demyelination, serial cross sections of the cervical spinal cord were stained with CV‐LFB. Myelination of at least ten spinal cord sections per mouse was measured using the ZEN imaging software (Zeiss, Oberkochen, Germany). The percentage of demyelinated areas as evidenced by lack of LFB staining was calculated with the total spinal cord area of the respective section set as 100%.
To determine astrocyte activation, longitudinally orientated serial spinal cord sections were stained with anti‐GFAP. The numbers of GFAP+ astrocytes were determined microscopically by counting GFAP+ astrocytic cell bodies in 20 high‐power fields (HPF, magnification ×400) per mouse.
Quantitative RT–PCR
Total mRNA was isolated from the spinal cord and cultured astrocytes with RNeasy Kit (Qiagen, Hilden, Germany). The SuperScript Reverse Transcriptase Kit (Thermo Fisher Scientific) was used to generate cDNA. Quantitative RT–PCR for OTUB1 (Mm00506597), TNF (Mm00443258), IFN‐γ (Mm00801778), IL‐17 (Mm00439619), GM‐CSF (Mm01290062), IL‐6 (Mm00446190), SOCS1 (Mm00782550), nitric oxide synthase 2 (NOS2; Mm00440485), chemokine (C‐X‐C motif) ligand 1 (CXCL1; Mm00433859), CXCL10 (Mm00445235), CXCL11 (Mm00444662), chemokine (C‐C motif) ligand 2 (CCL2; Mm99999056), and hypoxanthine phosphoribosyltransferase (HPRT; Mm01545399) was performed on the LightCycler 480 system (Roche, Mannheim, Germany). All primers were purchased from Thermo Fisher Scientific. The ratio between the respective gene and corresponding HPRT was calculated per sample according to the ∆∆ cycle threshold method (Livak & Schmittgen, 2001).
Primary astrocyte culture and treatment
Primary astrocytes were isolated from 1‐ to 2‐day‐old newborn mice as published before (Wang et al, 2013b). The purity of astrocyte cultures was more than 95%, as determined by immunofluorescence staining for GFAP and counterstaining with DAPI. To delineate the signaling pathways, astrocytes were stimulated respectively with 10 ng/ml IFN‐β (R&D Systems, Minneapolis, MN), 10 ng/ml TNF, 50 ng/ml IL‐17, and 10 ng/ml IFN‐γ (Peprotech, Hamburg, Germany). Expression plasmids pCMV6‐SOCS1‐MYC, pCMV6‐GFP, pCMV6‐OTUB1‐GFP (OriGene, Rockville, MD), pCMV6‐OTUB1‐ΔN‐GFP, and pCMV6‐OTUB1‐C91S‐GFP (generated with Q5 Site‐Directed Mutagenesis Kit) were transfected into primary astrocytes with Lipofectamine 3000 reagent (Thermo Fisher Scientific) according to manufacturer's instructions. For the detection of SOCS1 protein stability, 24 h after transfection with expression plasmids, astrocytes were treated with 100 μg/ml cycloheximide (Merck) for indicated times. For SOCS1 knockdown, primary astrocytes were transfected with SOCS1 siRNA (OriGene) in combination with Lipofectamine RNAiMAX reagent (Thermo Fisher Scientific).
Astrocyte isolation from adult mice
Spinal cords were isolated from naïve mice and EAE mice at day 15 p.i. Single‐cell suspension was generated with NeuroCult Enzymatic Dissociation Kit (Stemcell Technologies, Cologne, Germany) according to manufacturer's instructions. Astrocytes were separated with Mouse anti‐ACSA‐2 Microbead Kit (Miltenyi Biotec, Bergisch Gladbach, Germany), and the purity of isolated astrocytes was determined by FACS analysis with anti‐ACSA‐2‐PE antibody (Miltenyi Biotec, 130‐102‐365).
Western blot (WB)
Mouse organs and cultured astrocytes were lysed in RIPA lysis buffer supplemented with protease inhibitor cocktail and PMSF (all from Cell Signaling, Frankfurt, Germany). NE‐PER Nuclear and Cytoplasmic Extraction Kit (Thermo Fisher Scientific) was used to isolate cytoplasmic and nuclear protein. Cell lysates were cleared by centrifugation at 14,000 g at 4°C for 20 min. Supernatants were harvested and denatured in lane marker reducing sample buffer (Thermo Fisher Scientific) at 99°C for 5 min. WB was performed with antibodies against OTUB1 (Novus Biologicals, NBP1‐49934) 1:2,000, β‐Tubulin (Sigma‐Aldrich, T8328) 1:5,000, HDAC (Santa Cruz Biotechnology, sc‐81598) 1:500, SOCS1 (Santa Cruz Biotechnology, sc‐9021) 1:500, JAK1 (Millipore, 05‐1154) 1:500, phospho‐JAK2 (CST, #3771) 1:500, JAK2 (CST, #3230) 1:500, K48‐specific ubiquitin (CST, #4289) 1:1,000, GAPDH (CST, #5174) 1:1,000, GFP‐Tag (OriGene, TA150041) 1:5,000, GFAP (CST, #3670) 1:1,000, phospho‐STAT1 (701) (CST, #9167) 1:1,000, phospho‐STAT1 (727) (CST, #8826) 1:1,000, STAT1 (CST, #9172) 1:1,000, phospho‐IκBα (CST, #2859) 1:1,000, IκBα (CST, #4812) 1:1,000, phospho‐p38 (CST, #9215) 1:1,000, p38 (CST, #9212) 1:1,000, phospho‐ERK (CST, #9101) 1:1,000, ERK (CST, #9102) 1:1,000, phospho‐JNK (CST, #9251) 1:1,000, JNK (CST, #9252) 1:1,000, HA‐Tag (CST, #3724) 1:2,000, and MYC‐Tag (CST, #2276) 1:2,000. Blots were developed with an ECL Plus Kit (GE Healthcare). WB images were captured with the Intas Chemo Cam Luminescent Image Analysis system (INTAS Science Imaging Instruments, Göttingen, Germany) and analyzed using the LabImage 1D software (Kapelan Bio‐Imaging Solutions, Leipzig, Germany).
Immunoprecipitation
Whole cell lysates were prepared as described in “Western blot”. In a preclearing process, cell lysates were incubated with GammaBind G Sepharose beads (GE Healthcare) under continuous shaking at 4°C for 1 h. The beads were removed by centrifugation at 14,000 g at 4°C for 10 min. Equal amounts of lysates were incubated with anti‐OTUB1 (2 μg/mg lysate), anti‐SOCS1 (2 μg/mg lysate), and anti‐MYC (1 μg/mg lysate) antibodies, respectively, under continuous shaking at 4°C overnight. The immunocomplexes were subsequently captured by incubating with fresh GammaBind G Sepharose beads at 4°C for 2 h. The beads were washed five times with PBS by pulse centrifugation at 14,000 g at 4°C for 10 s. The beads were then resuspended in 2× lane marker reducing sample buffer and boiled at 99°C for 5 min. Thereafter, the samples were centrifuged at 14,000 g at 4°C for 1 min, and the supernatant was collected for WB.
Statistics
The two‐tailed Student's t‐test was used for the detection of statistical differences in all experiments except for the EAE curves (Mann–Whitney U‐test), disease onset (Kaplan–Meier survival curve followed by Gehan–Breslow–Wilcoxon test), and maximal scores (Mann–Whitney U‐test). P‐values < 0.05 were considered as significant. All experiments were performed at least twice.
Author contributions
XW, FM, WY, AB, GN, SJ, WB, and MD conducted the experiments and analyzed data. XW, MD, AW, WB, and DS designed the experiments, discussed the data, and wrote the paper.
Conflict of interest
The authors declare that they have no conflict of interest.
Supporting information
Appendix
Expanded View Figures PDF
Table EV1
Source Data for Expanded View and Appendix
Review Process File
Source Data for Figure 2
Source Data for Figure 5
Source Data for Figure 6
Source Data for Figure 7
Acknowledgements
This work was supported by a grant from the Deutsche Forschungsgemeinschaft (DFG) to XW (WA 3895/1‐1). The technical expertise of Nadja Schlüter, Annette Sohnekind, Elena Fischer, and Mariana Carstov is greatly acknowledged. The authors thank Andrea Kröger for critical reading of the manuscript.
The EMBO Journal (2019) 38: e100947
Contributor Information
Xu Wang, Email: xu.wang@med.ovgu.de.
Dirk Schlüter, Email: schlueter.dirk@mh-hannover.de.
References
- Arellano G, Ottum PA, Reyes LI, Burgos PI, Naves R (2015) Stage‐specific role of interferon‐gamma in experimental autoimmune encephalomyelitis and multiple sclerosis. Front Immunol 6: 492 [DOI] [PMC free article] [PubMed] [Google Scholar]
- Axtell RC, de Jong BA, Boniface K, van der Voort LF, Bhat R, De Sarno P, Naves R, Han M, Zhong F, Castellanos JG, Mair R, Christakos A, Kolkowitz I, Katz L, Killestein J, Polman CH, de Waal Malefyt R, Steinman L, Raman C (2010) T helper type 1 and 17 cells determine efficacy of interferon‐beta in multiple sclerosis and experimental encephalomyelitis. Nat Med 16: 406–412 [DOI] [PMC free article] [PubMed] [Google Scholar]
- Bajenaru ML, Zhu Y, Hedrick NM, Donahoe J, Parada LF, Gutmann DH (2002) Astrocyte‐specific inactivation of the neurofibromatosis 1 gene (NF1) is insufficient for astrocytoma formation. Mol Cell Biol 22: 5100–5113 [DOI] [PMC free article] [PubMed] [Google Scholar]
- Brambilla R, Persaud T, Hu X, Karmally S, Shestopalov VI, Dvoriantchikova G, Ivanov D, Nathanson L, Barnum SR, Bethea JR (2009) Transgenic inhibition of astroglial NF‐kappa B improves functional outcome in experimental autoimmune encephalomyelitis by suppressing chronic central nervous system inflammation. J Immunol 182: 2628–2640 [DOI] [PMC free article] [PubMed] [Google Scholar]
- Chen Y, Wang YG, Li Y, Sun XX, Dai MS (2017) Otub1 stabilizes MDMX and promotes its proapoptotic function at the mitochondria. Oncotarget 8: 11053–11062 [DOI] [PMC free article] [PubMed] [Google Scholar]
- Codarri L, Gyulveszi G, Tosevski V, Hesske L, Fontana A, Magnenat L, Suter T, Becher B (2011) RORgammat drives production of the cytokine GM‐CSF in helper T cells, which is essential for the effector phase of autoimmune neuroinflammation. Nat Immunol 12: 560–567 [DOI] [PubMed] [Google Scholar]
- De Jager PL, Jia X, Wang J, de Bakker PI, Ottoboni L, Aggarwal NT, Piccio L, Raychaudhuri S, Tran D, Aubin C, Briskin R, Romano S, MSGC International , Baranzini SE, McCauley JL, Pericak‐Vance MA, Haines JL, Gibson RA, Naeglin Y, Uitdehaag B et al (2009) Meta‐analysis of genome scans and replication identify CD6, IRF8 and TNFRSF1A as new multiple sclerosis susceptibility loci. Nat Genet 41: 776–782 [DOI] [PMC free article] [PubMed] [Google Scholar]
- Deshaies RJ, Joazeiro CA (2009) RING domain E3 ubiquitin ligases. Annu Rev Biochem 78: 399–434 [DOI] [PubMed] [Google Scholar]
- Ding X, Yan Y, Li X, Li K, Ciric B, Yang J, Zhang Y, Wu S, Xu H, Chen W, Lovett‐Racke AE, Zhang GX, Rostami A (2015) Silencing IFN‐gamma binding/signaling in astrocytes versus microglia leads to opposite effects on central nervous system autoimmunity. J Immunol 194: 4251–4264 [DOI] [PMC free article] [PubMed] [Google Scholar]
- Domingues HS, Mues M, Lassmann H, Wekerle H, Krishnamoorthy G (2010) Functional and pathogenic differences of Th1 and Th17 cells in experimental autoimmune encephalomyelitis. PLoS One 5: e15531 [DOI] [PMC free article] [PubMed] [Google Scholar]
- Dong W, Wang H, Shahzad K, Bock F, Al‐Dabet MM, Ranjan S, Wolter J, Kohli S, Hoffmann J, Dhople VM, Zhu C, Lindquist JA, Esmon CT, Grone E, Grone HJ, Madhusudhan T, Mertens PR, Schlüter D, Isermann B (2015) Activated protein C ameliorates renal ischemia‐reperfusion injury by restricting Y‐box binding protein‐1 ubiquitination. J Am Soc Nephrol 26: 2789–2799 [DOI] [PMC free article] [PubMed] [Google Scholar]
- Edelmann MJ, Iphofer A, Akutsu M, Altun M, di Gleria K, Kramer HB, Fiebiger E, Dhe‐Paganon S, Kessler BM (2009) Structural basis and specificity of human otubain 1‐mediated deubiquitination. Biochem J 418: 379–390 [DOI] [PubMed] [Google Scholar]
- Engelhardt B, Sorokin L (2009) The blood‐brain and the blood‐cerebrospinal fluid barriers: function and dysfunction. Semin Immunopathol 31: 497–511 [DOI] [PubMed] [Google Scholar]
- Engelhardt B, Carare RO, Bechmann I, Flugel A, Laman JD, Weller RO (2016) Vascular, glial, and lymphatic immune gateways of the central nervous system. Acta Neuropathol 132: 317–338 [DOI] [PMC free article] [PubMed] [Google Scholar]
- Goldmann T, Zeller N, Raasch J, Kierdorf K, Frenzel K, Ketscher L, Basters A, Staszewski O, Brendecke SM, Spiess A, Tay TL, Kreutz C, Timmer J, Mancini GM, Blank T, Fritz G, Biber K, Lang R, Malo D, Merkler D et al (2015) USP18 lack in microglia causes destructive interferonopathy of the mouse brain. EMBO J 34: 1612–1629 [DOI] [PMC free article] [PubMed] [Google Scholar]
- Goncharov T, Niessen K, de Almagro MC, Izrael‐Tomasevic A, Fedorova AV, Varfolomeev E, Arnott D, Deshayes K, Kirkpatrick DS, Vucic D (2013) OTUB1 modulates c‐IAP1 stability to regulate signalling pathways. EMBO J 32: 1103–1114 [DOI] [PMC free article] [PubMed] [Google Scholar]
- Herhaus L, Al‐Salihi M, Macartney T, Weidlich S, Sapkota GP (2013) OTUB1 enhances TGFbeta signalling by inhibiting the ubiquitylation and degradation of active SMAD2/3. Nat Commun 4: 2519 [DOI] [PMC free article] [PubMed] [Google Scholar]
- Hrdinka M, Gyrd‐Hansen M (2017) The Met1‐linked ubiquitin machinery: emerging themes of (De)regulation. Mol Cell 68: 265–280 [DOI] [PubMed] [Google Scholar]
- Hu H, Sun SC (2016) Ubiquitin signaling in immune responses. Cell Res 26: 457–483 [DOI] [PMC free article] [PubMed] [Google Scholar]
- Itoh N, Itoh Y, Tassoni A, Ren E, Kaito M, Ohno A, Ao Y, Farkhondeh V, Johnsonbaugh H, Burda J, Sofroniew MV, Voskuhl RR (2018) Cell‐specific and region‐specific transcriptomics in the multiple sclerosis model: focus on astrocytes. Proc Natl Acad Sci USA 115: E302–E309 [DOI] [PMC free article] [PubMed] [Google Scholar]
- Juang YC, Landry MC, Sanches M, Vittal V, Leung CC, Ceccarelli DF, Mateo AR, Pruneda JN, Mao DY, Szilard RK, Orlicky S, Munro M, Brzovic PS, Klevit RE, Sicheri F, Durocher D (2012) OTUB1 co‐opts Lys48‐linked ubiquitin recognition to suppress E2 enzyme function. Mol Cell 45: 384–397 [DOI] [PMC free article] [PubMed] [Google Scholar]
- Kamizono S, Hanada T, Yasukawa H, Minoguchi S, Kato R, Minoguchi M, Hattori K, Hatakeyama S, Yada M, Morita S, Kitamura T, Kato H, Nakayama K, Yoshimura A (2001) The SOCS box of SOCS‐1 accelerates ubiquitin‐dependent proteolysis of TEL‐JAK2. J Biol Chem 276: 12530–12538 [DOI] [PubMed] [Google Scholar]
- Kang Z, Altuntas CZ, Gulen MF, Liu C, Giltiay N, Qin H, Liu L, Qian W, Ransohoff RM, Bergmann C, Stohlman S, Tuohy VK, Li X (2010) Astrocyte‐restricted ablation of interleukin‐17‐induced Act1‐mediated signaling ameliorates autoimmune encephalomyelitis. Immunity 32: 414–425 [DOI] [PMC free article] [PubMed] [Google Scholar]
- Khaibullin T, Ivanova V, Martynova E, Cherepnev G, Khabirov F, Granatov E, Rizvanov A, Khaiboullina S (2017) Elevated levels of proinflammatory cytokines in cerebrospinal fluid of multiple sclerosis patients. Front Immunol 8: 531 [DOI] [PMC free article] [PubMed] [Google Scholar]
- Li S, Zheng H, Mao AP, Zhong B, Li Y, Liu Y, Gao Y, Ran Y, Tien P, Shu HB (2010) Regulation of virus‐triggered signaling by OTUB1‐ and OTUB2‐mediated deubiquitination of TRAF3 and TRAF6. J Biol Chem 285: 4291–4297 [DOI] [PMC free article] [PubMed] [Google Scholar]
- Linthicum DS, Munoz JJ, Blaskett A (1982) Acute experimental autoimmune encephalomyelitis in mice. I. Adjuvant action of Bordetella pertussis is due to vasoactive amine sensitization and increased vascular permeability of the central nervous system. Cell Immunol 73: 299–310 [DOI] [PubMed] [Google Scholar]
- Livak KJ, Schmittgen TD (2001) Analysis of relative gene expression data using real‐time quantitative PCR and the 2(‐Delta Delta C(T)) Method. Methods 25: 402–408 [DOI] [PubMed] [Google Scholar]
- van Loo G, De Lorenzi R, Schmidt H, Huth M, Mildner A, Schmidt‐Supprian M, Lassmann H, Prinz MR, Pasparakis M (2006) Inhibition of transcription factor NF‐kappaB in the central nervous system ameliorates autoimmune encephalomyelitis in mice. Nat Immunol 7: 954–961 [DOI] [PubMed] [Google Scholar]
- Maier J, Kincaid C, Pagenstecher A, Campbell IL (2002) Regulation of signal transducer and activator of transcription and suppressor of cytokine‐signaling gene expression in the brain of mice with astrocyte‐targeted production of interleukin‐12 or experimental autoimmune encephalomyelitis. Am J Pathol 160: 271–288 [DOI] [PMC free article] [PubMed] [Google Scholar]
- Malhotra S, Morcillo‐Suarez C, Nurtdinov R, Rio J, Sarro E, Moreno M, Castillo J, Navarro A, Montalban X, Comabella M (2013) Roles of the ubiquitin peptidase USP18 in multiple sclerosis and the response to interferon‐beta treatment. Eur J Neurol 20: 1390–1397 [DOI] [PubMed] [Google Scholar]
- Mevissen TET, Komander D (2017) Mechanisms of deubiquitinase specificity and regulation. Annu Rev Biochem 86: 159–192 [DOI] [PubMed] [Google Scholar]
- Nakada S, Tai I, Panier S, Al‐Hakim A, Iemura S, Juang YC, O'Donnell L, Kumakubo A, Munro M, Sicheri F, Gingras AC, Natsume T, Suda T, Durocher D (2010) Non‐canonical inhibition of DNA damage‐dependent ubiquitination by OTUB1. Nature 466: 941–946 [DOI] [PubMed] [Google Scholar]
- Narazaki M, Fujimoto M, Matsumoto T, Morita Y, Saito H, Kajita T, Yoshizaki K, Naka T, Kishimoto T (1998) Three distinct domains of SSI‐1/SOCS‐1/JAB protein are required for its suppression of interleukin 6 signaling. Proc Natl Acad Sci USA 95: 13130–13134 [DOI] [PMC free article] [PubMed] [Google Scholar]
- Ottum PA, Arellano G, Reyes LI, Iruretagoyena M, Naves R (2015) Opposing roles of interferon‐gamma on cells of the central nervous system in autoimmune neuroinflammation. Front Immunol 6: 539 [DOI] [PMC free article] [PubMed] [Google Scholar]
- Peng Y, Xu R, Zheng X (2014) HSCARG negatively regulates the cellular antiviral RIG‐I like receptor signaling pathway by inhibiting TRAF3 ubiquitination via recruiting OTUB1. PLoS Pathog 10: e1004041 [DOI] [PMC free article] [PubMed] [Google Scholar]
- Rothhammer V, Mascanfroni ID, Bunse L, Takenaka MC, Kenison JE, Mayo L, Chao CC, Patel B, Yan R, Blain M, Alvarez JI, Kebir H, Anandasabapathy N, Izquierdo G, Jung S, Obholzer N, Pochet N, Clish CB, Prinz M, Prat A et al (2016) Type I interferons and microbial metabolites of tryptophan modulate astrocyte activity and central nervous system inflammation via the aryl hydrocarbon receptor. Nat Med 22: 586–597 [DOI] [PMC free article] [PubMed] [Google Scholar]
- Sato Y, Yamagata A, Goto‐Ito S, Kubota K, Miyamoto R, Nakada S, Fukai S (2012) Molecular basis of Lys‐63‐linked polyubiquitination inhibition by the interaction between human deubiquitinating enzyme OTUB1 and ubiquitin‐conjugating enzyme UBC13. J Biol Chem 287: 25860–25868 [DOI] [PMC free article] [PubMed] [Google Scholar]
- Sofroniew MV (2015) Astrocyte barriers to neurotoxic inflammation. Nat Rev Neurosci 16: 249–263 [DOI] [PMC free article] [PubMed] [Google Scholar]
- Stromnes IM, Cerretti LM, Liggitt D, Harris RA, Goverman JM (2008) Differential regulation of central nervous system autoimmunity by T(H)1 and T(H)17 cells. Nat Med 14: 337–342 [DOI] [PMC free article] [PubMed] [Google Scholar]
- Sun XX, Challagundla KB, Dai MS (2012) Positive regulation of p53 stability and activity by the deubiquitinating enzyme Otubain 1. EMBO J 31: 576–592 [DOI] [PMC free article] [PubMed] [Google Scholar]
- Torre S, Polyak MJ, Langlais D, Fodil N, Kennedy JM, Radovanovic I, Berghout J, Leiva‐Torres GA, Krawczyk CM, Ilangumaran S, Mossman K, Liang C, Knobeloch KP, Healy LM, Antel J, Arbour N, Prat A, Majewski J, Lathrop M, Vidal SM et al (2017) USP15 regulates type I interferon response and is required for pathogenesis of neuroinflammation. Nat Immunol 18: 54–63 [DOI] [PubMed] [Google Scholar]
- Tronche F, Kellendonk C, Kretz O, Gass P, Anlag K, Orban PC, Bock R, Klein R, Schutz G (1999) Disruption of the glucocorticoid receptor gene in the nervous system results in reduced anxiety. Nat Genet 23: 99–103 [DOI] [PubMed] [Google Scholar]
- Vartanian T, Li Y, Zhao M, Stefansson K (1995) Interferon‐gamma‐induced oligodendrocyte cell death: implications for the pathogenesis of multiple sclerosis. Mol Med 1: 732–743 [PMC free article] [PubMed] [Google Scholar]
- Wang T, Yin L, Cooper EM, Lai MY, Dickey S, Pickart CM, Fushman D, Wilkinson KD, Cohen RE, Wolberger C (2009) Evidence for bidentate substrate binding as the basis for the K48 linkage specificity of otubain 1. J Mol Biol 386: 1011–1023 [DOI] [PMC free article] [PubMed] [Google Scholar]
- Wang X, Deckert M, Xuan NT, Nishanth G, Just S, Waisman A, Naumann M, Schlüter D (2013a) Astrocytic A20 ameliorates experimental autoimmune encephalomyelitis by inhibiting NF‐kappaB‐ and STAT1‐dependent chemokine production in astrocytes. Acta Neuropathol 126: 711–724 [DOI] [PubMed] [Google Scholar]
- Wang X, Haroon F, Karray S, Martina D, Schlüter D (2013b) Astrocytic Fas ligand expression is required to induce T‐cell apoptosis and recovery from experimental autoimmune encephalomyelitis. Eur J Immunol 43: 115–124 [DOI] [PubMed] [Google Scholar]
- Wang Y, Zhou X, Xu M, Weng W, Zhang Q, Yang Y, Wei P, Du X (2016) OTUB1‐catalyzed deubiquitination of FOXM1 facilitates tumor progression and predicts a poor prognosis in ovarian cancer. Oncotarget 7: 36681–36697 [DOI] [PMC free article] [PubMed] [Google Scholar]
- Wang P, Joberty G, Buist A, Vanoosthuyse A, Stancu IC, Vasconcelos B, Pierrot N, Faelth‐Savitski M, Kienlen‐Campard P, Octave JN, Bantscheff M, Drewes G, Moechars D, Dewachter I (2017a) Tau interactome mapping based identification of Otub1 as Tau deubiquitinase involved in accumulation of pathological Tau forms in vitro and in vivo . Acta Neuropathol 133: 731–749 [DOI] [PMC free article] [PubMed] [Google Scholar]
- Wang X, Zhang L, Zhang Y, Zhao P, Qian L, Yuan Y, Liu J, Cheng Q, Xu W, Zuo Y, Guo T, Yu Z, Zheng H (2017b) JOSD1 negatively regulates Type‐I interferon antiviral activity by deubiquitinating and stabilizing SOCS1. Viral Immunol 30: 342–349 [DOI] [PubMed] [Google Scholar]
- Wiener R, Zhang X, Wang T, Wolberger C (2012) The mechanism of OTUB1‐mediated inhibition of ubiquitination. Nature 483: 618–622 [DOI] [PMC free article] [PubMed] [Google Scholar]
- Yasukawa H, Misawa H, Sakamoto H, Masuhara M, Sasaki A, Wakioka T, Ohtsuka S, Imaizumi T, Matsuda T, Ihle JN, Yoshimura A (1999) The JAK‐binding protein JAB inhibits Janus tyrosine kinase activity through binding in the activation loop. EMBO J 18: 1309–1320 [DOI] [PMC free article] [PubMed] [Google Scholar]
- Zhu Y, Romero MI, Ghosh P, Ye Z, Charnay P, Rushing EJ, Marth JD, Parada LF (2001) Ablation of NF1 function in neurons induces abnormal development of cerebral cortex and reactive gliosis in the brain. Genes Dev 15: 859–876 [DOI] [PMC free article] [PubMed] [Google Scholar]
Associated Data
This section collects any data citations, data availability statements, or supplementary materials included in this article.
Supplementary Materials
Appendix
Expanded View Figures PDF
Table EV1
Source Data for Expanded View and Appendix
Review Process File
Source Data for Figure 2
Source Data for Figure 5
Source Data for Figure 6
Source Data for Figure 7