

Abstract
Introduction
Nicotinamide adenine dinucleotide (NAD+) is an essential pyridine nucleotide that serves as a key hydride transfer coenzyme for several oxidoreductases. It is also the substrate for intracellular secondary messenger signalling by CD38 glycohydrolases, DNA repair by poly(adenosine diphosphate ribose) polymerase, and epigenetic regulation of gene expression by a class of histone deacetylase enzymes known as sirtuins. The measurement of NAD+ and its related metabolites (hereafter, the NAD+ metabolome) represents an important indicator of cellular function.
Objectives
A study was performed to develop a sensitive, selective, robust, reproducible, and rapid method for the concurrent quantitative determination of intracellular levels of the NAD+ metabolome in glial and oocyte cell extracts using liquid chromatography coupled to mass spectrometry (LC/MS/MS).
Methods
The metabolites were separated on a versatile amino column using a dual HILIC-RP gradient with heated electrospray (HESI) tandem mass spectrometry detection in mixed polarity multiple reaction monitoring mode.
Results
Quantification of 17 metabolites in the NAD+ metabolome in U251 human astroglioma cells could be achieved. Changes in NAD+ metabolism in U251 cell line, and murine oocytes under different culture conditions were also investigated.
Conclusion
This method can be used as a sensitive profiling tool, tailoring chromatography for metabolites that express significant pathophysiological changes in several disease conditions and is indispensable for targeted analysis.
Keywords: LC/MS/MS, NAD+, Nicotinamide, Astrocytes, Brain, Oocytes
1. Introduction
Historically, nicotinamide adenine dinucleotide (NAD+) was identified as an important hydride acceptor which facilitates electron transfer to power redox reactions (Williamson et al. 1967). It is also an important coenzyme for several dehydrogenase reactions, including the catabolism of alcohol to acetylaldehyde via alcohol dehydrogenase (Mansson et al. 1978). More recently, NAD+ has been shown to exert pleio-tropic functions through NAD+ dependent enzymes, such as cyclic ADP ribose hydrolases or NAD+ glycohydrolases (CD38), poly(ADP-ribose) polymerases (PARPs), and his- tone deacetylases known as sirtuins (Kim et al. 2004; Zocchi et al. 1993; Haigis and Sinclair 2010). NAD+ is more than a regulator of metabolism, as it is also involved in numerous biological and pathophysiological processes, including cancer, stress response, inflammation, and ageing (Lin and Guarente 2003; Moon and Minhas 2017; Wang 2017; Mendelsohn and Larrick 2017). These discoveries have fuelled enthusiasm to examine both NAD+ anabolic pathways and the NAD+ metabolome in several model organisms. These studies have provided renewed insights into the functional roles of NAD+ and its related metabolites.
NAD+ is synthesised from the amino acid tryptophan (Trp) through the de novo kynurenine pathway (KP) (Braidy and Grant 2017). Furthermore nicotinamide (NAM), nicotinic acid (NA), and nicotinamide riboside (NR) are three forms of vitamin B3 which are NAD+ precursors via the salvage pathway (Bogan and Brenner 2008). Pathways for NAD+ synthesis from these precursors is shown in Fig. 1. Trp is converted to the N-methyl-D-aspartate (NMDA) agonist, quinolinic acid (QUIN), which is subsequently converted to nicotinic acid mononucleotide (NAMN) by the enzyme quinolinic acid phosphoribosyl transferase (QPRT) (Yan et al. 2015). NAMN synthesis is catalysed by nicotinamide mononucleotide adenylyltransferase (NMNAT) in the presence of ATP to produce nicotinic acid adenine dinucleotide (NAAD) (Musiek et al. 2016). NAD synthetase catalyzes the final step in the biosynthesis of NAD+ from NAAD. NA is converted to NAMN by the enzyme nicotinic acid phosphoribosyl transferase (NAPRT) using 5-phos-phoribosyl-1-pyrophosphate (PRPP) as a co-substrate, in an ATP-dependent manner (Formentini et al. 2009). As QUIN is converted to NAMN by the enzyme QPRT, the sequence of events leading to NAD+ production is identical after NAMN formation from either substrate. The enzyme nicotinamide phosphoribosyl transferase (NAMPT) using PRPP as a co-substrate converts NAM to nicotinamide mononucleotide (NMN), and then to NAD+ by the action of NMNATs in the presence of ATP. NR and its metabolite nicotinic acid riboside (NAR) represent newly identified precursors that can be converted to NAD+ via the NR kinase (NRK) pathway (Bieganowski and Brenner 2004), or by the action of nucleoside phosphorylase and the nicotinamide salvage pathway (Belenky et al. 2007). Alterations in NAD+ levels have a profound impact on several physiological processes, including metabolism, DNA repair, and gene expression (Mendelsohn and Larrick 2017; Piacente 2017; Weidele et al. 2017).
Fig. 1.
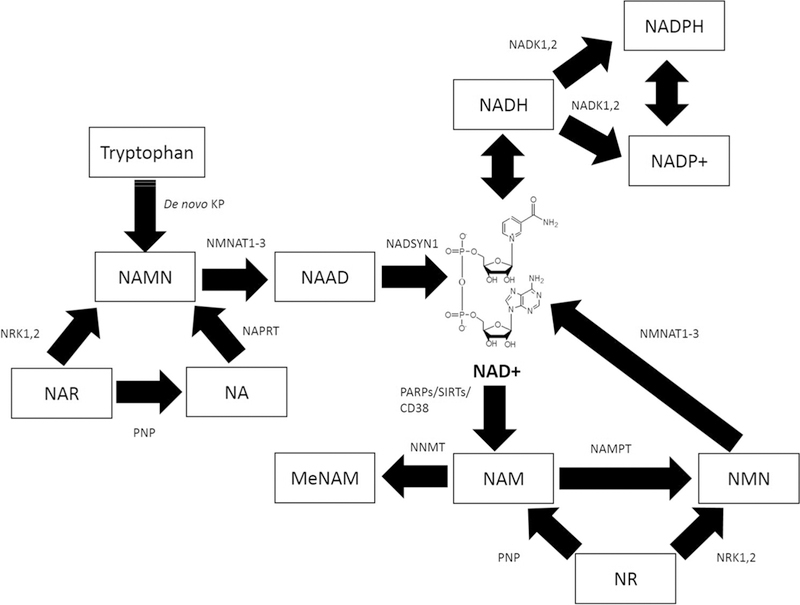
Intracellular NAD+ metabolism in eukaryotic cells. NAD+ can be synthesised from tryptophan, through the de novo KP. NAM, NA, NR, and NAR can act as NAD+ precursors via the salvage pathway. NAM can be converted to NMN by the enzyme NAMPT which is then converted to NAD+ by nicotinamide mononucleotide adeny-lyltransferase (NMNAT1–3). NAM can be methylated to N-methyl-nicotinamide (MeNAM) as a waste product by the catalytic activity of nicotinamide N-methyltransferase (NNMT). NAD+ can also be reduced to NADH, phosphorylated to NADP+ and further reduced to NADPH in reactions involving NAD kinases (NADK1,2). NAD+ can also be consumed by PARPs, Sirtuins, and CD38 NAD+ glycohydrolases to form NAM. NA can be metabolised to NAMN by the enzyme NAPRT which is then converted to NAD+ by the action of NMNAT1–3. NAR can be converted to NAMN required for NAD+ synthesis via the activity of nicotinamide riboside kinases (NRK1,2). NRK1,2 are also required for the conversion of NR to NMN and leading to NAD+ synthesis. NAR can also form NA via the action of purine nucleoside phosphorylase (PNP). PNP also converts NR to NAM
Apart from deficiency within the NAD+ biosynthesis process, there are principally two conditions under which NAD+ depletion in mammalian cells may occur: (1) excessive DNA damage due to free radical or UV attack, leading to hyperactivation of PARP (Fouquerel and Sobol 2014; Guarente 2014). This ultimately leads to a high turnover and subsequent depletion of NAD+. The resulting energy crisis and reduced ATP production can lead to cell death via either an apoptotic or necrotic pathway (Guarente 2014), (2) a chronic increase in immune activation and inflammatory cytokine production can accelerate CD38 activity and contributing to NAD+ decline (Long et al. 2017; Reyes et al. 2015). While several clinical and degenerative disorders can meet these criteria, chronic accumulation of oxidative stress and inflammation during advanced age has been associated with NAD+ decline in catabolic tissue from ‘physiologically’ aged rats and humans (Braidy et al. 2011, 2014; Massudi et al. 2012). NAD+ levels modulate the activity of SIRT1, a nuclear protein belonging to the sirtuin family, which regulates the circadian transcriptional regulation of clock genes, and the acetylation status of transcription factors, such as tumour suppressor protein (p53), FOXO forkhead box protein, and peroxisome proliferator activator receptor gamma (PPAR-γ) (Haigis and Sinclair 2010). Promotion of NAD+ synthesis using NAD+ precursors may prevent a clinically relevant therapeutic strategy to ameliorate the age-related decline in cellular energy. These findings provide renewed insight into the development of nutraceutical interventions aimed at promoting NAD+ synthesis as a therapeutic strategy to attenuate age-associated metabolic complications. Therefore, development of sensitive and specific methods for quantification of the NAD+ metabolome in a wide variety of specimens are warranted.
NAD+, adenosine, and related metabolites are chemically diverse (i.e., free bases, mono and di-nucleotides) that are endogenously present in a wide range of concentrations, thus making their concurrent analysis very challenging. These compounds have been previously measured using HPLC with UV detection (Coolen et al. 2008; Palfi et al. 2004; Katayama et al. 2001), capillary electrophoresis (Kaulich et al. 2003; Grob et al. 2003), NMR (Anderson et al. 2003; Guo et al. 2014), enzymatic approaches (Putt and Hergenrother 2004; Graeff and Lee 2002; Gibon and Larher 1997; Gasser et al. 2006), liquid chromatography with mass spectrometry detection (LC/ MS) (Evans et al. 2002; Wang et al. 2009) and tandem LC/ MS/MS (Cordell et al. 2008; Klawitter et al. 2007; Giannat-tasio et al. 2003; Trammell et al. 2016; Trammell and Brenner 2013; Evans et al. 2010; Yamada et al. 2006). Biochemical assays are affordable, quite sensitive and used extensively by researchers. However, most analyte measurements are indirect and require tedious enzymatic manipulation (Helenius et al. 2012; Brovko et al. 1994) making their use in complex samples difficult. Reverse phase HPLC/UV methods targeting nucleotides require the use of salt buffers as mobile phases with added ion pairing agents in order to increase the chromatographic retention of these highly polar metabolites. This approach is inexpensive but lacks the specificity and sensitivity that MS offers.
In the last decade, LC/MS/MS has become popular for the study of nucleotide metabolism using different chromatographic modes such as reverse phase with ion-pairing MS compatible buffers (Qian et al. 2004; Seifar et al. 2009), porous graphite stationary phase (Trammell and Brenner 2013; Xing et al. 2004) and HILIC (Evans et al. 2010; Zhang et al. 2014). In addition to the poor retention issue, nucleotides are prone to fragment in-source yielding interfering isobaric species. Similarly, redox pairs (i.e., NAD/NADH and NADP/NADPH) are only one mass unit apart and present similar fragmentation profiles. Therefore, robust and reliable chromatographic separation is paramount to avoid false identification and inaccurate quantification of these important metabolites.
The method described herein enables good chromatographic resolution of at least 17 metabolites using an amino phase column with polar selectivity reported. The method was validated for the analysis of astroglioma and oocyte cell extracts, and can also be applied to other human and animal tissue specimens pending further validation.
2. Materials and methods
2.1. Reagents, standards and chromatography consumables
MS grade acetonitrile, AR grade formic acid, ammonium acetate (NH4OAc), ammonium hydroxide, and all metabolite standards were purchased from Sigma (Sydney, Australia). Isotopically enriched internal standards (IS), namely 2H4-NAM, 13C5-adenosine, adenosine-3’,5’-cyclic-13C5-monophosphate, and adenosine 5’−13C5-monophosphate, 15N5-ADP and adenosine 13C1015N5 5’-triphosphate, were purchased from Toronto Research Chemicals (Toronto, Canada). 3 kDa filters were purchased from Millipore (Melbourne, Australia). The amino phase (NH2) column was purchased from Phenomenex (Melbourne, Australia). Dulbecco’s phosphate buffer solution (DBPS) and all other cell culture media and supplements were from Invitrogen (Melbourne, Australia) unless otherwise stated.
2.2. Preparation of astroglioma cell cultures
Human astroglioma (U251) cells were maintained in culture in 75 cm3 flasks (Costar, EK medical, Sydney, Australia) in RPMI supplemented with 10% fetal bovine serum (FBS), 1% 1-glutamax, 1% antibacterial/antifungal, and 0.5% glucose. Cells were maintained at 37 °C in a humidified atmosphere containing 95% air/5% CO2.
2.3. Quantification of the NAD+ metabolome in U251 astroglioma cells
U251 cells (American Type Culture collection) were trypsinised, washed, and seeded to 24 well tissue culture plates (Greiner labortechnik, Interpath Sydney, Australia) at 105 cells/well/ml of medium prior to experimentation. U251 cells were treated in with 20 μM L-Trp and 20 μM NAM for 24 h prior to sample extraction. Experiments were performed in triplicates unless otherwise stated.
2.4. Animals
This research was carried out in accordance with the Australian Code of Practice for the Care and Use of Animals for Scientific Purpose and was approved by the Animal Care and Ethics committee of the University of New South Wales (Approval Number AEC 15/134A). Mice were on the C57BL6J/Ausb genetic background. Animals were maintained on a 12 h light cycle (0700/1900) in individually ventilated cages at 22 ± 1 °C, 80% humidity at a density of five mice per cage. Animals were fed a standard chow diet from Gordon’s Specialty Feeds (Yanderra, NSW Australia) comprising 8% calories from fat, 21% calories from protein, and 71% calories from carbohydrates, with a total energy density of 2.6 kcal/g. Animals were used at 16 weeks of age.
2.5. Preparation of oocyte cell cultures
Mice were maintained in accordance with the Australian Code for the Care and Use of Animals for Scientific Purposes and with the approval of the University of New South Wales Animal Ethics Committee. C57BL/6J female mice were housed in temperature-controlled rooms (21–22 °C; 49–55% humidity) with 12 h light-dark cycle (lights on 7:00–19:00). A standard mouse maintenance chow and water was available ad libitum. Mice were hormonally stimulated by intraperitoneal injection with 5 IU/ml of Pregnant Mare’s Serum Gonadotropin (PMSG) (Folligon; Intervet, Boxmeer, Holland) at approximately 5 pm to stimulate follicle growth. After 44–46 h, ovaries were collected in HEPES-buffered minimum essential medium (aMEM; Gibco Life Technologies, Grand Island, NY) supplemented with 3 mg/ ml bovine serum albumin (BSA; Sigma Aldrich, St. Louis, MO). Cumulus oocyte complexes (COCs) were isolated from preovulatory follicles using a 27-gauge needle and collected using flame-pulled borosilicate Pasteur pipettes in M2 medium supplemented with 3 mg/ml BSA and 100 μM IBMX (Sigma Aldrich) to maintain meiotic arrest. COCs were mechanically denuded of cumulus cells by pipetting.
2.6. Quantification of the NAD+ metabolome in murine oocyte cells
In order to investigate the threshold number of oocytes for mass spectrometry detection, tubes of 1, 5 and 10 oocytes from 16-week-old mice were placed in 80% methanol and flash frozen in liquid nitrogen and stored in – 80 °C until processing. In another experiment, COCs from 3 week old mice were cultured for 2 h in bicarbonate buffered aMEM (Gibco) supplemented with 3 mg/ml BSA ± 250 μM 5-aminoimidazole-4-carboxamide-1-β-D-ribofuranoside (AICAR; Toronto Research Chemicals) (n = 3 biological replicates). Oocytes were denuded of their cumulus cells prior to sample extraction.
2.7. Sample and standard preparation
Stock solutions of individual metabolites were prepared at 10 mM concentration in MilliQ water and kept at – 80 °C for up to 4 months. Intermediate standards were prepared by diluting and combining all compounds to yield 100 and 10 μM concentrations, these could be kept at – 80 °C for 1 month. Calibrators (0, 0.1, 0.2, 0.4, 0.6, 0.8, 1.6, 2.0, and 4.0 μM) were prepared by mixing aliquots of intermediate standards with a fixed volume of internal standard mixture in 1.5 ml Eppendorf tubes, dried, reconstituted in 200 μL of 100 mM NH4OAc buffer and transferred into 200 μL glass vials and capped prior to LC/MS/MS analysis. Cells were washed gently with 0.9% w/v cold isotonic NaCl and extracted in 5 ml of 80% methanol, sonicated, vortexed and spun to remove the protein pellet. Cell extracts were diluted with water (1:1) and filtered through 3 kDa membrane cartridges. Samples were mixed with a fixed volume of internal standard mixture in 1.5 ml Eppendorf tubes, dried, reconstituted in 200 μl of 100 mM NH4OAc buffer and transferred into 200 μl glass vials and capped before LC/MS/ MS analysis.
2.8. HESI-LC/MS/MS Instrument optimization and set up
LC/MS/MS was carried out using a UPLC-MSD assembly consisting of an Accela AS injector, Accela UPLC pump, and a TSQ Vantage bench-top mass spectrometer (ThermoFisher Scientific, Waltham, MA) equipped with a heated electrospray probe (HESI). Each NAD+ metabolite (50 μM in 50% methanol) was infused at 10 μl/min by means of the Vantage syringe pump system into the MSD and subjected to collision induced dissociation in negative and positive ion mode to determine the most intense product ion (optimum sensitivity) and its associated collision voltage. These transitions (SRM) were subsequently set in the method MSD parameters. Hence, the MSD was operated in mixed polarity multiple reaction monitoring mode (MRM). All transitions and collision energies are shown in Table 1. Spectra were accumulated during 0.250 s per transition. MSD capillary voltage, capillary temperature and collision gas pressure (argon) were set to 4000 V, 300 °C and 1.0 Torr respectively. Sheath and auxiliary gas valves (nitrogen) were set at 20 and 10 arbitrary units.
Table 1.
List of metabolites analysed by this approach, retention times, the MS/MS transitions used for quantification and the collision energy voltages
| Analyte | Retention time (min) |
Polarity | Transitions (m/z) |
Collision Energy (V) |
|---|---|---|---|---|
| NAM | 2.36 | + | 123 > 80 | 25 |
| 2H4-NAM | 2.36 | + | 127 > 80 | 25 |
| Adenosine | 2.87 | ‑ | 266 > 134 | 25 |
| 13C5-Adenosine | 2.87 | ‑ | 271>134 | 25 |
| MeNAM | 4.48 | + | 137 > 80 | 20 |
| NA | 5.97 | + | 124 > 78 | 25 |
| cAMP | 6.09 | ‑ | 328>79, 134 | 25 |
| 13C5-cyclic AMP | 6.10 | ‑ | 333 > 134 | 25 |
| NMN | 6.63 | + | 335 > 123 | 20 |
| NAD | 6.65 | + | 664>428, 524 | 18 |
| NAAD | 10.69 | + | 665>136, 428 | 35 |
| NADH | 10.70 | + | 666 > 514, 649 | 20 |
| AMP | 10.71 | ‑ | 346 > 79, 97, 134 | 25 |
| 13C5-AMP | 10.73 | ‑ | 351>134 | 25 |
| cADPR | 10.74 | ‑ | 540>273, 408 | 30 |
| ADPR | 10.74 | ‑ | 558>346 | 28 |
| NAMN | 10.78 | + | 336 > 97.6, 124 | 25 |
| NADP+ | 10.79 | + | 744>136, 508 | 30 |
| ADP | 11.19 | ‑ | 426 > 134, 159 | 25 |
| 15N5-ADP | 11.20 | ‑ | 431>139, 159 | 25 |
| NADPH | 13.28 | + | 746 > 729 | 20 |
| ATP | 16.54 | ‑ | 506>159, 408 | 25 |
| 13C1015N5-ATP | 16.60 | ‑ | 521>159, 408 | 25 |
2.9. Chromatographic separation of nucleotides and related metabolites and MS detection
Standards and samples (20 μL) were injected onto a Phenom-enex NH2 column (150 mm × 2 mm × 3 μm). A binary solvent gradient consisting of 5 mM NH4OAc pH 9.5 adjusted with ammonia (mobile phase A) and acetonitrile (mobile phase B) with a flow rate of 250 μl/min. Initial solvent composition at injection was 25% A, followed by a 2-min gradient to 45% A and a fast gradient ramp to 80% A (0.1 min) which was maintained for 5.9 min, A was increased again to 95% (2 min), held for 13 min and then reverted to initial conditions (0.1 min) for equilibration, with a total run time of 30 min. The column flow was directed into the MS detector (MSD). Retention times are shown in Table 1.
2.10. Data analysis and quantification
Calibration curves of individual metabolites were constructed using the peak area ratios (peak area of the metabolite divided by peak area of the selected IS) of each calibrator versus its concentration. Selected IS were as follows: 2H4-NAM for NAM, MNAM, NA, NaMN, ADPR, c-ADPR, NaAD, and NADPH; 13C5-ADO for ADO; 13C5-Cyclic AMP for c-AMP, NMN and NAD; 13C5-AMP for AMP, 15N5-ADP for ADP and NADP; 13C1015N5-ATP for ATP and NADH. The concentrations of the endogenous metabolites in the cell extracts were obtained from these calibration curves. All spectra were processed and peak areas integrated using Xcalibur™ software (version 2.2, 2011, ThermoFisher Scientific, Waltham, MA). Automated data processing was performed using the LCquan feature of the software.
2.11. Method validation—accuracy and precision
U251 cancer cell line astrocytes were grown as described. Five biological replicates of these astrocyte extracts (200 μl equivalent to approximately 100,000 cells per replicate) were spiked with IS and metabolite standard mixture at four concentration levels: 0 (sample blank containing only internal standard), 0.4, 0.8 and 2 μM when reconstituted in 200 μl buffer before LC/MS/MS analysis. Each batch was run on separate days. Metabolite recovery was calculated using the equation:
[(Found concentration - endogenous blank sample concentration) × 100%]/added concentration
3. Results and discussion
3.1. An LC/MS/MS approach to quantify 17 metabolites in the NAD+ metabolome
The advantages of using a triple quadrupole MS is the ability to perform MRM, to detect transitions and optimise ionisation, thereby providing both specificity and sensitivity. Specific tandem MS transitions were determined and optimised during the HESI infusion experiment (ESI was not available). Most metabolites were ionised in both polarity modes and our method is represented as mixed polarity mode. The NAD+ metabolome, in general is very labile under standard electrospray ionisation conditions (ESI) and readily undergoes in-source fragmentation (i.e., ATP loses a phosphate group producing ADP-like fragments, NAD+ yields NAM, etc.). NAD+ related redox pairs are nearly isobaric (+ 1 Dalton) and yield similar product ions under collision- induced dissociation. Thus, poor chromatographic resolution can potentially lead to inaccurate annotation as previously reported by Xu and Trammell who highlighted the need for optimum chromatography (Trammell and Brenner 2013; Xu et al. 2015). Similar in-source fragmentation of these nucleotides was observed under HESI conditions. Although increased sensitivity using HESI has been reported previously by Lu et al. (2008) for some metabolites, for NAD+, their evaluation using both HESI and ESI did not show improvement in signal to noise ratios (Lu et al. 2008). Therefore, both ESI and HESI would be suitable with appropriate optimisation/tuning evaluation carried out in ESI mode if a HESI probe is not available.
3.2. Tailored nucleotide extraction/separation procedure
The NAD+ metabolome includes several dinucleotides, nucleotides, nucleosides, nucleobases, and related compounds (Fig. 2). Sampling and metabolite extraction of the NAD+ metabolome from biological samples is perhaps the most important aspects of any metabolomics workflow. These processes are complicated by the chemical variability and stability of the compounds involved and by their disparate concentration levels, requiring optimal extraction. Precision of the method was expressed as the coefficient of variation (CV%).
Fig. 2.
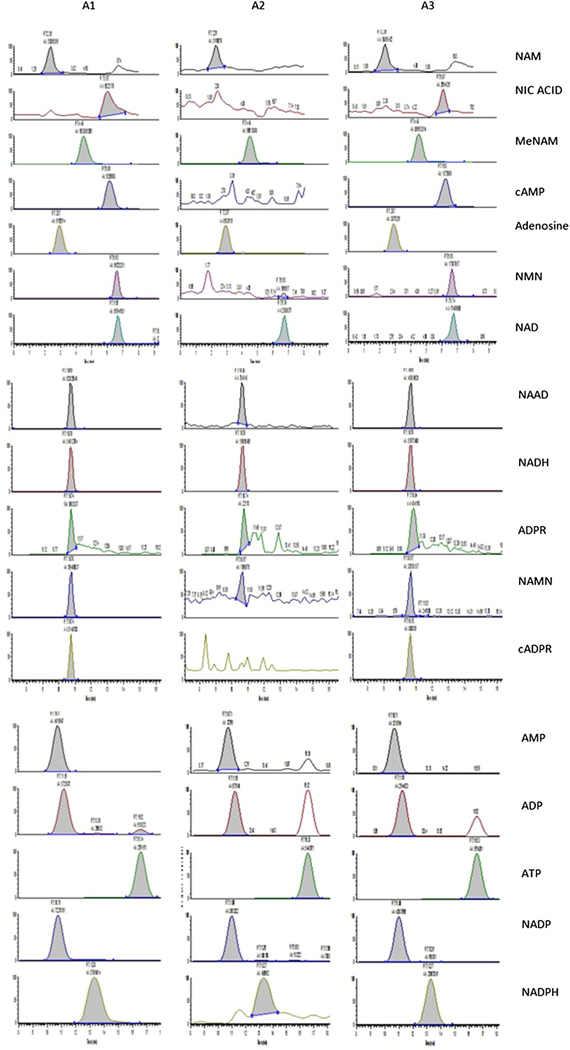
Chromatograms of all 17 metabolites generated using our improved LC/MS/MS technique. A1 0.8 μM standard, A2 Blank U251 cell extract, A3 0.4 μM Spiked U251 cell extract. Experiments were performed in triplicate. However, a pooled extract was used for spiking
Furthermore, the metabolic turnover of cellular nucleotides is very high due to the action of endogenous degrading enzymes (Nikiforov et al. 2015; Ipata and Pesi 2015); it is essential to rapidly block cell metabolism by irreversibly inactivating nucleotidases during these steps (Winder et al. 2008; Koning and Dam 1992). For instance, intracellular NAD+ levels can be degraded down to 1% of the expected concentration by enzymatic activity upon cell lysis. Dramatic changes or losses in metabolite levels during storage and sample preparation can occur if specific precautions are not followed, resulting in a false snapshot of the metabolite pool.
Intracellular nucleotide extraction is traditionally performed using either hot or ice-cold organic solvent such as methanol (Faijes et al. 2007), ethanol (Grob et al. 2003), acid or alkaline solutions (Giannattasio et al. 2003) and more extensively perchloric acid (PCA). Some nucleotides are unstable in PCA, undergoing chemical degradation (i.e., conversion of NADH to ADPR), and was therefore avoided in our current assay. In this study, cell pellets were first washed gently with a cold isotonic sodium chloride solution in order to remove extracellular metabolites present in the culture media. This was previously reported as an effective rinsing agent for mammalian cells with minimum metabolite loss due to cell leakage (Dietmair et al. 2010). The extraction was carried out using ice-cold 80% methanol which was found suitable for the extraction and molecular integrity of the metabolites under investigation (Supplementary File 2). This extraction protocol was compared on oocytes to that reported by (Trammell and Brenner 2013) who used heated buffered ethanol as an extraction solvent. The two extraction protocols produced comparable NAD+ and NAM levels in oocytes (Fig. 3). This demonstrates that the methanol extraction protocol used in our study is sufficient to rapidly quench the NAD+ metabolome.
Fig. 3.
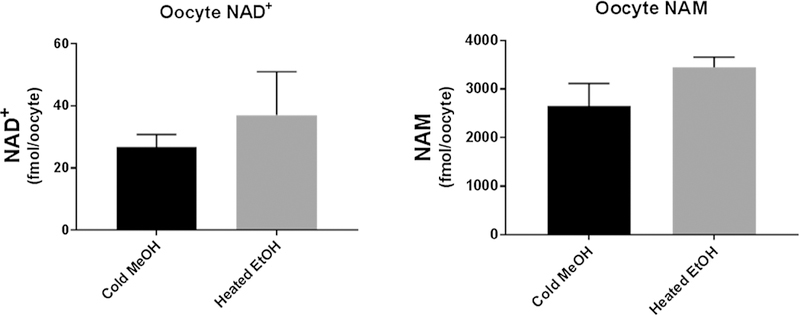
Comparison of our methanol extraction method (ice-cold 80% methanol) versus heated buffered ethanol (75% ethanol/25% 10 mM HEPES, pH 7.1 v/v) extraction as described by Trammell and Brenner (2013), on mouse oocytes
3.3. Matrix effect
The matrix effect is the ion signal suppression or enhancement caused by sample constituents, and was observed for some of the metabolites. A great advantage of MS analysis is that it allows the use of isotopically labelled analyte counterparts for internal standardization which corrects for matrix effects and any losses or degradation of the target analyte that might occur during sample workup. The matrix effect was evaluated by comparing slopes of calibration curves obtained running standard solutions made up in 100 mM NH4OAc buffer with those from standard addition calibration on neat cell extracts (Table 2). Signal suppression of ≤ 20% for NaMN, MNAM, and NADH; and signal enhancement of 17% for NA were observed. The variability for the other analytes fell within ± 10%; it was concluded that the matrix effect when using internal standards was not significant and the quantification proceeded using calibrators made up in buffer.
Table 2.
The r2 and limit of quantification (LOQ: signal to noise ratio > 10) of each analyte quantified using this LC/MS/ MS assay
| Analyte | Internal Standard Used | LOQ (pmol on column) |
r2 (Stds in buffer) |
aMatrix effect (%) |
|---|---|---|---|---|
| NAM | 2H4-NAM | 0.2 | 0.9909 | + 10 |
| Adenosine | 13C5-ADO | 0.05 | 0.9934 | 0 |
| MeNAM | 2H4-NAM | 0.01 | 0.9918 | –20 |
| NA | 2H4-NAM | 2.0 | 0.9949 | +17 |
| cAMP | 13C5-Cyclic AMP | 0.05 | 0.9985 | –4 |
| NMN | 13C5-Cyclic AMP | 0.1 | 0.9894 | –4 |
| NAD+ | 13C5-Cyclic AMP | 0.1 | 0.9913 | –3 |
| NAAD | 2H4-NAM | 0.02 | 0.9882 | –18 |
| NADH | 13C1015N5-ATP | 0.2 | 0.9878 | –17 |
| AMP | 13C5-AMP | 0.2 | 0.9912 | –4 |
| cADPR | 2H4-AMP | 0.2 | 0.9929 | 0 |
| ADPR | 2H4-AMP | 0.2 | 0.9911 | 0 |
| NAMN | 2H4-AMP | 0.2 | 0.9821 | –20 |
| NADP+ | 15N5-ADP | 0.04 | 0.9901 | +7 |
| ADP | 15N5-ADP | 0.4 | 0.9958 | +6 |
| NADPH | 2H4-NAM | 0.2 | 0.9923 | –7 |
| ATP | 13C1015N5-ATP | 0.4 | 0.9929 | –5 |
The standard curves are shown in the supplementary file 1
positive values denote signal enhancement and negative values indicate signal suppression
3.4. Quantification of the NAD+ metabolome using isotopic labels
Previously reported LC/MS/MS assays used IS derived by yeast cultured in 13C-glucose supplemented [13C15N] labelled medium (Evans et al. 2002) or in 13C-glucose with excellent correlation results (Trammell and Brenner 2013). Ideally, quantification should involve IS for all assayed metabolites but it is not always feasible to prepare them inhouse if cell cultures facilities are unavailable. Most NAD+ metabolite isotopic labels are not commercially available or may be prohibitively expensive to request custom synthesis from suppliers. If an exact label is not an option, a closely related molecule (structural analog) can also be used (Yamada et al. 2006) provided that it is deemed of similar stability and ionisation efficiency during analysis. Evans et al. (2010) used an external standard approach to quantitate 18 metabolites (including ten in our study) with excellent correlation coefficients. Since not all isotopic labels were available for this study; those which provided the best correlation coefficients (r2) were selected (r2 ≥ 0.98) (Table 2). For the metabolites with matching IS r2 ≥ 0.99 were obtained (Supplementary File 1). Seven point (triplicate) calibration standard curves covering the estimated endogenous concentration range (0.1–4 μM) of metabolites in cell extracts were constructed.
3.5. Utility of quantifying the NAD+ metabolome in amino phase
Reverse phase LC/MS based approaches have been used to study mammalian NAD+ metabolism. The incorporation of isotopically labelled pyridine precursors into NAD by human tumour liver cells was elucidated (Evans et al. 2002). Yamada et al. (2006) were the first to directly quantitate several NAD+ related metabolites including NAM, NaMN and NMN in erythrocytes and in human glioma cells (Yam-ada et al. 2006). The analysis of these highly hydrophilic compounds using reverse phase LC/MS/MS is challenging because they are poorly retained without the use of ion-pairing agents which increase retention at the expense of sensitivity or limit their use in negative ion mode.
Porous graphitic carbon (PGC) stationary phase columns provide good retention and separation of nucleotides. Trammell and Brenner (2013) used two PGC columns under separate acidic and basic chromatographic conditions to quantify the NAD+ metabolome in yeast (Trammell and Brenner 2013). They obtained baseline resolution of redox pairs and great peak shapes (Trammell and Brenner 2013). However, they could not reliably quantify AMP, since the method failed to resolve AMP from ADP and ATP (the latter fragmented in-source to AMP, thus confounding results). In addition, PGC columns require high maintenance and their usage comes with great challenges (Pabst et al. 2010).
HILIC offers a good alternative for LC/MS separations, without the need of unfriendly buffers. In particular, the Phe-nomenex Luna NH2 column provides good retention and chromatographic resolution of water soluble metabolites including nucleotides.
Evans et al. (2010) developed a positive ion HILIC/MS/ MS assay using a Luna NH2 column to identify NAD+ and other related nucleosides and nucleotides in yeast extracts (Evans et al. 2010). The method we report is an adaptation of their work with some modifications. Optimizing the solvent gradient and dissolving the samples in 100 mM NH4OAc allowed the retention and adequate separation of adenosine related nucleotides to also be possible in this assay as well as ADPR and cADPR (not tested by Evans) (see Supplementary File 2).
The chromatographic gradient used involves a dual HILIC (initial) followed by a “quasi” reversed phase mode/ elution of metabolites. By manufacturer’s specifications, the amino groups bound to the silica surface serve as weak anion exchangers and offer polar selectivity under reverse phase, normal phase, ion-exchange, or HILIC conditions.
It was hypothesised that its ability to retain metabolites through various interactions was due to the fact that these were weaker in water than in the organic solvent permitting their efficient elution with water (Bajad et al. 2006). Additionally, this stationary phase is stable under alkaline conditions, which favours both separation and negative polarity ionization. However, particular care should be given to sample clean up and column storage; the reactive nature of amino functional groups can cause the irreversible adsorption of unwanted species on the phase (Ikegami et al. 2008).
The versatility of the NH2 column allowed the retention and separation of the chemically diverse metabolites under study. The proposed method covers the NAD metabolome as well as adenosine phosphates in one single chromatographic run. Chromatography is the main challenge in the analysis of these compounds and therefore this method presents an improvement on those previously published. Sensitivity is comparable to other methods.
3.6. Quality assurance
The repeatability and reproducibility of this method were determined by validation in biological samples. Human U251 astroglial extracts were spiked with a known amount of each compound at three concentration levels, and then analyzed as described. The results of these experiments were used to determine the inter-day accuracy (recoveries) and precision (CV%) of this method and are summarized in Table 3. The overall CV% were < 8% and the recoveries ranged from 86 to 110%, indicating that this method is accurate and precise. We pooled 100,000 cells and analysed them to evaluate endogenous concentrations and based on these results we determined spike levels for the validation. Our repeated experiments using 400,000 cells showed that most metabolites were detectable (Supplementary File 3). The sensitivity and reliability of this assay is further evident by the concentrations for 5 and 10 oocytes which are within the same magnitude of difference.
Table 3.
Inter-day accuracy (recoveries) and precision (CV%) of this method in human U251 astroglioma cells
| Analyte | Added Conca
(μM) |
Inter-dayb recovery (%) |
Inter-dayb
(CV%) |
Overall recovery (%) |
Overall (CV%) |
|---|---|---|---|---|---|
| NAM | 0.4 | 97.1 | 2.37 | 98.8 | 3.09 |
| 0.8 | 101.8 | 4.67 | |||
| 2.0 | 97.4 | 2.22 | |||
| Adenosine | 0.4 | 96.1 | 6.62 | 100.5 | 4.55 |
| 0.8 | 104.7 | 3.90 | |||
| 2.0 | 100.8 | 3.13 | |||
| MeNAM | 0.4 | 80.3 | 3.24 | 86.6 | 3.70 |
| 0.8 | 91.9 | 3.76 | |||
| 2.0 | 87.6 | 4.11 | |||
| NA | 0.4 | 105.5 | 3.77 | 110.0 | 4.94 |
| 0.8 | 110.7 | 3.97 | |||
| 2.0 | 113.8 | 7.10 | |||
| cAMP | 0.4 | 90.4 | 5.29 | 96.7 | 5.91 |
| 0.8 | 100.5 | 6.70 | |||
| 2.0 | 99.4 | 5.74 | |||
| NMN | 0.4 | 105.5 | 6.66 | 107.3 | 7.29 |
| 0.8 | 111.4 | 8.48 | |||
| 2.0 | 105.1 | 6.72 | |||
| NAD+ | 0.4 | 102.8 | 3.62 | 100.5 | 4.55 |
| 0.8 | 109.9 | 3.52 | |||
| 2.0 | 106.1 | 6.87 | |||
| NAAD | 0.4 | 83.6 | 3.87 | 90.9 | 4.95 |
| 0.8 | 95.7 | 5.24 | |||
| 2.0 | 93.4 | 5.75 | |||
| NADH | 0.4 | 91.8 | 6.65 | 98.5 | 6.57 |
| 0.8 | 105.8 | 6.88 | |||
| 2.0 | 97.9 | 6.18 | |||
| AMP | 0.4 | 93.6 | 7.38 | 99.3 | 5.93 |
| 0.8 | 104.8 | 5.65 | |||
| 2.0 | 99.6 | 4.76 | |||
| NaMN | 0.4 | 82.4 | 7.37 | 83.6 | 5.34 |
| 0.8 | 84.3 | 4.04 | |||
| 2.0 | 84.3 | 4.59 | |||
| cADPR | 0.4 | 88.1 | 6.64 | 93.9 | 5.23 |
| 0.8 | 94 | 3.63 | |||
| 2.0 | 99.6 | 5.44 | |||
| ADPR | 0.4 | 100.7 | 9.82 | 101.3 | 7.75 |
| 0.8 | 105.1 | 6.15 | |||
| 2.0 | 98.1 | 7.29 | |||
| NADP+ | 0.4 | 98.2 | 5.39 | 103.1 | 6.91 |
| 0.8 | 108.1 | 6.65 | |||
| 2.0 | 102.9 | 8.68 | |||
| ADP | 0.4 | 99.6 | 5.68 | 102.2 | 4.90 |
| 0.8 | 103.4 | 3.94 | |||
| 2.0 | 103.5 | 5.08 | |||
| NADPH | 0.4 | 85.5 | 7.68 | 91.2 | 5.83 |
| 0.8 | 95.9 | 4.60 | |||
| 2.0 | 92.2 | 5.22 | |||
| ATP | 0.4 | 102.1 | 2.45 | 100.9 | 3.31 |
| 0.8 | 106.3 | 4.02 | |||
| 2.0 | 94.2 | 3.47 | |||
Spike added to neat cell extracts at three concentration levels
Average of 15 replicates per concentration level (three batches analysed on different days)
3.7. Effect of L-Trp and NAM on the NAD+ metabolome in U251 Astroglioma cell line upon further supplementation
We investigated the role of L-Trp in the maintenance of intracellular NAD+ levels and its effect on the NAD+ metabolome (Table 4). Each chromatogram is shown in Supplementary File 4. Supplementary File 5 shows that NAM was not contaminated with NA. Individual treatment of astroglial cells with 20 μM L-Trp and NAM for 24 h respectively led to a significant increase in NAD+, NAAD, NADP and ATP compared to non-treated control cells. The increase in NAD+ was greatest in cells treated with L-Trp compared to cells treated with NAM. Upregulation of the KP and its induction in glioblastoma cells has been previously shown to inhibit tumour-specific immunity by facilitating L-Trp catabolism from the tumour microenvironment, and leading to suppression of T-cell proliferation and promoting malignant progression (Adams et al. 2012). Enhanced KP activation may also lead to the accumulation of other neuroactive KP metabolites including, 3-hydroxykynurenine and 3-hydroxy-anthranilic acid, both of which have specific immunosuppressive effects relevant to tumour biology (Adams et al. 2014).
Table 4.
Effect of L-Trp and NAM supplementation on the NAD+ metabolome in human U251 astroglioma cell lines
| NAM | MeNAM | NAD | NADH | NIC | NAAD | NADP | NADP | ADP | ATP | |
|---|---|---|---|---|---|---|---|---|---|---|
| No Treatment | 73.4±21 | 450 ±70 | 1160 ±310 | 3590±820 | 580±380 | 700 ±180 | 50 ±20 | 780 ±170 | 1657±290 | 10,013 ±1550 |
| 20 μM Tryp | 29.9 ±8 | 400 ±11.5 | 2230± 138.6* | 5110± 1530 | 170 ±57.7 | 1710 ±115* | 40 ± 11.5 | 1640 ±130* | 1845 ±46 | 25,803 ±2820* |
| 20 μM NAM | 67.8 ±19 | 780 ±10* | 1970±75* | 5890 ±2869 | 190 ± 155.9 | 1050± 375.3 | 50±7.1 | 1050± 56.6 | 2050 ±456 | 18.076 ± 1561* |
N = 3 biological replicates
p<0.05 compared to no treatment
Moreover, our data also shows increased levels of the NAM metabolite, N-methylnicotinamide (MeNAM) in astroglioma cells following treatment with NAM. NAM is methylated by the enzyme, NNMT to form MeNAM, which is further metabolised to N-methyl-2-pyridone-5-carboxamide (2PY). Increased levels of NAM have been shown to stimulate NAD+ synthesis by entering the polyamine flux.
3.8. The NAD+ metabolome in murine oocytes
To our knowledge, this is the first study to quantify 11 metabolites—MeNAM, NAM, NMN, NAD+, NADH, NADP+, NADPH, NAAD, NAMN, ADPR, and cADPR— in murine oocytes (Table 5). Individual chromatograms are shown in Supplementary Files 6 and 8. Interestingly, NA was not detected, and this may be due to the lack of existing machinery to produce NA in oocytes. Previous studies have examined the effects of NAM on oocytes. NAM prevented fertilization-induced completion of meiosis I in ascidian oocytes by antagonising the inactivation of cyclin-dependent kinase 1 (Cdkl) (Wilding et al. 1999). NAM levels have also been shown to regulate in vitro ageing of mouse oocytes (Lee et al. 2013). Inhibition of embryo development has also been reported with NAM treatment which closely resembled the effect of two SIRT1 inhibitors, Sirtinol and BML- 210 (Kawamura et al. 2010). This suggests that the levels of NAM inhibit sirtuins in reproductive cells in a similar way to somatic cell. As chronic age-related oxidative stress is known to induce NAD+ depletion, our newly described assay can be further used to characterise functional effects of changes to the NAD+ metabolome during reproductive ageing which has profound adverse effects on oocyte quality. This will be of relevance to increasing our understanding of oocyte biology and managing infertility in women of advancing reproductive age.
Table 5.
Concentration of metabolites in the NAD+ metabolome that were detected in pooled samples of 5 and 10 murine oocytes
| Analyte | Concentration determined using one oocyte (fmol/oocyte) |
Concentration determined using a pool of five oocytes (fmol/oocyte) |
Concentration determined using a pool of ten oocytes (fmol/oocyte) |
|---|---|---|---|
| NAM | ND | 6900.00 ± 60.2 | 6700.80 ± 70.72 |
| MeNAM | ND | 200.07 ± 16.3 | 153.01 ± 10.22 |
| NA | ND | ND | ND |
| NMN | ND | 370.82 ± 61.2 | 270.01 ± 91.7 |
| NAD+ | ND | 56.26 ± 4.82 | 62.07 ± 7.3 |
| NAAD | ND | 375.18 ± 29.6 | 289.65 ± 29.81 |
| NADH | ND | 42.92 ± 3.69 | 38.99 ± 4.65 |
| cADPR | ND | 4.9 ± 0.61 | 3.9 ± 0.93 |
| ADPR | ND | 18.79 ± 3.63 | 15.65 ± 3.75 |
| NaMN | ND | 3.71 ± 2.10 | 4.62 ± 1.92 |
| NADP+ | ND | 1.26 ± 0.67 | 0.85 ± 0.12 |
| NADPH | ND | 0.81 ± 0.35 | 0.47 ± 0.27 |
Two technical replicates were performed per sample
3.9. Effect of AICAR on NAD+ levels in murine oocytes
We also quantified intracellular levels of NAD+, NAM, and NMN in murine oocytes exposed to AICAR for 2 h (Fig. 4). Individual chromatograms are shown in Supplementary File 7. Our data shows a decline in the levels of NAM and NMN, although no significant changes in NAD+ levels were observed. It has been well established that AMP-activated protein kinase (AMPK) is a metabolic fuel gauge which monitors changes in the intracellular AMP/ATP ratio. Treatment with the AMPK agonist, AICAR, has been previously shown to attenuate mitochondrial dysfunction in cytochrome c oxidase-deficient mice (Viscomi et al. 2011). This effect has been attributed to the fact that AMPK activation enhances NAD+ synthesis, leading to improvements in mitochondrial homeostasis and sirtuin function (Canto and Auw-erx 2012). AICAR has also been recently shown to increase the expression of NAMPT in skeletal muscle, leading to increased intracellular NAD+ levels (Brandauer et al. 2013). However, the effect of AICAR on other enzymes involved in NAD+ synthesis has not been evaluated. It is likely that reduced levels of NAM and NMN reported in this study may be due to increased turnover of these metabolites directed towards NAD+ generation. However, we did not find any difference in NAD+ levels in AICAR treated oocytes compared to control non-treated cells, and the effect of AICAR on the NAD+ metabolome warrants further investigation.
Fig. 4.
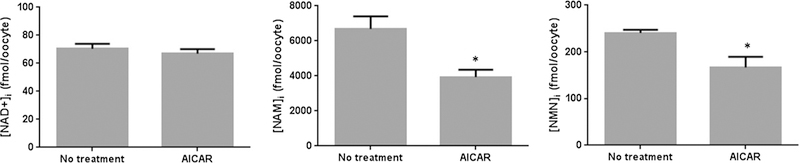
Effect of AICAR treatment on the NAD+ metabolome in primary murine oocytes. N = 3; *p < 0.05 compared to no treatment
3.10. Limitations of measuring NAD+ metabolites using this LC/MS/MS assay
A limitation of this chromatographic approach is that some nucleotides are too well retained showing tailing and asymmetric peak shapes. Clustering of some metabolites could not be avoided. However, we overcame potential interference between metabolites by selecting the diagnostic transitions that were most specific to each compound. Optimizing chromatography to cater for this diverse group of metabolites in the NAD+ metabolome compromises the sensitivity of the assay. Despite these issues, this method provides a reliable screening tool to assess in vitro intracellular bioenergetics.
4. Concluding remarks
Herein, an improved LC/MS/MS method has been developed and optimised to quantify the NAD+ metabolome and adenosine phosphates in mammalian cells. Its principle features are enhanced resolution and simultaneous quantification of 17 analytes on an amino phase column, avoiding the need for two separate (i.e., alkaline and acidic chromatographic gradients). Limiting factors for measuring these nucleotides which affected the reliability and accuracy of previous methods, such as ionisation suppression, and metabolite retention have been minimised. Despite these improvements, preservation and quantification of the NAD+ metabolome in other biological specimens require further evaluation and remains a challenge.
Supplementary Material
Acknowledgements
The authors would like to thank the Mark Wain- wright Analytical Centre in conjunction with the Bioanalytical Mass Spectrometry Facility for providing use of the TSQ Vantage bench-top mass spectrometer, analytical grade reagents and data processing software. NB is recipient of the ARC DECRA Fellowship.
Funding This study was funded by Mark Wainwright Analytical Centre Research Grant (No. 2016).
Footnotes
Compliance with ethical standards
Ethical approval All applicable international, national, and/or institutional guidelines for the care and use of animals were followed. This article does not contain any studies with human participants performed by any of the authors.
Electronic supplementary material The online version of this article (https://doi.org/10.1007/s11306–017-1310-z) contains supplementary material, which is available to authorized users.
Conflict of interest LW and DS are non-paid directors and shareholders of MetroBiotech NSW Pty Ltd, whose patents concern the use of NAD+ elevating agents to treat disease and are unrelated to nicotinamide (W02014059034 and Australian provisional patent application number 2013904415). DS is a shareholder and paid consultant to GlaxoSmithKline, a shareholder and scientific advisor to OvaScience, and a shareholder and director to MetroBiotech NSW Pty Ltd and MetroBiotech LLC. None of these interests relate to the present work. The authors confirm that they have no restrictions on the sharing of data or materials related to this work. This does not alter the authors’ adherence to Metabolomics policies on sharing data and materials.
References
- Adams S, et al. (2012). The kynurenine pathway in brain tumor pathogenesis. Cancer Research, 72(22), 5649–5657. [DOI] [PubMed] [Google Scholar]
- Adams S, et al. (2014). Involvement of the kynurenine pathway in human glioma pathophysiology. PLoS ONE, 9(11), e112945. [DOI] [PMC free article] [PubMed] [Google Scholar]
- Anderson RM, et al. (2003). Yeast life-span extension by calorie restriction is independent of NAD fluctuation. Science, 302(5653), 2124–2126. [DOI] [PMC free article] [PubMed] [Google Scholar]
- Bajad SU, et al. (2006). Separation and quantitation of water soluble cellular metabolites by hydrophilic interaction chromatogra-phy-tandem mass spectrometry. Journal of Chromatography A, 1125(1), 76–88. [DOI] [PubMed] [Google Scholar]
- Belenky P, Bogan KL, & Brenner C (2007). NAD+ metabolism in health and disease. Trends in Biochemical Sciences, 32(1), 12–19. [DOI] [PubMed] [Google Scholar]
- Bieganowski P, & Brenner C (2004). Discoveries of nicotinamide riboside as a nutrient and conserved NRK genes establish a Preiss- Handler independent route to NAD+ in fungi and humans. Cell, 117(4), 495–502. [DOI] [PubMed] [Google Scholar]
- Bogan KL, & Brenner C (2008). Nicotinic acid, nicotinamide, and nicotinamide riboside: a molecular evaluation of NAD+ precursor vitamins in human nutrition. Annual Review of Nutrition, 28, 115–130. [DOI] [PubMed] [Google Scholar]
- Braidy N, et al. (2011). Age related changes in NAD+ metabolism oxidative stress and Sirt1 activity in wistar rats. PLoS ONE, 6(4), e19194. [DOI] [PMC free article] [PubMed] [Google Scholar]
- Braidy N, et al. (2014). Mapping NAD(+) metabolism in the brain of ageing Wistar rats: potential targets for influencing brain senescence. Biogerontology, 15(2), 177–198. [DOI] [PubMed] [Google Scholar]
- Braidy N, & Grant R (2017). Kynurenine pathway metabolism and neuroinflammatory disease. Neural Regeneration Research, 12(1), 39–42. [DOI] [PMC free article] [PubMed] [Google Scholar]
- Brandauer J, et al. (2013). AMP-activated protein kinase regulates nicotinamide phosphoribosyl transferase expression in skeletal muscle. Journal of Physiology, 591(20), 5207–5220. [DOI] [PMC free article] [PubMed] [Google Scholar]
- Brovko L, Romanova NA, & Ugarova NN (1994). Bioluminescent assay of bacterial intracellular AMP, ADP, and ATP with the use of a coimmobilized three-enzyme reagent (adenylate kinase, pyruvate kinase, and firefly luciferase). Analytical Biochemistry, 220(2), 410–414. [DOI] [PubMed] [Google Scholar]
- Canto C, & Auwerx J (2012). Targeting sirtuin 1 to improve metabolism: All you need is NAD(+). Pharmacological Reviews, 64(1), 166–187. [DOI] [PMC free article] [PubMed] [Google Scholar]
- Coolen EJ, et al. (2008). Simultaneous determination of adenosine triphosphate and its metabolites in human whole blood by RP- HPLC and UV-detection. Journal of Chromatography B Analytical Technologies in the Biomedical and Life Sciences, 864(1–2), 43–51. [DOI] [PubMed] [Google Scholar]
- Cordell RL, et al. (2008). Quantitative profiling of nucleotides and related phosphate-containing metabolites in cultured mammalian cells by liquid chromatography tandem electrospray mass spectrometry. Journal of Chromatography B Analytical Technologies in the Biomedical and Life Sciences, 871(1), 115–124. [DOI] [PubMed] [Google Scholar]
- de Koning W, & van Dam K (1992). A method for the determination of changes of glycolytic metabolites in yeast on a subsecond time scale using extraction at neutral pH. Analytical Biochemistry, 204(1), 118–123. [DOI] [PubMed] [Google Scholar]
- Dietmair S, et al. (2010). Towards quantitative metabolomics of mammalian cells: development of a metabolite extraction protocol.Analytical Biochemistry, 404(2), 155–164. [DOI] [PubMed] [Google Scholar]
- Evans C, et al. (2010). NAD+ metabolite levels as a function of vitamins and calorie restriction: evidence for different mechanisms of longevity. BMC Chemical Biology, 10, 2. [DOI] [PMC free article] [PubMed] [Google Scholar]
- Evans J, et al. (2002). LC/MS analysis of NAD biosynthesis using stable isotope pyridine precursors. Analytical Biochemistry, 306(2), 197–203. [DOI] [PubMed] [Google Scholar]
- Faijes M, Mars AE, & Smid EJ (2007). Comparison of quenching and extraction methodologies for metabolome analysis of Lactobacillus plantarum. Microbial Cell Factories, 6, 27. [DOI] [PMC free article] [PubMed] [Google Scholar]
- Formentini L, Moroni F, & Chiarugi A (2009). Detection and pharmacological modulation of nicotinamide mononucleotide (NMN) in vitro and in vivo. Biochemical Pharmacology, 77(10), 1612–1620. [DOI] [PubMed] [Google Scholar]
- Fouquerel E, & Sobol RW (2014). ARTD1 (PARP1) activation and NAD(+) in DNA repair and cell death. DNA Repair, 23, 27–32. [DOI] [PMC free article] [PubMed] [Google Scholar]
- Gasser A, Bruhn S, & Guse AH (2006). Second messenger function of nicotinic acid adenine dinucleotide phosphate revealed by an improved enzymatic cycling assay. Journal of Biological Chemistry, 281(25), 16906–16913. [DOI] [PubMed] [Google Scholar]
- Giannattasio S, et al. (2003). Simultaneous determination of purine nucleotides, their metabolites and beta-nicotinamide adenine dinucleotide in cerebellar granule cells by ion-pair high performance liquid chromatography. Brain Research Brain Research Protocols, 10(3), 168–174. [DOI] [PubMed] [Google Scholar]
- Gibon Y, & Larher F (1997). Cycling assay for nicotinamide adenine dinucleotides: NaCl precipitation and ethanol solubilization of the reduced tetrazolium. Analytical Biochemistry, 251(2), 153–157. [DOI] [PubMed] [Google Scholar]
- Graeff R, & Lee HC (2002). A novel cycling assay for nicotinic acid-adenine dinucleotide phosphate with nanomolar sensitivity. Biochemical Journal, 367(Pt 1), 163–168. [DOI] [PMC free article] [PubMed] [Google Scholar]
- Graeff R, & Lee HC (2002). A novel cycling assay for cellular cADP-ribose with nanomolar sensitivity. Biochemical Journal, 361 (Pt 2), 379–384. [DOI] [PMC free article] [PubMed] [Google Scholar]
- Grob MK, et al. (2003). Optimization of cellular nucleotide extraction and sample preparation for nucleotide pool analyses using capillary electrophoresis. Journal of Chromatography B Analytical Technologies in the Biomedical and Life Sciences, 788(1), 103–111. [DOI] [PubMed] [Google Scholar]
- Guarente L (2014). Linking DNA damage, NAD(+)/SIRT1, and aging. Cell Metabolism, 20(5), 706–707. [DOI] [PubMed] [Google Scholar]
- Guo B, et al. (2014). Monitoring ATP hydrolysis and ATPase inhibitor screening using (1)H NMR. Chemical Communications, 50(81), 12037–12039. [DOI] [PMC free article] [PubMed] [Google Scholar]
- Haigis MC, & Sinclair DA (2010). Mammalian sirtuins: Biological insights and disease relevance. Annual Review of Pathological Mechanical Disease, 5, 253–295. [DOI] [PMC free article] [PubMed] [Google Scholar]
- Helenius M, Jalkanen S, & Yegutkin G (2012). Enzyme-coupled assays for simultaneous detection of nanomolar ATP, ADP, AMP, adenosine, inosine and pyrophosphate concentrations in extracellular fluids. Biochimica et Biophysica Acta (BBA)-Molecular Cell Research, 1823(10), 1967–1975. [DOI] [PubMed] [Google Scholar]
- Ikegami T, et al. (2008). Separation efficiencies in hydrophilic interaction chromatography. Journal of Chromatography A, 1184(1–2), 474–503. [DOI] [PubMed] [Google Scholar]
- Ipata PL, & Pesi R (2015). What is the true nitrogenase reaction? A guided approach. Biochemistry and Molecular Biology Education, 43(3), 142–144. [DOI] [PubMed] [Google Scholar]
- Katayama S, Ae N, & Nagata R (2001). Synthesis of tricyclic indole-2-carboxylic [correction of caboxylic] acids as potent NMDA-glycine antagonists. Journal of Organic Chemistry, 66(10), 3474–3483. [DOI] [PubMed] [Google Scholar]
- Kaulich M, Qurishi R, & Muller CE (2003). Extracellular metabolism of nucleotides in neuroblastoma x glioma NG108–15 cells determined by capillary electrophoresis. Cellular and Molecular Neurobiology, 23(3), 349–364. [DOI] [PubMed] [Google Scholar]
- Kawamura Y, et al. (2010). Sirt3 protects in vitro-fertilized mouse preimplantation embryos against oxidative stress-induced p53-medi-ated developmental arrest. The Journal of Clinical Investigation, 120(8), 2817–2828. [DOI] [PMC free article] [PubMed] [Google Scholar]
- Kim MY, et al. (2004). NAD+-dependent modulation of chromatin structure and transcription by nucleosome binding properties of PARP-1. Cell, 119(6), 803–814. [DOI] [PubMed] [Google Scholar]
- Klawitter J, et al. (2007). Development and validation of an assay for the quantification of 11 nucleotides using LC/LC-electrospray ionization-MS. Analytical Biochemistry, 365(2), 230–239. [DOI] [PubMed] [Google Scholar]
- Lee AR, et al. (2013). Nicotinamide: a class III HDACi delays in vitro aging of mouse oocytes. Journal of Reproduction and Development, 59(3), 238–244. [DOI] [PMC free article] [PubMed] [Google Scholar]
- Lin SJ, & Guarente L (2003). Nicotinamide adenine dinucleotide, a metabolic regulator of transcription, longevity and disease. Current Opinion in Cell Biology, 15(2), 241–246. [DOI] [PubMed] [Google Scholar]
- Long A, et al. (2017). CD38 knockout mice show significant protection against ischemic brain damage despite high level poly-ADP-ribosylation. Neurochemical Research, 42(1), 283–293. [DOI] [PMC free article] [PubMed] [Google Scholar]
- Lu W, Bennett BD, & Rabinowitz JD (2008). Analytical strategies for LC-MS-based targeted metabolomics. Journal of Chromatography B Analytical Technologies in the Biomedical and Life Sciences, 871(2), 236–242. [DOI] [PMC free article] [PubMed] [Google Scholar]
- Mansson MO, Larsson PO, & Mosbach K (1978). Covalent binding of an NAD analogue to liver alcohol dehydrogenase resulting in an enzyme-coenzyme complex not requiring exogenous coenzyme for activity. European Journal of Biochemistry, 86(2), 455–463. [DOI] [PubMed] [Google Scholar]
- Massudi H, et al. (2012). Age-associated changes in oxidative stress and NAD + metabolism in human tissue. PLoS ONE, 7(7), e42357. [DOI] [PMC free article] [PubMed] [Google Scholar]
- Mendelsohn AR, & Larrick J (2017). A NAD+/PARP1/SIRT1 axis in aging. Rejuvenation Research, 20(3), 244–247 [DOI] [PubMed] [Google Scholar]
- Moon PK, & Minhas PS (2017). Reevaluating the role of IDO1: Examining NAD + metabolism in inflammation. Journal of Neuroimmunology, 307, 31–32. [DOI] [PubMed] [Google Scholar]
- Musiek ES, et al. (2016). Nmnat1 protects neuronal function without altering phospho-tau pathology in a mouse model of tauopathy. Annals of Clinical and Translational Neurology, 3(6), 434–442. [DOI] [PMC free article] [PubMed] [Google Scholar]
- Nikiforov A, Kulikova V, & Ziegler M (2015). The human NAD metabolome: Functions, metabolism and compartmentalization. Critical Reviews in Biochemistry and Molecular Biology, 50(4), 284–297. [DOI] [PMC free article] [PubMed] [Google Scholar]
- Pabst M, et al. (2010). Nucleotide and nucleotide sugar analysis by liquid chromatography-electrospray ionization-mass spectrometry on surface-conditioned porous graphitic carbon. Analytical Chemistry, 82(23), 9782–9788. [DOI] [PMC free article] [PubMed] [Google Scholar]
- Palfi M, et al. (2004). Application of the measurement of oxidized pyridine dinucleotides with high-performance liquid chromatog-raphy-fluorescence detection to assay the uncoupled oxidation of NADPH by neuronal nitric oxide synthase. Analytical Biochemistry, 326(1), 69–77. [DOI] [PubMed] [Google Scholar]
- Piacente F, et al. (2017). Nicotinic acid phosphoribosyltransferase regulates cancer cell metabolism, susceptibility to NAMPT inhibitors and DNA repair. Cancer Research. 10.1158/0008-5472.CAN-16-3079. [DOI] [PubMed] [Google Scholar]
- Putt KS, & Hergenrother PJ (2004). An enzymatic assay for poly(ADP-ribose) polymerase-1 (PARP-1) via the chemical quantitation of NAD(+): Application to the high-throughput screening of small molecules as potential inhibitors. Analytical Biochemistry, 326(1), 78–86. [DOI] [PubMed] [Google Scholar]
- Qian T, Cai Z, & Yang MS (2004). Determination of adenosine nucleotides in cultured cells by ion-pairing liquid chromatogra-phy-electrospray ionization mass spectrometry. Analytical Biochemistry, 325(1), 77–84. [DOI] [PubMed] [Google Scholar]
- Reyes LA, et al. (2015). Depletion of NADP(H) due to CD38 activation triggers endothelial dysfunction in the postischemic heart. Proceedings of the National Academy of Sciences USA, 112(37), 11648–11653. [DOI] [PMC free article] [PubMed] [Google Scholar]
- Seifar RM, et al. (2009). Simultaneous quantification of free nucleotides in complex biological samples using ion pair reversed phase liquid chromatography isotope dilution tandem mass spectrometry. Analytical Biochemistry, 388(2), 213–219. [DOI] [PubMed] [Google Scholar]
- Trammell SA, et al. (2016). Nicotinamide riboside is uniquely and orally bioavailable in mice and humans. Nature Communications, 7, 12948. [DOI] [PMC free article] [PubMed] [Google Scholar]
- Trammell SA, & Brenner C (2013). Targeted, LCMS-based metabolomics for quantitative measurement of NAD(+) metabolites. Computational and Structural Biotechnology Journal, 4, e201301012. [DOI] [PMC free article] [PubMed] [Google Scholar]
- Viscomi C, et al. (2011). In vivo correction of COX deficiency by activation of the AMPK/PGC-1alpha axis. Cell Metabolism, 14(1), 80–90. [DOI] [PMC free article] [PubMed] [Google Scholar]
- Wang B, et al. (2017) Aldehyde dehydrogenase 1A1 increases NADH levels and promotes tumor growth via glutathione/dihy-drolipoic acid-dependent NAD + reduction. Oncotarget, 8(40), 67043–67055. [DOI] [PMC free article] [PubMed] [Google Scholar]
- Wang J, et al. (2009). Analysis of adenosine phosphates in HepG-2 cell by a HPLC-ESI-MS system with porous graphitic carbon as stationary phase. Journal of Chromatography B Analytical Technologies in the Biomedical and Life Sciences, 877(22), 2019–2024. [DOI] [PubMed] [Google Scholar]
- Weidele K, Beneke S, & Burkle A (2017). The NAD + precursor nicotinic acid improves genomic integrity in human peripheral blood mononuclear cells after X-irradiation. DNA Repair, 52, 12–23. [DOI] [PubMed] [Google Scholar]
- Wilding M, Marino M, & Dale D (1999). Nicotinamide alters the calcium release pattern and the degradation of MPF activity after fertilisation in ascidian oocytes. Zygote, 7(3), 255–260. [DOI] [PubMed] [Google Scholar]
- Williamson DH, Lund P, & Krebs HA (1967). The redox state of free nicotinamide-adenine dinucleotide in the cytoplasm and mitochondria of rat liver. Biochemical Journal, 103(2), 514–527. [DOI] [PMC free article] [PubMed] [Google Scholar]
- Winder CL, et al. (2008). Global metabolic profiling of Escherichia coli cultures: An evaluation of methods for quenching and extraction of intracellular metabolites. Analytical Chemistry, 80(8), 2939–2948. [DOI] [PubMed] [Google Scholar]
- Xing J, et al. (2004). Liquid chromatographic analysis of nucleosides and their mono-, di- and triphosphates using porous graphitic carbon stationary phase coupled with electrospray mass spectrometry. Rapid Communications in Mass Spectrometry, 18(14), 1599–1606. [DOI] [PubMed] [Google Scholar]
- Xu YF, Lu W, & Rabinowitz JD (2015). Avoiding misannota-tion of in-source fragmentation products as cellular metabolites in liquid chromatography-mass spectrometry-based metabolomics. Analytical Chemistry, 87(4), 2273–2281. [DOI] [PMC free article] [PubMed] [Google Scholar]
- Yamada K, et al. (2006). The simultaneous measurement of nicotinamide adenine dinucleotide and related compounds by liquid chromatography/electrospray ionization tandem mass spectrometry. Analytical Biochemistry, 352(2), 282–285. [DOI] [PubMed] [Google Scholar]
- Yan EB, et al. (2015). Activation of the kynurenine pathway and increased production of the excitotoxin quinolinic acid following traumatic brain injury in humans. Journal of Neuroinflammation, 12, 110. [DOI] [PMC free article] [PubMed] [Google Scholar]
- Zhang G, et al. (2014). Strategies for quantitation of endogenous adenine nucleotides in human plasma using novel ion-pair hydrophilic interaction chromatography coupled with tandem mass spectrometry. Journal of Chromatography A, 1325, 129–136. [DOI] [PubMed] [Google Scholar]
- Zocchi E, et al. (1993). A single protein immunologically identified as CD38 displays NAD+ glycohydrolase, ADP-ribosyl cyclase and cyclic ADP-ribose hydrolase activities at the outer surface of human erythrocytes. Biochemical and Biophysical Research Communications, 196(3), 1459–1465. [DOI] [PubMed] [Google Scholar]
Associated Data
This section collects any data citations, data availability statements, or supplementary materials included in this article.