This article compares the cost effectiveness of three treatment strategies for newly diagnosed patients with advanced non‐small cell lung cancer (NSCLC) with confirmed EGFR‐mutation. An economic evaluation was conducted in the U.S. and China, because NSCLC is highly prevalent and imposes a significant burden to patients and health care systems in both countries.
Keywords: Osimertinib, Non‐small cell lung cancer, EGFR mutation, Cost‐effectiveness, First‐generation EGFR‐TKI
Abstract
Background.
The objective of this study was to assess cost and effectiveness of osimertinib in treating newly diagnosed advanced non‐small cell lung cancer with an epidermal growth factor receptor (EGFR) mutation from a public payer's perspective in the U.S. and China.
Materials and Methods.
Markov models were developed to compare three treatment strategies: first‐line use of osimertinib, first‐line use of the standard first‐generation EGFR‐tyrosine kinase inhibitor (EGFR‐TKI) followed by the second‐line use of osimertinib, and the standard first‐generation EGFR‐TKI therapy (standard care [SOC]). Clinical data, cost, and utility data were mainly derived from published literatures. Deterministic and probabilistic sensitivity analyses were conducted to assess the robustness of the incremental cost per quality‐adjusted life year (QALY) between the treatments.
Results.
The resultant incremental cost per QALY gained for the first‐line osimertinib versus SOC was $312,903 in the U.S. and $41,512 in China. The incremental cost per QALY for the second‐line osimertinib versus SOC was $284,532 in the U.S. and $38,860 in China. The probability of the SOC strategy being cost‐effective is 1.0 if the willingness to pay threshold is below $150,000/QALY in the U.S. and below $30,000/QALY in China.
Conclusion.
Osimertinib as first‐line treatment could gain more health benefits in comparison with standard EGFR‐TKIs or second‐line use of osimertinib. However, because of the high cost of treatment, the cost‐effectiveness analyses were not in favor of the first‐line use of osimertinib from a public payer's perspective in the U.S. and China.
Implications for Practice.
Osimertinib as first‐line treatment yielded the greatest health outcomes but is not a cost‐effective strategy for lung cancer in the U.S. and China. The price of osimertinib has a substantial impact on economic outcomes.
Introduction
The Global Burden of Disease Study revealed that lung cancer is one of the leading causes of noncommunicable disease burden worldwide [1]. The mortality of lung cancer was ranked first among all cancers in both the U.S. and China [2]. Approximately 85%–90% of lung cancers are non‐small cell lung cancer (NSCLC). Of those, 10%–20% of white patients and about 48% of Asian patients carry epidermal growth factor receptor (EGFR) mutations that play a key role in carcinogenesis [3].
Osimertinib is a third‐generation EGFR‐tyrosine kinase inhibitor (TKI) that selectively inhibits both EGFR‐TKI‐sensitizing and EGFR T790 M resistance mutations, which has shown significant superiority over chemotherapy in prolonging progression‐free survival (PFS) in patients with T790 M‐positive advanced NSCLC who had disease progression after first‐ and second‐generation EGFR‐TKI therapy, including gefitinib, erlotinib, and afatinib [4]. The recent pivotal phase III FLAURA trial showed that in patients with previously untreated, EGFR mutation‐positive (exon 19 deletion or L858R) advanced NSCLC, first‐line osimertinib treatment significantly prolonged PFS compared with a standard gefitinib or erlotinib EGFR‐TKI treatment (18.9 months vs. 10.2 months; hazard ratio [HR], 0.46; 95% confidence interval [CI], 0.37–0.57; p < .001). The median overall survival (OS) has not yet been observed, but there is a potential superiority in OS (83% vs. 71% at 18 months; HR, 0.63; 95% CI, 0.45–0.88; p = .007) [5].
Given the new efficacy evidence for osimertinib, there are three possible treatment strategies available for this patient population: standard chemotherapy using first‐generation EGFR‐TKI (gefitinib or erlotinib) and first‐ or second‐line use of osimertinib. Comparative cost‐effectiveness evidence between these treatments is required to inform coverage decision making. Therefore, our objective was to compare cost‐effectiveness of these three treatment strategies for patients newly diagnosed with advanced NSCLC with confirmed EGFR mutation. We conducted this economic evaluation in the U.S. and China because NSCLC is highly prevalent and imposes a significant burden to patients and health care systems in both countries. We were interested in comparing their cost‐effectiveness in the world's two largest economies, representing developed and resource‐constrained settings, respectively.
Materials and Methods
Overview
We constructed Markov models to compare cost and quality‐adjusted life years (QALYs) of three treatment strategies: (a) first‐line osimertinib followed by pemetrexed plus cisplatin (PC) chemotherapy when first‐line osimertinib failed (referred to as the first‐line osimertinib strategy), (b) first‐line gefitinib or erlotinib followed by osimertinib for those with a positive T790 M mutation test or PC chemotherapy for those with a negative mutation test or when first‐line osimertinib failed (referred to as the second‐line osimertinib strategy), and (c) gefitinib or erlotinib followed by PC chemotherapy when first‐line gefitinib or erlotinib failed (referred to as the standard care [SOC] strategy). Our target population was patients with newly diagnosed, advanced NSCLC with confirmed EGFR mutation. We conducted this economic evaluation from a public payer's perspective in both countries. Chinese yuan were converted into U.S. dollars by using the following exchange rate: U.S. $1 = 6.8 Chinese yuan.
Model Structure
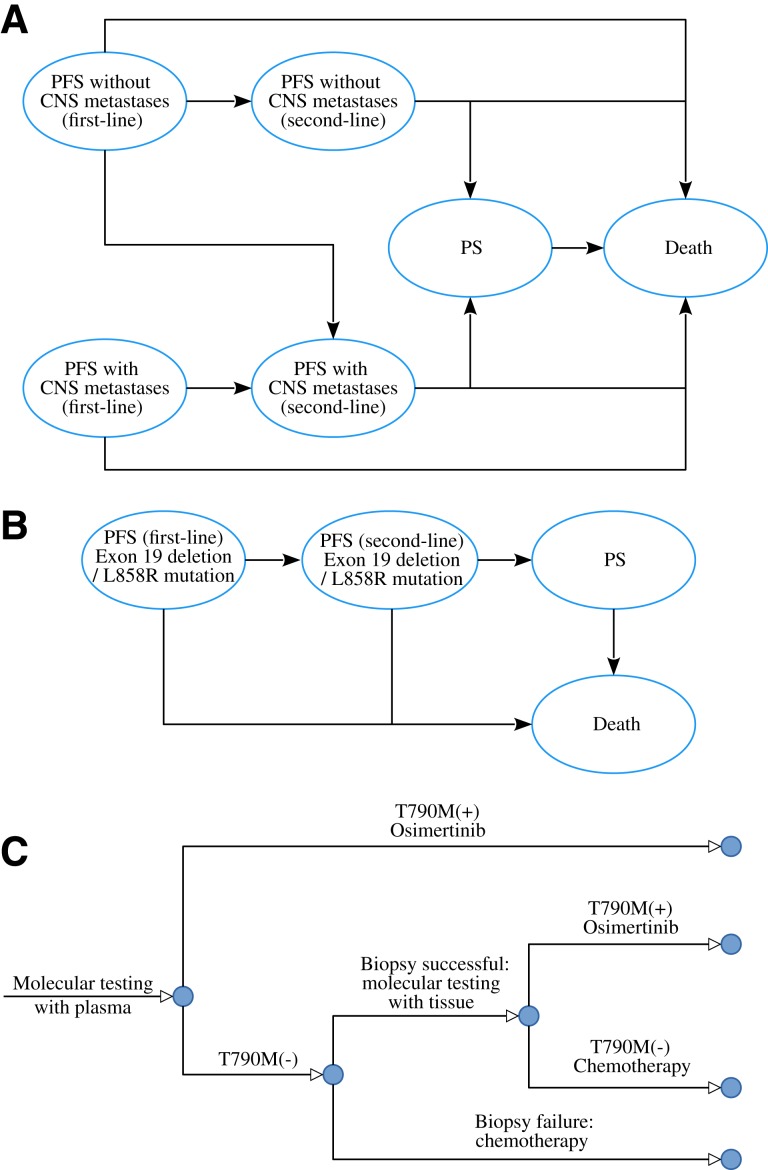
As shown in Figure 1, two Markov models were developed to estimate the costs and QALYs associated with each of the three treatment strategies. The first model consists of six health states according to central nervous system (CNS) metastases: first‐line PFS without CNS metastases, first‐line PFS with CNS metastases, second‐line PFS without CNS metastases, second‐line PFS with CNS metastases, progressed survival (PS) and death (Fig. 1A). The second model consists of four health states based on EGFR exon 19 deletion or L858R mutation type: first‐line PFS, second‐line PFS, PD, and death (Fig. 1B). In both models, the cycle length was set to 21 days to be consistent with the treatment schedule. In the second‐line osimertinib strategy, osimertinib was provided for those with T790 M positive following the mutation testing, and those who tested negative or with biopsy failure received PC chemotherapy (Fig. 1C). About 24% and 76% of the patients would receive salvage chemotherapy and supportive care after the failure of second‐line treatments based on a systematic literature review, respectively [6]. The OS rate of supportive care and salvage chemotherapy in the third‐line setting was derived from a systematic review [7], which was fitted using the Weibull model.
Figure 1.
Diagrams of the model structure. Markov model for newly diagnosed advanced non‐small cell lung cancer considering CNS metastases (A) and EGFR mutations (B), and the treatment strategy flowchart following the T790 M mutation test (C).Abbreviations: CNS, central nervous system; PFS, progression‐free survival; PS, progressed survival.
Time Horizon
The median OS time for patients with advanced NSCLC receiving EGFR‐TKIs was <30 months [3], and 5‐year survival rate was <15% [8]. Therefore, we used a 10‐year time horizon in the base‐case analysis and varied the time horizon from 1 to 20 years in the sensitivity analyses.
Clinical Inputs
The AURA3 and FLAURA trials were the two main sources of survival data for the models [4], [5]. Because median OS has not yet been observed, only PFS data from the AURA3 and FLAURA trials were used. As our previous study showed, the OS data after the second‐line treatment were derived from the other study [9]. By following the standard process [10], [11], we digitized the Kaplan‐Meier survival curves reported in both trials and then fit Weibull and log‐logistic survival models to the replicated individual patient data. The predicted survival curves were compared with the observed. The final survival models chosen were based on the goodness of fit measured using the r2 statistic [12]. For the validation purpose, we compared predicted PFS curves with the observed PFS curves from the trials (supplemental online Fig. 1).
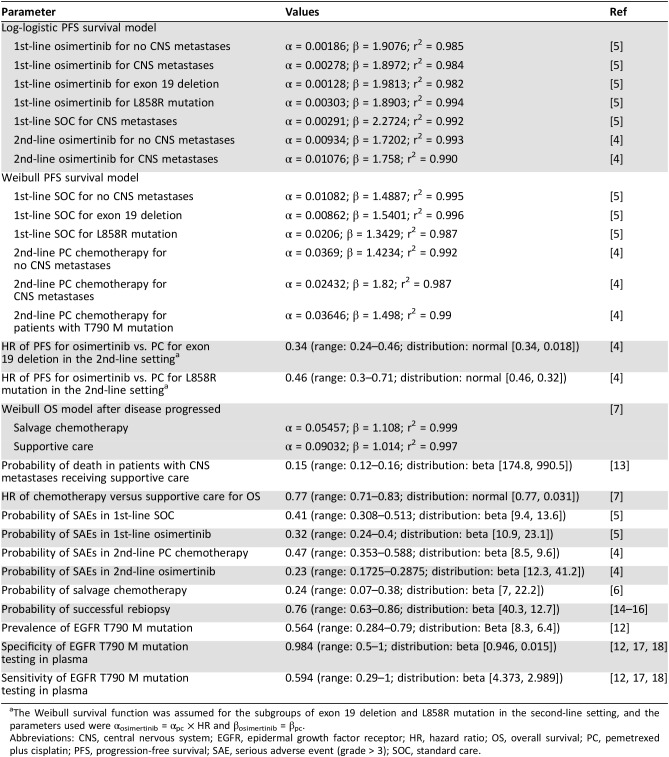
After the failure of first‐line treatments, nearly 26.8% of the patients without CNS metastases at entry developed CNS metastases based on the AURA3 and FLAURA trials [4], [5]. The frequency of EGFR T790 M mutation, specificities and sensitivities of testing techniques, and successful rebiopsy rate were derived from published studies and are listed in Table 1 [13], [14], [15], [16], [17], [18]. The probabilities of adverse events for each treatment were obtained from FLAURA and AURA3 trials [4], [5]. We included only severe adverse events (grade ≥ 3) in the economic evaluation because of their considerable impact on quality of life and health resource utilization.
Table 1. Clinical inputs to the models.
The Weibull survival function was assumed for the subgroups of exon 19 deletion and L858R mutation in the second‐line setting, and the parameters used were αosimertinib = αpc × HR and βosimertinib = βpc.
Abbreviations: CNS, central nervous system; EGFR, epidermal growth factor receptor; HR, hazard ratio; OS, overall survival; PC, pemetrexed plus cisplatin; PFS, progression‐free survival; SAE, serious adverse event (grade > 3); SOC, standard care.
Health Care Resource Uses and Costs in the U.S.
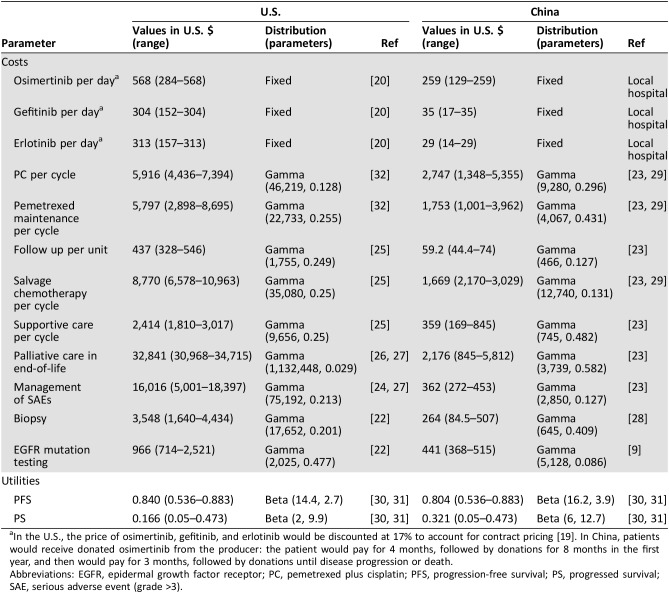
Osimertinib, gefitinib, and erlotinib are orally administered at a dose of 80 mg, 250 mg, and 150 mg, respectively, once daily until disease progression (Table 2). These drug costs in the U.S. were derived from RED BOOK Online 2017 (Truven Health Analytics, New York, NY). The cost of PC chemotherapy and maintenance therapy with pemetrexed per cycle was derived from a previous economic evaluation reported by Handorf et al. [32]. The duration of PC chemotherapy was assumed to be four cycles in the base‐case analysis, and the pemetrexed maintenance therapy was used until disease progression as reported by the AURA3 trial [4]. The overall incidence of grade 3 or higher serious adverse events (SAEs) was 22% and 25% in the osimertinib and SOC group, respectively. The occurrence of these SAEs was rare and very similar between the two groups according to the trial, so we chose to simplify the model by multiplying the mean costs of managing SAEs by their overall occurrence [19], [24]. It was assumed that all costs related to SAEs were incurred in the first cycle. We tested the cost and probability of SAEs in deterministic sensitivity analyses. For patients with PD and receiving salvage chemotherapy and supportive care, the estimated cost was derived from a published study [25]. An end‐of‐life care cost of $32,841 was applied to each death [26], [27]. The costs of T790 M mutation screening ($966) and tissue biopsy ($3,548) were included in the second‐line osimertinib strategy [22].
Table 2. Costs and health utilities.
In the U.S., the price of osimertinib, gefitinib, and erlotinib would be discounted at 17% to account for contract pricing [19]. In China, patients would receive donated osimertinib from the producer: the patient would pay for 4 months, followed by donations for 8 months in the first year, and then would pay for 3 months, followed by donations until disease progression or death.
Abbreviations: EGFR, epidermal growth factor receptor; PC, pemetrexed plus cisplatin; PFS, progression‐free survival; PS, progressed survival; SAE, serious adverse event (grade >3).
Health Care Resource Uses and Costs in China
The daily costs of osimertinib, gefitinib, and erlotinib were $259, $35, and $29, respectively, which were obtained from local hospitals in China (Table 2), and the cost of PC chemotherapy per cycle was $2,747, which was derived from a retrospective study involving 384 patients with advanced NSCLC in China [29]. Other costs associated with managing advanced NSCLC, including the cost of mutation testing and biopsy, were estimated at $44,127 and $26,428. The cost of supportive care was $359 per cycle, and the cost of end‐of‐life care was $2,176; both were adopted from our previously published economic evaluations [23]. All costs are presented in 2017 U.S. dollars.
Health Utilities
Health utility values for each health state were adopted from a recently published multinational study that measured health utilities in the U.K., Australia, China, France, Korea, and Taiwan among patients with advanced NSCLC by using a time trade‐off technique [30]. The health utility values measured in the U.K. patient population were used for the U.S. The impacts of the following SAEs were considered: diarrhea, fatigue, febrile neutropenia, hair loss, nausea/vomiting, neutropenia, and rash. The loss in QALYs attributed to SAEs was estimated by multiplying SAE incidences and corresponding disutility weights. Health utility values deriving from another study were used in the sensitivity analysis [31].
Statistical Analysis
In the base‐case analysis, both costs and QALYs were discounted 3% and 5% annually in the U.S. [33] and China [34], respectively. The summary outcome was the incremental cost‐effectiveness ratio (ICER), calculated as the incremental cost per additional QALY gained between the treatment strategies under comparison.
To explore the model uncertainty, probabilistic sensitivity analysis (PSA) was carried out by simultaneously and randomly sampling all model parameters according to prespecified distributions and generating 1,000 estimates of the cost and QALY for each treatment strategy. Based on the recommendation of ISPOR‐SMDM Modeling Good Research Practices Task Force in conducting PSA [35], a beta distribution was assigned to transition probability, proportion, and utility parameters, normal distribution was assigned to HR parameters, and a gamma distribution was assigned to costs. PSA results were presented using cost‐effectiveness acceptability curves that show the probability of a treatment being cost‐effective compared with alternative treatment strategies over a wide range of maximum willingness to pay amount per unit of QALY gained. One‐way deterministic sensitivity analysis was performed by adjusting all parameters within reported 95% CIs whenever available or by assuming ±25% of the base‐case values if 95% CI was not available. All analyses were conducted in R version 3.4 (R Foundation for Statistical Computing, Vienna, Austria).
Results
For the whole population over the 10‐year time horizon in the models, the predicted median PFS (combined PFS in the first and second‐line treatment) and OS were 24.8 months and 33 months for the first‐line osimertinib strategy, 21.3 months and 28.9 months for the second‐line osimertinib strategy, and 17.9 months and 26.2 months for SOC, respectively.
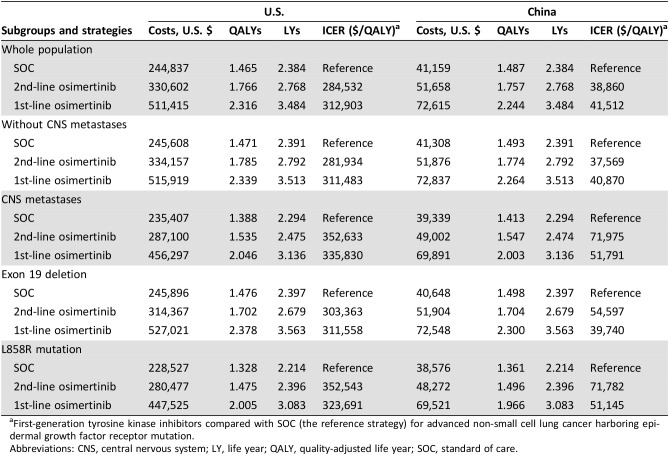
For the whole population in the U.S., the mean costs and QALYs associated with the first‐line osimertinib, second‐line osimertinib, and SOC strategies were $511,415 and 2.316, $330,602 and 1.766, and $244,837 and 1.465, respectively. The corresponding numbers in China were $72,615 and 2.244, $51,658 and 1.757, and $41,159 and 1.487 (Table 3). The resultant ICERs for first‐line osimertinib versus SOC were $312,903 in the U.S. and $41,512 in China. The ICERs for second‐line osimertinib versus SOC were $284,532 in the U.S. and $38,860 in China. The predicted mean costs and QALYs for each subgroup are listed in Table 3. Life years associated with each strategy are presented in the table for comparison.
Table 3. Cost‐effectiveness in the base‐case analyses.
First‐generation tyrosine kinase inhibitors compared with SOC (the reference strategy) for advanced non‐small cell lung cancer harboring epidermal growth factor receptor mutation.
Abbreviations: CNS, central nervous system; LY, life year; QALY, quality‐adjusted life year; SOC, standard of care.
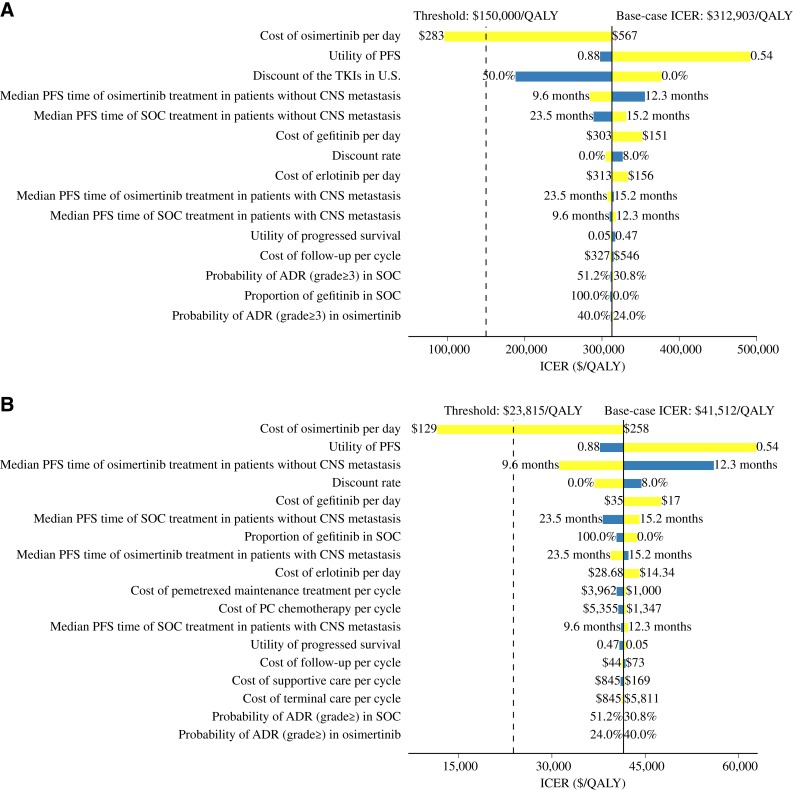
The one‐way sensitivity analyses for first‐line osimertinib versus SOC for the whole patient population are shown in Figure 2. The cost of osimertinib was the most sensitive parameter in both countries. The utility for progression‐free health state also had considerable impact on the ICER. The ICERs were also sensitive to the time horizon, especially during the first 5 years (supplemental online Fig. 2). Other parameters included in the sensitivity analyses had minimal impact on the ICER.
Figure 2.
Tornado diagram of one‐way sensitivity analyses comparing the first‐line osimertinib strategy over the standard care strategy in whole population with epidermal growth factor receptor mutation. Analyses in the U.S. (A) and China (B). The dashed lines are the willingness to pay thresholds based on three times the gross domestic product in each country.Abbreviations: ADR, adverse drug reaction; CNS, central nervous system; ICER, incremental cost‐effectiveness ratio; PFS, progression‐free survival; QALY, quality‐adjusted life year; SOC, standard care; TKI, tyrosine kinase inhibitor.
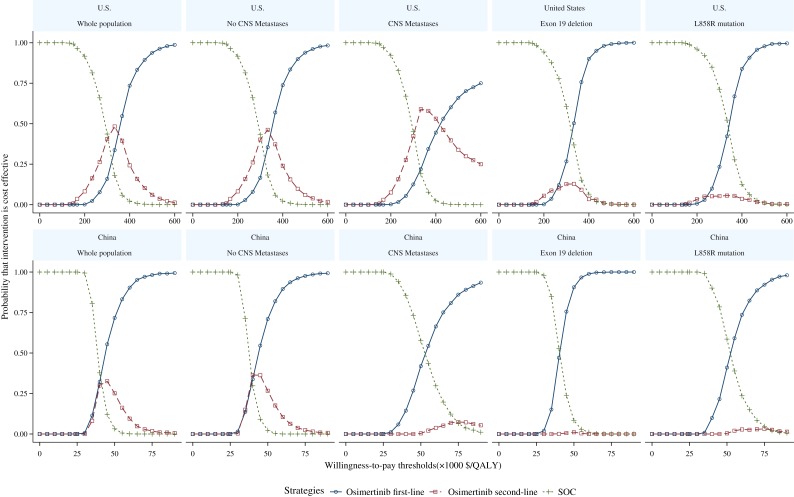
The cost‐effectiveness acceptability curves for the whole patient population and the four subgroups are shown in Figure 3. The probability of the SOC strategy being cost‐effective is 1.0 if the willingness to pay threshold is below $150,000/QALY in the U.S. and below $30,000/QALY in China.
Figure 3.
Cost‐effectiveness acceptability curves for the first‐line and second‐line osimertinib and the standard of care strategies in the U.S. and China.Abbreviations: CNS, central nervous system; QALY, quality‐adjusted life year; SOC, standard care.
Discussion
Our model‐based economic evaluation found that for patients with newly diagnosed, advanced NSCLC with EGFR mutation, the first‐line use of osimertinib extended both PFS and OS compared with the standard EGFR‐TKIs and the second‐line use of osimertinib. Similar benefits were consistently seen across all four prespecified subgroups. The largest gain in PFS and OS was seen in the subgroup of those with exon 19 deletion. However, the gain in QALYs was modest but at substantial incremental cost for the first‐line and second‐line osimertinib strategies compared with the standard EGFR‐TKIs. As a result, the incremental cost per QALY ratio is not in favor of osimertinib, due in large part to its high price. The findings are robust across the wide range of deterministic and probabilistic sensitivity analyses and similar between the U.S. and China.
Given that the clinical evidence on the first‐line use of osimertinib is relatively new, its cost‐effectiveness evidence is rather limited. There are only two published economic evaluations for osimertinib, both conducted in second‐line settings [36]. A model‐based cost utility analysis was conducted in the U.K. to compare the second‐line use of osimertinib with platinum‐based doublet chemotherapy in treating patients with advanced NSCLC with EGFR‐T790 M mutation over a 15‐year time horizon [36]. This study used phase II AURA trials as the main source for clinical inputs and found that the QALY gain was 1.541 at an incremental cost of £64,283, with the ICER of £41,705. In contrast, the other economic evaluation found that the ICER for the second‐line osimertinib compared with the standard of care was $232,895 per QALY in the U.S. and $48,081 in China. These two evaluations were not directly comparable to our study because of the different clinical trial data and the second line setting, but they highlight the importance of oncology economic evaluations considering multiple lines of treatments in order to provide full and accurate economic profiles of treatments.
Strengths of this study are worth highlighting. First, we synthesized, through economic modeling, the latest evidence and projected clinical benefits and cost‐effectiveness associated with the three treatment strategies over a 10‐year time horizon. Compared with commonly used meta‐analytic techniques, this approach can make a longer‐term projection based on best available evidence from clinical trials that often have shorter duration. Second, we considered two lines of treatments plus supportive care/salvage chemotherapy and across four subpopulations. Our study describes a full picture of the survival of this patient population that may be closer to real clinical practice than what has been seen in clinical trials. We conducted this cost‐effectiveness analysis in the U.S. and China, reflecting the impact of osimertinib in both high‐income and resource‐constrained contexts. The cost‐effectiveness conclusion is the same between the two countries but with very different ICERs. Health care costs are much lower in China than in the U.S., and the price of osimertinib in China is only half of that in the U.S. High health care costs lead to seven times higher ICER in the U.S. than in China. Osimertinib is an effective cancer therapy that delays cancer progression and extends survival in both first‐ and second‐line settings. However, the high price coupled with the relatively large number of patient population will make our health care systems unable to afford it. The price spiral in oncology drugs has become a major threat to the sustainability of health care systems worldwide.
Our study has a few limitations. We did not have access to individual patient data from the FLAURA or AURA trials. Digitalization of the reported survival curves was used to replicate the survival data. This approach provides a reasonable, although not perfect, approximation to the actual survival data observed in the trials. We chose from two commonly used survival functions, Weibull and log‐logistic, to fit the replicated survival data. Although there is a wide range of other functions available, these two models performed reasonably well when compared with the observed survival. We do not expect that other survival functions would have a significant impact on the results and conclusions. The current analysis did not include a second‐generation EGFR‐TKI, such as afatinib, as a potential comparator for advanced NSCLC harboring EGFR mutation because of the absence of head‐to‐head clinical data. When cancer progressed after two lines of treatments, standard supportive care and salvage chemotherapy were applied, which might not be a true reflection of clinical practice. Lastly, health utilities came from published studies instead of those who participated in the trials. Unfortunately, the study team does not have access to those trial data.
Conclusion
For patients with newly diagnosed, advanced NSCLC with confirmed EGFR mutation, osimertinib is an effective first‐line treatment that could delay disease progression and extend survival compared with standard EGFR‐TKIs or second‐line use of osimertinib. However, because of its high cost, the ICERs of osimertinib over SOC exceeded the willingness‐to‐pay threshold of $150,000/QALY in the U.S. and $30,000/QALY in China, which indicated that the first‐line use of osimertinib may not be considered cost‐effective from a public payer's perspective in the U.S. or China. How to afford effective but highly priced cancer drugs remains an ongoing challenge for the entire society.
See http://www.TheOncologist.com for supplemental material available online.
Acknowledgments
The funding agencies had no role in the study design, data collection and analysis, decision to publish, or manuscript preparation. This economic analysis was based on a literature review and modeling techniques; this study did not require approval from an institutional research ethics board. B.W. was supported by the Fourth Round of the Three‐year Action Plan on Public Health Discipline and Talent Program (Evidence‐Based Public Health and Health Economics, no. 15GWZK0901) from the Shanghai Health and Family Planning Commission. F.X. is supported by the Canadian Institutes of Health Research New Investigator Award 2012‐2017 (MSH122801).
Author Contributions
Conception/design: Bin Wu, Feng Xie.
Provision of study material or patients: Bin Wu, Qiang Zhang.
Collection and/or assembly of data: Bin Wu, Qiang Zhang.
Data analysis and interpretation: Bin Wu, Qiang Zhang.
Manuscript writing: Bin Wu, Feng Xie.
Final approval of manuscript: Bin Wu, Xiaohua Gu, Qiang Zhang, Feng Xie.
Disclosures
The authors indicated no financial relationships.
References
- 1.GBD 2016 DALYs and HALE Collaborators . Global, regional, and national disability‐adjusted life‐years (DALYs) for 333 diseases and injuries and healthy life expectancy (HALE) for 195 countries and territories, 1990‐2016: A systematic analysis for the Global Burden of Disease Study 2016. Lancet 2017;390:1260–1344. [DOI] [PMC free article] [PubMed] [Google Scholar]
- 2.Global Burden of Disease Cancer Collaboration ; Fitzmaurice C, Allen C, Barber RM et al. Global, regional, and national cancer incidence, mortality, years of life lost, years lived with disability, and disability‐adjusted life‐years for 32 cancer groups, 1990 to 2015: A systematic analysis for the Global Burden of Disease Study. JAMA Oncol 2017;3:524–548. [DOI] [PMC free article] [PubMed] [Google Scholar]
- 3.Reck M, Rabe KF. Precision diagnosis and treatment for advanced non‐small‐cell lung cancer. N Engl J Med 2017;377:849–861. [DOI] [PubMed] [Google Scholar]
- 4.Mok TS, Wu YL, Ahn MJ et al.; AURA3 Investigators. Osimertinib or platinum‐pemetrexed in EGFR T790M‐positive lung cancer. N Engl J Med 2017;376:629–640. [DOI] [PMC free article] [PubMed] [Google Scholar]
- 5.Soria JC, Ohe Y, Vansteenkiste J et al.; FLAURA Investigators. Osimertinib in untreated EGFR‐mutated advanced non‐small‐cell lung cancer. N Engl J Med 2018;378:113–125. [DOI] [PubMed] [Google Scholar]
- 6.Davies J, Patel M Gridelli C et al. Real‐world treatment patterns for patients receiving second‐line and third‐line treatment for advanced non‐small‐cell lung cancer: A systematic review of recently published studies. PLoS One 2017;12:e0175679. [DOI] [PMC free article] [PubMed] [Google Scholar]
- 7.NSCLC Meta‐Analyses Collaborative Group . Chemotherapy in addition to supportive care improves survival in advanced non‐small‐cell lung cancer: A systematic review and meta‐analysis of individual patient data from 16 randomized controlled trials. J Clin Oncol 2008;26:4617–4625. [DOI] [PMC free article] [PubMed] [Google Scholar]
- 8.Lin JJ, Cardarella S, Lydon CA et al. Five‐year survival in EGFR‐mutant metastatic lung adenocarcinoma treated with EGFR‐TKIs. J Thorac Oncol 2016;11:556–565. [DOI] [PMC free article] [PubMed] [Google Scholar]
- 9.Wu B, Gu X, Zhang Q. Cost‐effectiveness of osimertinib for EGFR‐mutation‐positive non‐small‐cell‐lung cancer after progression of first‐line EGFR TKI therapy. J Thorac Oncol 2018;13:184–193. [DOI] [PubMed] [Google Scholar]
- 10.Diaby V, Adunlin G, Montero AJ. Survival modeling for the estimation of transition probabilities in model‐based economic evaluations in the absence of individual patient data: A tutorial. Pharmacoeconomics 2014;32:101–108. [DOI] [PubMed] [Google Scholar]
- 11.Guyot P, Ades AE, Ouwens MJ et al. Enhanced secondary analysis of survival data: Reconstructing the data from published Kaplan‐Meier survival curves. BMC Med Res Methodol 2012;12:9. [DOI] [PMC free article] [PubMed] [Google Scholar]
- 12.Sparling YH, Younes N, Lachin JM et al. Parametric survival models for interval‐censored data with time‐dependent covariates. Biostatistics 2006;7:599–614. [DOI] [PubMed] [Google Scholar]
- 13.Arcila ME, Oxnard GR, Nafa K et al. Rebiopsy of lung cancer patients with acquired resistance to EGFR inhibitors and enhanced detection of the T790M mutation using a locked nucleic acid‐based assay. Clin Cancer Res 2011;17:1169–1180. [DOI] [PMC free article] [PubMed] [Google Scholar]
- 14.Thress KS, Brant R, Carr TH et al. EGFR mutation detection in ct DNA from NSCLC patient plasma: A cross‐platform comparison of leading technologies to support the clinical development of AZD 9291. Lung Cancer 2015;90:509–515. [DOI] [PubMed] [Google Scholar]
- 15.Nosaki K, Satouchi M, Kurata T et al. Re‐biopsy status among non‐small cell lung cancer patients in Japan: A retrospective study. Lung Cancer 2016;101:1–8. [DOI] [PubMed] [Google Scholar]
- 16.Kawamura T, Kenmotsu H, Taira T et al. Rebiopsy for patients with non‐small‐cell lung cancer after epidermal growth factor receptor‐tyrosine kinase inhibitor failure. Cancer Sci 2016;107:1001–1005. [DOI] [PMC free article] [PubMed] [Google Scholar]
- 17.Li X, Zhou C. Comparison of cross‐platform technologies for EGFR T790M testing in patients with non‐small cell lung cancer. Oncotarget 2017;8:100801–100818. [DOI] [PMC free article] [PubMed] [Google Scholar]
- 18.Dearden S, Brown H, Jenkins S et al. EGFR T790M mutation testing within the osimertinib AURA phase I study. Lung Cancer 2017;109:9–13. [DOI] [PubMed] [Google Scholar]
- 19.Hornberger J, Hirsch FR, Li Q et al. Outcome and economic implications of proteomic test‐guided second‐ or third‐line treatment for advanced non‐small cell lung cancer: Extended analysis of the PROSE trial. Lung Cancer 2015;88:223–230. [DOI] [PubMed] [Google Scholar]
- 20.RED BOOK Online. Available at http://www.micromedexsolutions.com/. Accessed October 24, 2017.
- 21.Kim HJ, Kim YJ, Seo MD et al. Patterns of palliative procedures and clinical outcomes in patients with advanced non‐small cell lung cancer. Lung Cancer 2009;65:242–246. [DOI] [PubMed] [Google Scholar]
- 22.Sands J, Li Q, Hornberger J. Urine circulating‐tumor DNA (ct DNA) detection of acquired EGFR T790M mutation in non‐small‐cell lung cancer: An outcomes and total cost‐of‐care analysis. Lung Cancer 2017;110:19–25. [DOI] [PubMed] [Google Scholar]
- 23.Lu S, Ye M, Ding L et al. Cost‐effectiveness of gefitinib, icotinib, and pemetrexed‐based chemotherapy as first‐line treatments for advanced non‐small cell lung cancer in China. Oncotarget 2017;8:9996–10006. [DOI] [PMC free article] [PubMed] [Google Scholar]
- 24.Ting J, Tien Ho P, Xiang P et al. Cost‐effectiveness and value of information of erlotinib, afatinib, and cisplatin‐pemetrexed for first‐line treatment of advanced EGFR mutation‐positive non‐small‐cell lung cancer in the United States. Value Health 2015;18:774–782. [DOI] [PubMed] [Google Scholar]
- 25.Klein R, Wielage R, Muehlenbein C et al. Cost‐effectiveness of pemetrexed as first‐line maintenance therapy for advanced nonsquamous non‐small cell lung cancer. J Thorac Oncol 2010;5:1263–1272. [DOI] [PubMed] [Google Scholar]
- 26.Huang M, Lou Y, Pellissier J et al. Cost effectiveness of pembrolizumab vs. standard‐of‐care chemotherapy as first‐line treatment for metastatic NSCLC that expresses high levels of PD‐L1 in the United States. Pharmacoeconomics 2017;35:831–944. [DOI] [PMC free article] [PubMed] [Google Scholar]
- 27.Kumar G, Woods B, Hess LM et al. Cost‐effectiveness of first‐line induction and maintenance treatment sequences in non‐squamous non‐small cell lung cancer (NSCLC) in the U.S. Lung Cancer 2015;89:294–300. [DOI] [PubMed] [Google Scholar]
- 28.Mi X. Comparison of different lung biopsy methods in diagnosis of suspected lung cancer [in Chinese]. J Clin Pulm Med 2012;17:1458–1459. [Google Scholar]
- 29.Li X, Wang Y, Wang Y et al. Supportive care costs associated with second‐line chemotherapy in Chinese patients with advanced non‐squamous non‐small cell lung cancer: A retrospective cohort study. Drugs Real World Outcomes 2015;2:87–97. [DOI] [PMC free article] [PubMed] [Google Scholar]
- 30.Nafees B, Lloyd AJ, Dewilde S et al. Health state utilities in non‐small cell lung cancer: An international study. Asia Pac J Clin Oncol 2017;13:e195–e203. [DOI] [PubMed] [Google Scholar]
- 31.Nafees B, Stafford M, Gavriel S et al. Health state utilities for non small cell lung cancer. Health Qual Life Outcomes 2008;6:84. [DOI] [PMC free article] [PubMed] [Google Scholar]
- 32.Handorf EA, McElligott S, Vachani A et al. Cost effectiveness of personalized therapy for first‐line treatment of stage IV and recurrent incurable adenocarcinoma of the lung. J Oncol Pract 2012;8:267–274. [DOI] [PMC free article] [PubMed] [Google Scholar]
- 33.Sanders GD, Neumann PJ, Basu A et al. Recommendations for conduct, methodological practices, and reporting of cost‐effectiveness analyses: Second Panel on Cost‐Effectiveness in Health and Medicine. JAMA 2016;316:1093–1103. [DOI] [PubMed] [Google Scholar]
- 34.Xiao J, Sun JF, Wang QQ et al. Health economic evaluation reporting guideline and application status [in Chinese]. Zhonghua Yu Fang Yi Xue Za Zhi 2017;51:276–280. [DOI] [PubMed] [Google Scholar]
- 35.Briggs AH, Weinstein MC, Fenwick EAL et al. Model parameter estimation and uncertainty analysis: A report of the ISPOR‐SMDM Modeling Good Research Practices Task Force Working Group‐6. Med Decis Making 2012;32:722–732. [DOI] [PubMed] [Google Scholar]
- 36.Bertranou E, Bodnar C, Dansk V et al. Cost‐effectiveness of osimertinib in the UK for advanced EGFR‐T790M non‐small cell lung cancer. J Med Econ 2018;21:113–121. [DOI] [PubMed] [Google Scholar]


