Abstract
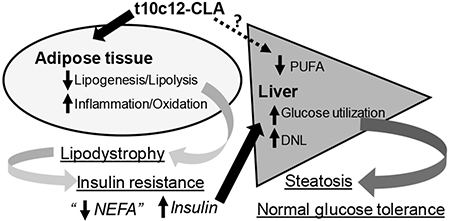
Mixtures of the two major conjugated linoleic acid (CLA) isomers trans-10,cis-12-CLA and cis-9,trans-11-CLA are used as over the counter supplements for weight loss. Because of the reported adverse effects of CLA on insulin sensitivity in some mouse studies, we sought to compare the impact of dietary t10c12-CLA and c9t11-CLA on liver, adipose tissue, and systemic metabolism of adult lean mice. We fed 8 week-old C57Bl/6J male mice with low fat diets (10.5% Kcal from fat) containing 0.8% t10c12-CLA or c9t11-CLA for 9 or 38 days. Diets containing c9t11-CLA had minimal impact on the endpoints studied. However, 7 days after starting the t10c12-CLA diet, we observed a dramatic reduction in fat mass measured by NMR spectroscopy, which interestingly rebounded by 38 days. This rebound was apparently due to a massive accumulation of lipids in the liver, because adipose tissue depots were visually undetectable. Hepatic steatosis and the disappearance of adipose tissue after t10c12-CLA feeding was associated with elevated plasma insulin levels and insulin resistance, compared to mice fed a control diet or c9t11-CLA diet. Unexpectedly, despite being insulin resistant, mice fed t10c12-CLA had normal levels of blood glucose, without signs of impaired glucose clearance. Hepatic gene expression and fatty acid composition suggested enhanced hepatic de novo lipogenesis without an increase in expression of gluconeogenic genes. These data indicate that dietary t10c12-CLA may alter hepatic glucose and lipid metabolism indirectly, in response to the loss of adipose tissue in mice fed a low fat diet.
Keywords: Fatty liver, Insulin resistance, Lipodystrophy, Polyunsaturated fatty acids, de novo lipogenesis
Graphical Abstract
1. Introduction
Conjugated linoleic acids (CLA) are present in the dairy products and ruminant meats [1, 2]. Two of the majors CLA are trans-10, cis-12 (t10c12)-CLA, which accounts for <5% of total CLA, and cis-9, trans-11 (c9t11)-CLA which accounts for up to 80% of total CLA [3]. Multiple physiological effects of CLA mixtures have been reported on atherosclerosis [4, 5], inflammation [6], cancer [7], and body composition [8]. As reviewed earlier by Wang and Jones [9], mixtures of dietary CLA significantly reduce fat deposition in mice by different mechanisms, and this effect may be species-dependent since rats are less sensitive to CLA actions [10]. However, in humans over the counter supplements that contain CLA mixtures reduce obesity modestly [11, 12].
Further studies performed in mice with enriched isomers of CLA have reported that c9t11-CLA has anti-carcinogenic effects [13] and insulin-sensitizing properties [14], whereas t10c12-CLA is the isomer responsible for weight loss, although it also promotes insulin resistance [15]. Specifically, t10c12-CLA induces inflammation and apoptosis of adipocytes [16–18], increases energy expenditure, inhibits lipogenesis in adipocytes, and decreases stromal cell differentiation [6, 19]. The anti-obesity effects of “pure” t10c12-CLA may promote fatty liver as a consequence of enhanced transport of fatty acids to the liver, reduced adipose-tissue mediated glucose disposal and hyperinsulinemia [10, 20]. Hepatic steatosis is commonly associated with selective-pathway hepatic insulin resistance, where the liver is able to sustain lipogenesis but unable to suppress hepatic glucose production despite high insulin levels [21]. However, multiple studies reported that t10c12-CLA fed mice do not have increased blood glucose levels [16, 20, 22] and it has been proposed that their livers remain sensitive to the actions of insulin because t10c12-CLA fed mice show reduced hepatic Pck1 expression [20]. To date, it remains to be resolved whether t10c12-CLA and c9t11-CLA have direct effects on the liver in vivo and if so, how they affect hepatic lipid and glucose homeostasis. In this study, we sought to determine the time and tissue (liver and adipose tissue)-dependent effects induced by dietary t10c12-CLA and c9t11-CLA in chow-fed lean male mice compared to mice fed control diet without CLA. To this end, we have used lean mice to study the obesity-independent effects of CLA isomers on glucose and lipid metabolism in adipose tissue and liver. Overall, our results show that while c9t11-CLA did not have major effects in mice fed a low fat diet, t10c12-CLA had profound effects on the adipose tissue, in which it may reduce lipogenesis and lipolysis and increase inflammation and lipid oxidation. The effects of t10c12-CLA on the liver, which included promotion of de novo lipogenesis (DNL) and reduction of gluconeogenesis, appear to be secondary to the effects on adipose tissue, rather than direct effects on the liver.
2. Material and Methods
2.1. Mice
The mouse studies reported in this manuscript were approved by the Institutional Animal Care and Use Committee of the Jesse Brown VA Medical Center. Eight week old C57Bl/6J male mice were purchased from The Jackson laboratory (Bar Harbor, ME) and housed in a temperature controlled (22-24C) and humidity controlled, specific pathogen-free barrier facility with a 12/12h light/dark cycle. The CLA isomers were prepared by alkaline treatment of pure linoleic acid, followed by selective esterification with lauryl alcohol using Candida rugose lipase, short-pass distillation and urea adduct formation, as described by Nagao et al [23]. The isomeric purity of both CLA isomers was >95%. Mice were fed a regular chow diet (Teklad LM-485, Envigo, Madison, WI) for one week. Then, they were randomly assigned to a control diet or a diet supplemented with 0.8% t10c12 CLA or 0.8% c9t11 CLA. The CLA isomers (0.8% w/w) were mixed with 3% (w/w) Canola oil and blended with TD.10673 diet (Envigo) (Table1). The control diet contained linoleic acid [18:2 (n-6)] at the same concentration as diets containing CLA. These diets provide a daily dose of 914 mg CLA/kg which represents a human equivalent dose [24] of 74.33 mg CLA/kg, similar to the dose of CLA recommended for humans [25], and within the range used in other CLA studies using lean mice [6, 17, 20, 22, 26–31]
Table 1. Composition of the diets used in this study and food intake.
Diets are nutrient matched and isocaloric (3.6 Kcal/g). Different letters indicate significant differences in food intake between groups. p<0.05. N= 12 mice/group.
| g/kg | Control | t10c12-CLA | c9t11-CLA |
|---|---|---|---|
| Casein | 200 | 200 | 200 |
| L-Cystine | 3 | 3 | 3 |
| Corn Starch | 427.392 | 427.392 | 427.392 |
| Maltodextrin | 132 | 132 | 132 |
| Sucrose | 100 | 100 | 100 |
| Cellulose | 50 | 50 | 50 |
| Canola Oil | 30 | 30 | 30 |
| Linoleic acid | 8 | 0 | 0 |
| t10c12-CLA | 0 | 8 | 0 |
| c9t11-CLA | 0 | 0 | 8 |
| Mineral Mix, AIN-93G-MX (94046) | 35 | 35 | 35 |
| Vitamin Mix, AIN-93-VX (94047) | 10 | 10 | 10 |
| Choline Bitartrate | 2.5 | 2.5 | 2.5 |
| TBHQ, antioxidant | 0.008 | 0.008 | 0.008 |
| % Kcal from fat | Control | t10c12-CLA | c9t11-CLA |
| Protein | 19.7 | 19.7 | 19.7 |
| Carbohydrate | 69.8 | 69.8 | 69.8 |
| Fat | 10.5 | 10.5 | 10.5 |
| Food intake | Control | t10c12-CLA | c9t11-CLA |
| g/4h (mean ± SEM) | 1.32a ± 0.14 | 1.37a ± 0.13 | 1.83b ± 0.11 |
Body composition in mice fed control, t10c12-CLA and c9t11-CLA diets was monitored with nuclear magnetic resonance spectrometry (NMR, Minispec LF50, Bruker). Specifically, we removed food from cages at 0800h and body composition was assessed four hours later, simultaneously with the determination of blood glucose at 1200h with a glucometer (Precision Xtra, Abbott, Columbus, OH).
We assessed glucose homeostasis with a glucose tolerance test (GTT, 2g glucose/kg body weight, ip) in overnight fasted mice 18 days after initiation of special diets, and with an insulin tolerance test (ITT, 1.5U insulin/kg body weight, ip) 22 days after initiation of special diets after 4h food removal starting at 0800h. Blood glucose levels were measured with a glucometer before injection and 15, 30, 60 and 120 minutes after injections.
Two subsets of mice were killed by decapitation without anesthesia at nine and thirty eight days of diet. Food was removed from the cages at 0800h and mice were killed at 1200h. A subset of mice was fasted overnight after thirty eight days of diet and killed at 0900h in the following morning. Tissues were weighed, snap-frozen in liquid nitrogen, and stored at −80 °C for further analysis. Trunk blood was collected in EDTA-coated tubes, and the plasma was separated by centrifugation, and stored at −20 °C for further analysis.
Plasma non-esterified fatty acids (NEFA) and TG were determined with colorimetric assays (Wako Diagnostics). Plasma insulin was measured by ELISA (Mercodia).
2.2. Gene expression analysis
Liver, inguinal adipose tissue (iWAT), gonadal adipose tissue (gWAT) and brown adipose tissue were homogenized with TRIzol Reagent (Life Technologies) according to manufacturer’s instructions to isolate total RNA. RNA was treated with RQ1 RNase-free DNase (Promega), and DNA-free RNA was transcribed and qPCR performed as previously described [32], qPCR primer sequences for various genes analyzed are provided in Supplemental Table 1.
2.3. Hepatic lipid analysis
Neutral hepatic lipids were extracted with isopropanol, and total hepatic lipids were extracted following the Bligh and Dyer’s method as previously described [33]. Fatty acid methyl esters were prepared with BF3-methanol reagent as described previously [33], and the methyl esters were dissolved in hexane, and quantified by gas chromatography/mass spectrometry (GC/MS) as previously described [33], using 17:1 as the internal standard to quantify the amount of each fatty acid in the sample. In addition, we used a commercial sample of polyunsaturated fatty acid mixture (PUFA-2, Supelco) to identify the different fatty acids in the samples.
2.4. Statistics
Values are represented as means ± standard errors of the mean (SEM). Two-way ANOVA (Fig 1, 2, 5A-C) followed by a Tukey post-test was used. For comparison within time or tissue group, one-way ANOVA (Fig 3,4, 5D,E, 6–8) following by a Tukey posthoc analysis was used. Statistical analysis was performed using GraphPad Prism 7. p-values less than 0.05 were considered significant.
Figure 1. Dietary t10c12 CLA induces a transitory reduction of body weight and fat mass without alterations in lean mass.
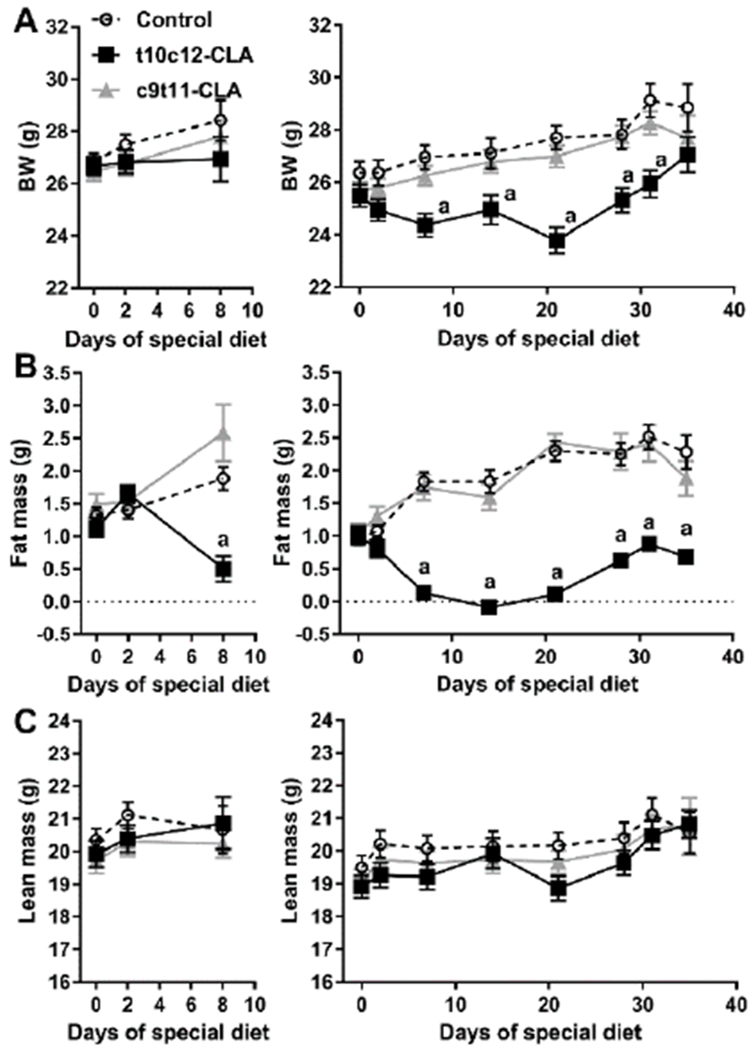
A) Body weight, B) NMR-based fat mass, and C) NMR-based lean mass of mice fed a control diet (open circle, discontinuous line), a t10c12-CLA diet (black squares, black line), or a c9t11-CLA diet (grey triangles, grey line). Data are represented as means +/− SEM, and analyzed by two-way ANOVA followed by a Tukey posthoc analysis. a, indicates significant differences between mice fed a t10c12-CLA diet with mice fed a control or a c9t11-CLA diet within time points. a, p<0.05. N= 6-12mice/group.
Figure 2. Dietary t10c12-CLA promotes lipodystrophy and fatty liver.
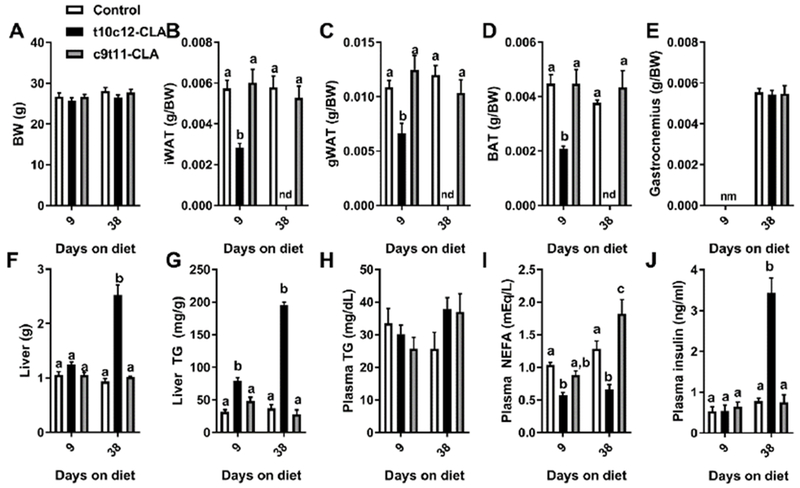
A) Body weight, and relative B) inguinal white adipose tissue (iWAT), C) gonadal WAT (gWAT), D) brown adipose tissue (BAT), and E) gastrocnemius. F) Liver weight. G) Liver TG, and plasma H) TG, I) NEFA, and J) insulin. Open columns (control diet), black columns (t10c12-CLA diet), grey columns (c9t11-CLA diet). Data are represented as means +/− SEM, and analyzed by two-way ANOVA followed by a Tukey posthoc analysis. Different letters indicate significant differences between groups within time point. p<0.05. N= 5-6mice/group.
Figure 5. Mice fed a diet containing t10c12-CLA show normal glucose levels and clearance of circulating glucose, but develop insulin resistance.
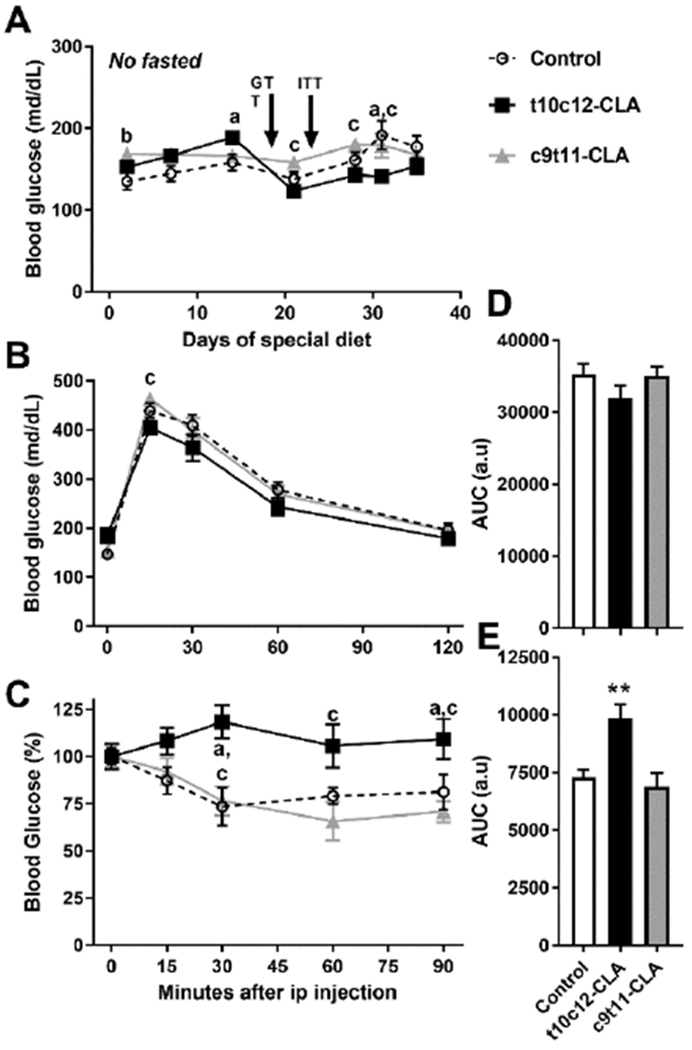
A) Blood glucose was assessed in mice at 1200h, food was withdrawn at 0800h. B) Glucose tolerance test, 2g/kg ip was performed in overnight fasted mice at 0900h. C) Insulin tolerance test, 1.5U/kg ip was peformed in mice at 1200h, food was withdrawn at 0800h. Open circle, discontinuous line (control diet), black squares, black line (t10c12-CLA diet), grey triangles, grey line (c9t11-CLA diet). Data are represented as means +/− SEM, and analyzed by two-way ANOVA (A-C) or one-way ANOVA (D-E) followed by a Tukey posthoc analysis. Letters indicate significant differences between groups within a time point: a, control vs t10c12-CLA; b, control vs c9t11-CLA; c, t10c12-CLA vs c9t11-CLA. p<0.05. Asterisks indicate differences between control and t10c12-CLA, **, p<0.01. N= 6-12mice/group.
Figure 3. Dietary t10c12-CLA for 9 days reduces the expression of lipogenic genes and increases the expression of fatty oxidation and inflammatory genes in a tissue-specific manner.
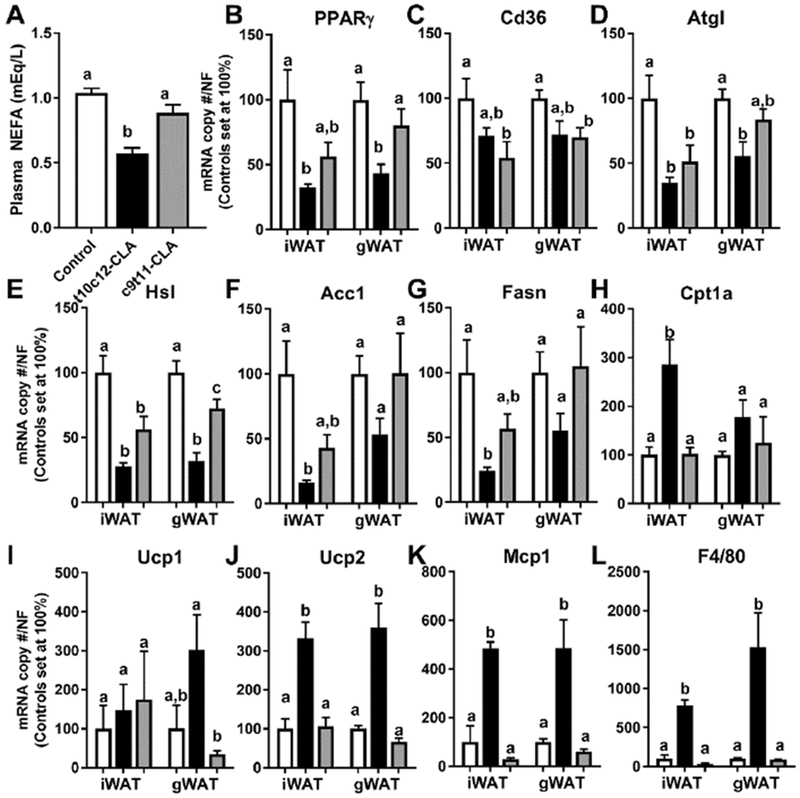
A) Plasma NEFA, and expression of B) PPARγ, C) Cd36, D) Atgl, E) Hsl, F) Acc1, G) Fasn, H) Cptla, I) Ucpl, J) Ucp2, K) Mcp1, and L) F4/80 in inguinal WAT (iWAT) and gonadal (gWAT). Open columns (control diet), black columns (t10c12-CLA diet), grey columns (c9t11-CLA diet). Data are represented as means +/− SEM of relative values of controls (set at 100%, B-L), and analyzed by one-way ANOVA followed by a Tukey posthoc analysis. Different letters indicate significant differences between groups within fat sub depot. p<0.05. N= 4-6 mice/group.
Figure 4. Dietary t10c12-CLA for 9 days reduces the expression of lipogenic genes and increases the expression of fatty oxidation and inflammatory genes in brown adipose tissue.
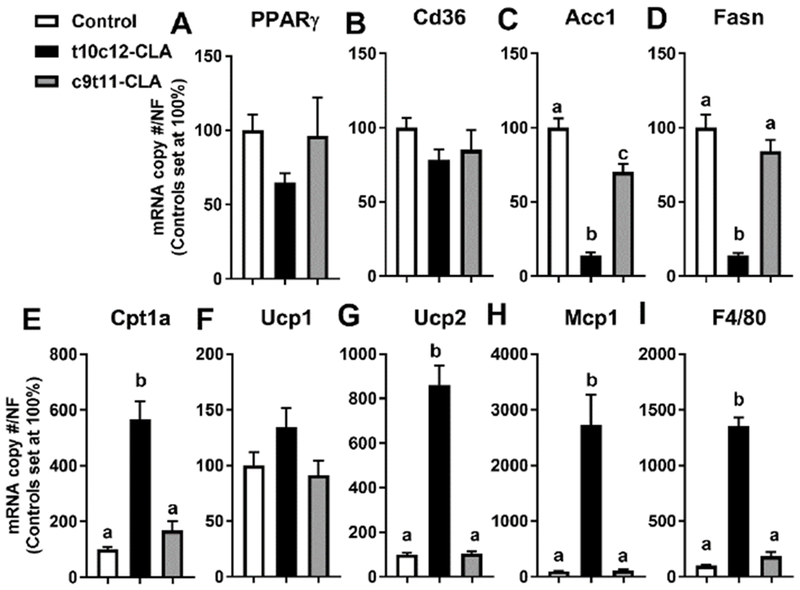
Expression of A) PPARγ, B) Cd36, C) Acc1, D) Fasn, E) Cptla, F) Ucp1, G) Ucp2, H) Mcp1, and I) F4/80 in BAT. Open columns (control diet), black columns (t10c12-CLA diet), grey columns (c9t11-CLA diet). Data are represented as means +/− SEM of relative values of controls (set at 100%), and analyzed by one-way ANOVA followed by a Tukey posthoc analysis. Different letters indicate significant differences between groups. p<0.05. N= 5-6mice/group.
Figure 6. Dietary t10c12-CLA increases expression of hepatic lipogenic genes.
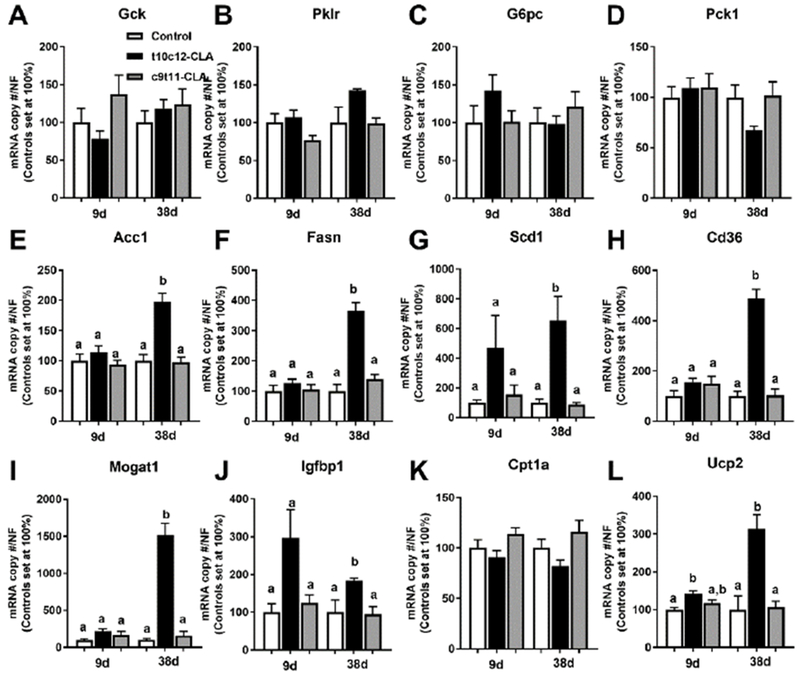
Hepatic expression of A) Gck, B) Pklr, C) G6pc, D) Pck1, E) Acc1, F) Fasn, G) Scdl, H) Cd36 I) Mogatl, J) Igfbp1, K) Cpt1a, and L) Ucp2 of mice after 9 and 38 days of the special diets. Open columns (control diet), black columns (t10c12-CLA diet), grey columns (c9t11-CLA diet). Data are represented as means +/− SEM of relative values of controls (set at 100%), and analyzed by one-way ANOVA followed by a Tukey posthoc analysis. Different letters indicate significant differences between groups within time point. p<0.05. N= 5-6 mice/group.
Figure 8. Dietary t10c12-CLA increases expression of hepatic glycolytic and lipogenic genes and reduces gluconeogenic genes in fasted mice.
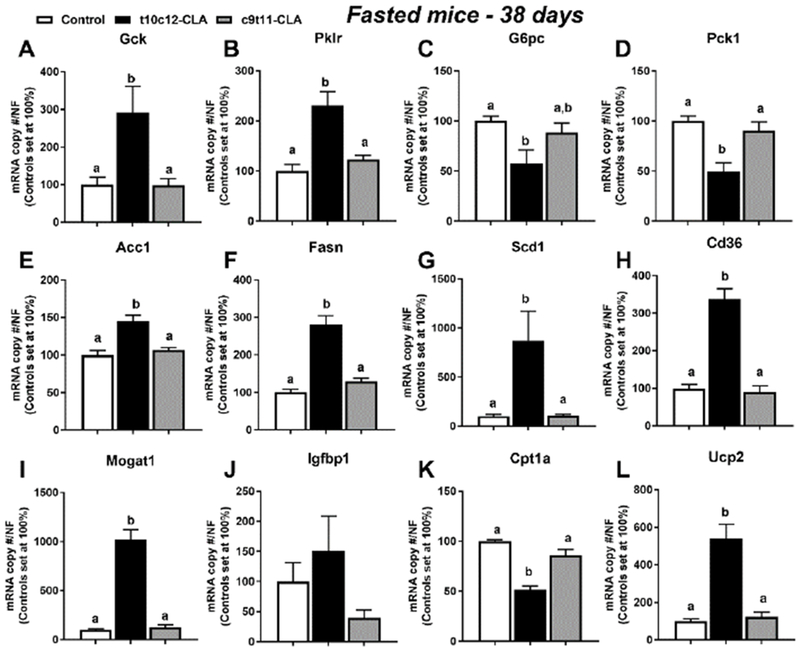
Hepatic expression of A) Gck, B) Pklr, C) G6pc, D) Pck1, E) Acc1, F) Fasn, G) Scd1, H) Cd36, I) Mogat1, J) Igfbp1, K) Cpt1a, and L) Ucp2 of overnight fasted mice after 38 days of the special diets. Open columns (control diet), black columns (t10c12-CLA diet), grey columns (c9t11-CLA diet). Data are represented as means +/− SEM of relative values of controls (set at 100%), and analyzed by one-way ANOVA followed by a Tukey posthoc analysis. Different letters indicate significant differences between groups within time point. p<0.05. N= 5-6 mice/group.
3. Results
3.1. Mice fed t10c12-CLA develop lipodystrophy and fatty liver without evidence of dyslipidemia.
Adult male C57B1/6J mice fed a t10c12-CLA diet showed a rapid reduction in fat mass after a week of diet with minor alterations of body weight (Fig 1A,B). The effect of dietary t10c12-CLA on weight loss was evident after two weeks of feeding, as there was almost complete loss of fat mass, as assessed by NMR-spectrometry. However, the fat mass signal rebounded between day 21 and 35 of diet in mice fed t10c12-CLA diet (Fig 1B). Of note, c9t11-CLA diet did not cause weight loss or alteration in fat mass throughout the duration of the diet. In addition, none of the diets affected the lean mass signal measured by NMR spectroscopy (Fig 1C). We measured food intake on day 18 of diet after a glucose tolerance test that followed an overnight fasting, and we found that control and t10c12-CLA fed mice ate similar amount of diet whereas c9t11-CLA fed mice ate significantly more diet than control mice (Table 1).
Mice fed t10c12-CLA did not show significant alterations in body weight in 9 days, but they showed reduced adipose tissue weight compared to control and the c9t11-CLA fed groups (Fig 2A-D). After 38 days of t10c12-CLA diet we could not visually detect any remaining adipose tissue (Fig 2A-D). We found no increase in the gastrocnemius muscle mass in the different groups after 38 days of diet (Fig 2E). However, like the other models of lipodystrophy [34–36], t10c12-CLA fed mice developed liver steatosis that was evident by 9 days of t10c12-CLA diet and increased further after 38 days (Fig 2F,G). Surprisingly, despite the development of lipodystrophy and fatty liver, t10c12-CLA fed mice did not develop dyslipidemia. Plasma triglycerides (TG) levels were normal, and plasma non-esterified fatty acids (NEFA) levels were actually reduced in the t10c12-CLA group throughout the study (Fig 2H,I). Of note, plasma was obtained from mice that did not have access to food for 4h, which prevented any transitory postprandial dyslipidemia in t10c12-CLA mice, and therefore, reduced NEFA in mice with and without adipose tissue may be related to increased lipid utilization in liver and muscle, which has been previously suggested [37]. These mice also showed high insulin levels at day 38 of diet (Fig 2J) which was likely due to the onset of insulin resistance.
3.2. t10c12-CLA induces rapid changes in adipose tissue gene expression associated with lipodystrophy.
An acute reduction of fat mass and the development of fatty liver in mice fed a 110c12-CLA diet for 9 days suggested that t10c12-CLA increases the mobilization of fatty acids from adipose tissue to the liver. However, plasma NEFA levels were actually reduced in these mice compared to the control mice (Fig 2I and 3A), and this was associated with reduced expression of peroxisome proliferator-activated receptor γ (Pparγ), adipose triglyceride lipase (Atgl), and hormone sensitive lipase (Hsl) in both inguinal and gonadal WAT (Fig 3B, D, E). Fatty acid translocase (Cd36), a PPARγ-target gene involved in fatty acid uptake, was reduced in c9t11-CLA fed mice (Fig 3C). Also, we found that c9t11-CLA significantly reduced the expression of Atgl in inguinal WAT, and Hsl in inguinal and gonadal WAT (Fig 3D,E). Expression of the lipogenic genes acetyl-CoA carboxylase (Acc1) and fatty acid synthase (Fasn) was significantly reduced in inguinal WAT of t10c12-CLA fed mice as compared to controls (Fig 3F,G). Conversely, the expression of carnitine palmitoyltransferase 1 a (Cptla) and uncoupling protein 2 (Ucp2), genes related to fatty oxidation and energy expenditure was increased in both WAT sub depots, although Ucp 1 was not significantly increased (Fig 3H-J). Finally, the expression of inflammation-related genes, monocyte chemoattractant protein 1 (Mcp1) and the macrophage marker (F4/80), was increased in both WAT sub depots in t10c12-CLA fed mice. Our results are in line with other studies that reported both an inhibitory effect of t10c12-CLA on the expression of adipocyte regulatory factors, lipolytic and lipogenic genes and a stimulatory effect on the expression of genes involved in energy expenditure and inflammation [6, 37]. “In addition, our results confirmed by qPCR the decreased expression of PPARg, and increased expression of Ucp2 in brown adipose tissue [37, 38], while it extended these result to include the reduced expression of Acc1, Fasn, and increased expression of Mcp1 and F4/80 expression (Fig 4A-I)”.
3.3. Dietary t10c12 CLA promotes insulin resistance but not glucose intolerance or hyperglycemia.
Lipodystrophy is commonly associated with high glucose levels, glucose intolerance, and the inability to lower blood glucose after administration of an acute bolus of insulin. After 14 days, we detected elevated blood glucose levels in mice fed a t10c12-CLA diet as compared to mice fed control diet (Fig 5A), which suggested that glucose homeostasis was impaired. However, t10c12-CLA fed mice were able to normalize blood glucose during a GTT at day 18 of diet (Fig 5B,D). In fact, we observed that 15 min after glucose injections, blood glucose levels in t10c12-CLA mice were reduced as compared to those of c9t11-CLA mice (Fig 5B). Interestingly, we noted that the blood glucose levels of mice fed a t10c12-CLA diet were lower than in controls or c9t11-CLA mice (from day 21 to day 31) (Fig 5A). Despite maintaining normal/low glucose levels, mice fed a t10c12-CLA diet for 22 days were insulin resistant, as determined by ITT (Fig 5C, E).
3.4. t10c12-CLA induces changes in hepatic gene expression and fatty acid composition indicative of enhanced glucose and fatty acid utilization.
In order to assess if dietary t10c12-CLA or c9t11-CLA impacts hepatic regulation of glucose homeostasis, we measured the expression of hepatic genes involved in glucose and lipid metabolism in mice fed CLA for 9 and 38 days. c9t11-CLA did not alter the expression of any of the hepatic genes assessed in this study, and the t10c12-CLA did not alter the expression of genes involved in glucose utilization, namely glucokinase (Gck) and pyruvate kinase (Pklr), or glucose production, namely glucose-6-phosphatase (G6pc) and phosphoenolpyruvate carboxykinase (Pck1) (Fig 6A-D). However, after 38 days, the expression of genes involved in DNL, namely Acc1, Fasn, and stearoyl-CoA desaturase 1 (Scd1), as well as genes involved in the uptake and re-esterification of fatty acids, Cd36 and monoacylglycerol O-acyltransferase 1 (Mogat1) were increased in mice fed t10c12-CLA, compared to controls and the c9t11-CLA group (Fig 6 E-I). Also, the expression of insulin-like growth factor binding protein 1 (Igfbp1) was significantly increased after 38 days of t10c12-CLA diet (Fig 6 J) which suggested that the liver of t10c12-CLA fed mice was insulin resistant. Although we did not observe an increase in hepatic Cpt1a expression in the t10c12-CLA fed mice (Fig 6K), hepatic Ucp2 expression was significantly increased at 9 and 38 days (Fig 6L). In order to determine the physiological consequences of the changes in lipogenic genes, we determined hepatic fatty acid composition by GC/MS (Tables 2,3). Total hepatic fatty acids were increased in mice fed a t10c12-CLA diet for 9 and 38 days (Fig 7A). These changes were associated with increased levels of hepatic saturated fatty acids (SFA) and monounsaturated fatty acids (MUFA) but not polyunsaturated fatty acids (PUFA) after 38 days of diet (Fig 7B-D, Table 2). Interestingly, mice fed a c9t11-CLA and t10c12-CLA diets for 9 days showed similar changes in the percentage of SFA, MUFA and PUFA (Fig 7E-G, Table 3). However, after 38 days of diet, only mice fed the t10c12-CLA diet showed increased percentages of MUFA and reduced percentages of PUFA (Fig 7F,G, Table 3). The dramatic reduction in the percentage of PUFA was not only due to a massive increase of the main MUFA: 16:1(n-7) and 18:1 (n-9), but also due to a significant reduction in the absolute levels of the main PUFA subspecies: 18:2(n-6) and 20-4(n-6) (Table 2,3). Of note, independent of the length of dietary treatment, the ratio of MUFA/PUFA was increased in mice fed the t10c12-CLA diet (Fig 7H). This effect could be due to increased synthesis of fatty acids by DNL, which predominantly generates 16:0, 16:1(n-7), 18:1(n-7), and 18:1(n-9) [39]. Hepatic ratios of 16:0/18:2(n-6) (DNL-index, Fig 7I), [18:1(n-7)+16:1(n-7)]/16:0 and 18:1(n-9)/18:0 (SCD-index, Fig 7J-K) are positively associated with hepatic DNL [39–42] and they were elevated in t10c12-CLA mice.
Table 2. Hepatic fatty acid composition: absolute values.
Individual fatty acid methyl esters were quantified using GC/MS. Data are represented as means +/− SEM (mg/g wet weight), and analyzed by t-test. Asterisks indicate significant differences between groups, as assessed by two-tailed student’s t-test.
| 9d | Control | t10c12-CLA | c9t11-CLA | ||||||
|---|---|---|---|---|---|---|---|---|---|
| mg/g | Mean | SEM | Mean | SEM | vs C | Mean | SEM | vs C | vs t10c12-CLA |
| 16:0 | 18.80 ± 0.461 | 33.82 ± 2.928 | ** | 24.61 ± 1.979 | * | * | |||
| 16:1(n-7) | 2.79 ± 0.341 | 5.06 ± 0.792 | ns | 5.14 ± 0.743 | * | ns | |||
| 18:0 | 8.13 ± 0.380 | 8.24 ± 0.261 | ns | 8.26 ± 0.348 | ns | ns | |||
| 18:1 (n-9) | 22.78 ± 2.250 | 48.04 ± 5.271 | ** | 36.36 ± 5.235 | ns | ns | |||
| 18:1(n-7) | 3.19 ± 0.403 | 7.45 ± 1.006 | * | 6.11 ± 0.938 | * | ns | |||
| 18:2 (n-6) | 15.69 ± 1.090 | 15.83 ± 1.086 | ns | 11.65 ± 0.588 | ** | ** | |||
| 18:3 (n-3) | 0.64 ± 0.056 | 0.95 ± 0.067 | * | 0.76 ± 0.044 | ns | ns | |||
| 20:0 | 0.22 ± 0.016 | 0.01 ± 0.001 | **** | 0.04 ± 0.038 | ** | ns | |||
| 20:1 (n-9) | 0.60 ± 0.096 | 1.56 ± 0.189 | ** | 1.07 ± 0.170 | ns | ns | |||
| 20:3 (n-6) | 1.14 ± 0.071 | 0.96 ± 0.030 | * | 1.17 ± 0.041 | ns | ** | |||
| 20:4 (n-6) | 8.25 ± 0.246 | 6.80 ± 0.150 | *** | 7.50 ± 0.412 | ns | ns | |||
| 20:5 (n-3) | 0.45 ± 0.026 | 0.17 ± 0.053 | ** | 0.65 ± 0.021 | *** | ns | |||
| 22:6 (n-3) | 9.59 ± 3.526 | 5.76 ± 0.310 | ns | 6.80 ± 0.272 | ns | * | |||
| 38d | Control | t10c12-CLA | c9t11-CLA | ||||||
| mg/g | Mean | SEM | Mean | SEM | vs C | Mean | SEM | vs C | vs t10c12-CLA |
| 16:0 | 19.71 ± 2.480 | 73.34 ± 3.239 | **** | 16.54 ± 2.436 | ns | **** | |||
| 16:1(n-7) | 3.79 ± 0.904 | 15.01 ± 1.241 | **** | 3.14 ± 0.667 | ns | **** | |||
| 18:0 | 6.41 ± 0.468 | 9.03 ± 0.146 | *** | 5.52 ± 0.247 | ns | **** | |||
| 18:1 (n-9) | 31.35 ± 6.439 | 166.14 ± 6.887 | **** | 23.19 ± 5.115 | ns | **** | |||
| 18:1(n-7) | 3.81 ± 0.667 | 28.51 ± 1.669 | **** | 3.06 ± 0.670 | ns | **** | |||
| 18:2 (n-6) | 12.00 ± 1.942 | 4.96 ± 0.355 | ** | 6.02 ± 0.554 | * | ns | |||
| 20:1 (n-9) | 0.86 ± 0.169 | 7.87 ± 0.372 | **** | 0.64 ± 0.144 | ns | **** | |||
| 20:3 (n-6) | 0.96 ± 0.084 | 1.31 ± 0.029 | ** | 0.78 ± 0.049 | ns | **** | |||
| 20:4 (n-6) | 6.28 ± 0.528 | 2.67 ± 0.113 | **** | 4.46 ± 0.225 | ** | **** | |||
| 22:6 (n-3) | 4.49 ± 0.476 | 2.94 ± 0.108 | * | 4.00 ± 0.226 | ns | ** | |||
p<0.05;
p <0.01;
p<0.001;
p<,0.0001.
N= 4-6mice/group.
Table 3. Hepatic fatty acid composition: percentages of total.
Individual fatty acid methyl esters were quantified using GC/MS. Data are represented as means +/− SEM (percentage of total), and analyzed by t-test. Asterisks indicate significant differences between groups , as assessed by two-tailed student’s t-test..
| 9d | Control | t10c12-CLA | c9t11-CLA | ||||||
|---|---|---|---|---|---|---|---|---|---|
| % | Mean | SEM | Mean | SEM | vs C | Mean | SEM | vs C | vs t10c12-CLA |
| 16:0 | 20.47 ± 0.754 | 25.01 ± 0.334 | *** | 22.34 ± 0.281 | ns | *** | |||
| 16:1(n-7) | 3.02 ± 0.369 | 3.64 ± 0.343 | ns | 4.59 ± 0.535 | ns | ns | |||
| 18:0 | 8.86 ± 0.596 | 6.32 ± 0.555 | * | 7.75 ± 0.777 | ns | ns | |||
| 18:1 (n-9) | 24.64 ± 1.981 | 35.16 ± 1.452 | ** | 32.12 ± 2.456 | ns | ns | |||
| 18:1(n-7) | 3.45 ± 0.389 | 5.42 ± 0.400 | * | 5.41 ± 0.593 | * | ns | |||
| 18:2 (n-6) | 17.22 ± 1.806 | 11.99 ± 0.987 | * | 10.88 ± 0.915 | ** | ns | |||
| 18:3 (n-3) | 0.70 ± 0.091 | 0.72 ± 0.076 | ns | 0.70 ± 0.036 | ns | ns | |||
| 20:0 | 0.24 ± 0.013 | 0.005 ± 0.002 | **** | 0.03 ± 0.030 | *** | ns | |||
| 20:1 (n-9) | 0.64 ± 0.089 | 1.14 ± 0.068 | ** | 0.94 ± 0.087 | * | ns | |||
| 20:3 (n-6) | 1.24 ± 0.038 | 0.73 ± 0.052 | *** | 1.09 ± 0.086 | ns | ** | |||
| 20:4 (n-6) | 9.01 ± 0.547 | 5.25 ± 0.524 | ** | 7.13 ± 0.916 | ns | ns | |||
| 20:5 (n-3) | 0.50 ± 0.045 | 0.13 ± 0.045 | *** | 0.61 ± 0.041 | ns | **** | |||
| 22:6 (n-3) | 10.01 ± 3.110 | 4.48 ± 0.568 | ns | 6.40 ± 0.611 | ns | * | |||
| 38d | Control | t10c12-CLA | c9t11-CLA | ||||||
| % | Mean | SEM | Mean | SEM | vs C | Mean | SEM | vs C | vs t10c12-CLA |
| 16:00 | 22.15 ± 0.521 | 23.52 ± 0.096 | * | 24.62 ± 0.283 | ** | ** | |||
| 16:01 | 4.01 ± 0.381 | 4.78 ± 0.197 | ns | 4.47 ± 0.355 | ns | ns | |||
| 18:00 | 7.70 ± 0.898 | 2.92 ± 0.094 | *** | 8.85 ± 0.928 | ns | **** | |||
| 18:1 (n-9) | 33.47 ± 2.545 | 53.32 ± 0.239 | **** | 32.78 ± 2.305 | ns | **** | |||
| 18:1(n-7) | 4.16 ± 0.192 | 9.12 ± 0.207 | **** | 4.32 ± 0.362 | ns | **** | |||
| 18:2 (n-6) | 13.26 ± 0.589 | 1.58 ± 0.044 | **** | 9.33 ± 0.663 | ** | **** | |||
| 20:01 | 0.93 ± 0.098 | 2.53 ± 0.054 | **** | 0.91 ± 0.077 | ns | **** | |||
| 20:03 | 1.14 ± 0.127 | 0.43 ± 0.023 | *** | 1.23 ± 0.103 | ns | **** | |||
| 20:4 (n-6) | 7.70 ± 1.070 | 0.86 ± 0.049 | **** | 7.13 ± 0.749 | ns | **** | |||
| 22:6 (n-3) | 5.48 ± 0.755 | 0.95 ± 0.041 | *** | 6.37 ± 0.594 | ns | **** | |||
p<0.05;
p <0.01;
p<0.001;
p<,0.0001.
N= 4-6 mice/group.
Figure 7. Dietary t10c12-CLA induces significant changes in the hepatic fatty acid composition.
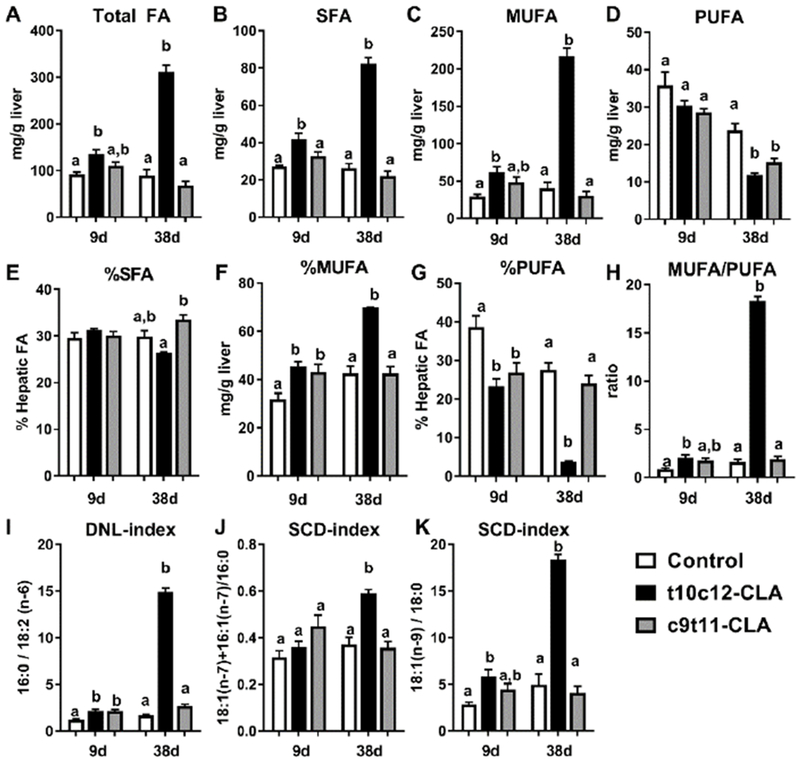
Hepatic levels of A) total fatty acids (FA), B) saturated FA (SFA), C) monounsaturated FA (MUFA), D) polyunsaturated FA (PUFA), E) MUFA/PUFA ratio, F) percentage of SFA, G) percentage of MUFA, H) percentage of PUFA, I) de novo lipogenesis index (DNL: 16:0/182:2(n-6), J) SCD-index (18:1(n-7)+16:1(n-7)/16:0), and K) J) SCD-index (18:1(n-9)/18:0) of mice after 38 days of the special diets. Open columns (control diet), black columns (t10c12-CLA diet), grey columns (c9t11-CLA diet). Data are represented as means +/− SEM, and analyzed by one-way ANOVA followed by a Tukey posthoc analysis. Different letters indicate significant differences between groups within time point. p<0.05. N= 4-6mice/group.
To determine the effect of fasting, a subset of mice fed the special diets for 38 days was killed after an overnight fasting, and their hepatic gene expression was determined. Overnight fasting resulted in increased expression of hepatic Gck and Pklr and reduced expression of G6pc and Pck1 (Fig 8A-D) in mice fed t10c12-CLA. Hepatic Acc1, Fasn, Scd1, Cd36 and Mogat1 expression was also increased in the fasted livers of t10c12-CLA fed mice (Fig 8E-I). Interestingly, the expression of Igfbp1 was not increased in mice fed a t10c12-CLA after an overnight fasting (Fig 8J) despite high plasma insulin levels of fasted t10c12-CLA mice: 0.56+/0.21 ng/ml [control], 2.68 +/− 0.55 ng/ml [t10c12-CLA], 0.76+/−0.13 ng/ml [c9t11-CLA]. Finally, we observed that expression of hepatic Cpt1a was reduced (Fig 8K), and Ucp2 expression was increased in the fasted mice treated with t10c12-CLA (Fig 8L).
4. Discussion
We have shown that a low-fat diet containing t10c12-CLA rapidly induces a lipodystrophic phenotype in adult male mice with the subsequent development of insulin resistance and fatty liver. However, compensatory changes take place in the liver of the mice fed t10c12-CLA, following the development of lipodystrophy, which prevent glucose intolerance and maintain normal blood glucose levels. Previous studies in diet-induced obese Ld1r−/− mice [37, 43] showed that 1% t10c12-CLA diets reduce body weight and select-depot fat mass and exacerbate steatosis. Our studies in wild-type lean mice showed time- and tissue-dependent effects of pure CLA-isomers that affect body composition and metabolic function. Although t10c12-CLA diet showed anti-adiposity properties, we did not observe changes in total body weight or lean mass. The reduction in adipose tissue and the subsequent development of insulin resistance promoted by t10c12-CLA led to an excessive accumulation of fat in the liver that was detectable by whole-body NMR-spectrometry. Interestingly, insulin resistance in mice fed a t10c12-CLA was not associated with glucose intolerance or high levels of blood glucose. The reduced effect of t10c12-CLA on hepatic gene expression and fatty acid composition after 9 days of diet strongly suggests that t10c12-CLA diets may impact indirectly hepatic lipid and glucose metabolism upon the development of lipodystrophy. In the absence of adipose tissue, the liver becomes the major center processing and storage of dietary carbohydrates and lipids. The changes observed hepatic gene expression and fatty acid composition strongly suggest an increase in the utilization of glucose to synthetize fatty acids by DNL and an increase uptake and re-esterification of NEFA from circulation to prevent dyslipidemia.
c9t11-CLA isomer does not have the same effect as t10c12-CLA on adipose tissue and metabolic function. Previous studies showed that four week feeding with 0.4% c9t11-CLA diet did not reduce fat mass or body weight in wild-type and obese db/db mice [44]. Similarly, eight week feeding with 0.5% or 1% c9t11-CLA diet did not reduce fat mass or body weight in diet-induced obese Ld1r−/− mice [37]. However, in these studies, 0.4% t10c12-CLA diet reduced fat mass in obese and lean mice in all fat subdepots [44] as supported by earlier studies [8–10], while 1% t10c12-CLA diet was required to reduced inguinal fat mass in diet-induced obese Ld1r−/− mice [37]. It is possible that inguinal WAT is more sensitive to the actions of t10c12-CLA since, we have observed that after 9 days of t10c12-CLA feeding in lean mice, inguinal but not gonadal WAT showed reduced Fasn, Acc-1 (lipogenesis) and increased Cptla (fatty acid oxidation) expression. Overall, our data are in agreement with previous studies that report the anti-adipogenic actions of t10c12-CLA and we extend these observations to BAT. As previously reported by others, the actions of t10c12-CLA are clearly involved in the loss of adipocyte differentiation, reduction of lipogenesis, and increase in fatty acid oxidation and inflammation [6, 16, 37, 45] which may be directly associated with apoptosis-mediated cell death induced directly by t10c12-CLA [16–18] that produces lipodystrophy.
Mice fed t10c12-CLA or a mixture of c9tl 1-CLA and t10c12-CLA are known to develop steatosis and insulin resistance [10]. In our study, however, mice fed 0.8% t10c12-CLA showed normal blood glucose levels and glucose tolerance. This led us to question how they could control glucose levels in the circulation despite impaired insulin-mediated glucose disposal in muscle and adipose tissue, and hepatosteatotis. One possible explanation may reside in improved hepatic glucose utilization. Insulin increases glucose utilization in the liver by inhibiting glucose production and promoting DNL, which in turn reduces fatty acid oxidation [46]. Of relevance for this study, we observed that while hepatic MUFA levels were increased, hepatic PUFA levels were reduced in mice fed t10c12-CLA, which was in agreement with other reports [26, 28, 29]. Of note, a reduction in hepatic PUFA in mice fed t10c12-CLA may be due to increased lipid peroxidation [47] and decreased PUFA biosynthesis [48, 49], but apparently not due to β-oxidation [30]. A decrease in PUFA leads to stimulation of carbohydrate-responsive element binding protein, a key nuclear factor which enhances DNL, through increased glycolytic flow [50]. In t10c12-CLA treated mice, upon development of lipodystrophy, enhanced glycolytic flow and associated DNL may offset the activation of glucose production [51], and this may contribute to normalization of plasma glucose levels. On the other hand, the stimulation of expression lipogenic genes by t10c12-CLA appears to conflict with the reported negative effects of t10c12 CLA on SCD activity. Thus while several in vitro studies reported that the expression and activity of Scd-1, an enzyme strongly associated with DNL, is inhibited by t10c12 CLA [52,54], our current study, as well as previous reports by others [20, 27, 28, 31] showed that, in vivo, Scd-1 activity and expression was actually increased by t10c12-CLA. A possible explanation for this contradiction may lie in the fact that hepatic PUFA levels are significantly reduced upon development of lipodystrophy and consequently hepatic DNL is increased as discussed above. However, the exact mechanism by which t10c12-CLA reduces hepatic PUFA levels requires further investigation. Nonetheless, the positive effect of t10c12-CLA on hepatic DNL is also supported by studies in vitro that used linoleic acid (PUFA) as control [55], and in vivo studies that reported an insulin-dependent t10c12-CLA-mediated upregulation of hepatic DNL [20, 27, 31]. In addition, the effects of t10c12-CLA in vivo may be diet-dependent, since high fat diet-induced obese Ld1r−/− mice do not show changes in insulin resistance, insulin levels, or expression of genes involved in DNL but have worse steatosis than obese controls [37].
Although the induction of hepatic DNL seems to be one of the more significant effects of t10c12-CLA in lean mice, it remains to be determined why the liver of mice fed t10c12-CLA does develop severe hepatic insulin resistance and shows reduced expression of gluconeogenic genes. In this regard, it should be noted that lipodystrophic models with steatosis display dyslipidemia due to WAT lipolysis [34–36] which leads to hepatic insulin resistance and glucose intolerance [56]. However, based on our results and previous studies, it is likely that mice fed t10c12-CLA show increased lipid utilization [37] associated with increased expression of Ucp-2 in multiple tissues [57] rather than increase WAT lipolysis. This may represent a discrepancy between the lipodystrophic models and the phenotype observed in t10c12-CLA fed mice.
Taken together, the data presented here suggest that t10c12 CLA has differential effects on adipose tissue and liver. Our data are in line with those published by others that support a rapid effect of t10c12-CLA on macrophage infiltration and apoptosis in the adipose tissue, resulting in rapid loss of adipocytes, and consequent development of hyperinsulinemia. However, in the liver, t10c12-CLA may have indirect effects dependent of the massive loss of adipose tissue and reduction in PUFA levels that eventually worse steatosis mainly due to increased de novo synthesis of lipids but keep the liver sensitive to the actions of insulin to prevent glucose intolerance.
Supplementary Material
Highlights.
-
-
t10c12-CLA, but not c9t11-CLA, has significant effects on the physiology of lean mice.
-
-
Dietary t10c12-CLA has differential effects on liver and adipose tissue
-
-
Hepatic actions of t10c12-CLA are dependent of loss of adipose tissue.
-
-
Alterations of hepatic metabolism by t10c12-CLA may regulate glucose homeostasis.
Acknowledgments
Funding sources: This study was partly funded by National Institutes of Health [grant numbers K01DK125525, R21AT008457, S10OD010660]; Department of Veterans Affairs [grant numbers BX001114, BX001090].
Footnotes
Publisher's Disclaimer: This is a PDF file of an unedited manuscript that has been accepted for publication. As a service to our customers we are providing this early version of the manuscript. The manuscript will undergo copyediting, typesetting, and review of the resulting proof before it is published in its final citable form. Please note that during the production process errors may be discovered which could affect the content, and all legal disclaimers that apply to the journal pertain.
Conflict of interest: Authors do not have any conflict of interest.
5. References
- [1].Gholami Z, Khosravi-Darani K. An overview of conjugated linoleic acid: microbial production and application. Mini Rev Med Chem. 2014;14:734–46. [DOI] [PubMed] [Google Scholar]
- [2].Koba K, Yanagita T. Health benefits of conjugated linoleic acid (CLA). Obes Res Clin Pract. 2014;8:e525–32. [DOI] [PubMed] [Google Scholar]
- [3].De La Torre A, Gruffat D, Durand D, Micol D, Peyron A, Scislowski V, et al. Factors influencing proportion and composition of CLA in beef. Meat Sci. 2006;73:258–68. [DOI] [PubMed] [Google Scholar]
- [4].Lee KN, Kritchevsky D, Pariza MW. Conjugated linoleic acid and atherosclerosis in rabbits. Atherosclerosis. 1994;108:19–25. [DOI] [PubMed] [Google Scholar]
- [5].Nicolosi RJ, Rogers EJ, Kritchevsky D, Scimeca JA, Huth PJ. Dietary conjugated linoleic acid reduces plasma lipoproteins and early aortic atherosclerosis in hypercholesterolemic hamsters. Artery. 1997;22:266–77. [PubMed] [Google Scholar]
- [6].LaRosa PC, Miner J, Xia Y, Zhou Y, Kachman S, Fromm ME. Trans-10, cis-12 conjugated linoleic acid causes inflammation and delipidation of white adipose tissue in mice: a microarray and histological analysis. Physiol Genomics. 2006;27:282–94. [DOI] [PubMed] [Google Scholar]
- [7].Ochoa JJ, Farquharson AJ, Grant I, Moffat LE, Heys SD, Wahle KW. Conjugated linoleic acids (CLAs) decrease prostate cancer cell proliferation: different molecular mechanisms for cis-9, trans-11 and trans-10, cis-12 isomers. Carcinogenesis. 2004;25:1185–91. [DOI] [PubMed] [Google Scholar]
- [8].Wang Y, Jones PJ. Dietary conjugated linoleic acid and body composition. Am J Clin Nutr. 2004;79:1153S–8S. [DOI] [PubMed] [Google Scholar]
- [9].Wang YW, Jones PJ. Conjugated linoleic acid and obesity control: efficacy and mechanisms. Int J Obes Relat Metab Disord. 2004;28:941–55. [DOI] [PubMed] [Google Scholar]
- [10].Vyas D, Kadegowda AK, Erdman RA. Dietary conjugated linoleic Acid and hepatic steatosis: species-specific effects on liver and adipose lipid metabolism and gene expression. J Nutr Metab. 2012;2012:932928. [DOI] [PMC free article] [PubMed] [Google Scholar]
- [11].Blankson H, Stakkestad JA, Fagertun H, Thom E, Wadstein J, Gudmundsen O. Conjugated linoleic acid reduces body fat mass in overweight and obese humans. J Nutr. 2000;130:2943–8. [DOI] [PubMed] [Google Scholar]
- [12].Watras AC, Buchholz AC, Close RN, Zhang Z, Schoeller DA. The role of conjugated linoleic acid in reducing body fat and preventing holiday weight gain. Int J Obes (Lond). 2007;31:481–7. [DOI] [PubMed] [Google Scholar]
- [13].Chen BQ, Yang YM, Gao YH, Liu JR, Xue YB, Wang XL, et al. Inhibitory effects of c9, t11-conjugated linoleic acid on invasion of human gastric carcinoma cell line SGC-7901. World J Gastroenterol. 2003;9:1909–14. [DOI] [PMC free article] [PubMed] [Google Scholar]
- [14].Riserus U, Vessby B, Arnlov J, Basu S. Effects of cis-9,trans-11 conjugated linoleic acid supplementation on insulin sensitivity, lipid peroxidation, and proinflammatory markers in obese men. Am J Clin Nutr. 2004;80:279–83. [DOI] [PubMed] [Google Scholar]
- [15].Riserus U, Arner P, Brismar K, Vessby B. Treatment with dietary trans10cis12 conjugated linoleic acid causes isomer-specific insulin resistance in obese men with the metabolic syndrome. Diabetes Care. 2002;25:1516–21. [DOI] [PubMed] [Google Scholar]
- [16].Poirier H, Shapiro JS, Kim RJ, Lazar MA. Nutritional supplementation with trans-10, cis-12-conjugated linoleic acid induces inflammation of white adipose tissue. Diabetes. 2006;55:1634–41. [DOI] [PubMed] [Google Scholar]
- [17].Hargrave KM, Li C, Meyer BJ, Kachman SD, Hartzell DL, Della-Fera MA, et al. Adipose depletion and apoptosis induced by trans-10, cis-12 conjugated linoleic Acid in mice. Obes Res. 2002;10:1284–90. [DOI] [PubMed] [Google Scholar]
- [18].Tsuboyama-Kasaoka N, Takahashi M, Tanemura K, Kim HJ, Tange T, Okuyama H, et al. Conjugated linoleic acid supplementation reduces adipose tissue by apoptosis and develops lipodystrophy in mice. Diabetes. 2000;49:1534–42. [DOI] [PubMed] [Google Scholar]
- [19].Belda BJ, Thompson JT, Eser PO, Vanden Heuvel JP. 10e12z CLA alters adipocyte differentiation and adipocyte cytokine expression and induces macrophage proliferation. J Nutr Biochem. 2012;23:510–8. [DOI] [PubMed] [Google Scholar]
- [20].Clement L, Poirier H, Niot I, Bocher V, Guerre-Millo M, Krief S, et al. Dietary trans-10,cis-12 conjugated linoleic acid induces hyperinsulinemia and fatty liver in the mouse. J Lipid Res. 2002;43:1400–9. [DOI] [PubMed] [Google Scholar]
- [21].Brown MS, Goldstein JL. Selective versus total insulin resistance: a pathogenic paradox. Cell Metab. 2008;7:95–6. [DOI] [PubMed] [Google Scholar]
- [22].Letona AZ, Niot I, Laugerette F, Athias A, Monnot MC, Portillo MP, et al. CLA-enriched diet containing t10,c12-CLA alters bile acid homeostasis and increases the risk of cholelithiasis in mice. J Nutr. 2011;141:1437–44. [DOI] [PubMed] [Google Scholar]
- [23].Nagao T, Yamauchi-Sato Y, Sugihara A, Iwata T, Nagao K, Yanagita T, et al. Purification of conjugated linoleic acid isomers through a process including lipase-catalyzed selective esterification. Biosci Biotechnol Biochem. 2003;67:1429–33. [DOI] [PubMed] [Google Scholar]
- [24].Nair A, Morsy MA, Jacob S. Dose translation between laboratory animals and human in preclinical and clinical phases of drug development. Drug Dev Res. 2018. [DOI] [PubMed] [Google Scholar]
- [25].Benjamin S, Prakasan P, Sreedharan S, Wright AD, Spener F. Pros and cons of CLA consumption: an insight from clinical evidences. Nutr Metab (Lond). 2015;12:4. [DOI] [PMC free article] [PubMed] [Google Scholar]
- [26].Jaudszus A, Moeckel P, Hamelmann E, Jahreis G. Trans-10,cis-12-CLA-caused lipodystrophy is associated with profound changes of fatty acid profiles of liver, white adipose tissue and erythrocytes in mice: possible link to tissue-specific alterations of fatty acid desaturation. Ann Nutr Metab. 2010;57:103–11. [DOI] [PubMed] [Google Scholar]
- [27].Jourdan T, Djaouti L, Demizieux L, Gresti J, Verges B, Degrace P. Liver carbohydrate and lipid metabolism of insulin-deficient mice is altered by trans-10, cis-12 conjugated linoleic acid. J Nutr. 2009;139:1901–7. [DOI] [PubMed] [Google Scholar]
- [28].Kelley DS, Bartolini GL, Warren JM, Simon VA, Mackey BE, Erickson KL. Contrasting effects of t10,c12- and c9,t11-conjugated linoleic acid isomers on the fatty acid profiles of mouse liver lipids. Lipids. 2004;39:135–41. [DOI] [PubMed] [Google Scholar]
- [29].Marques TM, Wall R, O’Sullivan O, Fitzgerald GF, Shanahan F, Quigley EM, et al. Dietary trans-10, cis-12-conjugated linoleic acid alters fatty acid metabolism and microbiota composition in mice. Br J Nutr. 2015;113:728–38. [DOI] [PubMed] [Google Scholar]
- [30].Rasooly R, Kelley DS, Greg J, Mackey BE. Dietary trans 10, cis 12-conjugated linoleic acid reduces the expression of fatty acid oxidation and drug detoxification enzymes in mouse liver. Br J Nutr. 2007;97:58–66. [DOI] [PubMed] [Google Scholar]
- [31].Takahashi Y, Kushiro M, Shinohara K, Ide T. Activity and mRNA levels of enzymes involved in hepatic fatty acid synthesis and oxidation in mice fed conjugated linoleic acid. Biochim Biophys Acta. 2003;1631:265–73. [DOI] [PubMed] [Google Scholar]
- [32].Cordoba-Chacon J, Gahete MD, McGuinness OP, Kineman RD. Differential impact of selective GH deficiency and endogenous GH excess on insulin-mediated actions in muscle and liver of male mice. Am J Physiol Endocrinol Metab. 2014;307:E928–34. [DOI] [PMC free article] [PubMed] [Google Scholar]
- [33].Kineman RD, Majumdar N, Subbaiah PV, Cordoba-Chacon J. Hepatic PPARgamma Is Not Essential for the Rapid Development of Steatosis After Loss of Hepatic GH Signaling, in Adult Male Mice. Endocrinology. 2016;157:1728–35. [DOI] [PMC free article] [PubMed] [Google Scholar]
- [34].Qiang G, Whang Kong H, Xu S, Pham HA, Parlee SD, Burr AA, et al. Lipodystrophy and severe metabolic dysfunction in mice with adipose tissue-specific insulin receptor ablation. Mol Metab. 2016;5:480–90. [DOI] [PMC free article] [PubMed] [Google Scholar]
- [35].Sakaguchi M, Fujisaka S, Cai W, Winnay JN, Konishi M, O’Neill BT, et al. Adipocyte Dynamics and Reversible Metabolic Syndrome in Mice with an Inducible Adipocyte-Specific Deletion of the Insulin Receptor. Cell Metab. 2017;25:448–62. [DOI] [PMC free article] [PubMed] [Google Scholar]
- [36].Wang F, Mullican SE, DiSpirito JR, Peed LC, Lazar MA. Lipoatrophy and severe metabolic disturbance in mice with fat-specific deletion of PPARgamma. Proc Natl Acad Sci U S A. 2013;110:18656–61. [DOI] [PMC free article] [PubMed] [Google Scholar]
- [37].den Hartigh LJ, Wang S, Goodspeed L, Wietecha T, Houston B, Omer M, et al. Metabolically distinct weight loss by 10,12 CLA and caloric restriction highlight the importance of subcutaneous white adipose tissue for glucose homeostasis in mice. PLoS One. 2017;12:e0172912. [DOI] [PMC free article] [PubMed] [Google Scholar]
- [38].Takahashi Y, Kushiro M, Shinohara K, Ide T. Dietary conjugated linoleic acid reduces body fat mass and affects gene expression of proteins regulating energy metabolism in mice. Comp Biochem Physiol B Biochem Mol Biol. 2002;133:395–404. [DOI] [PubMed] [Google Scholar]
- [39].Lee JJ, Lambert JE, Hovhannisyan Y, Ramos-Roman MA, Trombold JR, Wagner DA, et al. Palmitoleic acid is elevated in fatty liver disease and reflects hepatic lipogenesis. Am J Clin Nutr. 2015;101:34–43. [DOI] [PMC free article] [PubMed] [Google Scholar]
- [40].Chong MF, Hodson L, Bickerton AS, Roberts R, Neville M, Karpe F, et al. Parallel activation of de novo lipogenesis and stearoyl-CoA desaturase activity after 3 d of high-carbohydrate feeding. Am J Clin Nutr. 2008;87:817–23. [DOI] [PubMed] [Google Scholar]
- [41].Peter A, Cegan A, Wagner S, Lehmann R, Stefan N, Konigsrainer A, et al. Hepatic lipid composition and stearoyl-CoA desaturase 1 mRNA expression can be estimated from plasma VLDL fatty acid ratios. Clinical chemistry. 2009;55:2113–20. [DOI] [PubMed] [Google Scholar]
- [42].Silbernagel G, Kovarova M, Cegan A, Machann J, Schick F, Lehmann R, et al. High hepatic SCD1 activity is associated with low liver fat content in healthy subjects under a lipogenic diet. The Journal of clinical endocrinology and metabolism. 2012;97:E2288–92. [DOI] [PubMed] [Google Scholar]
- [43].Wang S, Goodspeed L, Turk KE, Houston B, den Hartigh LJ. Rosiglitazone Improves Insulin Resistance Mediated by 10,12 Conjugated Linoleic Acid in a Male Mouse Model of Metabolic Syndrome. Endocrinology. 2017;158:2848–59. [DOI] [PMC free article] [PubMed] [Google Scholar]
- [44].Yeganeh A, Zahradka P, Taylor CG. Trans-10,cis-12 conjugated linoleic acid (t10-c12 CLA) treatment and caloric restriction differentially affect adipocyte cell turnover in obese and lean mice. J Nutr Biochem. 2017;49:123–32. [DOI] [PubMed] [Google Scholar]
- [45].Evans M, Lin X, Odle J, McIntosh M. Trans-10, cis-12 conjugated linoleic acid increases fatty acid oxidation in 3T3-L1 preadipocytes. J Nutr. 2002;132:450–5. [DOI] [PubMed] [Google Scholar]
- [46].Rui L Energy metabolism in the liver. Compr Physiol. 2014;4:177–97. [DOI] [PMC free article] [PubMed] [Google Scholar]
- [47].Basu S, Smedman A, Vessby B. Conjugated linoleic acid induces lipid peroxidation in humans. FEBS Lett. 2000;468:33–6. [DOI] [PubMed] [Google Scholar]
- [48].Eder K, Slomma N, Becker K. Trans-10,cis-12 conjugated linoleic acid suppresses the desaturation of linoleic and alpha-linolenic acids in HepG2 cells. J Nutr. 2002;132:1115–21. [DOI] [PubMed] [Google Scholar]
- [49].Lin X, Bo J, Oliver SA, Corl BA, Jacobi SK, Oliver WT, et al. Dietary conjugated linoleic acid alters long chain polyunsaturated fatty acid metabolism in brain and liver of neonatal pigs. J Nutr Biochem. 2011;22:1047–54. [DOI] [PubMed] [Google Scholar]
- [50].Dentin R, Benhamed F, Pegorier JP, Foufelle F, Viollet B, Vaulont S, et al. Polyunsaturated fatty acids suppress glycolytic and lipogenic genes through the inhibition of ChREBP nuclear protein translocation. J Clin Invest. 2005;115:2843–54. [DOI] [PMC free article] [PubMed] [Google Scholar]
- [51].Haeusler RA, Hartil K, Vaitheesvaran B, Arrieta-Cruz I, Knight CM, Cook JR, et al. Integrated control of hepatic lipogenesis versus glucose production requires FoxO transcription factors. Nat Commun. 2014;5:5190. [DOI] [PMC free article] [PubMed] [Google Scholar]
- [52].Choi Y, Park Y, Pariza MW, Ntambi JM. Regulation of stearoyl-CoA desaturase activity by the trans-10,cis-12 isomer of conjugated linoleic acid in HepG2 cells. Biochem Biophys Res Commun. 2001;284:689–93. [DOI] [PubMed] [Google Scholar]
- [53].Lee KN, Pariza MW, Ntambi JM. Conjugated linoleic acid decreases hepatic stearoyl-CoA desaturase mRNA expression. Biochem Biophys Res Commun. 1998;248:817–21. [DOI] [PubMed] [Google Scholar]
- [54].Subbaiah PV, Gould IG, Lal S, Aizezi B. Incorporation profiles of conjugated linoleic acid isomers in cell membranes and their positional distribution in phospholipids. Biochim Biophys Acta. 2011;1811:17–24. [DOI] [PMC free article] [PubMed] [Google Scholar]
- [55].Go GW, Oh S, Park M, Gang G, McLean D, Yang HS, et al. t10,c12 conjugated linoleic acid upregulates hepatic de novo lipogenesis and triglyceride synthesis via mTOR pathway activation. J Microbiol Biotechnol. 2013;23:1569–76. [DOI] [PubMed] [Google Scholar]
- [56].Samuel VT, Shulman GI. The pathogenesis of insulin resistance: integrating signaling pathways and substrate flux. J Clin Invest. 2016;126:12–22. [DOI] [PMC free article] [PubMed] [Google Scholar]
- [57].Baraldi FG, Vicentini TM, Teodoro BG, Dalalio FM, Dechandt CR, Prado IM, et al. The combination of conjugated linoleic acid (CLA) and extra virgin olive oil increases mitochondrial and body metabolism and prevents CLA-associated insulin resistance and liver hypertrophy in C57Bl/6 mice. J Nutr Biochem. 2016;28:147–54. [DOI] [PubMed] [Google Scholar]
Associated Data
This section collects any data citations, data availability statements, or supplementary materials included in this article.


