

ABSTRACT
Studies regarding macroautophagic/autophagic regulation in endothelial cells (ECs) under diabetic conditions are very limited. Clinical evidence establishes an endothelial protective effect of metformin, but the underlying mechanisms remain unclear. We aimed to investigate whether metformin exerts its protective role against hyperglycemia-induced endothelial impairment through the autophagy machinery. db/db mice were treated with intravitreal metformin injections. Human umbilical vein endothelial cells (HUVECs) were cultured either in normal glucose (NG, 5.5 mM) or high glucose (HG, 33 mM) medium in the presence or absence of metformin for 72 h. We observed an obvious inhibition of hyperglycemia-triggered autophagosome synthesis in both the diabetic retinal vasculature and cultured HUVECs by metformin, along with restoration of hyperglycemia-impaired Hedgehog (Hh) pathway activity. Specifically, deletion of ATG7 in retinal vascular ECs of db/db mice and cultured HUVECs indicated a detrimental role of autophagy in hyperglycemia-induced endothelial dysfunction. Pretreatment with GANT61, a Hh pathway inhibitor, abolished the metformin-mediated downregulation of autophagy and endothelial protective action. Furthermore, GLI-family (transcription factors of the Hh pathway) knockdown in HUVECs and retinal vasculature revealed that downregulation of hyperglycemia-activated autophagy by the metformin-mediated Hh pathway activation was GLI1 dependent. Mechanistically, GLI1 knockdown-triggered autophagy was related to upregulation of BNIP3, which subsequently disrupted the association of BECN1/Beclin 1 and BCL2. The role of BNIP3 in BECN1 dissociation from BCL2 was further confirmed by BNIP3 overexpression or BNIP3 RNAi. Taken together, the endothelial protective effect of metformin under hyperglycemia conditions could be partly attributed to its role in downregulating autophagy via Hh pathway activation.
Abbreviations: 3-MA = 3-methyladenine; 8×GLI BS-FL = 8×GLI-binding site firefly luciferase; AAV = adeno-associated virus; AAV-Cdh5-sh-Atg7 = AAV vectors carrying shRNA against murine Atg7 under control of murine Cdh5 promoter; AAV-Cdh5-sh-Gli1 = AAV vectors carrying shRNA against murine Gli1 under control of murine Cdh5 promoter; AAV-Cdh5-Gli1 = AAV vectors carrying murine Gli1 cDNA under the control of murine Cdh5 core promoter; ACAC = acetyl-CoA carboxylase; Ad-BNIP3 = adenoviruses harboring human BNIP3`; Ad-GLI1 = adenoviruses harboring human GLI1; Ad-sh-ATG7 = adenoviruses harboring shRNA against human ATG7; Ad-sh-BNIP3 = adenoviruses harboring shRNA against human BNIP3; Ad-sh-GLI = adenoviruses harboring shRNA against human GLI; AGEs = advanced glycation end products; ATG = autophagy-related; atg7flox/flox mice = mice bearing an Atg7flox allele, in which exon 14 of the Atg7 gene is flanked by 2 loxP sites; BafA1 = bafilomycin A1; BECN1 = beclin 1; CDH5/VE-cadherin = cadherin 5; CASP3 = caspase 3; CASP8 = caspase 8; CASP9 = caspase 9; ECs = endothelial cells; GAPDH = glyceraldehyde-3-phosphate dehydrogenase; GCL = ganglion cell layer; GFP-LC3B = green fluorescent protein labelled LC3B; HG = high glucose; Hh = Hedgehog; HHIP = hedgehog interacting protein; HUVECs = human umbilical vein endothelial cells; IB4 = isolectin B4; INL = inner nuclear layer; i.p. = intraperitoneal; MAP1LC3/LC3 = microtubule-associated protein 1 light chain 3; MAN = mannitol; MET = metformin; NG = normal glucose; ONL = outer nuclear layer; p-ACAC = phosphorylated acetyl-CoA carboxylase; PECAM1/CD31= platelet/endothelial cell adhesion molecule 1; PRKAA1/2 = protein kinase AMP-activated catalytic subunits alpha 1/2; p-PRKAA1/2 = phosphorylated PRKAA1/2; PTCH1 = patched 1; RAPA = rapamycin; RL = Renilla luciferase; SHH = sonic hedgehog; shRNA = short hairpin RNA; sh-PRKAA1/2 = short hairpin RNA against human PRKAA1/2; scrambled shRNA = the scrambled short hairpin RNA serves as a negative control for the target-specific short hairpin RNA, which has the same nucleotide composition as the input sequence and has no match with any mRNA of the selected organism database; SMO = smoothened, frizzled class receptor; sqRT-PCR = semi-quantitative RT-PCR; TEK/Tie2 = TEK receptor tyrosine kinase; Tek-Cre (+) mice = a mouse strain expressing Cre recombinase under the control of the promoter/enhancer of Tek, in a pan-endothelial fashion; TUNEL = terminal deoxynucleotidyl transferase dUTP-mediated nick-end labeling
KEYWORDS: Angiogenesis, BNIP3, diabetes mellitus, endothelial dysfunction, GLI1, LC3
Introduction
Diabetes mellitus is a common metabolic disorder, with the current prevalence of over 400 million worldwide and the number of diabetics is expected to increase exceeding 50% by 2030 [1,2]. Vascular complications in diabetes are considered as major causes for shortened life expectancy and high mortality rate [3]. Moreover, endothelial dysfunction, which causes defective endothelial repair and inability of angiogenesis, is also recognized as an important causative factor in the pathogenesis of diabetes-associated cardiovascular diseases [4].
Metformin is a commonly used oral hypoglycemic agent, which can exert hypoglycemic effect by decreasing hepatic gluconeogenesis, as a result from the activation of AMPK and facilitation of AMPK-mediated translocation of SLC2A4/glucose transporter type 4 [5,6]. Conversely, metformin modulates endothelial function and prevents hyperglycemia-caused vascular abnormalities [7], and this beneficial action is likely to be independent of its efficacy on blood glucose control. However, little information exists regarding the mechanism underlying the protective effect of metformin on ECs under diabetic conditions.
Recently, there has been a growing interest in the role of autophagy in modulating diverse physiological processes. Basically, autophagy is a catabolic process in which a cell digests its own components via the lysosomal machinery, performing survival-oriented functions under both basal conditions and conditions of stress (e.g. starvation) [8]. However, this regulatory machinery is implicated in not only normal cell function, but also the onset of autophagic cell death resulting in the pathogenesis of various kinds of diseases involving aging, cancer, and diabetes [9]. Also, the role of autophagy in modulating endothelial function under diabetic conditions appears to be complicated. For example, autophagy protects against senescence in HG-induced endothelial cells [10]; while HG-induced autophagy damages endothelial progenitor cells, aggravates mitochondrial oxidative stress and prevents neovascularization [11]. Besides, the formation of advanced glycation end products (AGEs) triggers autophagy during the diabetic period, which is related to atherosclerosis in diabetes [12].
It is noteworthy that several angiogenesis inhibitors involved in antiangiogenesis therapy trigger autophagy machinery [13,14], providing a link between autophagy initiation and angiogenesis inhibition [15]. Consistently, suppression of autophagy obviously facilitates angiogenesis [16]. In Becn1 hemizygous mice, a highly proangiogenic phenotype in response to hypoxia is achieved [17]. In the present study, we observed that autophagy was activated in both the retinal vascular endothelium of diabetic db/db mice and HUVECs cultured in HG conditions, but was dramatically downregulated by metformin. And subsequently, the metformin-mediated downregulation of HG-triggered autophagy was demonstrated to play a central role in metformin-exerted endothelial protective action against HG impairment.
Here we describe that metformin downregulates HG-triggered autophagy through activating the Hh signaling pathway in a GLI1-dependent manner. Therefore, a novel role of metformin in alleviating hyperglycemia-induced endothelial dysfunction via modulating autophagy is identified.
Results
Metformin attenuates hyperglycemia-induced endothelial dysfunction both in vivo and in vitro
To demonstrate the protective effect of metformin against hyperglycemia-induced endothelial impairment in vivo, immunofluorescence staining for PECAM1/CD31 (platelet/endothelial cell adhesion molecule 1) revealed the presence of de-endothelialized region in aortic endothelium of db/db mice compared with its corresponding non-diabetic, heterozygous control littermates, db/m. Systemic treatment with metformin (300 mg/kg/d) significantly attenuated hyperglycemia-induced de-endothelialization compared with the vehicle-treated group in diabetic db/db mice (Figure 1(a,b)). Retinal vascular leakage is a representative symptom of diabetic microvascular dysfunctions and a leading cause of diabetic retinopathy [18]. Thus we analyzed the effect of intraperitoneal metformin injection on hyperglycemia-induced vascular leakage in the diabetic retina. Retinal vascular leakage was dramatically increased in db/db mice compared with db/m mice, metformin largely decreased the extent of vascular leakage compared with the vehicle-treated group in diabetic db/db mice (Figure 1(c,d)).
Figure 1.
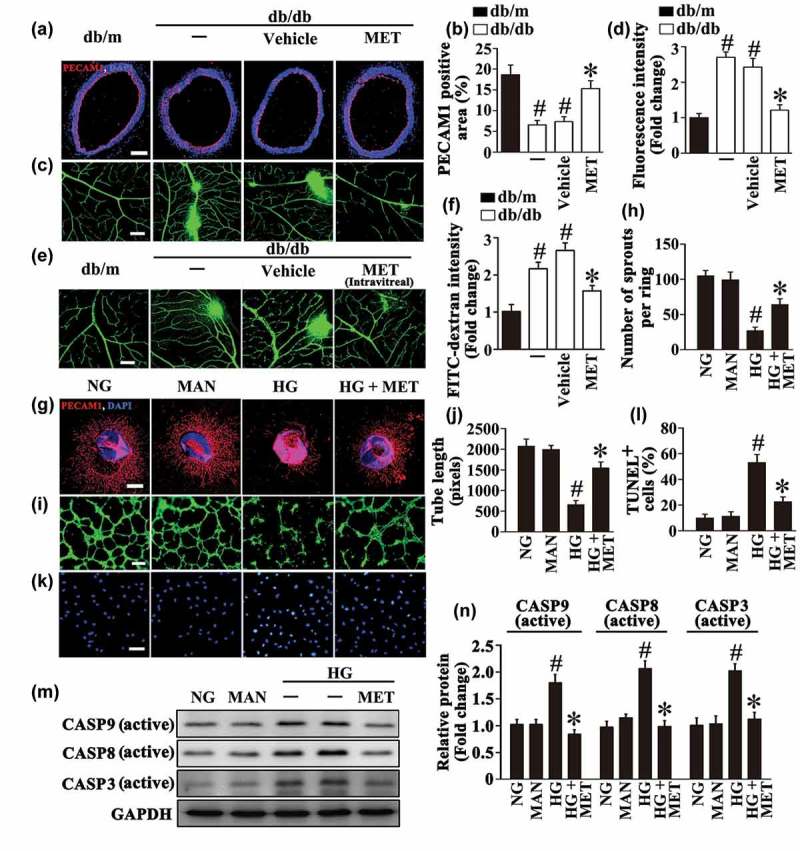
Metformin attenuates hyperglycemia-induced endothelial dysfunction both in vivo and in vitro. (a) Representative immunofluorescence with PECAM1 from db/m mice, db/db mice, and intraperitoneal metformin (MET)-treated (300 mg/kg/d) db/db mouse aorta tissue sections. The red area represented endothelium and the nucleus was blue. Scale bars: 200 μm. (b) Quantification of the PECAM1-positive area in (a), values displayed are means ± SEM of 8 independent experiments. # P < 0.05 vs. db/m mice; * P < 0.05 vs. db/db mice or vehicle-treated db/db mice. (c) Representative confocal images of vascular leakage in retinas from db/m mice, db/db mice, and intraperitoneal MET-treated db/db mice. Scale bars: 200 μm. (d) Retinal leakage was quantified by measuring the fluorescence intensities of FITC-dextran in (c). Images were taken in 6 random microscopy fields per sample and values displayed are means ± SEM of 8 independent experiments. Data are expressed as fold change relative to db/m mice. # P < 0.05 vs. db/m mice; * P < 0.05 vs. db/db mice or vehicle-treated db/db mice. (e) Representative confocal images of vascular leakage in retinas from db/m mice, db/db mice, and intravitreal MET-treated (0.5 nmol in 1 μL) db/db mice. Scale bars: 200 μm. (f) Retinal leakage was quantified by measuring the fluorescence intensities of FITC-dextran in (e). Images were taken in 6 random microscopy fields per sample and values displayed are means ± SEM of 8 independent experiments. Data are expressed as fold change relative to db/m mice. # P < 0.05 vs. db/m mice; * P < 0.05 vs. db/db mice or vehicle-treated db/db mice. (g) Representative confocal images of aortic rings from C57BL/6 mice cultured in different media containing normal glucose (NG; 5.5 mM), high glucose (HG; 33 mM) alone or with MET (50 μM) for 72 h, mannitol (MAN; 33 mM: 5.5 mM of glucose + 27.5 mM of D-mannitol) was used as the osmotic control for HG. Scale bars: 500 μm. (h) Quantification of the number of sprouts in (g), values displayed are means ± SEM of 10 independent experiments. # P < 0.05 vs. NG or MAN; * P < 0.05 vs. HG. (i) Capillary-like tube formation was assessed by matrigel angiogenesis assay in HUVECs. HUVECs were cultured either in NG or HG medium in the presence or absence of MET (50 μM) for 72 h, MAN was used as the osmotic control for HG. Scale bars: 300 μm. (j) Quantification of the tube length in (i), images of tube morphology were taken in 6 random microscopy fields per sample and values displayed are means ± SEM of 8 independent experiments. # P < 0.05 vs. NG or MAN; * P < 0.05 vs. HG. (k) Terminal deoxynucleotidyl transferase dUTP-mediated nick-end labeling (TUNEL) assay of HUVECs treated as indicated in (i). The apoptotic cells were labelled with green, and nuclei were stained with DAPI (blue). Scale bars: 100 μm. (l) The quantitative analysis of TUNEL+ cells in at least 6 separate fields, values displayed are means ± SEM of 6 independent experiments. # P < 0.05 vs. NG or MAN; * P < 0.05 vs. HG. (m) Cell lysates of HUVECs were used to detect the active CASP8, active CASP9 as well as active CASP3 protein levels by immunoblotting. (n) The quantitative analysis of each immunoblot relative to GAPDH protein level in (m). Data are expressed as fold change relative to HUVECs exposed to NG, values displayed are means ± SEM of 6 independent experiments. # P < 0.05 vs. NG or MAN; * P < 0.05 vs. HG.
In order to establish whether the effects of metformin observed in in vivo studies involved a direct action on ECs, metformin was directly delivered to retina through intravitreal injections. Comparing with a four-wk course of metformin intraperitoneal treatment, a relative short period of intravitreal treatment (8 d) could also significantly ameliorate retinal vascular leakage (Figure 1(e,f)). To further determine the endothelial function, an ex vivo model, the aortic ring assay [19] was utilized. The aortic rings from C57BL/6 mice were cultured in different media containing NG (5.5 mM), HG (33 mM) alone or with metformin. In aortic rings cultured in NG medium, we observed a well-structured microvessel network with clearly defined tubules and regular branching. In contrast, the rings cultured in HG medium showed a dramatically impaired sprouting function when compared with rings cultured in normal medium or in osmotic control group, while the sprouting function was well-preserved by metformin administration (Figure 1(g,h)).
In parallel, the tube-forming activity was also significantly impaired in HUVECs exposed to HG as compared with HUVECs maintained in NG, but greatly enhanced by metformin cotreatment (Figure 1(i,j)). Furthermore, HG induced high levels of apoptosis in HUVECs, as demonstrated by the increase in the proportion of Terminal deoxynucleotidyl transferase dUTP-mediated nick-end labeling (TUNEL)-positive cells and elevated protein levels of active CASP8 (caspase 8), active CASP9 (caspase 9) as well as active CASP3 (caspase 3). However, HG-induced apoptosis was significantly alleviated by metformin coincubation (Figure 1(k–n)). Overall, a direct protective role of metformin against HG-induced endothelial impairment is confirmed.
Next, we sought to explore whether metformin could also function as a proangiogenic factor under basal conditions. Systemic treatment with metformin exerted no influence both on the aortic endothelialization and retinal vascular leakage in db/m mice (Fig. S1A to D). A direct intravitreal treatment of metformin also had little effect on retinal vascular leakage (Fig. S1E, F). Nevertheless, unlike its protective role under HG conditions, we found that metformin treatment impaired the aortic rings sprouting function and the tube-forming activity of cultured HUVECs without inducing cellular apoptosis under NG conditions (Fig. S1G to N). The antiangiogenic effect of metformin in basal conditions coincides with its anticancer role as reported previously [20]. Metformin is reported to be an effective activator of AMPK [21], and we confirmed that the dose of metformin we used was sufficient to activate AMPK in HUVECs under basal conditions (Fig. S2A). When AMPK signaling was attenuated by transfecting HUVECs with the short hairpin RNA against human PRKAA1/AMPKα1-PRKAA2/AMPKα2 mRNA (sh-PRKAA1/2), the antiangiogenic effect of metformin was alleviated as demonstrated by the recovery of tube-forming activity (Fig. S2C, D), suggesting that the antiangiogenic effect of metformin in basal conditions is at least in part mediated by activation of the AMPK pathway.
Metformin restores hyperglycemia-reduced Hh pathway activity, and the endothelial protective action of metformin against hyperglycemia is Hh-dependent
Lines of evidence support an important role for Hh in homeostatic and repair processes, such as angiogenesis and tissue regeneration among diabetic individuals [22,23]. Consistent with the phenomena observed in diabetic nerve and skin [24,25], our results confirmed an impaired Hh pathway activity in both the retina from diabetic db/db mice and HUVECs exposed to HG, as reflected by decreased expression of GLI1 in the retinal vasculature (Figure 2(a,b)) and lower levels of canonical Hh signaling pathway components, including the signaling molecules PTCH1 (patched 1), SMO (smoothened, frizzled class receptor), and GLI1 at both the protein and mRNA levels (Figures 2(d,e) and S3A, B). Importantly, metformin largely increased hyperglycemia-impaired Hh pathway activity both in vivo and in vitro, as revealed by elevated GLI1 expression level in the retinal vasculature from metformin-treated diabetic db/db mice (Figure 2(a,b)) and higher levels of Hh signaling pathway components in HUVECs exposed to HG in combination with metformin (Figures 2(d,e) and S3A, B).
Figure 2.
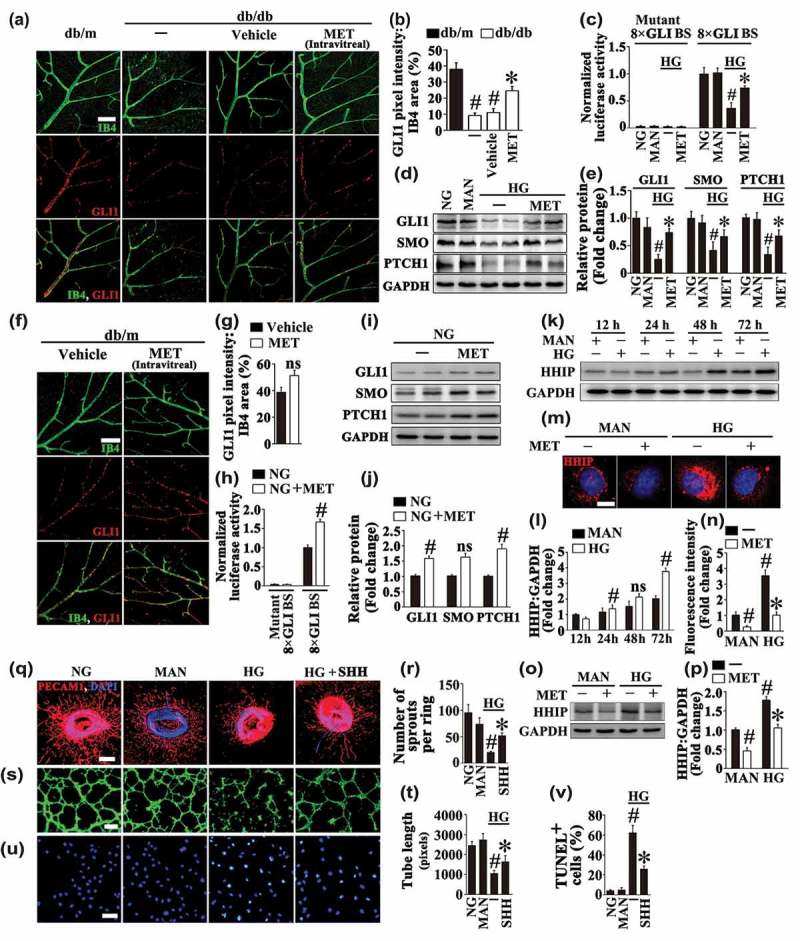
Metformin restores hyperglycemia-reduced Hh pathway activity, and the loss of Hh signaling partly accounts for HG-impaired endothelial function. (a) Representative images of GLI1 (red) staining in retinal vessels from db/m mice, db/db mice, and intravitreal MET-treated (0.5 nmol in 1 μL) db/db mice. Retinal vasculature was labelled with isolectin B4 (IB4, green). Scale bars: 100 μm. (b) Quantification represents the ratio between the sum of GLI1 pixel intensity and IB4 area. Images were taken in 6 random microscopy fields per sample and values displayed are means ± SEM of 8 independent experiments. # P < 0.05 vs. db/m mice; * P < 0.05 vs. db/db mice or vehicle-treated db/db mice. (c) GLI-luciferase reporter activity assay. HUVECs were cotransfected with vectors encoding 8× GLI-binding site firefly luciferase (8× GLI BS-FL) or mutant 8× GLI BS-FL, Renilla luciferase reporter (pRL-TK) as a control. After transfection, HUVECs were cultured either in NG or HG medium in the presence or absence of MET (50 μM) for 72 h, MAN was used as the osmotic control for the HG. The firefly luciferaseL:Renilla luciferase ratio in cell lysates was calculated for each sample and was normalized to the ratio measured in HUVECs cultured in NG. Values displayed are means ± SEM of 6 independent experiments. # P < 0.05 vs. NG or MAN; * P < 0.05 vs. HG. (d) Immunoblotting analysis of Hh signaling pathway components, PTCH1, SMO, and GLI1 in HUVECs. HUVECs were treated as indicated in (c). (e) The quantitative analysis of each immunoblot relative to GAPDH protein level in (d). Data are expressed as fold change relative to NG, values displayed are means ± SEM of 6 independent experiments. # P < 0.05 vs. NG or MAN; * P < 0.05 vs. HG. (f) Representative images of GLI1 (red) staining in retinal vessels from intravitreal MET (0.5 nmol in 1 μL) or vehicle-treated db/m mice. Retinal vasculature was labelled with IB4 (green). Scale bars: 100 μm. (g) Quantification represents the ratio between the sum of GLI1 pixel intensity and IB4 area. Images were taken in 6 random microscopy fields per sample and values displayed are means ± SEM of 8 independent experiments. ns, non-significant compared with vehicle-treated db/m mice. (h) GLI-luciferase reporter activity assay. HUVECs were cotransfected with vectors encoding 8× GLI-binding site firefly luciferase (8× GLI BS-FL) or mutant 8× GLI BS-FL, Renilla luciferase reporter (pRL-TK) as a control. After transfection, HUVECs were cultured in NG medium in the presence or absence of MET (50 μM) for 72 h. The firefly luciferaseL:Renilla luciferase ratio in cell lysates was calculated for each sample and was normalized to the ratio measured in HUVECs cultured in NG alone. Values displayed are means ± SEM of 6 independent experiments. # P < 0.05 vs. NG. (I) Immunoblotting analysis of Hh signaling pathway components, PTCH1, SMO, and GLI1 in HUVECs. HUVECs were treated as indicated in (h). (j) The quantitative analysis of each immunoblot relative to GAPDH protein level in (i). Data are expressed as fold change relative to NG, values displayed are means ± SEM of 6 independent experiments. # P < 0.05 vs. NG; ns, non-significant. (k) Immunoblotting analysis of HHIP in HUVECs. HUVECs were cultured in HG medium for 12 h, 24 h, 48 h and 72 h, respectively. MAN was used as the osmotic control for HG. (l) The quantitative analysis of HHIP protein level relative to GAPDH protein level in (k). Data are expressed as fold change relative to HUVECs cultured in MAN for 12h, values displayed are means ± SEM of 6 independent experiments. # P < 0.05 vs. corresponding MAN; ns, non-significant. (m) Representative immunofluorescence images of HUVECs stained with HHIP. HUVECs were cultured either in MAN or HG medium in the presence or absence of MET (50 μM) for 72 h. Scale bars: 5 μm. (n) The quantitative analysis of the fluorescence intensity in (m). Data are expressed as fold change relative to HUVECs cultured in MAN, values displayed are means ± SEM of 8 independent experiments. # P < 0.05 vs. MAN; * P < 0.05 vs. HG. (o) Immunoblotting analysis of HHIP in HUVECs. HUVECs were treated as in (m). (p) The quantitative analysis of HHIP protein level relative to GAPDH protein level in (o). Data are expressed as fold change relative to HUVECs cultured in MAN, values displayed are means ± SEM of 6 independent experiments. # P < 0.05 vs. MAN; * P < 0.05 vs. HG. (q) Representative confocal images of aortic rings from C57BL/6 mice cultured in different media containing NG, HG alone or with SHH (10 μg mL−1) for 72 h, MAN was used as the osmotic control for HG. Scale bars: 500 μm. (r) Quantification of the number of sprouts in (q), values displayed are means ± SEM of 10 independent experiments. # P < 0.05 vs. NG or MAN; * P < 0.05 vs. HG. (s) Capillary-like tube formation was assessed by matrigel angiogenesis assay in HUVECs. HUVECs were cultured either in NG or HG medium in the presence or absence of SHH (10 μg mL−1) for 72 h, MAN was used as the osmotic control for HG. Scale bars: 300 μm. (t) Quantification of the tube length in (s), images of tube morphology were taken in 6 random microscopy fields per sample and values displayed are means ± SEM of 8 independent experiments. # P < 0.05 vs. NG or MAN; * P < 0.05 vs. HG. (u) TUNEL assay of HUVECs treated as indicated in (s). The apoptotic cells were labelled with green, and nuclei were stained with DAPI (blue). Scale bars: 100 μm. (v) The quantitative analysis of TUNEL+ cells in at least 6 separate fields, values displayed are means ± SEM of 6 independent experiments. # P < 0.05 vs. NG or MAN; * P < 0.05 vs. HG.
The effect of metformin on hyperglycemia-reduced Hh pathway activity was further verified by luciferase assay. HUVECs were cotransfected with plasmids encoding a 8× GLI-binding site firefly luciferase (8× GLI BS-FL) or mutant 8× GLI BS-FL. Luciferase production was dramatically decreased in cells exposed to HG compared to cells maintained in NG or in osmotic control group. Likewise, the luciferase activity was elevated in cells cultured in HG together with metformin compared with HG alone (Figure 2(c)), indicative of Hh pathway activity restoration by metformin treatment.
Interestingly, metformin could also activate the Hh pathway under basal conditions. The intravitreal treatment with metformin slightly increased GLI1 protein level in the retinal vasculature of db/m mice, but without significant difference (Figure 2(f,g)). In NG cultured HUVECs, the luciferase production was elevated by metformin treatment (Figure 2(h)), along with increased levels of canonical Hh signaling pathway components, PTCH1, SMO and GLI1 at both the protein and mRNA levels (Figures 2(i,j) and S3C, D).
We next explored how HG and metformin could act on the Hh pathway. HHIP (hedgehog interacting protein), was originally found via screening a cDNA library when seeking for proteins that interact with the SHH (sonic hedgehog) protein. As a putative antagonist of the Hh pathway, HHIP exerts its role through binding to proteins from the mammalian hedgehog family, thus attenuating their bioavailability [26]. We demonstrated that HG could persistently induce HHIP expression in HUVECs in a time-dependent manner (Figure 2(k,l)). The immunoblotting and immunofluorescence staining further confirmed a significant increase in the protein level of HHIP after a period of 72 h-HG treatment in HUVECs, whereas metformin treatment inhibited HHIP expression under both basal and HG conditions (Figure 2(m–p)). These results provide evidence that the inhibition of the Hh pathway imposed by HG might be ascribed to the upregulation of HHIP, and metformin restores Hh signaling probably through its inhibitive effect on HHIP expression.
For further ascertaining the role of HG inhibition of the Hh pathway in endothelial function, we assessed whether an upregulation of Hh pathway activity is sufficient to rescue HG-induced endothelial impairment. To obtain this, HG-exposed HUVECs were coincubated with recombinant SHH, a direct Hh signaling pathway ligand (Fig. S4). Similar to the results obtained with metformin treatment, coincubation with SHH largely ameliorated HG-impaired vascular sprouting function and tube-forming activity (Figure 2(q–t)), the HG-induced apoptosis was alleviated as well (Figure 2(u,v)). Together, we demonstrate that the loss of Hh signaling might partly account for HG-impaired endothelial function.
Meanwhile, exposure to HG resulted in inhibition of AMPK signaling pathway in HUVECs as well. Metformin also upregulated the HG-reduced AMPK pathway activity, demonstrated by elevated expression of phosphorylated (p-) PRKAA1/2 and p-ACAC (phosphorylated acetyl-CoA carboxylase) (Figure 3(a,b)). To clarify which pathway plays a dominant role in the endothelial protective effect of metformin, each pathway was blocked by treatment with GANT61 (inhibitor of GLI1 and GLI2) or compound C (inhibitor of AMPK), respectively (Figure 3(c)). Inhibition of the Hh pathway by GANT61 largely counteracted the metformin-modulated endothelial protective effect, which exhibited dramatically damaged tube-forming activity, alone with a decreased vascular sprouting function (Figure 3(d–g)). By contrast, the influence on the endothelial protective effect of metformin resulted from inhibition of AMPK by compound C was negligible (Figure 3(d–g)). Interestingly, either pretreatment with GANT61 or compound C abrogated the antiapoptotic effect of metformin on HG-induced endothelial apoptosis (Figure 3(h,i)).
Figure 3.
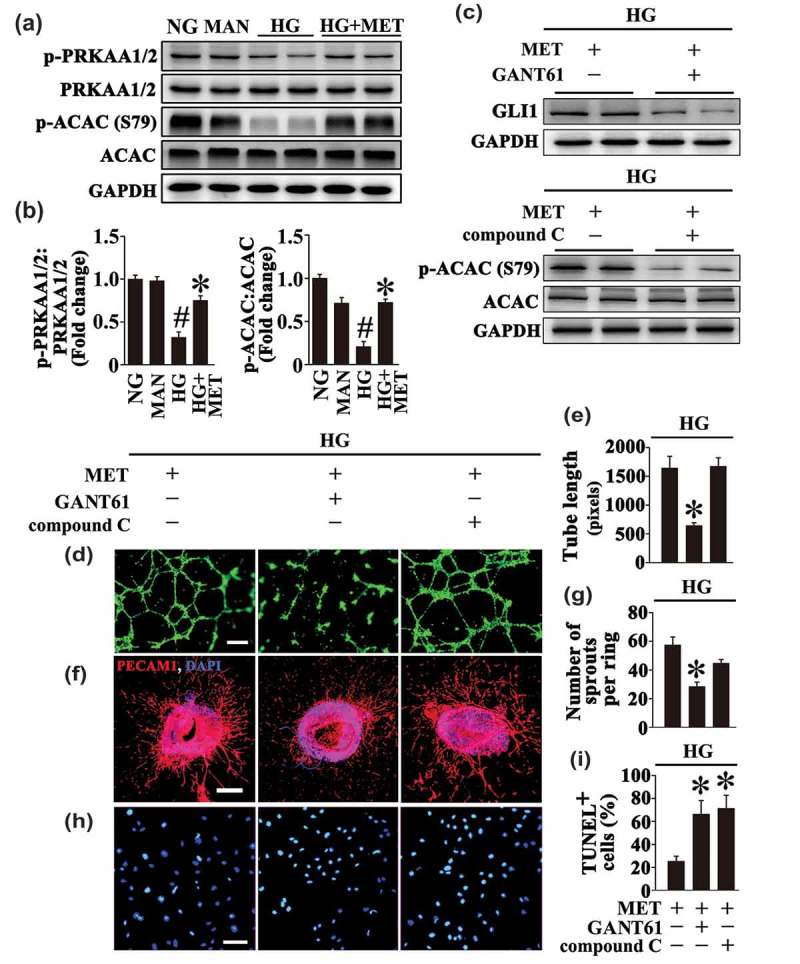
The metformin-mediated endothelial protective action against HG is Hh dependent. (a) Cell lysates of HUVECs were used to detect the phospho- (p-) PRKAA1/2:total PRKAA1/2 ratio and p-ACAC:total ACAC ratio by immunoblotting. HUVECs were cultured either in NG or HG medium in the presence or absence of MET (50 μM) for 72 h, MAN was used as the osmotic control for HG. (b) The quantitative analysis of p-PRKAA1/2 and p-ACAC relative to corresponding total proteins in (a). Data are expressed as fold change relative to NG, values displayed are means ± SEM of 6 independent experiments. # P < 0.05 vs. NG or MAN; * P < 0.05 vs. HG. (c) Immunoblotting analysis of GLI1 and p-ACAC:total ACAC ratio. HUVECs were maintained in HG in the presence of MET (50 μM) for 72 h. For signaling pathway analysis, compound C (10 μM) or GANT61 (20 μM) were given as pretreatments for 2 h every day before MET administration. (d) Capillary-like tube formation was assessed by matrigel angiogenesis assay in HUVECs. HUVECs were treated as in (c). Scale bars: 300 μm. (e) Quantification of the tube length in (d), images of tube morphology were taken in 6 random microscopy fields per sample and values displayed are means ± SEM of 8 independent experiments. * P < 0.05 vs. HUVECs exposed to HG in combination with MET. (f) Representative confocal images of aortic rings from C57BL/6 mice. The rings were cultured in HG in combination of MET (50 μM). For signaling pathway analysis, Compound C (10 μM) or GANT61 (20 μM) were given as pretreatments for 2 h every day before MET administration. Scale bars: 500 μm. (g) Quantification of the number of sprouts in (f), values displayed are means ± SEM of 10 independent experiments. * P < 0.05 vs. rings exposed to HG in combination with MET. (h) TUNEL assay of HUVECs. HUVECs were treated as indicated in (c), the apoptotic cells were labelled with green, and nuclei were stained with DAPI (blue). Scale bars: 100 μm. (i) The quantitative analysis of TUNEL+ cells in at least 6 separate fields, values displayed are means ± SEM of 6 independent experiments. * P < 0.05 vs. HUVECs exposed to HG in combination with MET.
These results suggest that the endothelial protective action of metformin against HG might be mainly attributed to its role in activating the Hh pathway.
The metformin-mediated suppression of autophagy is protective in hyperglycemia-induced endothelial injury
There is a growing body of literature suggesting that autophagy may be a central mechanism through which risk factors elicit endothelial dysfunction [11,12]. During autophagy, MAP1LC3/LC3 (microtubule-associated protein 1 light chain 3), a mammalian ortholog of yeast Atg8, is modified to generate its active isoform, which translocates from the cytoplasm to phagophores, precursors to autophagosomes [27]. In the present study, we found obvious accumulation of LC3 puncta colocalized with retinal vascular endothelium (labeled with isolectin B4, an EC marker) in diabetic db/db mice as compared with its corresponding control littermates, db/m. However, metformin-treated db/db mice manifested significantly fewer LC3 puncta when compared with the vehicle-treated group (Figure 4(a,b)). Decreased LC3 levels could be associated with either reduced formation or enhanced clearance of autophagosome. Because bafilomycin A1 (BafA1) functions to block autophagosome-lysosome fusion, its use allows the examination of these 2 possibilities [28]. As metformin could decrease the number of LC3 puncta in the presence of BafA1 (Figure 4(a,b)), we can draw a conclusion that the metformin-mediated downregulation of HG-triggered autophagy is due to its role in affecting autophagosome synthesis rather than autophagosome degradation.
Figure 4.
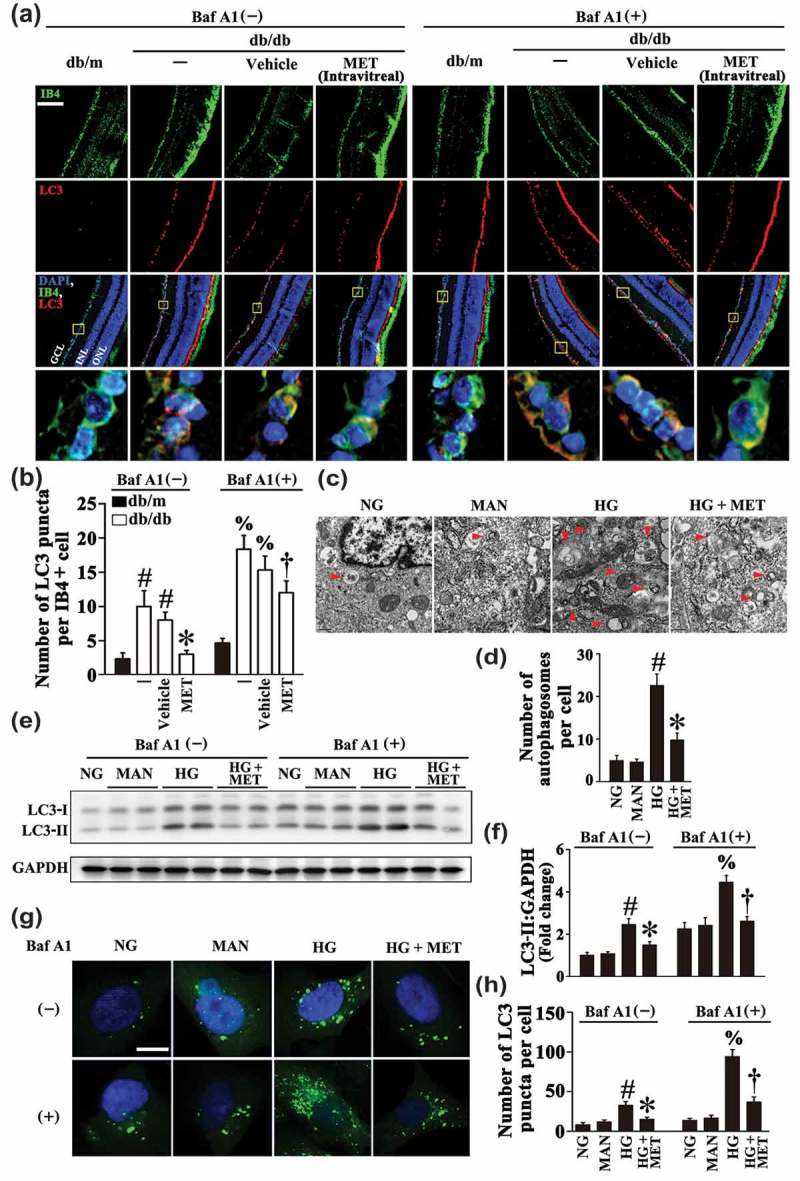
Metformin downregulates hyperglycemia-activated autophagy. (a) Representative immunofluorescence analysis of LC3 (red puncta) in the retinas from db/m mice, db/db mice, and intravitreal MET-treated (0.5 nmol in 1 μL) db/db mice. Where indicated, mice were intraperitoneally treated with bafilomycin A1 (BafA1, 0.3 mg/kg). The IB4 staining (green) highlights retinal vasculature, and nuclei were stained with DAPI (blue). GCL, ganglion cell layer; INL, inner nuclear layer; ONL, outer nuclear layer. Scale bars: 100 μm. (b) Quantification represents the average number of LC3 puncta per IB4+ cell. Images were taken in 6 random microscopy fields per sample and values displayed are means ± SEM of 8 independent experiments. # P < 0.05 vs. db/m mice; * P < 0.05 vs. db/db mice or vehicle-treated db/db mice; % P < 0.05 vs. db/m mice in the presence of BafA1; and † P < 0.05 vs. db/db mice or vehicle-treated db/db mice in the presence of BafA1. (c) Representative electron micrographs from HUVECs cultured in vitro demonstrate the presence of double-membrane autophagosomes (arrows). HUVECs were cultured either in NG or HG medium in the presence or absence of MET (50 μM) for 72 h, MAN was used as the osmotic control for HG. Scale bars: 0.5 μm. (d) Quantification of the autophagosomes per cell in HUVECs treated as in (c). Values displayed are means ± SEM of 6 independent experiments. # P < 0.05 vs. NG or MAN; * P < 0.05 vs. HG. (e) Cell lysates of HUVECs treated as indicated in (c) were used to detect the LC3-II protein levels by immunoblotting. Where indicated, BafA1 (400 nM) was added for the last 4 h. (f) The quantitative analysis of LC3-II protein level relative to GAPDH protein level in (e). Data are expressed as fold change relative to NG, values displayed are means ± SEM of 6 independent experiments. # P < 0.05 vs. NG or MAN; * P < 0.05 vs. HG; % P < 0.05 vs. NG or MAN in the presence of BafA1; and † P < 0.05 vs. HG in the presence of BafA1. (g) Representative confocal images of HUVECs transduced with Ad-GFP-LC3B. HUVECs were treated as indicated in (c). Where indicated, BafA1 (400 nM) was added for the last 4 h. Scale bars: 5 μm. (h) Quantification of the GFP puncta per cell in HUVECs treated as in (g). Values displayed are means ± SEM of 10 independent experiments. # P < 0.05 vs. NG or MAN; * P < 0.05 vs. HG; % P < 0.05 vs. NG or MAN in the presence of BafA1; and † P < 0.05 vs. HG in the presence of BafA1.
To further confirm these data, we assessed autophagic activity in cultured HUVECs. Electron micrographs revealed a markedly high presence of autophagosomes in HUVECs exposed to HG alone, whereas the HG-triggered accumulation of autophagosomes was ameliorated in the presence of metformin (Figure 4(c,d)). An increase in the expression level of LC3-II was also observed in HUVECs exposed to HG alone (Figure 4(e,f)). Moreover, in HUVECs transduced with an adenoviral vector carrying GFP-LC3B (Ad-GFP-LC3B), HG also significantly increased the number of green puncta as compared to NG or the osmotic control (Figure 4(g,h)). Metformin treatment not only dramatically attenuated the aggregation of green puncta in HUVECs transduced with Ad-GFP-LC3B, but also downregulated LC3-II expression level in both the absence and presence of BafA1 (Figure 4(e–h)).
In addition, we assessed whether metformin could play a role in autophagy under basal conditions. Different from its inhibitive role in HG-triggered autophagy, intravitreal treatment of metformin increased the number of LC3 puncta colocalized with retinal vascular endothelium in db/m mice in both the presence and absence of BafA1 (Fig. S1O, P). Furthermore, metformin treatment in NG cultured HUVECs did not suppress but instead activated autophagy, which exhibited a markedly high presence of autophagosomes and increased number of GFP-LC3B puncta in both the absence and presence of BafA1 as compared to NG alone (Fig. S2E to H). An upregulation in the protein level of LC3-II was also detected in metformin-treated HUVECs under NG cultured conditions (Fig. S2I, J). Considering an important role of AMPK in mediating autophagy activation [29], it was therefore knocked down in HUVECs through sh-PRKAA1/2 transfection. In PRKAA1/2 deficient HUVECs, the metformin-mediated autophagy activation was abrogated (Fig. S2E to J), indicating that under basal conditions, the role of metformin in autophagy activation is largely dependent on AMPK pathway.
In order to elucidate the role of metformin-downregulated autophagy in the protection against hyperglycemia-induced endothelial impairment, a commonly used autophagic activator, rapamycin was introduced to affect metformin-downregulated autophagy. After reactivation of the metformin-downregulated autophagy, by rapamycin cotreatment (Fig. S5A to D), metformin could no longer exert its beneficial role in endothelial protection against HG impairment, which exhibited an extended area of vascular leakage in retinas (Figure 5(a,b)), notably disrupted aortic ring sprouting function (Figure 5(c,d)), as well as dramatically reduced tube-forming activity in HUVECs (Figure 5(e,f)). Meanwhile, rapamycin cotreatment resulted in a significant increase of cellular apoptosis as compared with metformin alone (Figure 5(g,h)).
Figure 5.
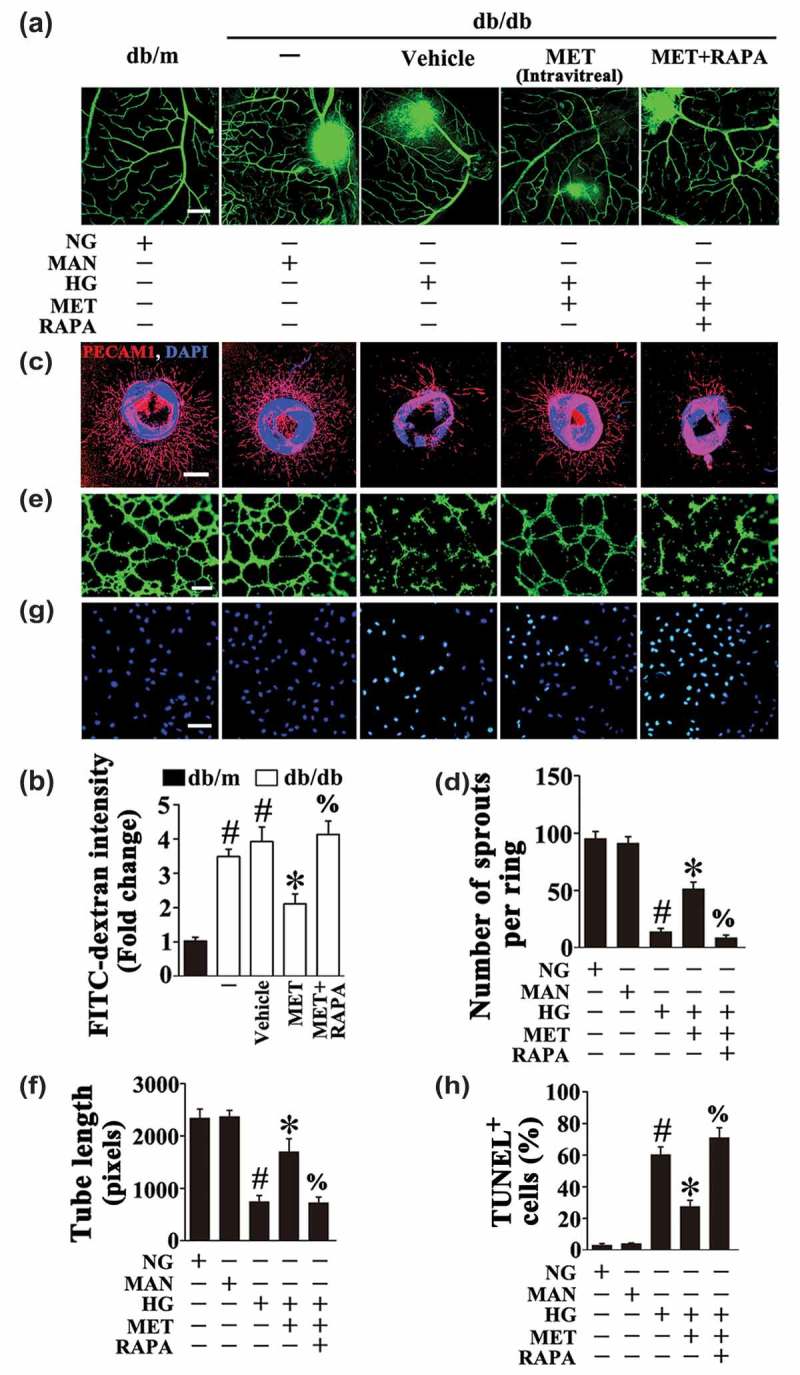
Autophagy activation abolished the metformin-mediated protective effect on hyperglycemia-induced endothelial injury. (a) Representative confocal images of vascular leakage in retinas from db/m mice, db/db mice, and intravitreal MET-treated (0.5 nmol in 1 μL) db/db mice. Rapamycin (RAPA) was injected (i.p. 7.5 mg/kg) right after MET intravitreal injection. Scale bars: 200 μm. (b) Retinal leakage was quantified by measuring the fluorescence intensities of FITC-dextran in (a). Images were taken in 6 random microscopy fields per sample and values displayed are means ± SEM of 8 independent experiments. Data are expressed as fold change relative to db/m mice. # P < 0.05 vs. db/m mice; * P < 0.05 vs. db/db mice or vehicle-treated db/db mice; % P < 0.05 vs. MET intravitreally injected db/db mice. (c) Representative confocal images of aortic rings from C57BL/6 mice cultured in different media containing NG, HG alone or with MET (50 μM) for 72 h, MAN was used as the osmotic control for HG. For pharmacological manipulation of autophagy, aortic rings were treated with RAPA (10 nM) 2 h after MET treatment. Scale bars: 500 μm. (d) Quantification of the number of sprouts in (c), values displayed are means ± SEM of 10 independent experiments. # P < 0.05 vs. NG or MAN; * P < 0.05 vs. HG; % P < 0.05 vs. HG coincubated with MET. (e) Capillary-like tube formation was assessed by matrigel angiogenesis assay in HUVECs. HUVECs were cultured either in NG or HG medium in the presence or absence of MET (50 μM) for 72 h, MAN was used as the osmotic control for HG. For pharmacological manipulation of autophagy, HUVECs were treated with RAPA (10 nM) 2 h after MET treatment. Scale bars: 300 μm. (f) Quantification of the tube length in (e), images of tube morphology were taken in 6 random microscopy fields per sample and values displayed are means ± SEM of 8 independent experiments. # P < 0.05 vs. NG or MAN; * P < 0.05 vs. HG; % P < 0.05 vs. HG coincubated with MET. (g) TUNEL assay of HUVECs treated as indicated in (e). The apoptotic cells were labelled with green, and nuclei were stained with DAPI (blue). Scale bars: 100 μm. (h) The quantitative analysis of TUNEL+ cells in at least 6 separate fields, values displayed are means ± SEM of 6 independent experiments. # P < 0.05 vs. NG or MAN; * P < 0.05 vs. HG; % P < 0.05 vs. HG coincubated with MET.
By the same token, although results obtained with rapamycin suggested a detrimental role of autophagy in HG-induced endothelial dysfunction, more direct proof is still needed. Thus we further investigated whether direct inhibition of HG-triggered autophagy could achieve a similar endothelial protective effect as metformin. To obtain this, we used adeno-associated virus (AAV) vectors carrying a short hairpin RNA (shRNA) against murine Atg7 mRNA under control of the murine vascular Cdh5/VE-cadherin (cadherin 5) core promoter (AAV-Cdh5-sh-Atg7) to genetically downregulate autophagy in the retinal vasculature through intravitreal injection (detailed information was listed in Table 1) [30]. The AAV vector enables long-term gene transfer and the Cdh5 promoter ensures restriction of transgene expression in endothelium. AAV-mediated Atg7 knockdown in the retinal vasculature was confirmed by immunofluorescence microscopy (Figure 6(a,b)). AAV-Cdh5-sh-Atg7-mediated autophagy suppression was further ascertained in AAV-Cdh5-sh-Atg7-transfected db/m and db/db mice by immunofluorescence staining of LC3. In both AAV-Cdh5-sh-Atg7-transfected db/m and db/db mice, we found fewer LC3 puncta colocalized with retinal vascular endothelium (labeled with isolectin B4) as compared with corresponding AAV-Cdh5-Scrambled shRNA-transfected mice (Fig. S5E, F). In db/m mice, AAV-Cdh5-sh-Atg7-mediated autophagy inhibition exerted little influence on the extent of retinal vascular leakage compared with AAV-Cdh5-Scrambled shRNA-transfected db/m mice. Conversely, the extent of retinal vascular leakage in db/db mice was significantly decreased due to AAV-mediated Atg7 knockdown (Figure 6(c,d)).
Table 1.
List of AAV-mediated tissue specific gene knockdown or overexpression and Cre/loxP system-mediated conditional tissue specific gene knockdown mouse models.
| Mouse model | Molecular description | Related tissue | Relevant physiological effect |
|---|---|---|---|
| AAV-Cdh5- sh-Atg7 intravitreally injected mouse model |
Adeno-associated virus vectors carrying a short hairpin RNA against murine Atg7 mRNA under control of the murine vascular Cdh5/VE-cadherin core promoter. | Retinal vasculature | Specific knockdown of Atg7 mRNA level, thus genetically downregulating autophagy in the retinal vasculature |
| AAV-Cdh5- sh-Gli1 intravitreally injected mouse model |
Adeno-associated virus vectors carrying a short hairpin RNA against murine Gli1 mRNA under control of the murine vascular Cdh5/VE-cadherin core promoter. | Retinal vasculature | Specific knockdown of Gli1 mRNA level, thus genetically inhibiting the Hedgehog pathway in the retinal vasculature |
| AAV-Cdh5-Gli1 intravitreally injected mouse model | Adeno-associated virus vectors carrying murine Gli1 cDNA under the control of the murine vascular Cdh5/VE-cadherin core promoter. | Retinal vasculature | Specifically overexpress GLI, thus genetically activating the Hedgehog pathway in the retinal vasculature |
| atg7flox/flox; Tek-Cre (+) mouse model |
atg7flox/flox mice: Mice bearing an Atg7flox allele, in which exon 14 of the Atg7 gene is flanked by 2 loxP sites. Tek-Cre (+) transgenic mice: A mouse strain expressing Cre recombinase under the control of the promoter/enhancer of Tek/Tie2, in a pan-endothelial fashion. The atg7flox/flox; Tek-Cre (+) mouse model is achieved by mating the 2 strains of mice. |
Pan-endothelial cells | Pan endothelial-specific disruption of the Atg7 gene, thus genetically downregulating autophagy in endothelial cells. |
Figure 6.
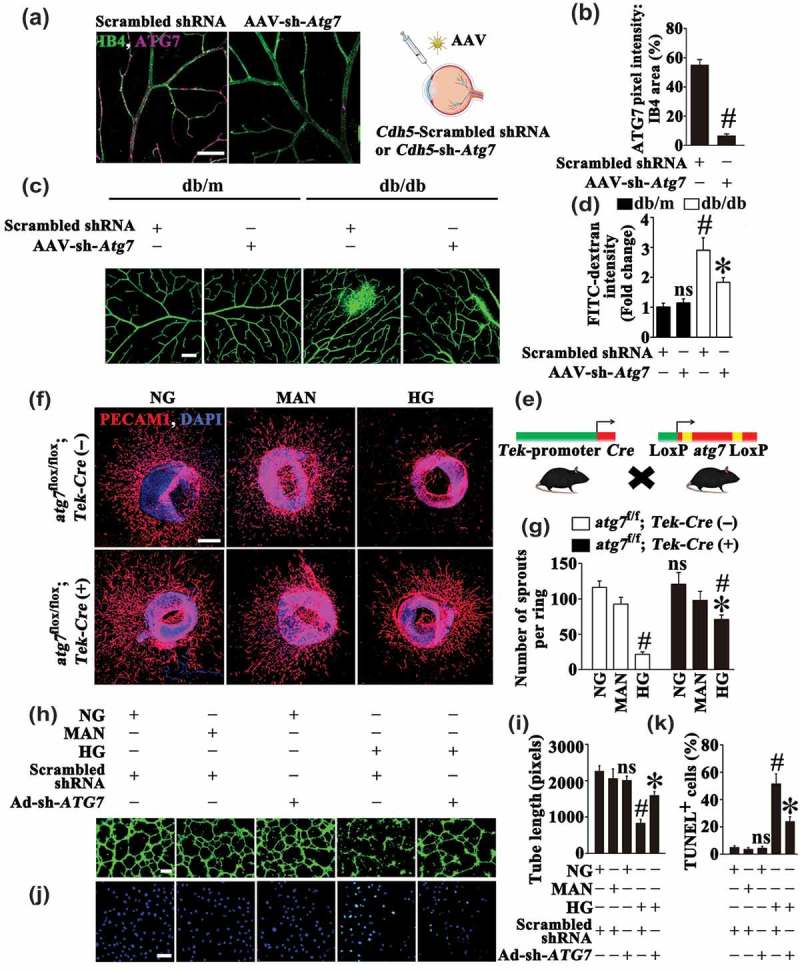
The metformin-mediated suppression of autophagy is protective in hyperglycemia-induced endothelial injury. (a) Representative images of ATG7 (red) staining in retinal vessels from AAV-Cdh5-Scrambled shRNA or AAV-Cdh5-sh-Atg7 intravitreally injected db/db mice. Retinal vasculature was labelled with IB4 (green). Scale bars: 100 μm. (b) Quantification represents the ratio between the sum of ATG7 pixel intensity and IB4 area. Images were taken in 6 random microscopy fields per sample and values displayed are means ± SEM of 8 independent experiments. # P < 0.05 vs. AAV-Cdh5-Scrambled shRNA-injected db/db mice. (c) Representative confocal images of vascular leakage in retinas from AAV-Cdh5-Scrambled shRNA or AAV-Cdh5-sh-Atg7 intravitreally injected db/m and db/db mice. Scale bars: 200 μm. (d) Retinal leakage was quantified by measuring the fluorescence intensities of FITC-dextran in (c). Images were taken in 6 random microscopy fields per sample and values displayed are means ± SEM of 8 independent experiments. Data are expressed as fold change relative to AAV-Cdh5-Scrambled shRNA-injected db/m mice. # P < 0.05 vs. AAV-Cdh5-Scrambled shRNA-injected db/m mice; * P < 0.05 vs. AAV-Cdh5-Scrambled shRNA-injected db/db mice; ns, non-significant compared with AAV-Cdh5-Scrambled shRNA-injected db/m mice. (e) Diagram showing the endothelium conditional knockout of Atg7 in mice. (f) Representative confocal images of aortic rings from atg7flox/flox; Tek-Cre (+) mice and its control littermates Atg7flox/flox; Tek-Cre (-) mice cultured in different media containing NG, HG, MAN was used as the osmotic control for HG. Scale bars: 500 μm. (g) Quantification of the number of sprouts in (f), values displayed are means ± SEM of 10 independent experiments. # P < 0.05 vs. corresponding NG or MAN; * P < 0.05 vs. aortic rings from Atg7flox/flox; Tek-Cre (-) mice cultured in HG; ns, non-significant compared with aortic rings from Atg7flox/flox; Tek-Cre (-) mice cultured in NG or MAN. (h) Capillary-like tube formation was assessed by matrigel angiogenesis assay in HUVECs. HUVECs were transduced with adenoviruses harboring sh-ATG7 (Ad-sh-ATG7) and a scrambled shRNA sequence (Ad-Scrambled shRNA), respectively. After transduction, HUVECs were cultured either in NG or HG medium for 72 h, MAN was used as the osmotic control for HG. Scale bars: 300 μm. (i) Quantification of the tube length in (h), images of tube morphology were taken in 6 random microscopy fields per sample and values displayed are means ± SEM of 8 independent experiments. # P < 0.05 vs. Ad-Scrambled shRNA-transduced HUVECs cultured in NG or MAN; * P < 0.05 vs. Ad-Scrambled shRNA-transduced HUVECs cultured in HG; ns, non-significant compared with Ad-Scrambled shRNA-transduced HUVECs cultured in NG or MAN. (j) TUNEL assay of HUVECs treated as indicated in (h). The apoptotic cells were labelled with green, and nuclei were stained with DAPI (blue). Scale bars: 100 μm. (k) The quantitative analysis of TUNEL+ cells in at least 6 separate fields, values displayed are means ± SEM of 6 independent experiments. # P < 0.05 vs. Ad-Scrambled shRNA-transduced HUVECs cultured in NG or MAN; * P < 0.05 vs. Ad-Scrambled shRNA-transduced HUVECs cultured in HG; ns, non-significant compared with Ad-Scrambled shRNA-transduced HUVECs cultured in NG or MAN.
Besides, we generated endothelium-specific atg7 knockout mice by mating atg7-floxed mice (atg7flox/flox) with mice expressing Cre recombinase under the control of the promoter/enhancer of endothelial-specific Tek/Tie2 (TEK receptor tyrosine kinase) (Figure 6(e)) (detailed information was listed in Table 1) [31]. The effectiveness of Atg7 gene silencing was confirmed by immunoblotting for ATG7 and LC3-II in aortic homogenates form atg7flox/flox; Tek-Cre (+) mice and its control littermates Atg7flox/flox; Tek-Cre (-) (Fig. S5L, M). Then the aortic ring assay was performed. Under NG cultured conditions, atg7flox/flox; Tek-Cre (+) mice exhibited no perceptible change in the aortic sprouting function compared with Atg7flox/flox; Tek-Cre (-) mice. HG significantly disrupted the microvessel network and regular branching of aortic rings from Atg7flox/flox; Tek-Cre (-) mice. However, a well-preserved sprouting function was achieved in the aortic rings form the atg7flox/flox; Tek-Cre (+) mice (Figure 6(f,g)).
Also, we used an adenoviral vector to deliver a short hairpin RNA against human ATG7 mRNA (Ad-sh-ATG7) for genetically downregulating autophagy in HUVECs (Fig. S5G to K). Under NG cultured conditions, we found no abnormalities in the tube formation and cellular apoptosis after ATG7 knockdown (Figure 6(h–k)). However, ATG7 knockdown largely improved HG-impaired tube-forming activity (Figure 6(h,i)). Meanwhile, HG-induced cellular apoptosis was also attenuated (Figure 6(j,k)). These observations suggested that the metformin-mediated suppression of autophagy has a protective role in HG-induced endothelial injury.
Metformin downregulates hyperglycemia-triggered autophagy via activation of the Hh pathway
We sought to analyze the mechanism underlying the metformin-mediated downregulation of HG-triggered autophagy. As previous studies have demonstrated that the Hh pathway negatively regulates autophagy [32], and considering metformin could restore hyperglycemia-reduced Hh pathway activity as demonstrated above (Figure 2(a–p)), we speculated whether metformin suppressed hyperglycemia-triggered autophagy through activating the Hh pathway. To obtain this, HG-exposed HUVECs were coincubated with recombinant SHH (Fig. S4). In addition to its endothelial protective effect against HG as shown above (Figure 2(q–v)), coincubation with SHH also achieved a similar effect with metformin on HG-triggered autophagy, which exhibited a decrease in the autophagosome formation (Figure 7(a,b)). The decrease in the number of GFP puncta in GFP-LC3B-transfected HUVECs as well as in the protein level of LC3-II was also observed in both the absence and presence of BafA1, with SHH treatments (Figure 7(c–f)). Meanwhile, HUVECs were pretreated with the Hh pathway inhibitor, GANT61, prior to metformin administration (Fig. S4). As demonstrated above, GANT61 pretreatment abolished endothelial protection afforded by metformin (Figure 3(d–g)). Interestingly, the metformin-mediated downregulation of HG-triggered autophagy was also abrogated by GANT61 treatment, as reflected by a significant increase in the number of GFP puncta in GFP-LC3B-transfected HUVECs (Figure 7(c,d)) as well as the protein level of LC3-II in both the absence and presence of BafA1 (Figure 7(e,f)). The electron micrographs further revealed increased autophagosome formation due to GANT61 treatment (Figure 7(a,b)).
Figure 7.
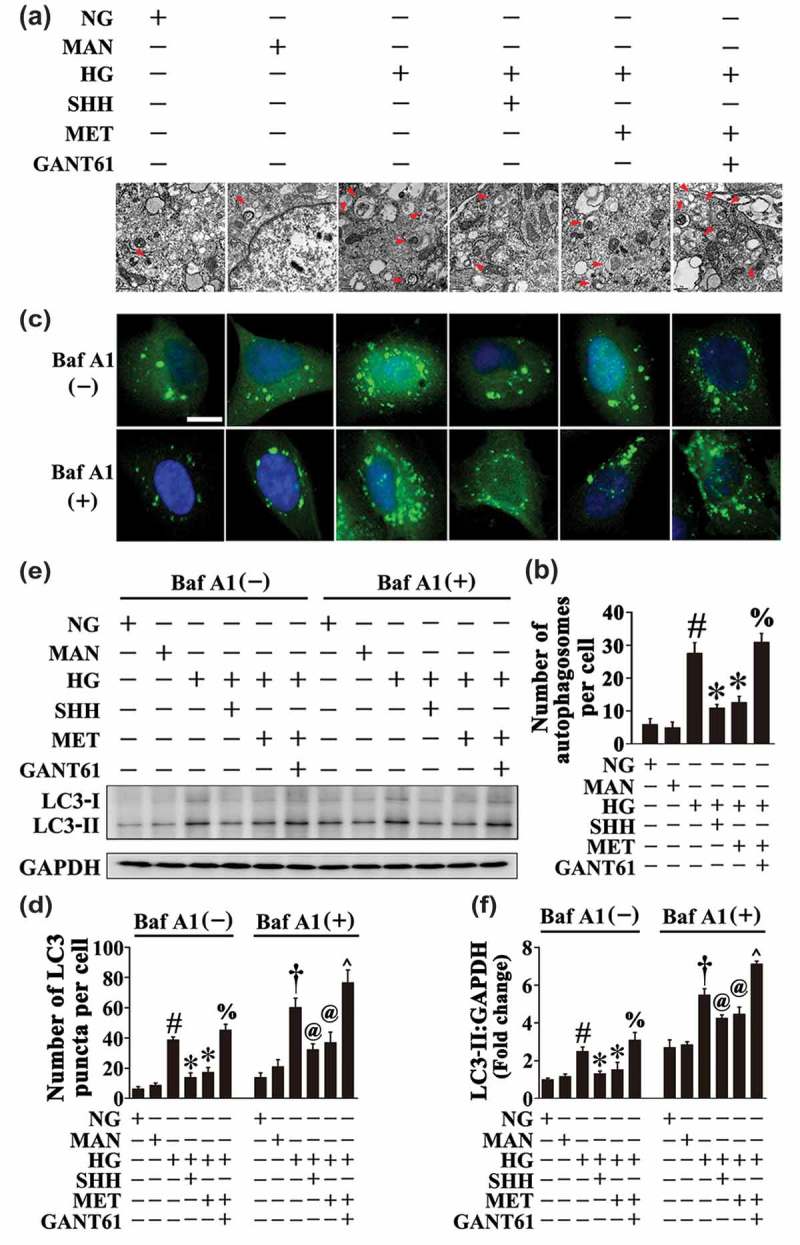
Metformin downregulates hyperglycemia-triggered autophagy via activation of the Hh pathway. (a) Representative electron micrographs from HUVECs cultured in vitro demonstrate the presence of double-membrane autophagosomes (arrows). HUVECs were cultured either in NG or HG medium in the presence or absence of MET (50 μM) for 72 h, MAN was used as the osmotic control for HG. For manipulation of the Hh pathway, HUVECs were cultured in HG medium coincubated with SHH (10 μg mL−1). GANT61 (20 μM) was given as pretreatment for 2 h every day before MET administration. Scale bars: 0.5 μm. (b) Quantification of the autophagosomes per cell in HUVECs treated as in (a). Values displayed are means ± SEM of 6 independent experiments. # P < 0.05 vs. NG or MAN; * P < 0.05 vs. HG; % P < 0.05 vs. HG coincubated with MET. (c) Representative confocal images of HUVECs transduced with Ad-GFP-LC3B. HUVECs were treated as in (a). Where indicated, BafA1 (400 nM) was added for the last 4 h. Scale bars: 5 μm. (d) Quantification of the GFP puncta per cell in (c). Values displayed are means ± SEM of 10 independent experiments. # P < 0.05 vs. NG or MAN; * P < 0.05 vs. HG; % P < 0.05 vs. HG coincubated with MET; and † P < 0.05 vs. NG or MAN in the presence of BafA1; @ P < 0.05 vs. HG in the presence of BafA1; ^ P < 0.05 vs. HG coincubated with MET in the presence of BafA1. (e) Cell lysates of HUVECs treated as indicated in (c) were used to detect the LC3-II protein levels by immunoblotting. (f) The quantitative analysis of LC3-II protein level relative to GAPDH protein level. Data are expressed as fold change relative to NG, values displayed are means ± SEM of 6 independent experiments. # P < 0.05 vs. NG or MAN; * P < 0.05 vs. HG; % P < 0.05 vs. HG coincubated with MET; and † P < 0.05 vs. NG or MAN in the presence of BafA1; @ P < 0.05 vs. HG in the presence of BafA1; ^ P < 0.05 vs. HG coincubated with MET in the presence of BafA1.
There are 3 transcriptional factors, namely GLI1, GLI2 and GLI3, that mediate Hh transcriptional responses in mammalian cells. GLI1 and GLI2 primarily function as transcriptional activators in the presence of SHH [33]; in contrast, GLI3 serves as a transcriptional repressor in the absence of ligands [34]. We next tested the roles of different GLI transcription factors in the regulation of autophagy by Hh. To obtain this, HUVECs were transduced with adenoviruses harboring respective shRNA’s against the 3 GLI-family transcription factors (Ad-sh-GLI1, Ad-sh-GLI2, Ad-sh-GLI3) (Fig. S6A). GLI2- or GLI3-deficient cells could still respond to metformin which reduced the activation of autophagy by HG, in the same way we observed in HUVECs transfected with a scrambled sequence in both the absence and presence of BafA1. However, in the absence of GLI1, metformin was not able to decrease HG-triggered GFP-LC3B accumulation as well as the LC3-II protein expression (Figure 8(a–d)). This result was further confirmed by ultrastructural analysis in HUVECs (Figure 8(e,f)). Consistent with the results obtained by GANT61 treatment, GLI1 knockdown also largely counteracted the metformin-modulated endothelial protective effect against HG impairment, as demonstrated by decreased total tube length (Figure 8(g,h)), as well as elevated incidence of apoptosis (Figure 8(i,j)).
Figure 8.
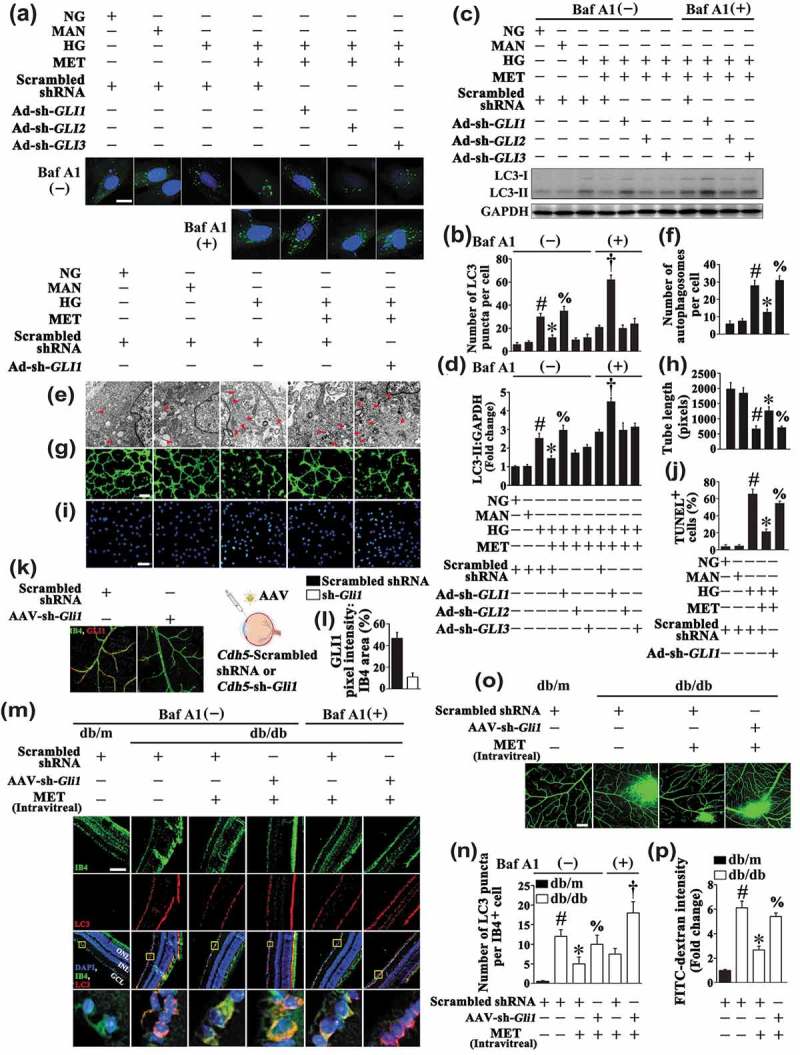
Downregulation of hyperglycemia-activated autophagy by the metformin-mediated Hh pathway activation is GLI1 dependent. (a) Representative confocal images of HUVECs transduced with Ad-GFP-LC3B. HUVECs were transduced with adenoviruses harboring sh-GLI1 (Ad-sh-GLI1), sh-GLI2 (Ad-sh-GLI2), sh-GLI3 (Ad-sh-GLI3) and Ad-Scrambled shRNA, respectively. After transduction, HUVECs were cultured either in NG or HG medium in the presence or absence of MET (50 μM) for 72 h, MAN was used as the osmotic control for HG. Where indicated, BafA1 (400 nM) was added for the last 4 h. Scale bars: 5 μm. (b) Quantification of the GFP-LC3B puncta per cell in (a). Values displayed are means ± SEM of 10 independent experiments. # P < 0.05 vs. Ad-Scrambled shRNA-transduced HUVECs cultured in NG or MAN; * P < 0.05 vs. Ad-Scrambled shRNA-transduced HUVECs cultured in HG; % P < 0.05 vs. Ad-Scrambled shRNA-transduced HUVECs cultured in HG coincubated with MET; and † P < 0.05 vs. Ad-Scrambled shRNA-transduced HUVECs cultured in HG coincubated with MET in the presence of BafA1. (c) Cell lysates of HUVECs were used to detect the LC3-II protein levels by immunoblotting. HUVECs were treated as in (a). (d) The quantitative analysis of LC3-II protein level relative to GAPDH protein level. Data are expressed as fold change relative to Ad-Scrambled shRNA-transduced HUVECs exposed to NG, values displayed are means ± SEM of 6 independent experiments. # P < 0.05 vs. Ad-Scrambled shRNA-transduced HUVECs cultured in NG or MAN; * P < 0.05 vs. Ad-Scrambled shRNA-transduced HUVECs cultured in HG; % P < 0.05 vs. Ad-Scrambled shRNA-transduced HUVECs cultured in HG coincubated with MET; and † P < 0.05 vs. Ad-Scrambled shRNA-transduced HUVECs cultured in HG coincubated with MET in the presence of BafA1. (e) Representative electron micrographs from HUVECs demonstrate the presence of double-membrane autophagosomes (arrows). HUVECs were transduced with Ad-sh-GLI1 and Ad-Scrambled shRNA, respectively. After transduction, HUVECs were cultured either in NG or HG medium in the presence or absence of MET (50 μM) for 72 h, MAN was used as the osmotic control for HG. Scale bars: 0.5 μm. (f) Quantification of the autophagosomes per cell in HUVECs treated as in (e). Values displayed are means ± SEM of 6 independent experiments. # P < 0.05 vs. Ad-Scrambled shRNA-transduced HUVECs cultured in NG or MAN; * P < 0.05 vs. Ad-Scrambled shRNA-transduced HUVECs cultured in HG; % P < 0.05 vs. Ad-Scrambled shRNA-transduced HUVECs cultured in HG coincubated with MET. (g) Capillary-like tube formation was assessed by matrigel angiogenesis assay in HUVECs treated as in (e). Scale bars: 300 μm. (h) Quantification of the tube length in (g), images of tube morphology were taken in 6 random microscopy fields per sample and values displayed are means ± SEM of 8 independent experiments. # P < 0.05 vs. Ad-Scrambled shRNA-transduced HUVECs cultured in NG or MAN; * P < 0.05 vs. Ad-Scrambled shRNA-transduced HUVECs cultured in HG; % P < 0.05 vs. Ad-Scrambled shRNA-transduced HUVECs cultured in HG coincubated with MET. (i) TUNEL assay of HUVECs. HUVECs were treated as indicated in (e), the apoptotic cells were labelled with green, and nuclei were stained with DAPI (blue). Scale bars: 100 μm. (j) The quantitative analysis of TUNEL+ cells in at least 6 separate fields, values displayed are means ± SEM of 6 independent experiments. # P < 0.05 vs. Ad-Scrambled shRNA-transduced HUVECs cultured in NG or MAN; * P < 0.05 vs. Ad-Scrambled shRNA-transduced HUVECs cultured in HG; % P < 0.05 vs. Ad-Scrambled shRNA-transduced HUVECs cultured in HG coincubated with MET. (k) Representative images of GLI1 (red) staining in retinal vessels from AAV-Cdh5-Scrambled shRNA or AAV-Cdh5-sh-Gli1 intravitreally injected db/m mice. Retinal vasculature was labelled with IB4 (green). Scale bars: 100 μm. (l) Quantification represents the ratio between the sum of GLI1 pixel intensity and IB4 area. Images were taken in 6 random microscopy fields per sample and values displayed are means ± SEM of 8 independent experiments. # P < 0.05 vs. AAV-Cdh5-Scrambled shRNA-injected db/m mice. (m) Representative immunofluorescence analysis of LC3 (red puncta) in the retinas from AAV-Cdh5-Scrambled shRNA intravitreally injected db/m mice, AAV-Cdh5-Scrambled shRNA intravitreally injected db/db mice in the absence or presence of intravitreal MET treatment (0.5 nmol in 1 μL), AAV-Cdh5-sh-Gli1 intravitreally injected db/db mice in the presence of intravitreal MET treatment. Where indicated, mice were intraperitoneally treated with BafA1 (0.3 mg/kg). The IB4 staining (green) highlights retinal vasculature, and nuclei were stained with DAPI (blue). GCL, ganglion cell layer; INL, inner nuclear layer; ONL, outer nuclear layer. Scale bars: 100 μm. (n) Quantification represents the average number of LC3 puncta per IB4+ cell. Images were taken in 6 random microscopy fields per sample and values displayed are means ± SEM of 8 independent experiments. # P < 0.05 vs. AAV-Cdh5-Scrambled shRNA-injected db/m mice; * P < 0.05 vs. AAV-Cdh5-Scrambled shRNA-injected db/db mice; % P < 0.05 vs. AAV-Cdh5-Scrambled shRNA-transduced db/db mice treated with MET; and † P < 0.05 vs. AAV-Cdh5-Scrambled shRNA-transduced db/db mice treated with MET in the presence of BafA1. (o) Representative confocal images of vascular leakage in retinas from mice treated as in (m). Scale bars: 200 μm. (p) Retinal leakage was quantified by measuring the fluorescence intensities of FITC-dextran in (o). Images were taken in 6 random microscopy fields per sample and values displayed are means ± SEM of 8 independent experiments. Data are expressed as fold change relative to AAV-Cdh5-Scrambled shRNA-injected db/m mice. # P < 0.05 vs. AAV-Cdh5-Scrambled shRNA-injected db/m mice; * P < 0.05 vs. AAV-Cdh5-Scrambled shRNA-injected db/db mice; % P < 0.05 vs. AAV-Cdh5-Scrambled shRNA-transduced db/db mice treated with MET.
The results were further confirmed in the retinal vasculature. We used AAV vectors carrying a short hairpin RNA against mouse Gli1 mRNA under control of the murine vascular Cdh5 core promoter (AAV-Cdh5-sh-Gli1) to genetically downregulate Gli1 in the retinal vasculature via intravitreal injection (detailed information was listed in Table 1). AAV-mediated Gli1 knockdown in the retinal vasculature was confirmed by immunofluorescence microscopy (Figure 8(k,l)). Consistent with the results obtained in in vitro studies, we found that in AAV-Cdh5-sh-Gli1-transfected db/db mice, the metformin-mediated downregulation of HG-triggered autophagy was abolished, as reflected by a significant increase in the number of LC3 puncta colocalized with retinal vascular endothelium in both the absence and presence of BafA1 as compared with AAV-Cdh5-Scrambled shRNA-transfected db/db mice (Figure 8(m,n)). The metformin-mediated alleviation of retinal vascular leakage in db/db mice was also abrogated due to Gli1 knockdown (Figure 8(o,p)).
For further ascertaining the important role of GLI1 in HG-mediated endothelial dysfunction, we attempted to rescue the endothelial phenotypes imposed by HG through restoring GLI1 signaling (Fig. S6B). Adenoviral-mediated GLI1 overexpression in HG cultured HUVECs not only dramatically attenuated the aggregation of GFP-LC3B, but also downregulated the LC3-II expression level in both the absence and presence of BafA1 (Figure 9(a–d)). Electron micrographs also revealed the attenuation of autophagosome formation due to GLI1 overexpression as compared with HG alone (Figure 9(e,f)). Meanwhile, GLI1 overexpression also significantly ameliorated HG-induced endothelial dysfunction, as demonstrated by increased total tube length (Figure 9(g,h)), as well as a lower level of apoptosis (Figure 9(i,j)). GLI1 overexpression was further performed in the retinal vasculature by AAV vectors under control of the murine vascular Cdh5 core promoter (AAV-Cdh5-Gli1) via intravitreal injection (detailed information was listed in Table 1). AAV-mediated GLI1 overexpression in the retinal vasculature was confirmed by immunofluorescence microscopy (Figure 9(k,l)). In line with the results obtained in in vitro studies, we found that GLI1 overexpression could downregulate HG-triggered autophagy, as reflected by a dramatic decrease in the number of LC3 puncta colocalized with retinal vascular endothelium in both the absence and presence of BafA1 as compared with AAV-Cdh5-LacZ-transfected db/db mice (Figure 9(m,n)). The retinal vascular leakage in db/db mice was also ameliorated due to GLI1 overexpression (Figure 9(o,p)).
Figure 9.
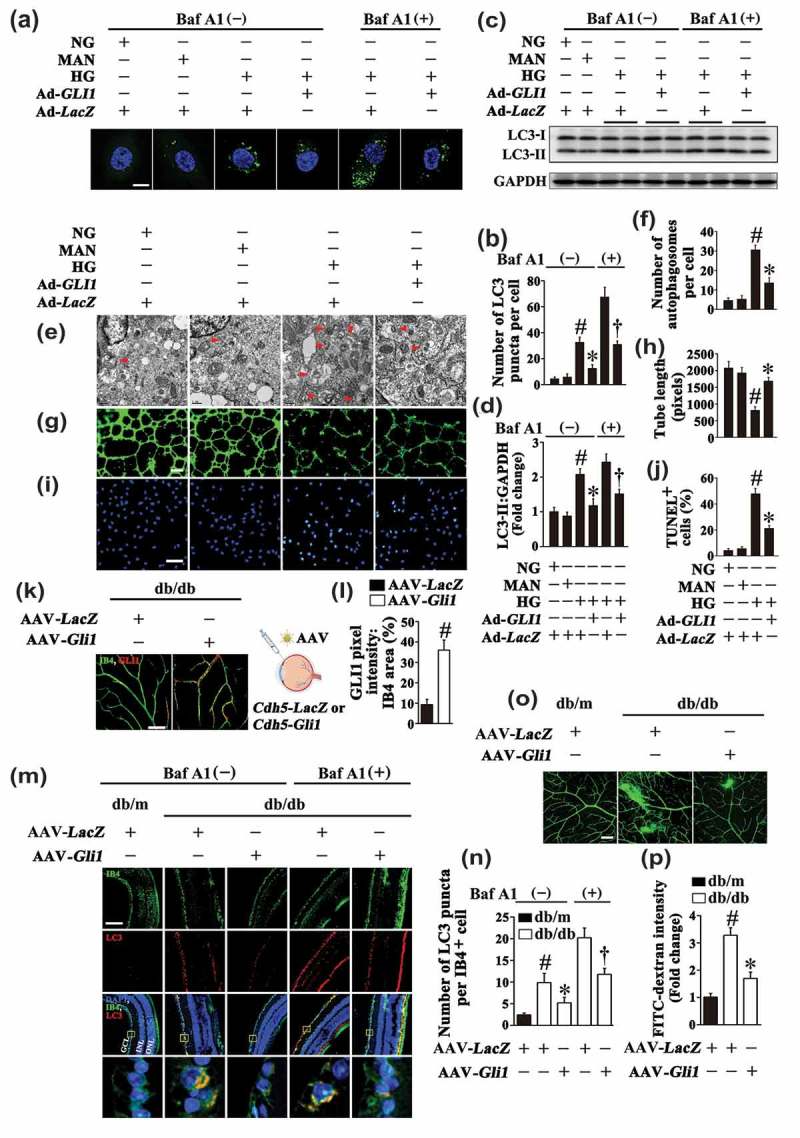
Restoring GLI1 signaling could rescue hyperglycemia-imposed endothelial phenotypes. (a) Representative confocal images of HUVECs transduced with Ad-GFP-LC3B. HUVECs were transduced with adenoviruses harboring GLI1 (Ad-GLI1) and Ad-LacZ (served as a control), respectively. After transduction, HUVECs were cultured either in NG or HG medium for 72 h, MAN was used as the osmotic control for HG. Scale bars: 5 μm. Where indicated, BafA1 (400 nM) was added for the last 4 h. (b) Quantification of the GFP-LC3B puncta per cell in (a). Values displayed are means ± SEM of 10 independent experiments. # P < 0.05 vs. Ad-LacZ-transduced HUVECs cultured in NG or MAN; * P < 0.05 vs. Ad-LacZ-transduced HUVECs cultured in HG; and † P < 0.05 vs. Ad-LacZ-transduced HUVECs cultured in HG in the presence of BafA1. (c) Cell lysates of HUVECs were used to detect the LC3-II protein levels by immunoblotting. HUVECs were treated as in (a). (d) The quantitative analysis of LC3-II protein level relative to GAPDH protein level. Data are expressed as fold change relative to Ad-LacZ-transduced HUVECs exposed to NG, values displayed are means ± SEM of 6 independent experiments. # P < 0.05 vs. Ad-LacZ-transduced HUVECs cultured in NG or MAN; * P < 0.05 vs. Ad-LacZ-transduced HUVECs cultured in HG; and † P < 0.05 vs. Ad-LacZ-transduced HUVECs cultured in HG in the presence of BafA1. (e) Representative electron micrographs from HUVECs demonstrate the presence of double-membrane autophagosomes (arrows). HUVECs were treated as in (a). Scale bars: 0.5 μm. (f) Quantification of the autophagosomes per cell in HUVECs treated as in (e). Values displayed are means ± SEM of 6 independent experiments. # P < 0.05 vs. Ad-LacZ-transduced HUVECs cultured in NG or MAN; * P < 0.05 vs. Ad-LacZ-transduced HUVECs cultured in HG. (g) Capillary-like tube formation was assessed by matrigel angiogenesis assay in HUVECs treated as in (a). Scale bars: 300 μm. (h) Quantification of the tube length in (g), images of tube morphology were taken in 6 random microscopy fields per sample and values displayed are means ± SEM of 8 independent experiments. # P < 0.05 vs. Ad-LacZ-transduced HUVECs cultured in NG or MAN; * P < 0.05 vs. Ad-LacZ-transduced HUVECs cultured in HG. (i) TUNEL assay of HUVECs. HUVECs were treated as indicated in (a), the apoptotic cells were labelled with green, and nuclei were stained with DAPI (blue). Scale bars: 100 μm. (j) The quantitative analysis of TUNEL+ cells in at least 6 separate fields, values displayed are means ± SEM of 6 independent experiments. # P < 0.05 vs. Ad-LacZ-transduced HUVECs cultured in NG or MAN; * P < 0.05 vs. Ad-LacZ-transduced HUVECs cultured in HG. (k) Representative images of GLI1 (red) staining in retinal vessels from AAV-Cdh5-LacZ or AAV-Cdh5-Gli1 intravitreally injected db/db mice. Retinal vasculature was labelled with IB4 (green). Scale bars: 100 μm. (l) Quantification represents the ratio between the sum of GLI1 pixel intensity and IB4 area. Images were taken in 6 random microscopy fields per sample and values displayed are means ± SEM of 8 independent experiments. # P < 0.05 vs. AAV-Cdh5-LacZ-injected db/db mice. (m) Representative immunofluorescence analysis of LC3 (red puncta) in the retinas from AAV-Cdh5-LacZ intravitreally injected db/m and db/db mice, AAV-Cdh5-Gli1 intravitreally injected db/db mice. Where indicated, mice were intraperitoneally treated with BafA1 (0.3 mg/kg). The IB4 staining (green) highlights retinal vasculature, and nuclei were stained with DAPI (blue). GCL, ganglion cell layer; INL, inner nuclear layer; ONL, outer nuclear layer. Scale bars: 100 μm. (n) Quantification represents the average number of LC3 puncta per IB4+ cell. Images were taken in 6 random microscopy fields per sample and values displayed are means ± SEM of 8 independent experiments. # P < 0.05 vs. AAV-Cdh5-LacZ-transfected db/m mice; * P < 0.05 vs. AAV-Cdh5-LacZ-transfected db/db mice; and † P < 0.05 vs. AAV-Cdh5-LacZ-transfected db/db mice in the presence of BafA1. (O) Representative confocal images of vascular leakage in retinas from mice treated as in (m). Scale bars: 200 μm. (n) Retinal leakage was quantified by measuring the fluorescence intensities of FITC-dextran in (o). Images were taken in 6 random microscopy fields per sample and values displayed are means ± SEM of 8 independent experiments. Data are expressed as fold change relative to AAV-Cdh5-LacZ-transfected db/m mice. # P < 0.05 vs. AAV-Cdh5-LacZ-transfected db/m mice; * P < 0.05 vs. AAV-Cdh5-LacZ-transfected db/db mice.
Overall, these results suggest that the downregulation of autophagy by metformin is mediated at least in part through the activation of the Hh pathway, and that intact GLI1 is required for the suppression of the autophagy upon activation of Hh signaling.
The metformin-mediated Hh activation regulates autophagy through a mechanism involving BNIP3
The mechanism underlying the metformin-mediated Hh activation regulating autophagy was further explored. ATG genes encode proteins that play essential roles in autophagy. Among these ATG gene-encoding proteins, ATG3, ATG5, BECN1, ATG7, and ATG12 are essential for the formation of the autophagosome [35]. As ATG genes can be influenced by many autophagic regulators, we examined whether the alteration of ATG genes is involved in Hh-regulated autophagy. As shown in Figure 10(a), metformin treatment could not decrease the expression of ATG proteins as compared with HUVECs exposed to HG alone. Cotransfected with Ad-sh-GLI1 also did not increase the levels of ATG proteins when compared with metformin-treated HUVECs. These results suggest that the metformin-mediated Hh activation regulates autophagy through a mechanism irrelevant to the alteration of ATG gene expression.
Figure 10.
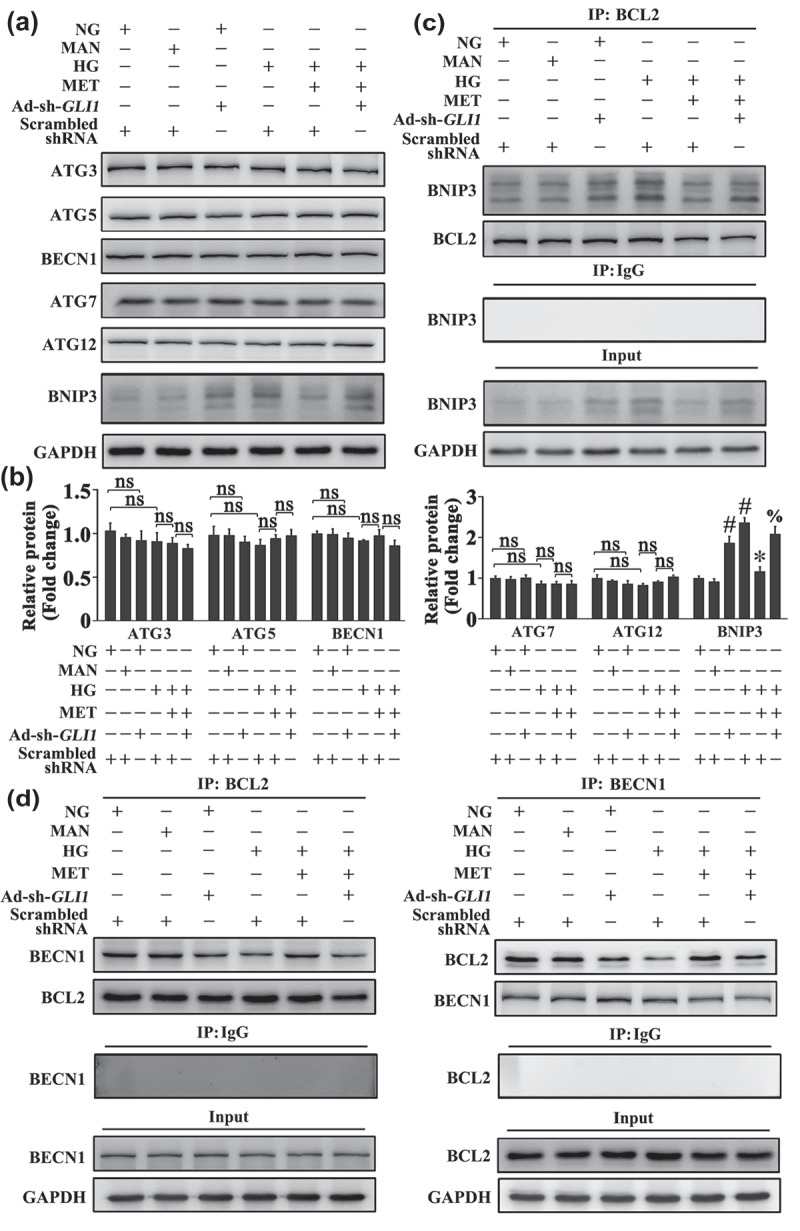
The metformin-mediated Hh activation regulates autophagy through a mechanism involving BNIP3. (a) Cell lysates of HUVECs were used to detect the expression of BNIP3 and ATG proteins by immunoblotting. HUVECs were transduced with Ad-sh-GLI1 and Ad-Scrambled shRNA, respectively. After transduction, HUVECs were cultured either in NG or HG medium in the presence or absence of MET (50 μM) for 72 h, MAN was used as the osmotic control for HG. (b) The quantitative analysis of each immunoblot relative to GAPDH protein level in (a). Data are expressed as fold change relative to Ad-Scrambled shRNA-transduced HUVECs cultured in NG, values displayed are means ± SEM of 6 independent experiments. # P < 0.05 vs. Ad-Scrambled shRNA-transduced HUVECs cultured in NG or MAN; * P < 0.05 vs. Ad-Scrambled shRNA-transduced HUVECs cultured in HG; % P < 0.05 vs. Ad-Scrambled shRNA-transduced HUVECs cultured in HG coincubated with MET; ns, non-significant. (c) HUVECs were treated as in (a), and the cell lysates were subjected to immunoprecipitation with BCL2 antibody, followed by immunoblotting with the indicated antibodies. Cell lysates were also subjected to immunoprecipitation with IgG as negative control. (d) HUVECs were treated as in (a), and the cell lysates were subjected to immunoprecipitation with either BCL2 or BECN1 antibody, followed by immunoblotting with the indicated antibodies. Cell lysates were also subjected to immunoprecipitation with IgG as negative control.
Despite of an initial opinion of the BCL2 family as mostly apoptosis regulators [36], they are currently widely accepted for their dual roles in regulating apoptosis and autophagy [37]. Therefore, we investigated whether BCL2-family proteins are involved in the mechanism by which the metformin-mediated Hh activation regulated autophagy. As shown in Figure 10(a), we observed a significant decrease in the protein level of the BH3-only protein, BNIP3, by metformin treatment as compared with HUVECs exposed to HG alone. While the Ad-sh-GLI1-mediated GLI1 knockdown re-upregulated the expression of BNIP3.
In addition, unlike its role in downregulating HG-induced BNIP3 expression, metformin treatment increased the protein level of BNIP3 in NG cultured conditions. sh-PRKAA1/2 transfection showed that this action was AMPK dependent (Fig. S2A, B). Considering the role of BNIP3 in regulating autophagy, this observation is in accordance with the proautophagic effect of metformin under basal conditions as we demonstrated above (Fig. S2E to J).
BECN1, a mammalian ortholog of Vps30/Atg6 in yeast, is a highly conserved molecule of autophagy and plays a central role during autophagosome formation [38]. Structural studies reveal that BECN1 consists of a putative BH3-like domain [39], which interacts with BCL2 to inhibit autophagy [40,41]. Considering that BNIP3 is identified as a BH3-only protein, we hypothesized that a Hh-mediated BNIP3 alteration might lead to a change in the molecular link between BECN1 and BCL2. Indeed, immunoprecipitation revealed that metformin treatment attenuated the association between BNIP3 and BCL2 (Figure 10(c)), thus promoting the BECN1 and BCL2 interaction in comparison with HUVECs exposed to HG alone (Figure 10(d)). However, cotransfected with Ad-sh-GLI1 abolished the metformin-promoted disassociation between BNIP3 and BCL2 (Figure 10(c)), as well as the BECN1 and BCL2 interaction (Figure 10(d)). Intriguingly, under NG cultured conditions, Ad-sh-GLI1-mediated GLI1 knockdown achieved a similar effect with HG on endothelial cells, which could also induce BNIP3 expression and the association between BNIP3 and BCL2 (Figure 10), along with the induction of autophagy (Fig. S7).
The importance of BNIP3 in BECN1 and BCL2 dissociation was further demonstrated by forced overexpression of BNIP3. BNIP3 overexpression was sufficient to induce autophagy in HUVECs cultured in NG conditions, as revealed by the accumulation of GFP-LC3B puncta and increased protein level of LC3-II in both the absence and presence of BafA1 (Fig. S8A, C, E to G). Furthermore, forced overexpression of BNIP3 in HG cultured HUVECs disrupted the metformin-promoted BECN1 and BCL2 interaction (Figure 11(a,b)). The metformin-mediated downregulation of hyperglycemia-activated autophagy was thus reactivated, which manifested an obvious increase of LC3-II (Figure 11(c)) as well as accumulation of GFP-LC3B puncta (Figure 11(d,e)), resulting in the counteraction of the metformin-exerted endothelial protective action against hyperglycemia impairment (Figure 11(f–i)).
Figure 11.
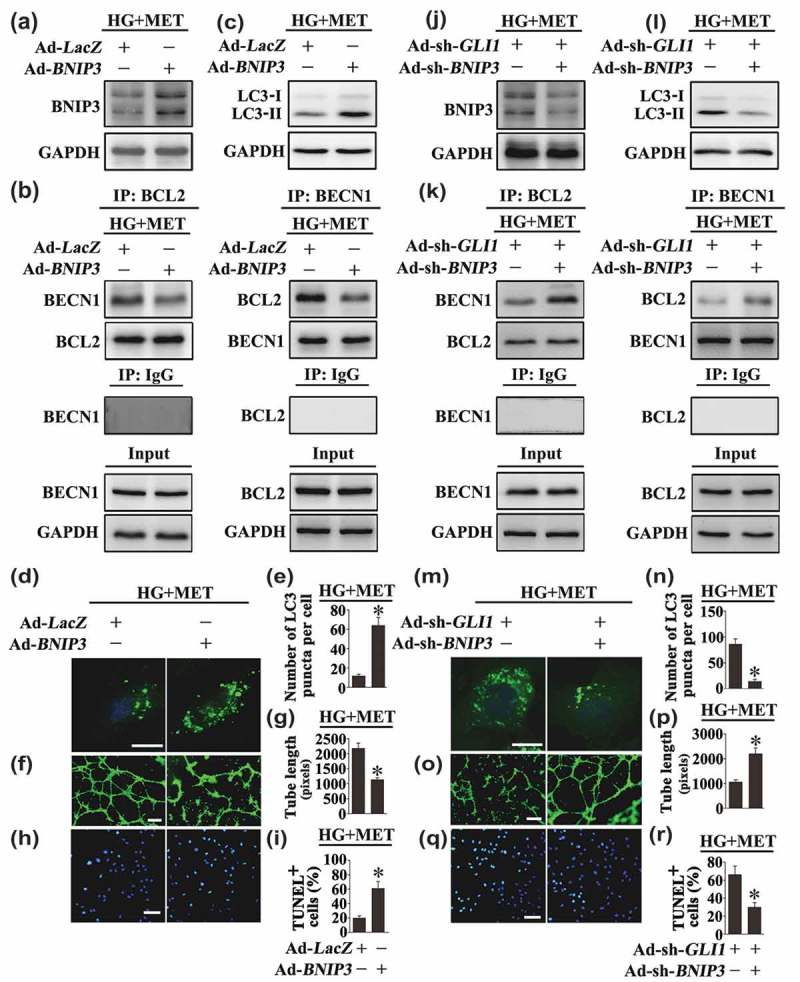
Modulation of BNIP3 expression affects Hh-regulated autophagy, thus influences the endothelial protective effect exerted by the metformin-mediated Hh activation. (a, c) Cell lysates of HUVECs were used to detect the expression of BNIP3 and LC3-II by immunoblotting. HUVECs were transduced with adenoviruses harboring BNIP3 (Ad-BNIP3) and Ad-LacZ served as a control, respectively. After transduction, HUVECs were exposed to HG in combination with MET (50 μM) for 72 h. (b) HUVECs were treated as in (a), and the cell lysates were subjected to immunoprecipitation with either BCL2 or BECN1 antibody, followed by immunoblotting with the indicated antibodies. Cell lysates were also subjected to immunoprecipitation with IgG as negative control. (d) Representative confocal images of HUVECs transduced with Ad-GFP-LC3B. HUVECs were treated as indicated in (a). Scale bars: 5 μm. (e) Quantification of the GFP puncta per cell in (d). Values displayed are means ± SEM of 10 independent experiments. * P < 0.05 vs. Ad-LacZ-transduced HUVECs exposed to HG in the presence of MET. (f) Capillary-like tube formation was assessed by matrigel angiogenesis assay in HUVECs treated as in (a). Scale bars: 300 μm. (g) Quantification of the tube length in (f), images of tube morphology were taken in 6 random microscopy fields per sample and values displayed are means ± SEM of 8 independent experiments. * P < 0.05 vs. Ad-LacZ-transduced HUVECs exposed to HG in the presence of MET. (h) TUNEL assay of HUVECs. HUVECs were treated as indicated in (a), the apoptotic cells were labeled with green, and nuclei were stained with DAPI (blue). Scale bars: 100 μm. (i) The quantitative analysis of TUNEL+ cells in at least 6 separate fields, values displayed are means ± SEM of 6 independent experiments. * P < 0.05 vs. Ad-LacZ-transduced HUVECs exposed to HG in the presence of MET. (j, l) Cell lysates of HUVECs were used to detect the expression of BNIP3 and LC3-II by immunoblotting. HUVECs were transduced with Ad-sh-GLI1 and either adenoviruses harboring sh-BNIP3 (Ad-sh-BNIP3) or not. After transduction, HUVECs were exposed to HG in combination with MET (50 μM) for 72 h. (k) HUVECs were treated as in (j), and the cell lysates were subjected to immunoprecipitation with either BCL2 or BECN1 antibody, followed by immunoblotting with the indicated antibodies. Cell lysates were also subjected to immunoprecipitation with IgG as negative control. (m) Representative confocal images of HUVECs transduced with Ad-GFP-LC3B. HUVECs were treated as indicated in (j). Scale bars: 5 μm. (n) Quantification of the GFP puncta per cell in HUVECs treated as in (m). Values displayed are means ± SEM of 10 independent experiments. * P < 0.05 vs. Ad-sh-GLI1-transduced HUVECs exposed to HG in the presence of MET. (o) Capillary-like tube formation was assessed by matrigel angiogenesis assay in HUVECs treated as in (j). Scale bars: 300 μm. (p) Quantification of the tube length in (o), images of tube morphology were taken in 6 random microscopy fields per sample and values displayed are means ± SEM of 8 independent experiments. * P < 0.05 vs. Ad-sh-GLI1-transduced HUVECs exposed to HG in the presence of MET. (q) TUNEL assay of HUVECs. HUVECs were treated as indicated in (j), the apoptotic cells were labelled with green, and nuclei were stained with DAPI (blue). Scale bars: 100 μm. (r) The quantitative analysis of TUNEL+ cells in at least 6 separate fields, values displayed are means ± SEM of 6 independent experiments. * P < 0.05 vs. Ad-sh-GLI1-transduced HUVECs exposed to HG in the presence of MET.
Besides, BNIP3 knockdown was achieved by Ad-sh-BNIP3 transfection. Under NG cultured conditions, BNIP3 knockdown was able to suppress autophagy, as revealed by the decrease in GFP-LC3B puncta and downregulated protein level of LC3-II in both the absence and presence of BafA1 (Fig. S8B, D, H to J). Furthermore, in HUVECs cultured in HG coincubated with metformin, BNIP3 knockdown partially reversed GLI1 deficiency-induced BECN1 disassociation from BCL2 (Figure 11(j,k)), and suppressed GLI1 knockdown-induced autophagy (Figure 11(l–n)). The endothelial function is thus well-preserved (Figure 11(o–r)). Taken together, these results indicate that the metformin-mediated Hh activation regulates autophagy through a mechanism involving BNIP3, which influences the association between BECN1 and BCL2 (Figure 12).
Figure 12.
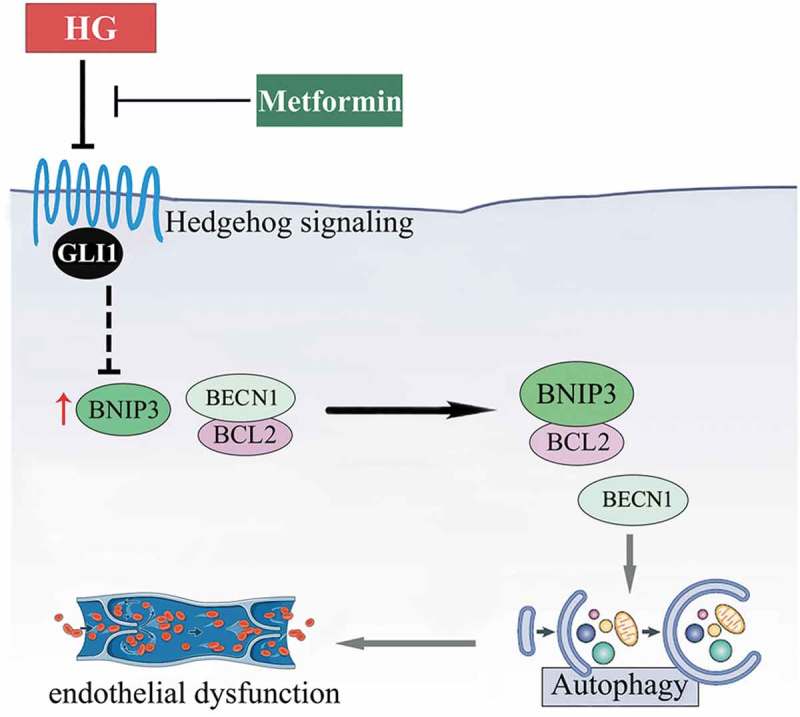
Schematic showing that metformin alleviates hyperglycemia-induced endothelial impairment by downregulating autophagy via the Hedgehog pathway. Metformin treatment restores the hyperglycemia-impaired Hh pathway activity. And it is through GLI1, that metformin downregulates hyperglycemia-triggered BNIP3 expression, which subsequently inhibits the association between BNIP3 and BCL2, thus enhancing the binding of BECN1 and BCL2. In this way, hyperglycemia-triggered prolonged autophagy is inhibited by metformin, resulting in the alleviation of hyperglycemia-induced endothelial dysfunction.
Discussion
Recent studies have provided strong evidence that Hh-GLI signaling negatively regulates autophagy [32,42]. In the present study, we demonstrate that metformin exerts its endothelial protective action against hyperglycemia impairment, at least in part, through inhibiting hyperglycemia-triggered excessive autophagosome synthesis. And this process is mediated via activating the Hh-GLI1 pathway, rather than a routine metformin-AMPK pathway.
Autophagy has long been considered as a process in response to environmental stress such as nutrient or growth factor deprivation. However, the role of autophagy in diabetic cardiovascular diseases differs. Recent research has observed suppressed autophagy in the heart from type 1 diabetic mice, which is concomitant with cardiac dysfunction [43]. Metformin administration significantly improves cardiac function along with the restoration of autophagy, indicating a beneficial effect of autophagy in the type 1 diabetic heart. On the contrary, other research has provided evidence that autophagy is upregulated in the heart from type 2 diabetic mice [44]. And the increased autophagy is linked with elevated generation of cardiac superoxide as well as fibrosis, suggesting that autophagy plays a detrimental role in diabetic cardiomyopathy of the type 2 diabetic model [44]. Together, the 2 studies suggest that autophagy is differentially modulated in type 1 and type 2 diabetic models, and the role of autophagy as well as its regulation in diabetes may depend on the affected tissues or cells [45], the external stressors or inducers of autophagy [46], and the involved components of the autophagy machinery [47].
In this study, we observed activated autophagy in the vascular endothelium from db/db type 2 diabetic mice as well as the HG-cultured HUVECs, and the HG-impaired endothelial function is ameliorated in the endothelium-specific atg7 knockout mice (atg7flox/flox; Tek-Cre [+]) and ATG7-deficient HUVECs, suggesting a detrimental role of HG-triggered autophagy in endothelium. Interestingly, both atg7flox/flox; Tek-Cre (+) mice and ATG7 deficient HUVECs exhibit no obvious abnormalities in endothelial function under NG cultured conditions in spite of the downregulated autophagy. This finding coincides with the previous observations obtained in another endothelium-specific atg7 knockout mouse model (atg7flox/flox; Cdh5/VE-cadherin-Cre [+]) [48]. Similarly, there are no obvious differences in the vascular density and postnatal retinal angiogenesis between atg7flox/flox; Cdh5-Cre (+) mice and its control. The appearance of the endothelium and underlying architecture of large vessels are also similar. In addition, the ECs isolated from Becn1± mouse lungs display a more significant enhancement in angiogenesis and cell proliferation as compared with the ECs isolated from Becn1+/+ mouse in response to hypoxia, but which is not evident under normoxia [17]. Based on the different behaviors of autophagy suppression in angiogenesis between normal and stressed conditions, we speculate that it might be the ‘degree’ of autophagy determines the action of autophagy suppression on angiogenesis. Under stressed conditions (for example, hypoxia or hyperglycemia), these stimuli often lead to a relatively high level of autophagy, the downregulation of autophagy is thus prone to exhibit a significant effect. On the contrary, autophagy is relatively inactive under basal conditions [13,49], therefore the inhibition of autophagy hardly results in a different phenotype of angiogenesis [17,48]. It is noteworthy that, our current results, in conjunction with these previous observations, only focus on the effect of autophagy suppression on angiogenesis and the appearance of the endothelium, more details regarding the role of autophagy suppression in endothelial function under basal conditions need to be further explored.
In the present study, a pro-angiogenic role of metformin in response to HG is defined. In line with our findings, metformin has been reported for its endothelial and cardiac protective effects, especially in the context of obesity and/or diabetes [50–53]. However, the effect of metformin on angiogenesis remains paradoxical. As a crucial step in tumorigenesis, angiogenesis has been determined as a potential target of metformin. Lines of evidence have established an indirect antiangiogenic action of metformin via regulating diverse mediators implicated in the process of angiogenesis [54–57], indicating that metformin could exert its anticancer effect, at least in part, through an antiangiogenic effect. Corresponding with this view, we have defined the AMPK dependent antiangiogenic and proautophagic effects of metformin under NG cultured conditions. The 2 effects might be potentially linked considering the role of autophagy in angiogenesis inhibition [13–16], although we do not confirm a causal role of metformin-induced autophagy in its antiangiogenic effect under NG cultured conditions. Intriguingly, these observations of metformin differ from its Hh-dependent proangiogenic and antiautophagic effects under HG cultured conditions. Thus, the exact mechanisms of metformin and its regulatory components for the antiangiogenic or proangiogenic properties, should be analyzed under specific circumstances.
Corresponding to its dual role in modulating angiogenesis, metformin also has paradoxical effects on the Hh pathway in different cell types. Previous studies have demonstrated that the Hh signaling pathway is implicated as an early and late mediator of pancreatic cancer and breast cancer tumorigenesis, and metformin exerts anticancer effects through the inhibition of the Hh signaling pathway in breast cancer cells [58,59]. In addition to its protumorigenesis function, an emerging line of evidence suggest a central role for Hh in angiogenesis and tissue regeneration under stressful conditions, such as ischemia [60], diabetes [22] and so on. Another line of evidence has shown that cutaneous Hh pathway is impaired in diabetic animal models [24,25] and recombinant SHH peptide accelerates wound healing in diabetic mice by enhancing endothelial cell-mediated microvascular remodeling [22]. Our present study provides strong evidence that the Hh signaling pathway is impaired in the retinal vasculature from db/db mice and HUVECs exposed to HG, while metformin restores hyperglycemia-reduced Hh pathway activity, which forms the main mechanism underlying the metformin-mediated endothelial protection.
We also reveal that the metformin-mediated Hh activation regulates autophagy through a mechanism involving BNIP3, but irrelevant to the alteration of ATG proteins. The BCL2 protein family contains anti- and pro-apoptotic members for dual regulation of apoptosis and autophagy [39]. The antiapoptotic proteins (e.g., BCL2) are comprised of featured BCL2 homology domains (BH 1‒4), and function as protectors against apoptosis. The BCL2 proapoptotic members include proteins that contain 2 or 3 BH domains; and proteins that contain only BH3 (known as BH3-only proteins), which is essential for the binding of these BH3-only proteins to the antiapoptotic members of BCL2 protein family. The BH3-only proteins, for instance BAD and BNIP3, serve as sensors monitoring cellular stress or damage [61], and they may also induce autophagy in response to various stimuli [62]. BECN1, a key initiator of autophagy, is recently identified as a new member of the BH3-only proteins. And the BH3 domain of BECN1 may interact with BCL2, leading to suppression of autophagy [40,41]. In this study, we demonstrate that metformin, as a potent Hh pathway activator, could significantly decrease HG-triggered BNIP3 upregulation, while the Ad-sh-GLI1-mediated GLI1 knockdown re-upregulates the expression of BNIP3 and that BNIP3-induced dissociation between BECN1 and BCL2, resulting in subsequent induction of autophagy. Although we have demonstrated that BNIP3 expression could be modulated via Hh-GLI1 pathway, however, considering a lack of GLI1 consensus DNA-binding sequences in BNIP3 promoter, Hh signaling is thought to regulate BNIP3 via indirect mechanisms, which is needed to be further explored.
Collectively, our data demonstrate that the protective effects of metformin on hyperglycemia-induced endothelial impairment can be attributed mainly to its role in activating the Hh pathway and resultant downregulation of autophagy. Moreover, we reveal that downregulation of hyperglycemia-activated autophagy by the metformin-mediated Hh pathway activation is GLI1-dependent and through a mechanism involving BNIP3. The results from the current study establish a novel role of metformin in endothelial protection through the autophagy machinery, a finding that may have implications for the pathogenesis and treatment of diabetes-associated vascular complications.
Materials and methods
Animal procedures
Diabetic db/db mice and their control littermates, db/m, were obtained from Jackson Laboratories (Strain: BKS.Cg-Dock7m+/+ Leprdb/J). C57BL/6 mice were obtained from Model Animal Research Center of Nanjing University. Eight-week-old db/db mice were separated into 3 groups and subjected to the following treatment regimens: 1) ad libitum feeding of chow diets; 2) ad libitum feeding of chow diets and vehicle injection of phosphate-buffered saline (PBS; Gibco, 10010); 3) ad libitum feeding of chow diets and intraperitoneal (i.p.) injections of 300 mg/kg/d metformin (Merck KGaA, 317240) [63]. Eight-week-old db/m mice were also separated into 2 groups and subjected to the following treatment regimens: 1) ad libitum feeding of chow diets; 2) ad libitum feeding of chow diets and injections of metformin (i.p. 300 mg/kg/d). After a four-week course of treatment, corresponding analyses were performed. For intravitreal injection, eleven-week-old db/db and db/m mice were anesthetized and the left eyes were injected with 1 μL of 0.5 nmol metformin in the lateral zone 1 mm behind sclerocorneal limbus using a 35-gauge needle (5 μL, Hamilton, Martinsried, Germany), the corresponding right eyes were injected with 1 μL vehicle [64,65]. This initial injection procedure was repeated every 48 h over 8 days. For molecular manipulation of autophagy, RAPA (Merck KGaA, 553210), dissolved in DMSO, was injected i.p. at 7.5 mg/kg right after metformin intravitreal injection.63 When analyzing autophagic flux, mice were treated with BafA1 (i.p. 0.3 mg/kg; Merck KGaA, 196000) daily for the last 3 days [66].
Mice bearing an Atg7flox allele, in which exon 14 of the Atg7 gene is flanked by 2 loxP sites, has been originally described by Komatsu et al [67]. For vascular endothelium-specific gene manipulation, we used Tek/Tie2-Cre (+) transgenic mice that express Cre recombinase under the control of the promoter/enhancer of Tek (TEK receptor tyrosine kinase) as described previously [31,68], in a pan-endothelial fashion [69]. Breeding the 2 strains of mice resulted in endothelial-specific disruption of the Atg7 gene. For experimental purposes, 8-week-old atg7flox/flox; Tek-Cre (+) mice and control Atg7flox/flox; Tek-Cre (-) littermates were used. These 2 lines of mice were kindly gifted by Dr. Yuqiang Ding (Department of Anatomy and Neurobiology, Collaborative Innovation Center for Brain Science, Tongji University School of Medicine, China).
To genetically downregulate autophagy in the mouse retinal vasculature, we used AAV vectors carrying the shRNA against murine Atg7 mRNA under control of the murine vascular Cdh5/VE-cadherin (cadherin 5) core promoter (AAV-Cdh5-sh-Atg7). Meanwhile, to genetically manipulate Hh signaling pathway in the mouse retinal vasculature, we used AAV vectors carrying the shRNA against murine Gli1 mRNA or the murine Gli1 cDNA under the control of murine Cdh5 core promoter (AAV-Cdh5-sh-Gli1 or AAV-Cdh5-Gli1). The Cdh5 promoter ensures restriction of transgene expression in endothelium, which was originally described by Alva et al [70]. Delivery of the AAV vectors into the retinas of mice was accomplished through the intravitreal injection as described [71]. Two-week-old mice were anesthetized and the left eyes were injected with 1 μL of AAV-Cdh5-sh-Atg7 (5 × 10¹² GC/mL), AAV-Cdh5-sh-Gli1 (3.9 × 10¹² GC/mL) or AAV-Cdh5-Gli1 (2.8 × 10¹² GC/mL) in the lateral zone 1 mm behind sclero–corneal limbus using a 35-gauge needle (5 μL, Hamilton, Martinsried, Germany), respectively. The corresponding right eyes were injected with 1 μL AAV-Cdh5-Scrambled shRNA or AAV-Cdh5-LacZ. 3 wks after injections, AAV mediated gene knockdown or expression was confirmed in the retinas.
Mice were maintained at 60 ± 5% relative humidity and 22 ± 2°C, with a 12-h light/dark cycle. All animal experiments and methods performed in this study followed ethical guidelines for animal studies, and were approved by the Institutional Animal Care and Use Committee of Wenzhou Medical University, China.
Cell culture
HUVECs were purchased from Lonza and cultured in endothelial cell growth medium-2 (EGM-2; BulletKit, Lonza, CC-3156 and CC-4176) until the start of the experiment. Subconfluent cells (5 to 7 passages) were used in the experiments. Before starting the experimental procedures, the medium was removed and replaced with phenol red-free low-glucose D-MEM (Gibco, 11054020) supplemented with 1% calf serum (Gibco, 16010159) for 12 h, then HUVECs were placed in EGM-2 consisting of either NG (5.5 mM) or HG (33 mM) in the presence or absence of metformin (50 μM) for 72 h; mannitol (33 mM: 5.5 mM of glucose + 27.5 mM of D-mannitol) was used as the osmotic control for HG. Media were changed every 24 h. When analyzing the alteration of HHIP, HUVECs were cultured in HG medium for 12 h, 24 h, 48 h and 72 h, respectively. The concentration of metformin used in this study was estimated as that approximating peak plasma concentration in clinical use [72,73] and equivalent to the lowest concentration reported for a cell culture studies with bovine aortic endothelial cells [74]. For signaling pathway analysis, each pathway antagonist: compound C (10 μM; Abcam, ab120843) or GANT61 (20 μM; Abcam, ab120241) were given as pretreatment for 2 h every day before metformin administration. In some experiments, HUVECs were exposed to HG in combination with the recombinant Hh pathway ligand, SHH (10 μg/mL; Merck KGaA, GF174) for 72 h. For pharmacological manipulation of autophagy, HUVECs were treated with RAPA (10 nM; Merck KGaA, 553210) 2 h after metformin treatment. Where indicated, BafA1 (400 nM; Merck KGaA, 196000) was added for the last 4 h [75].
Retinal staining
For immunofluorescent analysis with flat-mounted retinas [76], mice were killed, and eyes were enucleated in PBS (Gibco, 10010). The eyes were fixed in 4% paraformaldehyde (PFA, pH 7.4, Sigma, 158127) for 1 h at 4°C. Retinas were dissected by removing sclera and choroid layer, subsequently the lens, the vitreous humor and hyaloid vessels from the fixed eyes. Retinas were postfixed in 1% PFA-PBS overnight at 4°C, washed with PBS and permeabilized with PBS containing 1% Triton X-100 (Sigma, T8787) for 1 h. Retinas were incubated with anti-GLI1 antibodies (Thermo Scientific, PA5-23411) or anti-ATG7 antibodies (Thermo Scientific, PA5-35203). After washing with PBS, retinas were incubated with Alexa Fluor 647-conjugated goat anti-mouse antibody (Abcam, ab150115) or Alexa Flour 647-conjugated donkey anti-rabbit antibody (Abcam, ab150075), as well as FITC-conjugated isolectin B4 (IB4; Sigma, L2895) at 4°C overnight. And the corresponding pixel intensity was calaulated and corrected to IB4 areas.
For immunofluorescent stainging with retinal sections [77], mice eyes were enucleated and fixed in 2% PFA at 4°C for 10 min; the anterior segment was removed, the posterior was fixed in 4% PFA for 60 min and cryopreserved in 30% sucrose (Sigma, BP818) overnight. Specimens were frozen in Optimal Cutting Temperature compound (SAKURA Tissue-Tek, 4583), and 5-μm cryostat sections were cut, mounted onto superfrost ultra plus glass slide. Sections were permeabilized with 0.3% Triton X-100 for 30 min and blocked with 10% donkey serum (Jackson ImmunoResearch Laboratories, 017–000-001) at room temperature for 1 h. The slides were then incubated with an anti-LC3B antibody (Abcam, ab51520). Finally, sections were incubated with Alexa Flour 647-conjugated donkey anti-rabbit antibody (Abcam, ab150075) and FITC-conjugated IB4 (Sigma, L2895) at 4°C overnight and nuclei were stained with 4,6 diamidino-2-phenylindole (DAPI) for 15 min. Quantification represents the average number of LC3 puncta per IB4+ cell. Both flat-mounted retinas and retinal sections were analysed using a Leica TCS SP5 Confocal microscope (Leica, Wetzlar, Germany).
Measurement of vascular leakage in retina
Microvascular leakage in mouse retina was investigated by the method of fluorescein angiography as previously described [18]. Briefly, mice were deeply anaesthetized and 1.25 mg of 500 kDa FITC-dextran (Sigma, 51923) was injected into the left ventricle. The dye was allowed to circulate for 5 min and mice were sacrificed by cervical dislocation. The eyes were enucleated and immediately fixed with 4% PFA for 45 min. Retinas were dissected and flat-mounted onto glass slides. The superficial vessels of the retinas were observed with a Leica TCS SP5 Confocal microscope (Leica, Wetzlar, Germany) and vascular leakage was quantitatively analyzed by determining fluorescence intensities of FITC-dextran extravasated from the retina vessel.
Aortic ring assays
To establish a direct action of metformin on vascular, thoracic aortae from 8-week-old C57/BL6 mice were surgically isolated, cleaned, and dissected into 0.5 mm rings. In some experiments, 8-week-old atg7flox/flox; Tek-Cre (+) mice and control atg7flox/flox; Tek-Cre (+) littermates were also used. Rings were embedded in 1 mg/mL of type I collagen (Millipore, 08–115) in a 96-well plate as described previously [78,79]. When embedded, the rings were cultured in serum-free endothelial basal medium (EBM) (Lonza, CC-3121) consisting of either NG (5.5 mM) or HG (33 mM) in the presence or absence of metformin (50 μM), mannitol (33 mM: 5.5 mM of glucose + 27.5 mM of D-mannitol) was served as the osmotic control for the HG. For signaling pathway analysis, each pathway antagonist: compound C (10 μM) or GANT61 (20 μM) was pretreated for 2 h every day before metformin administration. In some experiments, aortic rings were exposed to HG in combination with the recombinant Hh pathway ligand, SHH (10 μg/mL). For pharmacological manipulation of autophagy, aortic rings were treated with rapamycin (10 nM) 2 h after metformin treatment. Endothelial microvessel sprouts growing out from the rings were counted during the exponential growth phase to obtain angiogenic response data. Before the regression phase, rings were fixed for immunofluorescence staining of PECAM1/CD31 (Abcam, ab24590). Pictures were taken on day 12, and the total number of branches was counted using ImageJ (National Institutes of Health, Bethesda, Maryland, USA).
In vitro angiogenesis (tube formation) assay
The in vitro angiogenic activity of HUVECs was determined by Matrigel tube formation assay. Briefly, after the experimental period, HUVECs were stained with cell-permeable dye, calcein (Corning, 354216), for 30 min and replated in 24-well plates precoated with 150 μL/well growth factor–reduced Matrigel (Corning, 354234) and incubated at 37°C in cell culture incubator. After 12 h of incubation, capillary-like tube formation was observed with a computer-assisted microscope (EVOS FL Imaging System, Thermo Fisher Scientific, Waltham, MA, USA). Tube formation was defined as a tube-like structure exhibiting a length four times its width. The tube lenth in duplicate wells were counted and averaged using ImageJ software (National Institutes of Health, Bethesda, Maryland, USA).
Luciferase assays
HUVECs were transfected with pRL-TK, 8× GLI BS-FL (or mutant 8× GLI BS-FL) as previously described [80]. Twenty-four h after transfection, the cells were seeded in 6-well plates at a density of 1 × 10⁶ cells per well and allowed to reach confluence. Luciferase activity was measured in cell lysates using the Dual-Luciferase Reporter Assay System (Promega, E1910). Firefly luciferase and Renilla luciferase were detected on a Veritas Microplate Luminometer (Promega, Madison, WI, USA). The Firefly luciferase:Renilla luciferase ratio was calculated for each sample and was normalized to the ratio measured for the NG-cultured cells.
Immunoblotting analysis
Briefly, the protein concentration was determined using Pierce BCA Protein Assay Reagent (Thermo Fisher Scientific, 23228). 30 μg protein from each sample was resolved by SDS-PAGE on Tris-glycine gels, and transferred to polyvinylidene fluoride membrane. Membranes were blocked with 5% bovine serum albumin (Sigma, B2064) in Tris-buffered saline (Sigma, T5030) containing 0.1% Tween 20 (Sigma, 93773) (TBST) and incubated with primary antibodies overnight at 4°C. Membranes were washed 3 times for 5 min with TBST, incubated with either HRP-goat-anti-mouse (Abcam, ab6789) or HRP-goat-anti-rabbit (Abcam, ab6721) secondary antibodies for 1 h at room temperature. Primary antibodies included: active CASP9 (Abcam, ab2324), active CASP8 (Merck KGaA, MAB10754), active CASP3 (Merck KGaA, PC679), GLI1 (Thermo Scientific, PA5-23411), GLI2 (Merck KGaA, ABN506), GLI3 (Merck KGaA, MABS275), SMO (Abcam, ab38686), PTCH1 (Abcam, ab53715), LC3B (Abcam, ab51520), BNIP3 (Cell Signaling Technology, 44060), BCL2 (Cell Signaling Technology, 15071), BECN1 (Cell Signaling Technology, 3495), PRKAA1/2 (Abcam, ab80039), phospho-PRKAA1/2 (Abcam, ab23875), phospho-ACAC/acetyl-CoA carboxylase (Ser79; Cell Signaling Technology, 11818), ACAC/acetyl-CoA carboxylase (Cell Signaling Technology, 3676), ATG3 (Cell Signaling Technology, 3415), ATG5 (Cell Signaling Technology, 12994), ATG7 (Thermo Scientific, PA5-35203), ATG12 (Cell Signaling Technology, 4180), HHIP (Santa Cruz Biotechnology, sc-293265). Bound antibody was visualized using Pierce ECL plus western blotting substrate (Thermo Scientific, 32132). The protein bands were analyzed with a ChemiDoc MP device (Bio-Rad, Hercules, CA, USA) and quantified using ImageQuant 5.2 software (Molecular Dynamics, Sunnyvale, CA). The expression of GAPDH (glyceraldehyde-3-phosphate dehydrogenase) (Abcam, ab9485) was used as a loading control.
Immunoprecipitation
HUVECs were lysed with IGEPAL CA-630 buffer (50 mM Tris-HCl, pH 7.4, [Sigma, T5030], 1% IGEPAL CA-630 [Sigma, I8896], 10 mM EDTA, 150 mM NaCl, 50 mM NaF, 1 μM leupeptin [Sigma, L5793], 0.1 μM aprotinin [Sigma, SRE0050]). Primary antibody was covalently immobilized on protein A/G agarose using the Pierce Crosslink Immunoprecipitation Kit according to the manufacturer’s instructions (Thermo Scientific, 26147). Samples were incubated with immobilized antibody beads for at least 2 h at 4°C. Cell lysates were also subjected to immunoprecipitation with either mouse IgG1 isotype control (Cell Signaling Technology, 5415) or rabbit IgG isotype control (Cell Signaling Technology, 3900) according to the immunoglobulin type of primary antibody. After immunoprecipitation, the samples were washed with TBS 5 times. They were then eluted with glycine-HCl (0.1 M, pH 3.5) and the immunoprecipitates were subjected to immunoblotting using specific primary antibodies.
TUNEL staining in cultured HUVECs
HUVECs were fixed in PBS containing 4% PFA. Staining was performed using the In situ Cell Death Detection kit (Roche, 11684795910) in accordance with the manufacturer’s protocol. In brief, the cultured cells were cultivated on CultureSlides (BD Biosciences, 354114) and treated as indicated. The cells were subsequently washed 3 times with ice-cold PBS and fixed in a freshly prepared 4% PFA. After 10 min of fixation, the cells were washed twice with PBS and permeabilized in a freshly prepared permeabilization solution (0.1% Triton X-100, 0.1% sodium citrate) for 10 min. Afterward, the cells were incubated with a TUNEL reaction mixture for 60 min at 37°C in a humidified atmosphere in the dark. After washing twice with PBS, the samples were mounted using a ProLong antifade reagent (Molecular Probes, 36934) and were imaged using a Leica TCS SP5 Confocal microscope (Leica, Wetzlar, Germany).
Electron microscopy
Conventional electron microscopy was performed as described previously [81]. In brief, HUVECs were fixed in Karnofsky fixative and then postfixed in 1% osmium tetraoxide, dehydrated in a graded series of acetone concentrations, and embedded in Sparr resin. Sections of 98-nm thickness were placed on copper grids that were double-stained with uranyl acetate and lead citrate. Discs were examined with a JEOL 1200 electron microscope (JEOL, Tokyo, Japan).
Detection of GFP-LC3B
HUVECs grown on gelatinized coverslips were transduced with Ad-GFP-LC3B. After 48 h, medium was changed to complete, glucose-free or amino acid-free medium. After transfection, HUVECs under each experimental condition were observed under the Leica TCS SP5 Confocal microscope (Leica, Wetzlar, Germany).
Immunofluorescence staining
For quantification of PECAM1-positive area, immunofluorescence staining was performed within the aortic wall. Paraffin sections (5 µm) were cut and incubated with anti-PECAM1 (Abcam, ab24590). After washing, samples were incubated with Alexa Fluor 647-conjugated anti-mouse IgG secondary antibody (Abcam, ab150115) at a dilution of 1:200 for 60 min at room temperature. Cell nuclei were labelled by DAPI. The total tissue area and the PECAM1-positive area were analysed with a Leica TCS SP5 Confocal microscope (Leica, Wetzlar, Germany) and quantified with ImageJ software (National Institutes of Health, Bethesda, Maryland, USA). Data were expressed as percentage of positive staining area per analyzed area.
For immunofluorescence staining in HUVECs, the cells were fixed with 4% formaldehyde, permeabilized with 0.1% Triton X-100 and incubated with anti-HHIP (Santa Cruz Biotechnology, sc-293265). After washing, cells were incubated with Alexa Fluor 647-conjugated anti-mouse IgG secondary antibody (Abcam, ab150115) at a dilution of 1:200 for 60 min at room temperature. Cell nuclei were labelled by DAPI. The images were obtained using a Leica TCS SP5 Confocal microscope (Leica, Wetzlar, Germany) and the fluorescent intensity was quantified with ImageJ software (National Institutes of Health, Bethesda, Maryland, USA).
Adenovirus constructs
Recombinant adenovirus vectors were constructed, propagated and titered as previously described [82]. Briefly, pBHGloxΔE1,3 Cre plasmid (Microbix, PD-01–40), including the ΔE1 adenoviral genome, was cotransfected with the pDC316 shuttle vector (Microbix, PD-01–28) containing the gene of interest into HEK293 cells using Lipofectamine 2000 (Life Technologies, 11668019). Through homologous recombination, the test genes were integrated into the E1-deleted adenoviral genome. The viruses were propagated in HEK293 cells. We made replication-defective human adenovirus type 5 (devoid of E1) harboring human BNIP3 or GLI1. The generation of adenoviruses harboring GFP-LC3B has been described [83]. An in-house–generated Ad-LacZ was used as a control.
For adenovirus-mediated gene transfer, these constructed adenovirus vectors were transfected into HUVECs at a MOI of 100× PFU/cell for 48 h. After 48 h, the overexpression efficiency was evaluated.
Construction of shRNA adenoviral expression vectors
The pSilencer 2.1-U6 expression vector was purchased from Ambion (Ambion, AM5762). The RNU6-1 RNA polymerase III promoter and the polylinker region were subcloned into the adenoviral shuttle vector pDC311 (Microbix, PD-01–25). The GLI1 shRNA targeting sequence was 5ʹ- CCGTCCTGCTCCAGCTAGA −3ʹ. The GLI2 shRNA targeting sequence was 5ʹ- GATCTGGACAGGGATGACT −3ʹ. The GLI3 shRNA targeting sequence was 5ʹ- CCGCCTTATCTAGTAGCCCTA −3ʹ. The ATG7 shRNA targeting sequence was 5ʹ- CCAAGGTCAAAGGACGAAGAT- 3ʹ. The BNIP3 shRNA targeting sequence was 5ʹ- GGAATTAAGTCTCCGATTA −3ʹ. For Scrambled shRNA, an in-house-generated shRNA adenovirus that encodes a scrambled sequence was used as control. Recombinant adenoviruses were generated by homologous recombination in HEK293 cells as described above.
For adenovirus-mediated gene knockdown, these constructed adenovirus vectors were transfected into HUVECs at a MOI of 100× PFU/cell for 96 h. After 96 h, the knockdown efficiency was evaluated.
Adeno-associated virus production
Recombinant virus was produced as described below. Briefly, murine Gli1, Atg7 shRNA (Gli1 shRNA targeting sequence was 5ʹ- CCTGTGTACCACATGACTCTA −3ʹ, Atg7 shRNA targeting sequence was 5ʹ- CAGTTTGGCACAATCAATA −3ʹ) or a scrambled sequence was initially inserted into a rAAV plasmid consisting of the vector genome, a murine vascular Cdh5 core promoter and AAV ITRs flanking the expression cassette. Meanwhile, we have constructed the rAAV to deliver the murine Gli1 cDNA under the control of murine Cdh5 core promoter. An in-house–generated AAV-LacZ was used as a control. To generate virus, the plasmid carrying the target gene cassette was cotransfected into HEK 293 cells with a packaging plasmid and an adenovirus helper plasmid. The packaged, recombinant viral particles were then purified by a CsCl gradient sedimentation method, desalted by dialysis and subjected to a quality control analysis as described [84].
Statistical analysis
Results are expressed as means ± SEM. Statistical differences were assessed with the unpaired 2-tailed Student t test for 2 experimental groups and one-way ANOVA for multiple groups with SPSS software. Bonferroni post-hoc testing was employed after ANOVA for testing for significant differences between groups. A two-tailed P value of less than 0.05 was considered statistically significant. Statistical analyses were done using GraphPad Prism (GraphPad Software).
Funding Statement
This work was supported by the National Natural Science Foundation of China under Grants [81770498, 81773346, 81573069, 81570368, 81600304] and the Public Projects of Wenzhou under Grant [Y20160001].
Disclosure statement
No potential conflict of interest was reported by the authors.
Supplementary material
Supplemental data for this article can be accessed on the publisher’s website.
References
- [1].Whiting DR, Guariguata L, Weil C, et al. IDF diabetes atlas: global estimates of the prevalence of diabetes for 2011 and 2030. Diabetes Res Clin Pract. 2011;94:311–321. [DOI] [PubMed] [Google Scholar]
- [2].Chen L, Magliano DJ, Zimmet PZ.. The worldwide epidemiology of type 2 diabetes mellitus–present and future perspectives. Nat Rev Endocrinol. 2011;8:228–236. [DOI] [PubMed] [Google Scholar]
- [3].Grundy SM, Howard B, Smith S Jr, et al. Prevention Conference VI: diabetes and Cardiovascular Disease: executive summary: conference proceeding for healthcare professionals from a special writing group of the American Heart Association. Circulation. 2002;105:2231–2239. [DOI] [PubMed] [Google Scholar]
- [4].Erusalimsky JD. Vascular endothelial senescence: from mechanisms to pathophysiology. J Appl Physiol. 2009;106:326–332. [DOI] [PMC free article] [PubMed] [Google Scholar]
- [5].Yang J, Holman GD. Long-term metformin treatment stimulates cardiomyocyte glucose transport through an AMP-activated protein kinase-dependent reduction in GLUT4 endocytosis. Endocrinology. 2006;147:2728–2736. [DOI] [PubMed] [Google Scholar]
- [6].Viollet B, Guigas B, Sanz Garcia N, et al. Cellular and molecular mechanisms of metformin: an overview. Clin Sci (Lond). 2012;122:253–270. [DOI] [PMC free article] [PubMed] [Google Scholar]
- [7].Mather KJ, Verma S, Anderson TJ. Improved endothelial function with metformin in type 2 diabetes mellitus. J Am Coll Cardiol. 2001;37:1344–1350. [DOI] [PubMed] [Google Scholar]
- [8].Klionsky DJ, Emr SD. Autophagy as a regulated pathway of cellular degradation. Science. 2000;290:1717–1721. [DOI] [PMC free article] [PubMed] [Google Scholar]
- [9].Ravikumar B, Sarkar S, Davies JE, et al. Regulation of mammalian autophagy in physiology and pathophysiology. Physiol Rev. 2010;90:1383–1435. [DOI] [PubMed] [Google Scholar]
- [10].Chen F, Chen B, Xiao FQ, et al. Autophagy protects against senescence and apoptosis via the RAS-mitochondria in high-glucose-induced endothelial cells. Cell Physiol Biochem. 2014;33:1058–1074. [DOI] [PubMed] [Google Scholar]
- [11].Kim KA, Shin YJ, Akram M, et al. High glucose condition induces autophagy in endothelial progenitor cells contributing to angiogenic impairment. Biol Pharm Bull. 2014;37:1248–1252. [DOI] [PubMed] [Google Scholar]
- [12].Hu P, Lai D, Lu P, et al. ERK and Akt signaling pathways are involved in advanced glycation end product-induced autophagy in rat vascular smooth muscle cells. Int J Mol Med. 2012;29:613–618. [DOI] [PMC free article] [PubMed] [Google Scholar]
- [13].Nguyen TM, Subramanian IV, Kelekar A, et al. Kringle 5 of human plasminogen, an angiogenesis inhibitor, induces both autophagy and apoptotic death in endothelial cells. Blood. 2007;109:4793–4802. [DOI] [PubMed] [Google Scholar]
- [14].Buraschi S, Neill T, Goyal A, et al. Decorin causes autophagy in endothelial cells via Peg3. Proc Natl Acad Sci USA. 2013;110:E2582–91. [DOI] [PMC free article] [PubMed] [Google Scholar]
- [15].Ramakrishnan S, Nguyen TM, Subramanian IV, et al. Autophagy and angiogenesis inhibition. Autophagy. 2007;3:512–515. [DOI] [PubMed] [Google Scholar]
- [16].Bansode RR, Ahmedna M, Svoboda KR, et al. Coupling in vitro and in vivo paradigm reveals a dose dependent inhibition of angiogenesis followed by initiation of autophagy by C6-ceramide. Int J Biol Sci. 2011;7:629–644. [DOI] [PMC free article] [PubMed] [Google Scholar]
- [17].Lee SJ, Kim HP, Jin Y, et al. Beclin 1 deficiency is associated with increased hypoxia-induced angiogenesis. Autophagy. 2011;7:829–839. [DOI] [PMC free article] [PubMed] [Google Scholar]
- [18].Lee YJ, Jung SH, Kim SH, et al. Essential role of transglutaminase 2 in vascular endothelial growth factor-induced vascular leakage in the retina of diabetic mice. Diabetes. 2016;65:2414–2428. [DOI] [PubMed] [Google Scholar]
- [19].Brill A, Elinav H, Varon D. Differential role of platelet granular mediators in angiogenesis. Cardiovasc Res. 2004;63:226–235. [DOI] [PubMed] [Google Scholar]
- [20].Dowling RJ, Zakikhani M, Fantus IG, et al. Metformin inhibits mammalian target of rapamycin-dependent translation initiation in breast cancer cells. Cancer Res. 2007;67:10804–10812. [DOI] [PubMed] [Google Scholar]
- [21].Fryer LG, Parbu-Patel A, Carling D. The Anti-diabetic drugs rosiglitazone and metformin stimulate AMP-activated protein kinase through distinct signaling pathways. J Biol Chem. 2002;277:25226–25232. [DOI] [PubMed] [Google Scholar]
- [22].Asai J, Takenaka H, Kusano KF, et al. Topical sonic hedgehog gene therapy accelerates wound healing in diabetes by enhancing endothelial progenitor cell-mediated microvascular remodeling. Circulation. 2006;113:2413–2424. [DOI] [PubMed] [Google Scholar]
- [23].Byrd N, Grabel L. Hedgehog signaling in murine vasculogenesis and angiogenesis. Trends Cardiovasc Med. 2004;14:308–313. [DOI] [PubMed] [Google Scholar]
- [24].Calcutt NA, Allendoerfer KL, Mizisin AP, et al. Therapeutic efficacy of sonic hedgehog protein in experimental diabetic neuropathy. J Clin Invest. 2003;111:507–514. [DOI] [PMC free article] [PubMed] [Google Scholar]
- [25].Luo JD, Hu TP, Wang L, et al. Sonic hedgehog improves delayed wound healing via enhancing cutaneous nitric oxide function in diabetes. Am J Physiol Endocrinol Metab. 2009;297:E525–31. [DOI] [PMC free article] [PubMed] [Google Scholar]
- [26].Bishop B, Aricescu AR, Harlos K, et al. Structural insights into hedgehog ligand sequestration by the human hedgehog-interacting protein HHIP. Nat Struct Mol Biol. 2009;16:698–703. [DOI] [PMC free article] [PubMed] [Google Scholar]
- [27].Klionsky DJ, Abdelmohsen K, Abe A, et al. Guidelines for the use and interpretation of assays for monitoring autophagy (3rd edition). Autophagy. 2016;12:1–222. [DOI] [PMC free article] [PubMed] [Google Scholar]
- [28].Yamamoto A, Tagawa Y, Yoshimori T, et al. Bafilomycin A1 prevents maturation of autophagic vacuoles by inhibiting fusion between autophagosomes and lysosomes in rat hepatoma cell line, H-4-II-E cells. Cell Struct Funct. 1998;23:33–42. [DOI] [PubMed] [Google Scholar]
- [29].Kim J, Kundu M, Viollet B, et al. AMPK and mTOR regulate autophagy through direct phosphorylation of Ulk1. Nat Cell Biol. 2011;13:132–141. [DOI] [PMC free article] [PubMed] [Google Scholar]
- [30].Varadi KH, Katus HA, Mueller OJ. Targeted adeno-associated virus (AAV) vector for efficient gene transfer into endothelial cells in vivo [abstract]. Cardiovasc Res. 2014;103:S42. [Google Scholar]
- [31].Kisanuki YY, Hammer RE, Miyazaki J, et al. Tie2-Cre transgenic mice: a new model for endothelial cell-lineage analysis in vivo. Dev Biol. 2001;230:230–242. [DOI] [PubMed] [Google Scholar]
- [32].Jimenez-Sanchez M, Menzies FM, Chang YY, et al. The Hedgehog signalling pathway regulates autophagy. Nat Commun. 2012;3:1200. [DOI] [PMC free article] [PubMed] [Google Scholar]
- [33].Bai CB, Joyner AL. Gli1 can rescue the in vivo function of Gli2. Development. 2001;128:5161–5172. [DOI] [PubMed] [Google Scholar]
- [34].Wang B, Fallon JF, Beachy PA. Hedgehog-regulated processing of Gli3 produces an anterior/posterior repressor gradient in the developing vertebrate limb. Cell. 2000;100:423–434. [DOI] [PubMed] [Google Scholar]
- [35].Meijer WH, van der Klei IJ, Veenhuis M, et al. ATG genes involved in non-selective autophagy are conserved from yeast to man, but the selective Cvt and pexophagy pathways also require organism-specific genes. Autophagy. 2007;3:106–116. [DOI] [PubMed] [Google Scholar]
- [36].Lei K, Davis RJ. JNK phosphorylation of Bim-related members of the Bcl2 family induces Bax-dependent apoptosis. Proc Natl Acad Sci USA. 2003;100:2432–2437. [DOI] [PMC free article] [PubMed] [Google Scholar]
- [37].Ma X, Godar RJ, Liu H, et al. Enhancing lysosome biogenesis attenuates BNIP3-induced cardiomyocyte death. Autophagy. 2012;8:297–309. [DOI] [PMC free article] [PubMed] [Google Scholar]
- [38].Liang XH, Jackson S, Seaman M, et al. Induction of autophagy and inhibition of tumorigenesis by beclin 1. Nature. 1999;402:672–676. [DOI] [PubMed] [Google Scholar]
- [39].Levine B, Sinha SC, Kroemer G. Bcl-2 family members: dual regulators of apoptosis and autophagy. Autophagy. 2008;4:600–606. [DOI] [PMC free article] [PubMed] [Google Scholar]
- [40].Pattingre S, Tassa A, Qu X, et al. Bcl-2 antiapoptotic proteins inhibit Beclin 1-dependent autophagy. Cell. 2005;122:927–939. [DOI] [PubMed] [Google Scholar]
- [41].Maiuri MC, Le Toumelin G, Criollo A, et al. Functional and physical interaction between Bcl-X(L) and a BH3-like domain in Beclin-1. Embo J. 2007;26:2527–2539. [DOI] [PMC free article] [PubMed] [Google Scholar]
- [42].Sun Y, Guo W, Ren T, et al. Gli1 inhibition suppressed cell growth and cell cycle progression and induced apoptosis as well as autophagy depending on ERK1/2 activity in human chondrosarcoma cells. Cell Death Dis. 2014;5:e979. [DOI] [PMC free article] [PubMed] [Google Scholar]
- [43].Xie Z, Lau K, Eby B, et al. Improvement of cardiac functions by chronic metformin treatment is associated with enhanced cardiac autophagy in diabetic OVE26 mice. Diabetes. 2011;60:1770–1778. [DOI] [PMC free article] [PubMed] [Google Scholar]
- [44].Mellor KM, Bell JR, Young MJ, et al. Myocardial autophagy activation and suppressed survival signaling is associated with insulin resistance in fructose-fed mice. J Mol Cell Cardiol. 2011;50:1035–1043. [DOI] [PubMed] [Google Scholar]
- [45].Las G, Shirihai OS. The role of autophagy in β-cell lipotoxicity and type 2 diabetes. Diabetes Obes Metab. 2010;2:15–19. [DOI] [PMC free article] [PubMed] [Google Scholar]
- [46].Kroemer G, Mariño G, Levine B. Autophagy and the integrated stress response. Mol Cell. 2010;40:280–293. [DOI] [PMC free article] [PubMed] [Google Scholar]
- [47].Murrow L, Debnath J. Autophagy as a stress-response and quality-control mechanism: implications for cell injury and human disease. Annu Rev Pathol. 2013;8:105–137. [DOI] [PMC free article] [PubMed] [Google Scholar]
- [48].Torisu T, Torisu K, Lee IH, et al. Autophagy regulates endothelial cell processing, maturation and secretion of von Willebrand factor. Nat Med. 2013;19:1281–1287. [DOI] [PMC free article] [PubMed] [Google Scholar]
- [49].Levine B, Kroemer G. Autophagy in the pathogenesis of disease. Cell. 2008;132:27–42. [DOI] [PMC free article] [PubMed] [Google Scholar]
- [50].Cittadini A, Napoli R, Monti MG, et al. Metformin prevents the development of chronic heart failure in the SHHF rat model. Diabetes. 2012;61:944–953. [DOI] [PMC free article] [PubMed] [Google Scholar]
- [51].Sena CM, Matafome P, Louro T, et al. Metformin restores endothelial function in aorta of diabetic rats. Br J Pharmacol. 2011;163:424–437. [DOI] [PMC free article] [PubMed] [Google Scholar]
- [52].Arunachalam G, Lakshmanan AP, Samuel SM, et al. Molecular interplay between microRNA-34a and sirtuin1 in hyperglycemia-mediated impaired angiogenesis in endothelial cells: effects of metformin. J Pharmacol Exp Ther. 2016;356:314–323. [DOI] [PubMed] [Google Scholar]
- [53].Ghosh S, Lakshmanan AP, Hwang MJ, et al. Metformin improves endothelial function in aortic tissue and microvascular endothelial cells subjected to diabetic hyperglycaemic conditions. Biochem Pharmacol. 2015;98:412–421. [DOI] [PubMed] [Google Scholar]
- [54].Tan BK, Adya R, Chen J, et al. Metformin decreases angiogenesis via NF-kappaB and Erk1/2/Erk5 pathways by increasing the antiangiogenic thrombospondin-1. Cardiovasc Res. 2009;83:566–574. [DOI] [PubMed] [Google Scholar]
- [55].Ersoy C, Kiyici S, Budak F, et al. The effect of metformin treatment on VEGF and PAI-1 levels in obese type 2 diabetic patients. Diabetes Res Clin Pract. 2008;81:56–60. [DOI] [PubMed] [Google Scholar]
- [56].Rattan R, Graham RP, Maguire JL, et al. Metformin suppresses ovarian cancer growth and metastasis with enhancement of cisplatin cytotoxicity in vivo. Neoplasia. 2011;13:483–491. [DOI] [PMC free article] [PubMed] [Google Scholar]
- [57].Liao H, Zhou Q, Gu Y, et al. Luteinizing hormone facilitates angiogenesis in ovarian epithelial tumor cells and metformin inhibits the effect through the mTOR signaling pathway. Oncol Rep. 2012;27:1873–1878. [DOI] [PubMed] [Google Scholar]
- [58].Nakamura M, Ogo A, Yamura M, et al. Metformin suppresses sonic hedgehog expression in pancreatic cancer cells. Anticancer Res. 2014;34:1765–1769. [PubMed] [Google Scholar]
- [59].Fan C, Wang Y, Liu Z, et al. Metformin exerts anticancer effects through the inhibition of the Sonic hedgehog signaling pathway in breast cancer. Int J Mol Med. 2015;36:204–214. [DOI] [PMC free article] [PubMed] [Google Scholar] [Retracted]
- [60].Renault MA, Roncalli J, Tongers J, et al. The Hedgehog transcription factor Gli3 modulates angiogenesis. Circ Res. 2009;105:818–826. [DOI] [PMC free article] [PubMed] [Google Scholar]
- [61].Strasser A. The role of BH3-only proteins in the immune system. Nat Rev Immunol. 2005;5:189–200. [DOI] [PubMed] [Google Scholar]
- [62].Elgendy M, Sheridan C, Brumatti G, et al. Oncogenic Ras-induced expression of Noxa and Beclin-1 promotes autophagic cell death and limits clonogenic survival. Mol Cell. 2011;42:23–35. [DOI] [PubMed] [Google Scholar]
- [63].Wang Q, Zhang M, Torres G, et al. Metformin suppresses diabetes-accelerated atherosclerosis via the inhibition of Drp1-mediated mitochondrial fission. Diabetes. 2017;66:193–205. [DOI] [PMC free article] [PubMed] [Google Scholar]
- [64].Xu L, Wang JG, Kong L, et al. Protection of retinal photoreceptors by activation of AMPK with metformin [abstract]. Invest Ophth Vis Ssi. 2011;52:5434. [Google Scholar]
- [65].Rodríguez-Muela N, Germain F, Mariño G, et al. Autophagy promotes survival of retinal ganglion cells after optic nerve axotomy in mice. Cell Death Differ. 2012;19:162–169. [DOI] [PMC free article] [PubMed] [Google Scholar]
- [66].Fujimoto K, Hanson PT, Tran H, et al. Autophagy regulates pancreatic beta cell death in response to Pdx1 deficiency and nutrient deprivation. J Biol Chem. 2009;284:27664–27673. [DOI] [PMC free article] [PubMed] [Google Scholar]
- [67].Komatsu M, Waguri S, Ueno T, et al. Impairment of starvation-induced and constitutive autophagy in Atg7-deficient mice. J Cell Biol. 2005;169:425–434. [DOI] [PMC free article] [PubMed] [Google Scholar]
- [68].Koni PA, Joshi SK, Temann UA, et al. Conditional vascular cell adhesion molecule 1 deletion in mice: impaired lymphocyte migration to bone marrow. J Exp Med. 2001;193:741–754. [DOI] [PMC free article] [PubMed] [Google Scholar]
- [69].Schlaeger TM, Bartunkova S, Lawitts JA, et al. Uniform vascular-endothelial-cell-specific gene expression in both embryonic and adult transgenic mice. Proc Natl Acad Sci USA. 1997;94:3058–3063. [DOI] [PMC free article] [PubMed] [Google Scholar]
- [70].Alva JA, Zovein AC, Monvoisin A, et al. VE-Cadherin-Cre-recombinase transgenic mouse: a tool for lineage analysis and gene deletion in endothelial cells. Dev Dyn. 2006;235:759–767. [DOI] [PubMed] [Google Scholar]
- [71].Dudus L, Anand V, Acland GM, et al. Persistent transgene product in retina, optic nerve and brain after intraocular injection of rAAV. Vision Res. 1999;39:2545–2553. [DOI] [PubMed] [Google Scholar]
- [72].Tucker GT, Casey C, Phillips PJ, et al. Metformin kinetics in healthy subjects and in patients with diabetes mellitus. Br J Clin Pharmacol. 1981;12:235–246. [DOI] [PMC free article] [PubMed] [Google Scholar]
- [73].Sambol NC, Chiang J, O’Conner M, et al. Pharmacokinetics and pharmacodynamics of metformin in healthy subjects and patients with noninsulin-dependent diabetes mellitus. J Clin Pharmacol. 1996;36:1012–1021. [DOI] [PubMed] [Google Scholar]
- [74].Davis BJ, Xie Z, Viollet B, et al. Activation of the AMP-activated kinase by antidiabetes drug metformin stimulates nitric oxide synthesis in vivo by promoting the association of heat shock protein 90 and endothelial nitric oxide synthase. Diabetes. 2006;55:496–505. [DOI] [PubMed] [Google Scholar]
- [75].Gan L, Liu Z, Luo D, et al. Reduced endoplasmic reticulum stress-mediated autophagy is required for leptin alleviating inflammation in adipose tissue. Front Immunol. 2017;8:1507. [DOI] [PMC free article] [PubMed] [Google Scholar]
- [76].Shah AV, Birdsey GM, Peghaire C, et al. The endothelial transcription factor ERG mediates Angiopoietin-1-dependent control of Notch signalling and vascular stability. Nat Commun. 2017;8:16002. [DOI] [PMC free article] [PubMed] [Google Scholar]
- [77].Rodrigues M, Xin X, Jee K, et al. VEGF secreted by hypoxic Müller cells induces MMP-2 expression and activity in endothelial cells to promote retinal neovascularization in proliferative diabetic retinopathy. Diabetes. 2013;62:3863–3873. [DOI] [PMC free article] [PubMed] [Google Scholar]
- [78].Baker M, Robinson SD, Lechertier T, et al. Use of the mouse aortic ring assay to study angiogenesis. Nat Protoc. 2011;7:89–104. [DOI] [PubMed] [Google Scholar]
- [79].Aplin AC, Fogel E, Zorzi P, et al. The aortic ring model of angiogenesis. Methods Enzymol. 2008;443:119–136. [DOI] [PubMed] [Google Scholar]
- [80].Petrova E, Rios-Esteves J, Ouerfelli O, et al. Inhibitors of Hedgehog acyltransferase block Sonic Hedgehog signaling. Nat Chem Biol. 2013;9:247–249. [DOI] [PMC free article] [PubMed] [Google Scholar]
- [81].Ikeda Y, Shirakabe A, Maejima Y, et al. Endogenous Drp1 mediates mitochondrial autophagy and protects the heart against energy stress. Circ Res. 2015;116:264–278. [DOI] [PubMed] [Google Scholar]
- [82].Maejima Y, Kyoi S, Zhai P, et al. Mst1 inhibits autophagy by promoting the interaction between Beclin1 and Bcl-2. Nat Med. 2013;19:1478–1488. [DOI] [PMC free article] [PubMed] [Google Scholar]
- [83].Hariharan N, Maejima Y, Nakae J, et al. Deacetylation of FoxO by Sirt1 plays an essential role in mediating starvation-induced autophagy in cardiac myocytes. Circ Res. 2010;107:1470–1482. [DOI] [PMC free article] [PubMed] [Google Scholar]
- [84].Tang M, Gao G, Rueda CB, et al. Brain microvasculature defects and Glut1 deficiency syndrome averted by early repletion of the glucose transporter-1 protein. Nat Commun. 2017;8:14152. [DOI] [PMC free article] [PubMed] [Google Scholar]
Associated Data
This section collects any data citations, data availability statements, or supplementary materials included in this article.