

Abstract
DNA mutations are known cancer drivers. Here, we investigated if mRNA events that are upregulated in cancer can functionally mimic the outcome of genetic alterations. 3′-seq or RNA-seq were applied to normal and malignant B cells from chronic lymphocytic leukemia (CLL; N = 59)1–3. We discovered widespread upregulation of truncated mRNAs and proteins in primary CLL cells that were not generated by genetic alterations but occurred through intronic polyadenylation (IPA). IPA-generated truncated mRNAs were recurrent (N = 330) and predominantly affected genes with tumor-suppressive functions. The IPA-generated truncated proteins often lack the tumor-suppressive functions of the corresponding full-length proteins (DICER, FOXN3), and several even acted in an oncogenic manner (CARD11, MGA, CHST11). In CLL, inactivation of tumor-suppressor genes (TSGs) through aberrant mRNA processing is substantially more prevalent than loss of TSGs through genetic events. We further identified novel TSG candidates that are inactivated by IPA in leukemia and by truncating DNA mutations in solid tumors4,5. These genes are understudied in cancer as their overall mutation rates are lower than those of well-known TSGs. Our findings show the need to go beyond genomic analyses in cancer diagnostics, as mRNA events that are silent at the DNA level are widespread contributors to cancer pathogenesis through inactivation of TSGs.
In addition to DNA-based mutations, recent studies found that alterations in mRNA processing, including splicing, promote tumorigenesis6. In CLL, up to 25% of patients have mutations in ATM or SF3B1, but a third has less than two mutated driver genes and most patients (58%) only have a 13q deletion or a normal karyotype3,7–9. Here, we investigated if intronic polyadenylation (IPA) might serve as a novel driver of tumorigenesis. As 16% of genes in normal immune cells use IPA to generate truncated mRNAs that contribute to transcriptome diversity2, we hypothesized that cancer-specific IPA would generate truncated proteins that lack essential domains, and thus, may phenocopy truncating (TR) mutations (Fig. 1a).
Figure 1. Hundreds of genes generate recurrent CLL-IPAs.

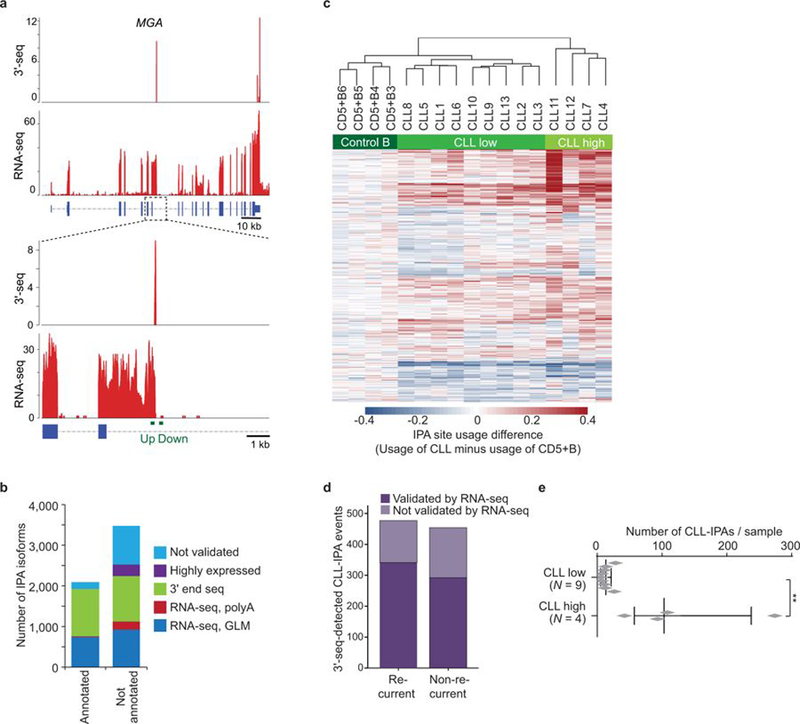
(a) Schematic showing full-length mRNA and protein expression in normal cells and generation of a truncated mRNA and protein through cancer-specific IPA, despite no difference in DNA sequence. Polyadenylation sites (pA) are shown in light green. Loss of essential protein domains (dark green boxes) through cancer-gained IPA may inactivate TSGs, thus contributing to cancer pathogenesis. (b) Representative CLL-IPAs (from N = 330) are shown. mRNA 3′ ends detected by 3′-seq are depicted as peaks whose height corresponds to transcript abundance shown in transcripts per million (TPM). The bottom panel shows RNA-seq reads and numbers correspond to read counts. MemB, memory B cells, NB, naïve B cells. Full-length and IPA-generated truncated proteins are depicted in grey, known domains are shown in green and the domains lost through IPA are named. CC, coil-coil. For CLL-IPA, the number of retained and novel amino acids (aa) and aa of full-length proteins are given. (c) Representative RNA-seq tracks from two independent CLL data sets are shown as in (b), one is indicated by ′L′. Zoom-in shows the exonized part of intron 23 of DICER1 (green). (d) Difference in relative abundance (usage) of IPA isoforms between CLL and normal CD5+B cells. A GLM was used to identify significant events. CLL-IPAs with significantly higher usage are shown in red (FDR-adjusted P value < 0.1, usage difference ≥ 0.05, TPM in CD5+B < 8) and CD5+B-IPAs are shown in blue. Grey, IPAs present in CLL and CD5+B cells without significantly different usage. (e) Number of CLL-IPAs per sample is shown as box plots, horizontal line, median; box, 25th through 75th percentile; error bars, range. CLL high, N = 21/59, median of CLL-IPAs/sample = 98 vs CLL low, N = 38/59, median = 29. Two-sided Mann-Whitney test, ***, P = 6E-10.
Using 3′-seq of 44 samples, including normal B cells and CLL, we identified 5,587 IPA isoforms, including 3,484 without previous annotation (Extended Data Table 1 and methods)1,2. We validated 4,630 IPA isoforms using RNA-seq and additional 3′ end sequencing data (Extended Data Fig. 1a, 1b)2,10. To assess IPA usage in CLL, we first identified the normal B cell subset whose gene expression profile was most closely related to CLL cells. Lymphoid tissue-derived CD5+ B (CD5+B) cells were most similar (Extended Data Fig. 2), but clustered separately from CLL samples based on IPA site usage (Extended Data Fig. 1c). Using a generalized linear model (GLM), we identified 931 IPA events with significantly higher expression among 13 CLL samples, but low or absent expression in CD5+B cells (Fig. 1b, Extended Data Fig. 1d)1,2. As CLL-IPAs are detectable by RNA-seq, we used an unrelated RNA-seq data set to validate our CLL-IPA events (Fig. 1c)3. We verified up to 71% of testable IPAs by this independent method and data set (Extended Data Fig. 1d). For further analysis, we combined the data sets (N = 59 CLL samples) and focused only on CLL-IPAs present in more than 10% of the sample cohort resulting in 330 CLL-IPAs, derived from 306 genes (Fig. 1d, Supplementary Table S1). While CLL-IPAs were detected in all CLL samples, one third of samples had a significantly higher number of CLL-IPAs (Fig. 1e, Extended Data Fig. 1e).
To investigate if CLL-IPAs express truncated proteins we performed western blots on 13 candidates. Whereas normal B cells only expressed the full-length proteins, the malignant B cells also expressed truncated proteins whose size was consistent with the predicted size of IPA-generated proteins (Fig. 2a, Extended Data Fig. 3 and 4).
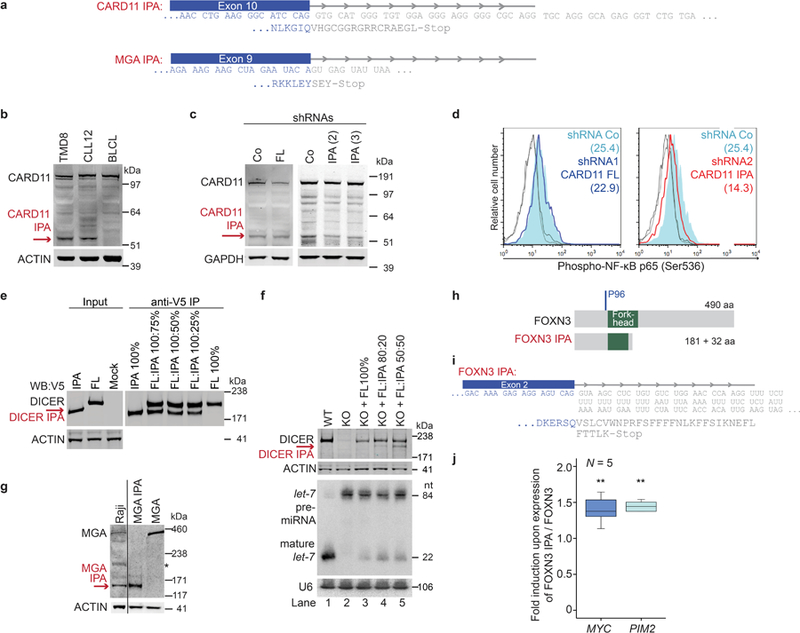
Figure 2. IPA-generated truncated proteins resemble the protein products of truncating DNA mutations and have cancer-promoting properties.

(a) 3′-seq and RNA-seq data of functionally validated CLL-IPAs (N = 5) as in Fig. 1b. The remaining tracks are shown in Extended Data Fig. 3. Endogenous full-length proteins are detected by western blot analysis in CLL and normal B cells (BLCL), whereas IPA-generated truncated proteins (red arrows) are only present in primary CLL cells. ACTIN was used as loading control on the same blot. The experiment was replicated with similar results (CARD11, N = 4, DICER, N = 3, MGA, N = 2). For gel source data see Supplementary Fig. 1. *, indicates an unspecific band. (b) Protein models are shown as in Fig. 1b. The aa positions of recurrent TR mutations are shown in blue. (c) Endogenous phospho-NF-κB-p65 levels are shown as normalized mean fluorescent intensity (MFI) values as mean ± SD from N = 5 (shRNA Control (Co), shRNA1 full-length CARD11 (FL) or N = 6 (shRNA2/3 CARD11 IPA, N = 3, each) biologically independent experiments. Two-sided Kruskal-Wallis test, **, P = 0.002; P value of two-sided Mann-Whitney test was adjusted for multiple testing, *, Padj = 0.036. (d) miRNA cleavage assay, performed twice with similar results, showing processing of pre-let-7i into mature let-7i by V5-DICER. Mock, no protein was added. V5-DICER IPA shows a complete loss of function, but no dominant-negative activity. (e) qRT-PCR of endogenous MYC target genes after expression of full-length or MGA IPA in Raji cells. Shown are GAPDH-normalized values as mean ± SD from three biological replicates, each performed in technical triplicates. Two-sided t-test for independent samples, *, P < 0.05, **, P < E-3, NS, not significant. Exact P values are shown in Supplementary Fig. 1. MGA represses all MYC target genes. Binding sites, BS.
To rule out that proteolytic cleavage truncates the proteins, we validated the presence of the IPA-generated truncated mRNAs (Extended Data Fig. 5a). Moreover, we were able to induce IPA isoform expression through downregulation of splicing factors or through inhibition of 5′ splice site recognition using an antisense oligonucleotide, indicating that de-regulated mRNA processing can cause expression of a truncated protein (Extended Data Fig. 5b)11,12.
Many of the truncated proteins generated by CLL-IPAs are strikingly similar to the predicted protein products produced by TR mutations, suggesting that CLL-IPAs may functionally mimic the outcome of genetic mutations (Fig. 2b, Extended Data Fig. 6a). To test this, we investigated the functional consequences of expression of IPA and full-length protein isoforms of four candidates in malignant B cells. CARD11 is a positive regulator of the NF-κB pathway and is important for lymphocyte survival and proliferation13. We observed substantial CARD11 IPA protein expression compared to only slightly increased CARD11 IPA mRNA expression, indicating that the truncated protein is more stable and may activate the NF-κB signaling pathway more potently than the full-length protein (Fig. 2a)14. To test this, we exclusively knocked-down either full-length or CARD11 IPA in a malignant B cell line that expresses comparable CARD11 IPA levels as CLL cells (Extended Data Fig. 6b, 6c). We measured phospho-p65 (RELA) to assess NF-κB activity and found significantly lower activity after knock-down of CARD11 IPA than of the full-length protein (Fig. 2c, Extended Data Fig. 6d). Thus, CARD11 IPA activates NF-κB more potently than full-length CARD11, suggesting that it may mimic activating mutations present in high-grade lymphomas13. CARD11 IPA may contribute to NF-κB activation in CLL where the signaling components are rarely mutated15.
DICER IPA generates a truncated protein that partially lacks the RNase IIIB domain responsible for microRNA (miRNA) processing (Fig. 2b)16. In contrast to full-length DICER, DICER IPA entirely lacks miRNA cleavage ability and mimicked TR mutations that remove both RNase III domains (Fig. 2b, 2d, Extended Data Fig. 6e, 6f)16. Although DICER IPA does not act as dominant-negative, its expression reduces functional DICER protein, thus potentially decreasing endogenous miRNA expression.
The TSG MGA is targeted by TR mutations in CLL and solid cancers (Fig. 2b)3,7,17. MGA negatively regulates the MYC transcriptional program and represses genes with MYC and E2F binding sites in a Polycomb-dependent manner18,19. Expression of MGA from constructs validated MGA IPA detected in CLL cells and confirmed the repressive effect of MGA on MYC target gene expression in malignant B cells (Fig. 2e, Extended Data Fig. 6g). Intriguingly, on genes with binding sites for both MYC and E2F, MGA IPA acts as dominant-negative regulator of full-length MGA as it significantly induced the expression of 5/6 genes in cells that endogenously express full-length MGA (Fig. 2e). However, as MGA IPA retains the N-terminal T-box, it still acts as a repressor on T-box target genes (Fig. 2e).
Lastly, the IPA isoform of the transcriptional repressor FOXN320 derepressed its oncogenic targets MYC and PIM2 (Extended Data Fig. 3, 6h–j). In summary, the CLL-IPA-generated proteins can contribute to cancer pathogenesis in various ways. Their generation can reduce expression of functional TSGs (DICER IPA, FOXN3 IPA) or they behave as dominant-negatives, thus acting in an oncogenic manner (MGA IPA).
As all functionally validated CLL-IPAs produced dysfunctional proteins, we investigated if this is a general feature. We compared the retained fraction of amino acids of IPA isoforms present in normal B cells (B-IPA, N = 2,690) with CLL-IPAs. Although the protein size of full-length proteins targeted by IPA was similar, CLL-IPAs lose significantly more amino acids than B-IPAs (Fig. 3a, Extended Data Fig. 7a). This suggests that IPA in normal cells contributes to proteome diversity2, whereas CLL-IPAs tend to produce dysfunctional proteins.
Figure 3. TSGs are enriched among CLL-IPAs. CLL-IPAs and TR mutations in CLL target the same genes but in different patients.
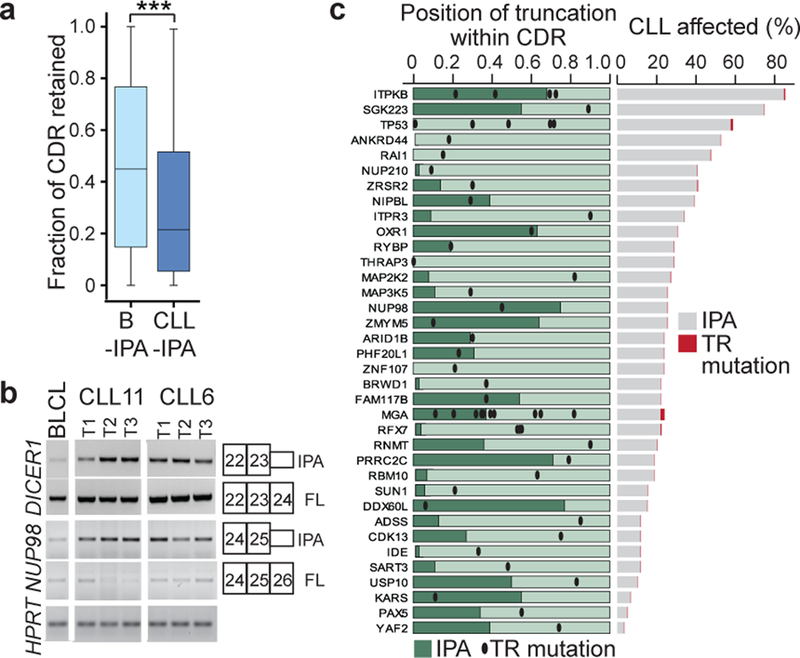
(a) The fraction of retained coding region (CDR) is shown for genes that generate CLL-IPAs (N = 306, median fraction of retained CDR = 0.21; 112 aa) and B-IPAs (N = 2,690, median fraction of retained CDR = 0.45; 221 aa). ***, Two-sided Mann-Whitney test, P = E-16. Box plots as in Fig. 1e. (b) RT-PCRs on expression of full-length (FL) and IPA isoforms for two TSGs (DICER1, NUP98) in samples from two CLL patients that were collected over a time interval of several years. CLL11: T1, 17 months (mo) after diagnosis, T2, 24 mo, T3, 44 mo; CLL6: T1, 16 mo, T2, 49 mo, T3, 91 mo (42 mo after treatment). Shown are the exons that contain primers for amplifications of the products. BLCL serve as control cells. Expression of HPRT serves as loading control. (c) Genes that are targeted by TR mutations in CLL and CLL-IPAs are shown (N = 36). Dark green bars indicate the fraction of retained CDR for each IPA-generated protein. Black dots indicate the positions of TR mutations in CLL. CLL-IPAs occur mostly in the vicinity of TR mutations or upstream of them (two-sided Wilcoxon rank sum test, P = 0.004). Right panel, the fraction of CLL samples affected is shown for each gene and represents the fraction of CLL samples (out of 59) with significantly upregulated expression of the IPA isoform (CLL-IPA, grey; TR mutations, red).
As genes targeted by TR mutations often are TSGs (Extended Data Fig. 7b)5, we investigated if TSGs are overrepresented among CLL-IPAs. Compared to protein-size matched control groups, there was a significant enrichment of TSGs among CLL-IPAs (P = 3E-5; Extended Data Fig. 7c–f). Importantly, IPA-generated truncated proteins usually lack either more or a comparable number of amino acids compared to truncated proteins generated by TR mutations, suggesting the IPA isoforms are likely inactive (Extended Data Fig. 7c). However, for CLL-IPAs to inactivate TSGs, they must also be stably expressed. For 11/12 tested CLL-IPAs, we observed stable expression at the mRNA or protein level over a four year time span (Fig. 3b, Extended Data Fig. 5c, 5d), indicating that they have the potential to inactivate TSGs.
In addition to TSGs in general, we found that genes inactivated by TR mutations in CLL are enriched among CLL-IPAs (Fig. 3c, Extended Data Fig. 7g)3,7,8. Strikingly, the fraction of samples affected by CLL-IPA was substantially larger than the number of CLL samples affected by TR mutations (3.0–85% vs 0.13–2.0%; Fig. 3c, right panel). This indicates that TR mutations and CLL-IPAs target the same genes in different patient groups, thus substantially expanding the proportion of patients with protein truncations in potential drivers.
To rule out that CLL-IPAs are caused by somatic mutations, we examined the presence of DNA mutations in the CLL-IPA genes. Two genes were targeted by TR mutations and IPA in the same patient. Interestingly, the two inactivation mechanisms are predicted to generate different truncated protein products, suggesting that they occurred independently (Extended Data Fig. 7h, 7i)3. The mutation data also enabled us to associate CLL-IPAs with specific somatic mutations. Interestingly, CLL samples with a high number of IPA were enriched in SF3B1 mutations, but they were independent of IGVH mutational status (Extended Data Fig. 7j–l).
Because of the enrichment of known TSGs among CLL-IPAs, we examined if CLL-IPAs may enable us to identify novel TSGs. We selected CLL-IPAs present in at least 20% of CLL samples (N = 199, generated from 190 genes; Fig. 4a, Supplementary Tables S1, S2). We next investigated if these genes are inactivated by TR mutations in solid cancers using mutations from more than 86,000 tumors, compiled by the MSK cbio portal4. We observed that 72% of these genes are frequently affected by TR mutations in solid tumors and call them novel TSG candidates (136/190; Fig. 4b). This is a significant enrichment over background and this list contains 17 known TSGs and 119 novel TSG candidates (Extended Data Fig. 8a, 8b)5. Again, CLL-IPAs lack more or a comparable number of amino acids as the proteins produced by TR mutations, suggesting that CLL-IPAs inactivate the functions of these genes (Extended Data Fig. 8a).
Figure 4. Novel TSG candidates are inactivated in CLL at the mRNA level and in solid tumors at the DNA level.

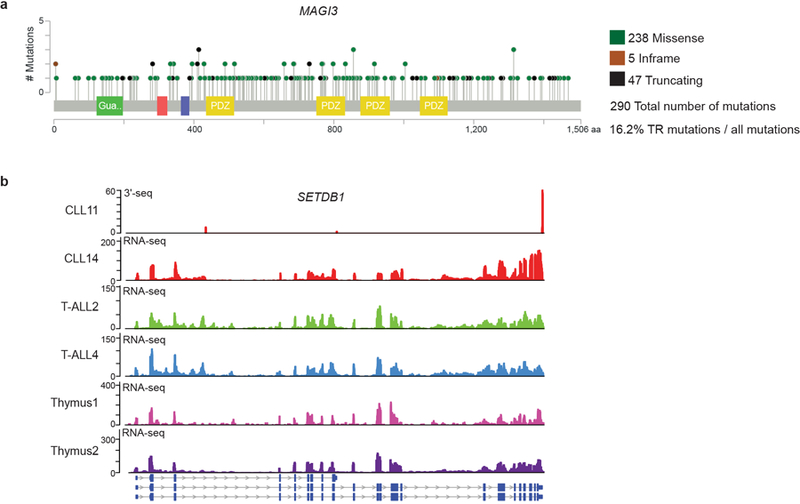
(a) Color-coded IPA usage for a subset of CLL-IPAs (97/199 of samples with significant expression of IPA in ≥ 20% of CLL samples). Gene names and number of affected CLL samples per CLL-IPA is indicated (blue bars, 3′-seq, green bars, RNA-seq). (b) Truncating mutation rates (number of TR mutations/all mutations) in solid tumors, obtained from the MSK cbio portal for genes that generate abundant CLL-IPAs, partially shown in (a). The bimodal distribution was separated at the local minimum (TR mutation/all mutations = 0.12, red line) into two gene groups: those rarely targeted by TR mutations and those with high TR mutation rates in solid cancers, defined as novel TSG candidates. (c) TR mutation rates of known and novel TSG candidates. Two-sided Mann-Whitney test, **, P = 0.0002. Box plots as in Fig. 1e. (d) As in (c), but for overall mutation rates. Two-sided Mann-Whitney test, ***, P = E-10. (e) CHST11 protein models as in Fig. 2b. Loops depict membrane domains. A chromosomal translocation in CLL results in fusion of the immunoglobulin heavy chain locus (IGH) with a truncated CHST11 (23). (f) Western blot of WNT5B, performed once, shown as in Fig. 2a, from cell lysates or conditioned media (CM) of B cells stably expressing GFP, GFP-CHST11 or GFP-CHST11 IPA. CM from cells expressing CHST11 IPA contains unglycosylated WNT5B (25). (g) CM from samples described in (f) was added to HEK293T cells expressing a WNT reporter. Shown is normalized luciferase activity as mean ± SD from N = 7 biologically independent experiments. Two-sided Kruskal-Wallis test: **, P = 0.002; P value of two-sided Mann-Whitney test was adjusted for multiple testing, **, Padj = 0.002.
Although the TR mutation rates of the novel TSG candidates were comparable with known TSGs found at the lower end of the spectrum, their protein size and overall mutation rates were substantially lower (Fig. 4c, 4d, Extended Data Fig. 8c). This may explain why these potentially cancer-relevant genes have been overlooked thus far21. As they are targeted at the mRNA level in leukemia and at the DNA level in solid cancers, they should be considered as a novel class of TSG candidates. To support this, we functionally validated a highly-recurrent CLL-IPA isoform that affected a poorly known cancer gene. CHST11 encodes a Golgi-associated carbohydrate sulfotransferase that modifies chondroitin on the surface of WNT expressing cells. The modification results in binding of secreted WNT and prevents its paracrine action22. CHST11 IPA lacks catalytic activity, but retains the cytoplasmic tail (Fig. 4e, Extended Data Fig. 8d) 23. As exclusive expression of the cytoplasmic tail of Golgi enzymes inhibited localization of full-length enzymes24, we hypothesized that CHST11 IPA may act as a dominant-negative. We expressed CHST11 and CHST11 IPA, collected the conditioned media, and detected secreted WNT in media only after expressing CHST11 IPA (Fig. 4f, Extended Data Fig. 8e, 8f)25. The conditioned media activated a WNT reporter in HEK293T cells (Fig. 4g), demonstrating that CHST11 IPA enabled paracrine WNT action on neighboring cells through dominant-negative action. Thus, in addition to mutations in the WNT pathway26, CLL-IPAs may also contribute to WNT activation in CLL.
A member of this novel class of TSGs was recently found in breast cancers, where tumor-specific expression of MAGI3 IPA generates a truncated protein with dominant-negative activity (Extended Data Fig. 9a)27. Combined with our findings on T-ALL (T-lineage acute lymphoblastic leukemia), where we detected more than 100 IPA isoforms (Extended Data Fig. 9b), these data indicate that cancer-upregulated IPA isoforms are not restricted to CLL.
In summary, we found that TSGs can be inactivated, either in full or partially, by IPA. Even partial loss of TSG function was shown to critically contribute to tumorigenesis28. As CLL-IPAs are not generated by DNA mutations in their corresponding transcription units, DNA and mRNA alterations occur in different patient groups. In CLL, the fraction of patients whose TSGs are inactivated by CLL-IPAs is considerably larger than TSG disruption by TR mutations (Fig. 3c); thus, CLL-IPAs expand substantially the number of patients with affected drivers. Moreover, this data identifies a class of TSGs that are predominantly inactivated at the mRNA rather than the DNA level27. Thus, our study demonstrates that cancer-gained changes in mRNA processing can functionally mimic the effects of somatic mutations and shows the need to go beyond genomic analyses in cancer diagnostics.
Methods
Samples for 3′-seq and RNA-seq analyses
Samples were obtained from untreated CLL patients seen at Memorial Sloan Kettering Cancer Center, New York (Extended Data Table 1a). All patients provided written informed consent before participating in the study. The sample collection was approved by the Institutional Review Board of Memorial Sloan Kettering Cancer Center. Peripheral blood mononuclear cells (PBMCs) from CLL samples with a minimum white blood cell count of 75,000/ul were isolated by Ficoll (GE Healthcare) gradient centrifugation at 400 rcf for 30 mins, followed by two washes in PBS at room temperature. Cells were treated with red blood cell lysis buffer (155 mM NH4Cl, 12 mM NaHCO3, 0.1 mM EDTA) for 5 min at room temperature and were washed twice with PBS. Pure CLL B cells were obtained from PBMCs using B-CLL isolation kit (Miltenyi Biotec). This selected untouched CLL cells using a cocktail of magnetic beads coated with CD2, CD3, CD4, CD14, CD15, CD16, CD56, CD61, CD235a, FcεRI, and CD34. The purity of CLL B cells (CD5+ and CD19+) was analyzed by FACS and the cells were immediately dissolved in TRI Reagent (Ambion) for RNA extraction, followed by 3′-seq or RNA-seq library preparation.
For longitudinal analyses, samples from two patients were investigated at different time points during the course of the disease. CLL11, time point 1 (T1) 17 months (mo) after diagnosis, T2, 24 mo after diagnosis, T3, 44 mo after diagnosis. The patient was not treated with chemotherapy during the sample collection period. CLL6: T1, 16 mo after diagnosis, T2, 49 mo, T3, 91 mo (42 mo after chemotherapeutic treatment).
In addition to the newly generated CLL 3′-seq data, we also used 3′-seq data from normal tissues, cell lines and immune cell subsets that were previously generated by us (Extended Data Table 1b)1,2.
We performed RNA-seq on 11 CLL samples (Supplementary Table S1) and obtained access to apreviously published RNA-seq data set from 44 CLL patients3 which was kindly provided by Dr. Dan A. Landau (NY Genome Center). RNA-seq data from normal immune cells were obtained from samples previously generated by us (Extended Data Table 1c)2. For validation of 3′-seq data, we also used publicly available RNA-seq (tonsil-derived NB, GSE45982 (GSM1129340-GSM1129347)29, blood-derived NB, ERR431624, ERR43158630, CD3+ T cells, GSM1576415 31 and 3′ end sequencing data10.
For RNA-seq based identification of IPA isoforms expressed in T-ALL we used publicly available RNA-seq data from 10 primary T-ALL samples and 2 whole human thymus extracts (GSE57982)32.
FACS sorting of immune cell populations
Cells were washed with ice-cold PBS once, incubated with appropriate fluorochrome-conjugated antibodies for 30 min at 4°C and washed twice with ice-cold PBS containing 0.5% FCS. The following antibodies were used: anti-CD3-PE (mouse, BD Biosciences, 555333), anti-CD5-FITC (mouse, BD Biosciences, 555352), anti-CD14-PECy7 (mouse, ebioscience, 25–0149-42), anti-CD19-APC (mouse, BD Biosciences, 555415), anti-CD27-PE (mouse BD Biosciences, 555441), anti-CD38-APC (mouse, BD Biosciences, 555462), anti-CD38-FITC (mouse, BD Biosciences, 555459). Surface protein expression was detected by a BD FACSCalibur cell analyzer (BD Biosciences) and data were analyzed using the FlowJo software.
3′-seq and RNA-seq analyses
3′-seq libraries were generated as previously described and sequenced with Illumina HiSeq using single-end 50 nt reads1,2. RNA-seq libraries were prepared at the Weill Cornell and the MSKCC Genomics core facilities.
Analysis of 3′-seq data was performed as described previously by us1 with a few modifications that are extensively described in Singh et al.2. Briefly, a gene is considered to be expressed if either the IPA isoform (≥ 5 TPM) or the full-length isoform (≥ 5.5 TPM) were expressed in 75% of the samples of a particular cell type. We focused our analysis on robustly expressed transcript isoforms and filtered 3′-seq peaks according to their usage. Robustly expressed 3′UTR isoforms that are part of the atlas are expressed with at least 3 TPM (transcripts per million) in at least one sample and each peak combines at least 10% of all reads that map to the 3′UTR. Robustly expressed IPA isoforms that are part of the atlas are expressed with 5 TPM or more and had ≥ 0.1 IPA site usage in at least one sample. IPA site usage is the relative expression of each IPA isoform with respect to the total expression of 3′UTR isoforms (all reads that fall into robust 3′UTR peaks are summed up). We only analyzed IPA isoforms of protein coding genes.
Validation of IPA isoforms using external data sources
To obtain evidence of IPA isoforms from independent methods, we first used RNA-seq data obtained from the same RNA or from the same cell type to identify IPA isoforms. We used the coordinates of the IPA events obtained from 3′-seq and tested the RNA-seq read counts in windows of 100 nucleotides (nt) located upstream and downstream of the IPA peak using a GLM (Extended Data Fig. 1a)2. The windows were separated by 51 nt centered on the first nt of the polyadenylation signal. Not all IPA isoforms could be tested. For example, if the defined windows overlapped with an annotated exon, the IPA event was excluded from further analysis. An IPA isoform was considered present if we detected a significant difference in read counts within the upstream and downstream windows (Padj < 0.1) using DESeq. This analysis was also used to validate CLL-gained IPA events in an independent CLL data set.
We further regarded an IPA isoform as validated if reads that overlap with IPA peaks had at least four untemplated adenosines in the RNA-seq data and a polyadenylation signal (or one of its variants)33 was detected within 50 nt upstream of the read. In addition, we considered IPA isoforms as validated if we detected read evidence in independent 3′-seq data sets10. As no previous 3′-end sequencing data exist for many of our cell types, we also included highly expressed (≥ 10 TPM and ≥ 0.1 IPA site usage) IPA isoforms with an upstream polyadenylation signal (AAUAAA and its variants)33 in our downstream analysis.
Identification of the normal counterpart of CLL and of CLL-IPAs
Hierarchical clustering was performed on the normal human B cell subsets derived from lymphoid tissues or peripheral blood and CLL samples using RNA-seq derived mRNA expression levels (quantile normalized log2 reads per kilobase of transcript per million mapped reads (rpkm)). Genes expressed with greater than 5.5 rpkm in 75% of normal B cells or any of the CLL samples went into the analysis. The 20% most variable genes by median absolute deviation across the data set were used for the clustering. The heatmap was generated using aheatmap (http://cran.r-project.org/package=NMF) with row scaling. This analysis showed that lymphoid-tissue derived CD5+B cells are most closely related in their gene expression profile to CLL cells (Extended Data Fig. 2).
We performed hierarchical unsupervised clustering of CLL and control samples based on IPA site usage to test if IPA site usage separates normal and malignant B cells (Extended Data Fig. 1c). The top 20% most variable genes by median absolute deviation across all the CD5+B and CLL samples were used. This analysis showed two main clusters: Four CLL samples (CLL4, CLL7, CLL11, CLL12) clustered separately from the rest of the samples. However, within the rest of the samples, the control group (CD5+B) clustered separately. The four CLL samples that differed the most from the rest of the samples had a high number of significantly upregulated IPA isoforms (CLL high, median number of CLL-IPAs/sample, N = 100, range, N = 42 – 274), whereas the remaining samples had a low number of CLL-IPAs (CLL low, median, N = 9, range, N = 5 – 28, Extended Data Fig. 1e).
To identify CLL-upregulated IPA isoforms, we applied a GLM1,2,34 and tested usage of each IPA isoform between the normal B cell group and each CLL sample. We only considered IPA isoforms that were significantly upregulated in CLL (FDR-adjusted P value < 0.1, usage difference between CLL and CD5+B ≥ 0.05) and were either not or lowly expressed in CD5+B cells (TPM < 8, corresponding to 75% quantile for CD5+B TPM). This resulted in 931 significantly upregulated IPA events observed in 13 CLL samples. N = 454 IPA events were detected in only a single sample and were regarded as non-recurrent, whereas 477 IPA events occurred in more than one sample (≥ 2/13), and were considered recurrent events by 3′-seq (Extended Data Fig. 1d). The recurrent events resulted in 168 recurrent CLL-IPA isoforms.
As CLL-IPAs are detectable by RNA-seq, we used an independent RNA-seq data set containing 46 CLL samples for validation3. We verified up to 71% of testable IPAs by this independent method and data set. Because of the high validation rate, we combined the two data sets (N = 59 CLL samples) and focused on CLL-IPAs present in more than 10% of the whole CLL sample cohort. This resulted in 330 CLL-upregulated IPA isoforms, derived from 306 genes (Supplementary Table S1). The list of 330 CLL upregulated IPA isoforms contains the 168 CLL-IPAs identified in at least 2/13 3′-seq samples, but contains also CLL-IPA isoforms detected in one 3′-seq and in at least five additional RNA-seq samples (≥ 6/59 total samples).
We detected 33 IPA events that showed significantly higher IPA site usage in CD5+B cells compared with CLL. IPA site usage was required to be higher than in 2 CLL samples (TPM < 10, corresponding to 75% quantile for CLL TPM; FDR-adjusted P value < 0.1, usage difference between CLL and CD5+B ≥ 0.05, Supplementary Table S1).
The fraction of CLL patients affected by IPA or TR mutations shown in Fig. 3d, Extended Data Fig. 7c, and 8a were calculated as follows: If the CLL-IPA isoform was testable by RNA-seq, all 59 CLL samples were considered. If the CLL-IPA isoform was not being tested by RNA-seq (because for example, the upstream exon is located too close to the IPA isoform), then only the 13 CLL samples analyzed by 3′-seq were taken into account for calculating the fraction of samples with significant expression of the IPA isoform.
Cell lines
B lymphoblastoid cells (BLCL) are Epstein Barr virus-immortalized human blood B cells1. MEC1 cells are malignant B cells from B-Prolymphocytic leukemia and were provided by Dr. Abdel-Wahab. Raji and TMD8 cells are malignant B cells from lymphomas and were a gift from Dr. Hans-Guido Wendel (MSKCC). HEK293 and HEK293T cells (embryonic kidney), HeLa cells (cervical cancer) and A549 cells (lung adenocarcinoma) were purchased from ATCC. Wild-type and DICER KO HCT116 cells were generously provided by V. Narry Kim (Seoul National University)35. BLCL, MEC1, and Raji cells were cultured in RPMI with 20% FBS and 1% penicillin/streptomycin. HEK293, HEK293T, HeLa, and A549 were cultured in DMEM with 10% FBS and 1% penicillin/streptomycin, whereas HCT116 cells were cultured in McCoy′s media with 10% FBS and 1% penicillin/streptomycin.
Western blotting
Cells were lysed on ice for 30 min with RIPA buffer (50 mM Tris pH 7.4, 150 mM NaCl, 1% NP-40, 1% Na-deoxycholate, 1 mM EDTA, 0.05% SDS), containing freshly added proteinase inhibitor cocktail (Thermo Scientific). For MGA, NUP98, SGK223, and DICER immunobloting, cell lysates were run using 3–8% Tris-Acetate NuPAGE® gels with Tris-Acetate running buffer (Life Technologies). For CARD11, AKAP10, BAZ1B, SENP1, CUL3, and RIPK1, 4–12% Bis-Tris NuPAGE® gels (Life Technologies) were run with MOPS running buffer and all other proteins were run with MES running buffer (Natural Diagnostics). The separated proteins were transferred to nitrocellulose membranes (Bio-Rad, 1620252), blocked with Odyssey Blocking Buffer (Li-Cor, 927–40000) for 1 hour at room temperature, followed by incubation with primary antibodies at 4°C overnight. After two washes using PBS and 0.1% Tween 20 (PBST), the blots were incubated with IRDye-conjugated secondary antibodies for 50 min at room temperature. After one wash with PBST and two washes with PBS, proteins were detected with Odyssey CLx imaging system (Li-Cor).
The following primary antibodies were used: anti-ACTIN (mouse, Sigma, A4700; rabbit, Sigma, A2066), anti-AKAP10 (mouse, clone 51, Santa Cruz Biotechnology, sc-136512), anti-CARD11 (rabbit, Cell Signalling, 4440S), anti-DICER (rabbit, a kind gift from Dr. Witold Filipowicz (FMI Basel)), anti-DNM1L (mouse, Abcam, ab56788), anti-MGA (rabbit, H-286, Santa Cruz Biotechnology, sc-382569), anti-SFRS15 (SCAF4; mouse, Abnova, H00057466-B01), anti-WSTF (BAZ1B; mouse, clone G-5, Santa Cruz Biotechnology, sc-514287), anti-NUP98 (rabbit, Novus Biologicals, NB100–93325), anti-SGK223 (mouse, Santa Cruz Biotechnology, sc-398164), anti-SENP1 (rabbit, Bethyl Labs, A302–927A-T), anti-CUL3 (rabbit, Bethyl Labs, A301–108A-T), anti-PAWR (Abcam ab92590), anti-RIPK1 (Cell Signaling #4926), anti-GAPDH (goat, V-18, Santa Cruz Biotechnology), and anti-WNT5a/b (rabbit, clone C27E8, Cell Signaling 2530). The secondary antibodies used included anti-mouse IRDye 700 (donkey, Rockland Immunochemicals, 610–730-002), anti-rabbit IRDye 680 (donkey, Li-Cor Biosciences, 926–68073), anti-rabbit IRDye 800 (donkey, Li-Cor Biosciences, 926–32213), and anti-mouse IRDye 800 (donkey, Li-Cor Biosciences, 926–32212).
RT-PCR of IPA isoforms
Total RNA was isolated using Tri reagent solution (Invitrogen #AM9738) and digested with DNase I (Invitrogen #AM1906). RNA was reverse transcribed using the qScript cDNA SuperMix (Quanta Biosciences #101414–106). RT-PCR reactions were carried out using purified Taq polymerase using a 50°C annealing temperature and 30 s extension at 72°C. The linear range of amplification was determined by independent PCRs for each primer set. Primers were designed to be intron-spanning and are listed in Supplementary Table S3.
Induction of IPA isoforms
Endogenous U2AF1, U2AF2, and hnRNPC were knocked-down using pLKO-puro lentiviral vector-based shRNAs (Sigma). Virus was produced using the helper plasmids pCMV-VSVG and pCMV-dR8.2 and cells were transduced in 6-well plates, selected with puromycin (2 μg/ml) for 5 days and then harvested for RT-PCR or western blot analysis.
To induce IPA isoform expression of DICER, an antisense morpholino oligonucleotide (GeneTools) targeting the 5′ splice site of DICER exon 23 was added directly to sub-confluent HeLa cells at the indicated concentrations in the presence of 6 μM EndoPorter-PEG delivery peptide (GeneTools) and harvested at the indicated time points. The control morpholino was used at 12 μM concentration.
Knock-down of CARD11 full-length and IPA isoforms
Isoform-specific shRNA primers were cloned into the TRC2-pLKO-GFP plasmid using KpnI and EcoRI. Lentivirus was produced as described above and centrifuged at 25,000rpm for 1h 45 mins at 4°C (Sorvall WX Ultracentrifuge). Pellets were resuspended and dissolved in cold PBS overnight at 4°C. The virus titer was estimated by transducing wild-type HEK293T cells. The 12-well culture plate was coated overnight with 5 μg/ml fibronectin. TMD8 cells were spin-infected and cultivated for three days, followed by western blot analysis of FACS-sorted GFP-positive cells.
Constructs
The V5-DICER construct was obtained from Dr. Joshua Mendell (UT Southwestern). To generate the DICER-IPA expression plasmid, the DICER-IPA cDNA was amplified from BLCL and cloned into the pCK-V5 plasmid using the BamHI and ApaI restriction sites.
The human MGA cDNA (Dharmacon, clone BC136659) was used to PCR-amplify the coding region of full-length MGA (8,571 nt plus 6 nt of endogenous Kozak sequence) as well as MGA IPA (3,430 nt (end of exon 9) plus gtgagtattaa [intronic sequence that will be translated, followed by a stop codon; see Extended Data Fig. 6a]). MGA IPA was cloned into the pcDNA3.1 expression vector (Life Technologies) using NheI and XhoI sites. GFP fused-MGA IPA was generated by inserting MGA IPA downstream of eGFP using the restriction sites BsrGI and XhoI in the pcDNA3.1-GFP vector. MGA was cloned into pcDNA3.1-GFP using Gibson Assembly Cloning (New England Biolabs) from three pieces.
The full-length FOXN3 mRNA was amplified from BLCL cDNA. To obtain GFP-FOXN3, it was cloned into pcDNA3.1-GFP36 using BsrGI and XhoI restriction sites. FOXN3 IPA was PCR-amplified from two fragments. Fragment 1 was amplified from BLCL cDNA and corresponds to amino acids 1–180, whereas fragment 2 was amplified from genomic DNA from PBMC and corresponds to the 32 amino acids generated from intronic sequence, followed by a stop codon. FOXN3 IPA was fused with GFP at the C-terminus as described above.
Full-length CHST11 was amplified from BLCL cDNA, whereas CHST11 IPA was amplified from genomic DNA. Both were fused to GFP at the C-terminus as described above. The integrity of all constructs was confirmed by sequencing.
Functional validation of CLL-IPAs
CARD11 IPA
To assess NF-κB activation, lentiviral-transduced TMD8 cells (described above) were used. Cells were fixed with 4% formaldehyde at room temperature for 15 mins. After two washes with excess PBS, fixed cells were resuspended with ice-cold PBS and permeablized with 90% methanol for 20 mins on ice. Cells were then washed with cold PBS twice and resuspended with the incubation buffer (PBS + 0.5% BSA). Cells were aliquoted and incubated with anti-phospho-NF-κB p65 (1:1,500 dilution, Cell Signaling #3033) for 1.5 hrs at room temperature. Cells were washed with incubation buffer twice and incubated with fluorochrome-conjugated secondary antibody solution (1:10,000 Alexa Fluor 647 A27040, Invitrogen) for 15 mins at room temperature. After two washes with incubation buffer, cells were analyzed using a FACS Calibur.
DICER IPA
Full-length V5-DICER and V5-DICER IPA were immunoprecipitated from HEK293T cells as described before16. Briefly, 48 hours after transfection, cells were washed with cold PBS and lysed with IP buffer (20 mM Tris-HCl pH = 8.0, 150 mM NaCl, 1 mM EDTA, 0.5% NP-40 and 1x EDTA-free protease inhibitor (Thermo Fisher)) for 30 mins on ice with occasional vortexing. The cell lysate was then centrifuged at 20,000 x g for 10 mins at 4°C and the supernatant was collected. The cell lysate was incubated with 3 μg of anti-V5 tag antibody (Invitrogen R960–25) for 30 mins on ice, then 900 μg of protein G Dynabeads were added and the reaction was rotated for an additional 2 hrs at 4°C. After five washes with IP buffer and twice in DICER assay buffer (20 mM Tris-HCl pH = 8.0, 100 mM KCl, 0.2 mM EDTA), 90% of beads were resuspended in DICER assay buffer for miRNA cleavage assay and the remaining beads were stored in 2x Laemmli sample buffer (Sigma) for western blot analysis.
The miRNA cleavage assay was performed as described previously16. Briefly, synthesized pre-miRNA let-7i oligo (Dharmacon) was incubated with immunoprecipitated beads prepared as described above in the enzymatic mixture (10 μl of immunoprecipitated beads in DICER assay buffer, 2 μl of 20 mM MgCl2, 0.2 μl of 0.4 μM pre-miRNA, 0.1 μl of 100 mM DTT, 0.5 μl of RNaseOUT (Invitrogen) and 7.2 μl of RNase-free water) at 37°C for 30 mins with interval mix. The reaction was stopped by chilling samples on ice and analyzed by northern blot. To investigate if DICER IPA acts as dominant-negative version of full-length DICER, different ratios of V5-DICER and V5-DICER IPA were mixed and tested with respect to miRNA cleavage.
Reaction mixtures (10 μl) were added to 10 μl RNA loading buffer (95% formamide, 0.025% SDS, 0.025% bromophenol blue, 0.025% xylene cyanol FF, 0.5 mM EDTA) and denatured at 95°C for 5 minutes followed by quenching on ice. Samples were run on a 15% TBE/Urea gel followed by transfer to a Hybond-N+ nylon membrane (GE Healthcare #RPN303B) using a semi-dry transfer apparatus (Hoefer TE70X). Following transfer, membranes were briefly dried and then UV cross-linked twice with 1200 µJ/cm2 each cycle. Cross-linked membranes were pre-hybridized for 1 hour at 37°C in ULTRAhyb-Oligo hybridization buffer (Ambion #AM8663) in a rotary oven. DNA probes against the intended target RNA were synthesized as oligos and labeled with γ32P-ATP in the presence of T4 polynucleotide kinase (NEB #M0201S) for 30 minutes at 37°C. Labeled probes were purified through G-25 microspin columns containing Sephadex resin (GE Healthcare #27–5325-01). Membranes were hybridized with labeled probe overnight at 37°C in a rotary oven. The next day, membranes were washed twice in 2x SSC/0.1% SDS for 5 minutes each at 37°C followed by one wash in 0.1x SSC/0.1% SDS for 5 minutes at 37°C. Membranes were exposed to phosphorimager screens and scanned.
To assess if expression of DICER IPA influences miRNA expression in vivo, endogenous let-7 miRNA expression levels were measured by northern blot analysis of total RNA (22 μg) from wild-type and DICER KO HCT116 cells. DICER KO HCT116 cells were transfected with different amounts of V5-DICER and V5-DICER IPA. Cells were harvested 3 days after transfection with Lipofectamine 2000 to assess DICER protein expression and corresponding endogenous let-7 levels.
FOXN3 IPA
The fork-head domain of FOXN3 is necessary for transcriptional repression of FOXN3 target genes. Thus, truncation of the fork-head domain predicts de-repression of the target genes. Known target genes are PIM2 and MYC20,37. MEC1 cells were nucleofected with pcDNA 3.1 vector containing GFP, GFP-FOXN3 or GFP-FOXN3 IPA using SF Cell Line 4D-Nucleofector® X Kit (Lonza, Program FF-120). After 48 hours, GFP-positive cells were FACS sorted, lysed immediately (Cells-to-cDNA™ II Kit, Ambion) and RNA was extracted. cDNA was synthesized by qScript™ cDNA SuperMix (Quanta Biosciences) and quantitative PCR was performed using FastStart universal SYBR green master mix (Roche) on a 7900HT Fast Real-Time PCR System (Applied Biosystems). The experiment was performed from five biologically different replicates.
MGA IPA
Raji cells were nucleofected with pcDNA3.1 vector containing GFP, GFP-MGA or GFP-MGA IPA using Cell Line Nucleofector Kit V (Lonza, Program M-013). After 48 hours, GFP-positive Raji cells were FACS-sorted and lysed immediately in lysis buffer (Cells-to-cDNA™ II Kit, Ambion) and RNA was extracted. cDNA synthesis and qRT-PCR was as described for FOXN3. qRT-PCR was done in technical triplicates from three biologically different experiments. MYC target genes were previously published38,39. E2F binding sites in MYC target genes were identified using the Encode Transcription Factor ChIP-seq track, or they were previously described19,39–41. T-boxes were described for ATF4 and CDKN1B42,43.
CHST11 IPA
3′-seq data were used to identify overexpressed WNTs in CLL cells compared to normal B cells. The expression of WNTs was validated in MEC1 cells by qRT-PCR. WNT5B was the WNT with the highest expression in MEC1 cells.
For WNT detection in media, MEC1 cells stably expressing GFP, GFP-CHST11 or GFP-CHST11 IPA were counted and washed once with RPMI without FCS. Twenty million cells were cultured in 10 ml RPMI + 1% Pen/Strep in one 10 cm culture dish. After 18 hrs, conditioned media was collected by centrifugation at 280 x g for 5 mins and passed through a 0.45 μM filter. The supernatant was concentrated by an Amicon Ultra-4 centrifugal filter (Millipore, UFC800324) at 3,000 x g at 10°C for 2 hrs. The concentrated media (~50 μl) was collected and subjected to western blot analysis using anti-WNT5a/b antibody (Cell Signaling #2530). The corresponding cell pellets were also collected for western blot analysis.
To assess paracrine WNT activity in MEC1 cells expressing CHST11 IPA, MEC1 cells were nucleofected with pcDNA3.1 vector containing GFP, GFP-CHST11 or GFP-CHST11 IPA. After 24 hours, GFP-positive cells were FACS sorted and cultivated for three days. The conditioned media was collected and added to HEK293T cells which were transiently transfected with a WNT reporter plasmid (Addgene #12456, M50, Super 8x TOPFlash) or WNT reporter control plasmid with mutated TCF/LEF binding sites (Addgene #12457, M51, Super 8x TOPFlash mutant)44. The conditioned media was added 24 hours after transfection. Luciferase activity was measured 24 hours after the addition of conditioned media using a Glomax 96 Microplate Luminometer as described previously45.
Intersection of somatic mutations in CLL with IPA
CLL RNA-seq samples (N = 44) with available somatic DNA mutation and prognostic data were available to us to map IPA isoform expression3. The somatic mutations were obtained using exome sequencing that included extended exon boundaries46. We intersected the occurrence of somatic mutations with IPA isoforms in these samples. We focused on truncating mutations (nonsense mutations, frame-shift mutations and splice-site mutations) in expressed genes as they were likely to have a similar outcome as IPA.
The IGVH status of CLL samples was assessed at MSKCC for the CLL samples studied by 3′-seq. The IGVH status of 44 RNA-seq samples was published3.
Positions of TR mutations
The positions of TR mutations in CLL were obtained from the published CLL somatic mutation data sets3,7,8. The positions of truncating (TR) mutations in solid cancers of TSGs and of genes targeted by CLL-IPAs were obtained from the MSK cbio portal (date of reference, 02/23/2018, containing > 86,000 cancer samples with 97% derived from solid tumors)4. The position with the highest number of TR mutations was used (hot spot) and is indicated by the symbol. The symbol is lacking if the genes had TR mutations without a hot spot.
Number of amino acids of full-length or IPA-generated truncated proteins
To calculate the number of amino acids of full-length proteins, we used the longest Ref-seq annotated mRNA isoform, obtained the number of coding nucleotides and divided this number by three to obtain the total number of amino acids. To calculate the number of amino acids of the IPA-generated truncated proteins we counted the number of nucleotides from the start codon to the end of the exon located upstream of the IPA isoform and divided this number by three to obtain the number of retained amino acids. This number also provided information about the reading frame of the protein at the exon/intron junction located upstream of the IPA isoform. We then used the correct reading frame and translated the intronic nucleotides until an in-frame stop codon was detected. The amino acids translated from intronic sequence were added to the retained amino acids to obtain the size of the IPA-generated truncated proteins.
The fraction of retained CDR is the number of amino acids retained (up to the end of the exon located upstream of the IPA isoform) divided by the number of amino acids calculated from the longest mRNA isoform encoding the full-length protein.
Identification of known and novel TSGs
For known TSGs, we used the 301 TSGs reported by Davoli et al.5 that were expressed in CLL samples. Davoli used a computational method (TUSON Explorer) to predict 301 TSGs from genomic sequencing data obtained from more than 8,200 cancers (> 90% are derived from solid tumors).
For novel TSGs, we used the data from the MSK cbio portal (see above). It was previously reported that the variable with the highest predictive power for TSGs was the proportion of TR mutations to all mutations5. We calculated this ratio for the 190 genes that generated CLL-IPAs in more than 20% of samples and identified a bimodal distribution with a separation point at 12% TR mutations to all mutations. The genes that generated CLL-IPAs in more than 20% of samples and had a TR mutation rate ≥ 12% in the data from MSK cbio portal were called novel TSG candidates (Supplementary Table S2).
To assess if known TSGs are enriched among CLL-IPAs a Chi-square-test was performed. To exclude that this association occurred by chance, five control lists containing genes with similar coding region length and expression were generated and tested for enrichment of TSGs.
Others statistical methods
To perform enrichment statistics, we used a Chi-square-test and calculated the P value using a two-sided Fisher′s exact test. To assess the functional differences between full-length proteins and IPA-generated truncated proteins (MGA, FOXN3), we used a two-sided t-test for independent samples. When comparing three groups (CARD11, CHST11), a two-sided Kruskal-Wallis test was used. For subsequent pair-wise comparisons a two-sided Mann-Whitney test was applied and the P values were adjusted with Bonferroni multiple testing correction. For all other tests that assessed the differences of features between two groups, we used a two-sided Mann-Whitney test. To investigate the spatial relationship between the IPA-generated truncated proteins and hot spot TR mutations, we performed a two-sided Wilcoxon rank sum test.
Data Availability Statement
All 3′-seq and RNA-seq data generated and analyzed for this study have been deposited in the Gene Expression Omnibus database under accession numbers GSE111310 and GSE111793.
The code to analyze the data is available under https://bitbucket.org/leslielab/apa_2018/ and the processed data are available in Supplementary Table S1 (for Fig. 1b–d, 2a, 4a, Extended Data Fig. 3, and 4) and Supplementary Table S2 (for Extended Data Fig. 8a), and in the Source data files (for Fig. 1e, 2c, 2e, 3a, 3d, 4b–d, 4g, Extended Data Fig. 2c, 6j, 7c, and 8a). Data on DNA mutations from CLL patients were provided by Dan A. Landau (Weill-Cornell Medical College) and need to be requested from him. The mutation data on solid cancers was obtained through the MSK cbio portal. The data can be accessed through www.cbioportal.org.
Extended Data
Extended Data Figure 1. Validation of IPA isoforms by independent methods and identification of CLL-IPAs used for further analysis.
(a) RNA-seq data were used to validate the presence of IPA isoforms using a GLM. Within two 100 nt windows (green bars) separated by 51 nt and located up- and downstream of the IPA peak the RNA-seq reads were counted. The IPA peak was considered validated if Padj < 0.1 (see methods). Out of N = 5,587 tested IPA isoforms, N = 1,662 were validated by this method. Shown is MGA as a representative example. (b) As only a fraction of IPA isoforms were validated by the method from (a), additional methods were used to obtain independent evidence for the presence of the IPA isoforms. Independent evidence was obtained using untemplated adenosines from RNA-seq data or through the presence of the IPA isoform in other 3′-seq protocols (10). As the majority of immune cell types used in this study have not been investigated using other 3′ end sequencing protocols and IPA isoform expression is cell type-specific (2), highly expressed IPA isoforms (>10 TPM) were not excluded from further analysis even if no read evidence was found by other protocols. (c) Hierarchical clustering based on IPA site usage separates the 3′-seq dataset into four groups. It separates CD5+B from CLL samples and clusters CLL samples into three different groups. Shown is the usage difference of the 20% most variable IPA isoforms across the data set (N = 342). Four of 13 CLL samples cluster away from the rest of the samples and are characterized by a high number of IPA isoforms (CLL high). (d) The GLM (FDR-adjusted P value < 0.1, IPA usage difference ≥ 0.05, IPA isoform expressed in CD5+B < 8 TPM) identified 477 recurrent (significantly upregulated in at least 2/13 CLL samples by 3′-seq) and 454 non-recurrent (significantly upregulated in 1/13 CLL samples by 3′-seq). IPAs were validated in an independent RNA-seq data set containing 46 new CLL samples. Among the recurrent IPAs, 71% of testable IPAs were verified using another GLM (see a). Among the non-recurrent IPAs, 64% of testable IPAs were verified. (e) Plotting the number of CLL-IPAs per sample separates the CLL samples investigated by 3′-seq into two groups: 4/13 samples generate a high number of CLL-IPAs (CLL high, median of CLL-IPAs/sample, N = 100, range, 42 – 274), whereas the rest of the samples generate lower numbers (CLL low, median, N = 9, range, 5 – 28). Center bar shows median and the error bars show the interquartile range. Two-sided Mann-Whitney test, **, P = 0.003.
Extended Data Figure 2. The normal B cell counterpart of CLL cells are CD5+B cells derived from lymphoid tissue.
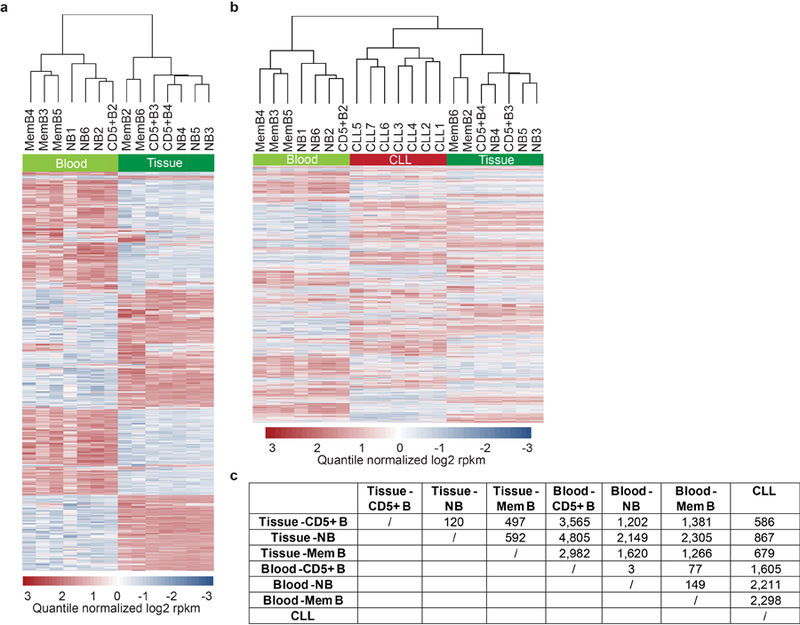
(a) Hierarchical clustering of normal human B cells (naive B (NB), memory B (MemB) and CD5+B) derived from lymphoid tissues or peripheral blood based on mRNA expression obtained from RNA-seq. The heatmap shows the 20% most variable genes across the data set (N = 1,887). The gene expression profiles of B cell subsets derived from peripheral blood or lymphoid tissue differ substantially, although the same markers were used for purification. (b) As in (a), but RNA-seq data from CLL samples were added to the analysis. The heatmap shows the 20% most variable genes across the data set (N = 2,078). CLL samples cluster with tissue-derived and not with blood-derived normal immune cells. (c) Number of all differentially expressed genes from the analysis shown in (b).
Extended Data Figure 3. 3′-seq and RNA-seq tracks of functionally validated CLL-IPAs.

Five CLL-IPAs were functionally validated. Their 3′-seq and RNA-seq tracks are shown here and in Fig. 2a. Data are shown as in Fig. 1b. The corresponding RT-PCRs are shown in Extended Data Fig. 5a.
Extended Data Figure 4. CLL-IPAs generate truncated mRNAs and proteins.

Gene models and western blots of 10 candidates depicted as in Figures 1b and 2a show that CLL B cells generate full-length and IPA-generated truncated proteins. BLCL were used as control B cells and were included in the 3′-seq tracks. ACTIN was used as loading control on the same blots. For gel source data see Supplementary Fig. 1.
Extended Data Figure 5. Validation of the IPA-generated truncated mRNAs and validation of their stable expression over time.
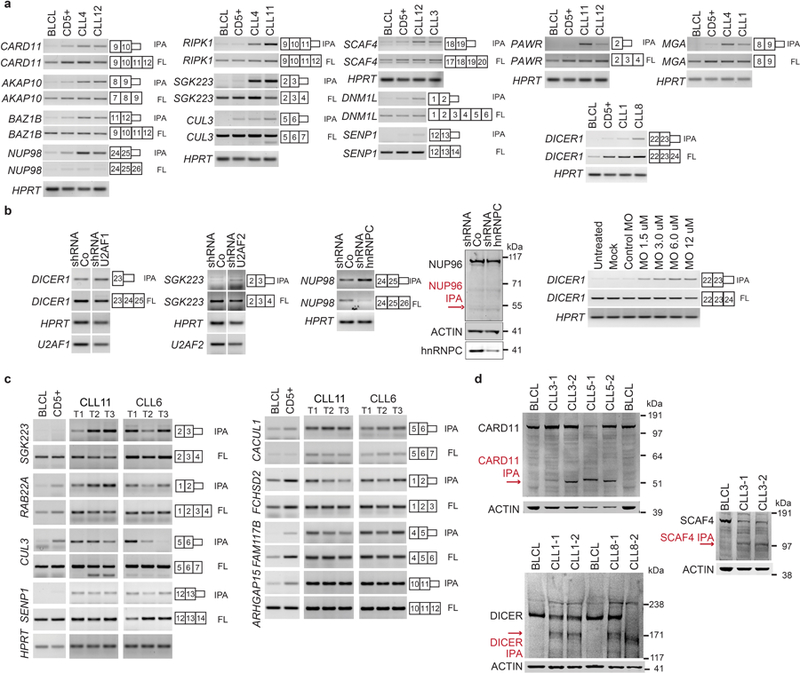
(a) Detection of full-length and IPA-generated truncated mRNAs by RT-PCR in normal B cells (CD5+B, BLCL) and CLL cells used in the western blot validations shown in Fig. 2a and Extended Data Fig. 4. All experiments were performed twice with similar results. Primers to amplify the mRNA isoforms are located in the first and last exons shown in the gene models and are listed in Supplementary Table S3. HPRT was used as loading control. (b) Induction of truncated mRNAs and proteins through shRNA-mediated knock-down of splicing factors. All experiments were performed twice with similar results. U2AF1 was knocked-down in HeLa cells, U2AF2 was knocked-down in HEK293 cells and hnRNPC was knocked down in A549 cells. Shown as in (a), except for NUP96 which is shown as in Extended Data Fig. 4. NUP96 is derived from NUP98 precursor. Induction of DICER1 IPA by transfection of increasing amounts of anti-sense morpholinos (MO) directed against the 5′ splice site of intron 23 of DICER1 in HeLa cells. Shown are RT-PCRs. (c) RT-PCRs, performed once, on expression of full-length (FL) and IPA isoforms for eight CLL-IPAs in samples from two CLL patients and control B cells (CD5+B, BLCL). The samples were collected over a time interval of over 6 years. CLL11: T1, 17 months (mo) after diagnosis, T2, 24 mo, T3, 44 mo; CLL6: T1, 16 mo, T2, 49 mo, T3, 91 mo (42 mo after treatment). Samples from all time points (except CLL6, T3) were obtained from untreated patients. The primers for amplifications of the products were located in the first and last exons shown in the gene models and are listed in Supplementary Table S3. Expression of HPRT serves as loading control. The same gel picture of HPRT is shown in Fig. 3b for CLL samples and Extended Data Fig. 5a, far right panel, for BLCL and CD5+ control samples. All tested CLL-IPA isoforms were detectable at several time points during the course of the disease. Compared with CD5+B cells, expression of FCHSD2 IPA was not significantly upregulated in CLL. (d) Western blots of full-length and IPA-generated truncated proteins from CARD11, DICER, and SCAF4. All experiments were performed twice with similar results. ACTIN was used as loading control on the same blot. Shown are samples from normal B cells (BLCL) and two CLL patients, both at two different time points 0.5 – 10 months apart. For gel source data see Supplementary Fig. 1.
Extended Data Figure 6. IPA-generated truncated proteins resemble the protein products of truncating DNA mutations and have cancer-promoting properties.
(a) CARD11 IPA results in translation of intronic nucleotides (grey) until an in-frame stop codon is encountered. This results in the generation of 16 new amino acids (grey) downstream of exon 10. In the case of MGA IPA three new amino acids downstream of exon 9 are generated. (b) Western blot showing that TMD8 cells express similar amounts of CARD11 IPA as CLL samples. The western blot is depicted as in Fig. 2a and was performed twice. ACTIN was used as loading control on the same blot. (c) Western blot (as in b) showing full-length CARD11 as well as CARD11 IPA in TMD8 cells expressing a control shRNA (Co), an shRNA that exclusively knocks-down the full-length protein (FL) and two different shRNAs that exclusively knock-down the CARD11 IPA isoform (IPA). The experiment was performed twice with similar results. GAPDH was used as loading control on the same blot. (d) Endogenous phospho-NF-κB-p65 levels were measured by FACS in TMD8 cells expressing the indicated shRNAs from (c). Mean fluorescent intensity (MFI) values are shown in parentheses in FACS plots of a representative experiment out of three. (e) Immunoprecipitation of V5-DICER or V5-DICER IPA from HEK293T cells using an anti-V5 antibody. The experiment was performed twice with similar results. 2.5% of input was loaded. (f) The extent of miRNA processing depends on the expression levels of full-length (FL) DICER, but not IPA. Shown are wild-type (WT) and DICER knock-out (KO) HCT116 cells. Re-expression of different amounts of FL DICER1 protein in the KO cells (measured by western blot of DICER1 in the top panel) results in different levels of endogenous let-7 expression (measured by northern blot in the bottom panel; compare lanes 3 and 4). Expression of DICER IPA has no influence on miRNA processing (compare lanes 4 and 5). ACTIN and U6 were used as loading controls on the same blots, respectively. The experiment was performed twice with similar results. (g) Western blot of MGA. MGA and MGA IPA were cloned and expressed in HEK293T cells to confirm the predicted protein size. The experiment was performed twice with similar results. Shown is also the endogenous MGA expression in Raji cells. ACTIN was used as loading control on the same blot. *, denotes an unspecific band. (h) Protein models of full-length and FOXN3 IPA are shown as in Fig. 2b. The IPA-generated protein truncates the fork-head domain and is predicted to lose the repressive activity. (i) As in (a), but for FOXN3. FOXN3 IPA generates 32 new amino acids downstream of exon 2. (j) FOXN3 IPA significantly de-represses expression of the oncogenic targets MYC and PIM2. Fold-change in mRNA level of endogenous genes in MEC1 B cells after transfection of GFP-FOXN3 IPA compared with transfection of full-length GFP-FOXN3. HPRT-normalized values are shown as boxplots (as in Fig. 1e) from N = 5 biologically independent experiments, each performed in technical triplicates. Two-sided t-test for independent samples was applied, **, P = 0.002. For gel source data see Supplementary Fig. 1.
Extended Data Figure 7. Inactivation of TSGs by CLL-IPAs independently of DNA mutations.

(a) The distribution of full-length protein size of genes that generate CLL-IPAs (N = 306) and B-IPAs (N = 2,690) is shown in amino acids (aa). Boxplots as in Fig. 1e. Two-sided Mann-Whitney test, P = 0.87. (b) TR rate (ratio of TR mutations over all mutations) is shown for known TSGs obtained from (5). Boxplots as in Fig. 1e. Two-sided Mann-Whitney test, P = E-155. (c) Known TSGs, obtained from (5) that are targeted by CLL-IPAs (N = 21) are shown. Dark green bars indicate the fraction of retained CDR for each IPA-generated protein. Black dots indicate the hot spot positions of TR mutations obtained from MSK cbio portal. CLL-IPAs mostly occur upstream or within 10% (of overall aa length) of the mutations (two-sided Wilcoxon rank test, P = 0.04). (d) Contingency table for enrichment of TSGs among genes that generate CLL-IPAs. P value was obtained from two-sided Fisher’s exact test. TSGs were obtained from (5). (e) TSGs and genes that generate CLL-IPA isoforms have longer CDRs than genes that do not generate IPA isoforms. Boxplots as in Fig. 1e. Two-sided Kruskal-Wallis test, P = E-80. (f) Five control gene lists (N = 306, each) with a similar size distribution as CLL-IPAs and expressed in CLL were tested for enrichment of TSGs. Shown is the number of TSGs found. Chi-square-test did not show a significant enrichment of TSGs among the control genes. (g) Contingency table for enrichment of TR mutation genes in CLL among genes that generate CLL-IPAs. P value was obtained from two-sided Fisher’s exact test. (h) ZMYM5 is truncated by a TR mutation and an IPA isoform in the same patient, but the aberrations are predicted to result in different truncated proteins. A 10 bp deletion in exon 3 results in a frame-shift leading to the generation of a truncated ZMYM5 protein, whereas ZMYM5 IPA (not yet annotated) produces a truncated protein containing 352 more amino acids in the same patient. The genes shown in Extended Fig. 7h and 7i are the only genes with simultaneous presence of a TR mutation and CLL-IPA out of N = 268 tested. The position of the TR mutation is indicated in green. CLL7 and CLL11 3′-seq and RNA-seq tracks are shown for comparison reasons. (i) MGA is truncated by a TR mutation and an IPA isoform in the same patient. The TR mutation affects the 5′ splice site of intron 7, thus generating two additional amino acids downstream of exon 7, whereas the IPA isoform encodes a truncated MGA protein containing three more amino acids downstream of exon 9. Mutation and 3′-seq analysis were performed once. CLL7 and CLL11 are shown for comparison reasons. (j) Shown are additional recurrent (N > 1) DNA mutations found by exome sequencing of CLL patient samples stratified by a high or low number of CLL-IPAs per patient. Only the top and bottom 16 samples with high or low CLL-IPAs are shown to normalize the number of samples analyzed. This analysis is only descriptive and no test was performed. (k) Significant enrichment of SF3B1 mutations in the group of CLL samples with abundant CLL-IPA isoforms. Two-sided Mann-Whitney test was performed. (l) Abundance of CLL-IPAs is not associated with IGVH mutational status. Shown is the number of CLL-IPAs per sample for patients with mutated (MUT, N = 30) or unmutated (UN, N = 21) IGVH genes. Boxplots as in Fig. 1e. Two-sided Mann-Whitney test, P = 0.4.
Extended Data Figure 8. Novel TSG candidates and validation of CHST11 IPA as cancer-promoting isoform.

(a) As in Fig. 3c, but shown are known (red gene names) and novel TSG candidates (black gene names) among the abundant CLL-IPAs. CLL-IPAs seem to inactivate these genes as they mostly occur upstream or within 10% (of overall aa length) of the mutations. Two-sided Wilcoxon rank sum test performed on all 136 TSGs, P = E-8; two-sided Wilcoxon rank sum test performed on the novel TSGs, N = 119, P = E-8. Position of TR mutation was determined using the data obtained from the MSK cbio portal and indicates the hot spot mutation. Right panel, the fraction of CLL samples affected represents the fraction of CLL samples (out of 59) with significant expression of the IPA isoform. Genes were included if they were affected in at least 20% of samples investigated either by 3′-seq or RNA-seq. (b) Contingency table for enrichment of novel TSGs among highly recurrent CLL-IPAs. P value was obtained from two-sided Fisher’s exact test. (c) TSGs have larger protein sizes. Boxplots as in Fig. 1e. Two-sided Mann-Whitney test, **, P = 0.005. The increased overall mutation rate of known TSGs correlates with larger protein size. Spearman′s correlation coefficient, r = 0.74, P = E-6. (d) CHST11 IPA generates 18 new amino acids (grey) downstream of exon 1. (e) Experimental set-up to measure paracrine WNT activity produced by MEC1 B cells either expressing GFP, GFP-CHST11 or GFP-CHST11 IPA and using a WNT reporter expressed in HEK293T cells. Primary CLL cells and the CLL cell line MEC1 express several WNTs, including WNT5B. In the presence of CHST11 WNT (red dots) binds to sulfated proteins on the surface of WNT producing cells, whereas WNT is secreted into the media in the presence of CHST11 IPA. WNT-conditioned media activates a WNT reporter in HEK293T cells. This set-up refers to Fig. 4f and 4g. (f) Western blot, performed once, for WNT5 shown as in Fig. 4f, but including HeLa cells as positive control for WNT5 expression. ACTIN was used as loading control on the same blot.
Extended Data Figure 9. Cancer-upregulated IPA isoforms are also detected in breast cancer and T-ALL.
(a) MAGI3 is a TSG that is preferentially targeted by IPA in breast cancer (27). Shown is the mutation profile obtained from MSK cbio portal. (b) Expression of IPA isoforms in T-ALL detected by RNA-seq. Shown are 3′-seq and RNA-seq tracks of a representative mRNA (out of N = 101) from CLL samples, T-ALL samples and normal thymus. The T-ALL RNA-seq data were obtained from (32). We detected N = 381 IPA isoforms in at least one T-ALL sample, N = 133 in at least one thymus sample, N = 104 in at least one T-ALL and one thymus sample, and N = 101 in at least two T-ALL samples, but not in any of the thymus samples.
Extended Data Table 1. Samples investigated by 3′-seq and RNA-seq.
(a) CLL sample characteristics. (b) Normal human immune cells investigated by 3′-seq. (c) Normal human immune cells investigated by RNA-seq.
| a | |||||||||||||
|---|---|---|---|---|---|---|---|---|---|---|---|---|---|
| CLL low vs CLL high |
Number of CLL-IPAs |
Age at diagnosis |
Rai stage
at sample collection |
WBC count at sample collection |
IgVH status | Cyto- genetics |
Treated before sample collection |
Treated
after sample collection |
Diagnosis
to sample collec-tion (time; mo) |
Treatment- free survival (yr) |
RNA-seq | 3’-seq | |
| CLL1 | L | 13 | 62 | III | 153 | UN | Del 11q | N | Y | 10 | 1 | Y | Y |
| CLL2 | L | 7 | 62 | III | 300 | NA | Del 17p | N | Y | 112 | 9 | Y | Y |
| CLL3 | L | 26 | 54 | IV | 139 | NA | Tri12, t(14;19) | N | Y | 84 | 8 | Y | Y |
| CLL4 | H | 93 | 72 | 0 | 173 | UN | Normal | N | Y | 37 | 4 | Y | Y |
| CLL5 | L | 11 | 55 | III/IV | 193 | UN | Tri8, del 13q | N | Y | 46 | 4.5 | Y | Y |
| CLL6 | L | 28 | 39 | I | 137 | MUT | Del 13q | N | Y | 49 | 3.3 | Y | Y |
| CLL7 | H | 108 | 54 | IV | 111 | MUT | Del 13q | N | Y | 108 | 8 | Y | Y |
| CLL8 | L | 12 | 72 | III | 365 | UN | Tri12 | N | Y | 109 | 9 | N | Y |
| CLL9 | L | 5 | 63 | III | 200 | UN | Del 13q, t(6;19) | N | Y | 30 | 2 | N | Y |
| CLL10 | L | 11 | 51 | III | 77 | UN | Del 11q | N | Y | 70 | 6 | N | Y |
| CLL11 | H | 274 | 39 | 0 | 100 | UN | Del 11q, 13q, 14q | N | Y | 44 | 5.5 | Y | Y |
| CLL12 | H | 42 | 49 | II | 178 | NA | NA | N | N | 240 | 23.3 | Y | Y |
| CLL13 | L | 7 | 66 | I | 125 | UN | Del 11q, del 13q | N | Y | 5 | 0.5 | N | Y |
| CLL14 | H | 160 | 45 | NA | NA | NA | NA | N | NA | 112 | NA | Y | N |
| CLL15 | L | 49 | NA | NA | NA | NA | NA | N | NA | NA | NA | Y | N |
| b | ||||
|---|---|---|---|---|
| Sample | Derived from | Sample name | Markers for sorting | No. of samples |
| CD5+B | Tonsil | CD5+B3-CD5+B6 | CD5+, CD19+ | 4 |
| NB | Tonsil | NB3-NB4 | CD19+, CD27− | 2 |
| NB | Blood | NB1-NB2 | CD19+, CD27− | 2 |
| MemB | Tonsil | M1-M2 | CD19+, CD27+ | 2 |
| GC | Tonsil | GC1-GC2 | CD19+, CD38+ | 2 |
| PC | BM | PC1-PC3 | CD138+ | 3 |
| T | Blood | T2-T3 | CD3+ | 2 |
| c | ||||
|---|---|---|---|---|
| Sample | Derived from | Sample name | Markers for sorting | No. of samples |
| CD5+B | Tonsil | CD5+B3-CD5+B4 | CD5+, CD19+ | 2 |
| CD5+B | Blood | CD5+B2 | CD5+, CD19+ | 1 |
| NB | Tonsil | NB3-NB5 | CD19+, CD27− | 3 |
| NB | Blood | NB1-NB2, NB6 | CD19+, CD27− | 3 |
| MemB | Tonsil | M2, M6 | CD19+, CD27+ | 2 |
| MemB | Blood | M3-M5 | CD19+, CD27+ | 3 |
| GC | Tonsil | GC1-GC4 | CD19+, CD38+ | 4 |
| PC | BM | PC4-PC21 | CD138+ | 18 |
N, No; Y, Yes; NA, not analyzed
BM, bone marrow
Supplementary Material
Acknowledgements
This work was funded by the NCI grant U01-CA164190 (to C.M. and C.S.L), a Starr Cancer Foundation grant (to C.M and C.S.L), the Innovator Award of the Damon Runyon-Rachleff Cancer Foundation and the Island Outreach Foundation (DRR-24-13; to C.M.), the NIH Director′s Pioneer Award (DP1-GM123454, to C.M.), the Pershing Square Sohn Cancer Research Alliance (to C.M.) and the MSK Core Grant (P30 CA008748). We are grateful to Vikash K. Modi for access to lymphatic tissue, to Dan A. Landau for providing CLL RNA-seq data and sample identities to validate our findings, and to Catherine Wu and Donna Neuberg for clinical outcome analyses. We thank Joshua Mendell and V. Narry Kim for providing the V5-DICER construct and the DICER knock-out cells, Jayanta Chaudhuri for critical reading of the manuscript, and the members of the Mayr lab for helpful discussions.
Footnotes
Supplementary Information is available in the online version of the paper.
Competing interests
The authors declare no competing interests.
References
- 1.Lianoglou S, Garg V, Yang JL, Leslie CS & Mayr C Ubiquitously transcribed genes use alternative polyadenylation to achieve tissue-specific expression. Genes Dev 27, 2380–2396, (2013). [DOI] [PMC free article] [PubMed] [Google Scholar]
- 2.Singh I et al. Widespread intronic polyadenylation diversifies immune cell transcriptomes. Nature communications 9, 1716, (2018). [DOI] [PMC free article] [PubMed] [Google Scholar]
- 3.Landau DA et al. Mutations driving CLL and their evolution in progression and relapse. Nature 526, 525–530, (2015). [DOI] [PMC free article] [PubMed] [Google Scholar]
- 4.Cerami E et al. The cBio cancer genomics portal: an open platform for exploring multidimensional cancer genomics data. Cancer discovery 2, 401–404, (2012). [DOI] [PMC free article] [PubMed] [Google Scholar]
- 5.Davoli T et al. Cumulative haploinsufficiency and triplosensitivity drive aneuploidy patterns and shape the cancer genome. Cell 155, 948–962, (2013). [DOI] [PMC free article] [PubMed] [Google Scholar]
- 6.Dvinge H, Kim E, Abdel-Wahab O & Bradley RK RNA splicing factors as oncoproteins and tumour suppressors. Nat Rev Cancer 16, 413–430, (2016). [DOI] [PMC free article] [PubMed] [Google Scholar]
- 7.Puente XS et al. Whole-genome sequencing identifies recurrent mutations in chronic lymphocytic leukaemia. Nature 475, 101–105, (2011). [DOI] [PMC free article] [PubMed] [Google Scholar]
- 8.Quesada V et al. Exome sequencing identifies recurrent mutations of the splicing factor SF3B1 gene in chronic lymphocytic leukemia. Nat Genet 44, 47–52, (2012). [DOI] [PubMed] [Google Scholar]
- 9.Stilgenbauer S, Bullinger L, Lichter P, Dohner H & German, C., Study, Group. Genetics of chronic lymphocytic leukemia: genomic aberrations and V(H) gene mutation status in pathogenesis and clinical course. Leukemia 16, 993–1007, (2002). [DOI] [PubMed] [Google Scholar]
- 10.Gruber AJ et al. A comprehensive analysis of 3’ end sequencing data sets reveals novel polyadenylation signals and the repressive role of heterogeneous ribonucleoprotein C on cleavage and polyadenylation. Genome Res 26, 1145–1159, (2016). [DOI] [PMC free article] [PubMed] [Google Scholar]
- 11.Vorlova S et al. Induction of antagonistic soluble decoy receptor tyrosine kinases by intronic polyA activation. Mol Cell 43, 927–939, (2011). [DOI] [PMC free article] [PubMed] [Google Scholar]
- 12.Zarnack K et al. Direct competition between hnRNP C and U2AF65 protects the transcriptome from the exonization of Alu elements. Cell 152, 453–466, (2013). [DOI] [PMC free article] [PubMed] [Google Scholar]
- 13.Lenz G et al. Oncogenic CARD11 mutations in human diffuse large B cell lymphoma. Science 319, 1676–1679, (2008). [DOI] [PubMed] [Google Scholar]
- 14.Bertin J et al. CARD11 and CARD14 are novel caspase recruitment domain (CARD)/membrane-associated guanylate kinase (MAGUK) family members that interact with BCL10 and activate NF-kappa B. J Biol Chem 276, 11877–11882, (2001). [DOI] [PubMed] [Google Scholar]
- 15.Mansouri L, Papakonstantinou N, Ntoufa S, Stamatopoulos K & Rosenquist R NF-kappaB activation in chronic lymphocytic leukemia: A point of convergence of external triggers and intrinsic lesions. Seminars in cancer biology 39, 40–48, (2016). [DOI] [PubMed] [Google Scholar]
- 16.Rakheja D et al. Somatic mutations in DROSHA and DICER1 impair microRNA biogenesis through distinct mechanisms in Wilms tumours. Nature communications 2, 4802, (2014). [DOI] [PMC free article] [PubMed] [Google Scholar]
- 17.De Paoli L et al. MGA, a suppressor of MYC, is recurrently inactivated in high risk chronic lymphocytic leukemia. Leukemia & lymphoma 54, 1087–1090, (2013). [DOI] [PubMed] [Google Scholar]
- 18.Hurlin PJ, Steingrimsson E, Copeland NG, Jenkins NA & Eisenman RN Mga, a dual-specificity transcription factor that interacts with Max and contains a T-domain DNA-binding motif. EMBO J 18, 7019–7028, (1999). [DOI] [PMC free article] [PubMed] [Google Scholar]
- 19.Ogawa H, Ishiguro K, Gaubatz S, Livingston DM & Nakatani Y A complex with chromatin modifiers that occupies E2F- and Myc-responsive genes in G0 cells. Science 296, 1132–1136, (2002). [DOI] [PubMed] [Google Scholar]
- 20.Huot G et al. CHES1/FOXN3 regulates cell proliferation by repressing PIM2 and protein biosynthesis. Molecular biology of the cell 25, 554–565, (2014). [DOI] [PMC free article] [PubMed] [Google Scholar]
- 21.Vogelstein B et al. Cancer genome landscapes. Science 339, 1546–1558, (2013). [DOI] [PMC free article] [PubMed] [Google Scholar]
- 22.Nadanaka S, Kinouchi H, Taniguchi-Morita K, Tamura J & Kitagawa H Down-regulation of chondroitin 4-O-sulfotransferase-1 by Wnt signaling triggers diffusion of Wnt-3a. J Biol Chem 286, 4199–4208, (2011). [DOI] [PMC free article] [PubMed] [Google Scholar]
- 23.Schmidt HH et al. Deregulation of the carbohydrate (chondroitin 4) sulfotransferase 11 (CHST11) gene in a B-cell chronic lymphocytic leukemia with a t(12;14)(q23;q32). Oncogene 23, 6991–6996, (2004). [DOI] [PubMed] [Google Scholar]
- 24.Milland J, Russell SM, Dodson HC, McKenzie IF & Sandrin MS The cytoplasmic tail of alpha 1,3-galactosyltransferase inhibits Golgi localization of the full-length enzyme. J Biol Chem 277, 10374–10378, (2002). [DOI] [PubMed] [Google Scholar]
- 25.Kessenbrock K et al. A role for matrix metalloproteinases in regulating mammary stem cell function via the Wnt signaling pathway. Cell stem cell 13, 300–313, (2013). [DOI] [PMC free article] [PubMed] [Google Scholar]
- 26.Wang L et al. Somatic mutation as a mechanism of Wnt/beta-catenin pathway activation in CLL. Blood, (2014). [DOI] [PMC free article] [PubMed]
- 27.Ni TK & Kuperwasser C Premature polyadenylation of MAGI3 produces a dominantly-acting oncogene in human breast cancer. eLife 5, (2016). [DOI] [PMC free article] [PubMed] [Google Scholar]
- 28.Berger AH, Knudson AG & Pandolfi PP A continuum model for tumour suppression. Nature 476, 163–169, (2011). [DOI] [PMC free article] [PubMed] [Google Scholar]
- 29.Beguelin W et al. EZH2 is required for germinal center formation and somatic EZH2 mutations promote lymphoid transformation. Cancer Cell 23, 677–692, (2013). [DOI] [PMC free article] [PubMed] [Google Scholar]
- 30.Ranzani V et al. The long intergenic noncoding RNA landscape of human lymphocytes highlights the regulation of T cell differentiation by linc-MAF-4. Nature immunology 16, 318–325, (2015). [DOI] [PMC free article] [PubMed] [Google Scholar]
- 31.Hoek KL et al. A cell-based systems biology assessment of human blood to monitor immune responses after influenza vaccination. PLoS One 10, e0118528, (2015). [DOI] [PMC free article] [PubMed] [Google Scholar]
- 32.Trimarchi T et al. Genome-wide mapping and characterization of Notch-regulated long noncoding RNAs in acute leukemia. Cell 158, 593–606, (2014). [DOI] [PMC free article] [PubMed] [Google Scholar]
- 33.Tian B, Hu J, Zhang H & Lutz CS A large-scale analysis of mRNA polyadenylation of human and mouse genes. Nucleic Acids Res 33, 201–212, (2005). [DOI] [PMC free article] [PubMed] [Google Scholar]
- 34.Anders S, Reyes A & Huber W Detecting differential usage of exons from RNA-seq data. Genome Res 22, 2008–2017, (2012). [DOI] [PMC free article] [PubMed] [Google Scholar]
- 35.Kim YK, Kim B & Kim VN Re-evaluation of the roles of DROSHA, Export in 5, and DICER in microRNA biogenesis. Proc Natl Acad Sci U S A 113, E1881–1889, (2016). [DOI] [PMC free article] [PubMed] [Google Scholar]
- 36.Berkovits BD & Mayr C Alternative 3’ UTRs act as scaffolds to regulate membrane protein localization. Nature 522, 363–367, (2015). [DOI] [PMC free article] [PubMed] [Google Scholar]
- 37.Karanth S, Zinkhan EK, Hill JT, Yost HJ & Schlegel A FOXN3 Regulates Hepatic Glucose Utilization. Cell reports 15, 2745–2755, (2016). [DOI] [PMC free article] [PubMed] [Google Scholar]
- 38.Li Z et al. A global transcriptional regulatory role for c-Myc in Burkitt’s lymphoma cells. Proc Natl Acad Sci U S A 100, 8164–8169, (2003). [DOI] [PMC free article] [PubMed] [Google Scholar]
- 39.Zeller KI et al. Global mapping of c-Myc binding sites and target gene networks in human B cells. Proc Natl Acad Sci U S A 103, 17834–17839, (2006). [DOI] [PMC free article] [PubMed] [Google Scholar]
- 40.Ren B et al. E2F integrates cell cycle progression with DNA repair, replication, and G(2)/M checkpoints. Genes Dev 16, 245–256, (2002). [DOI] [PMC free article] [PubMed] [Google Scholar]
- 41.Taubert S et al. E2F-dependent histone acetylation and recruitment of the Tip60 acetyltransferase complex to chromatin in late G1. Mol Cell Biol 24, 4546–4556, (2004). [DOI] [PMC free article] [PubMed] [Google Scholar]
- 42.Jenner RG et al. The transcription factors T-bet and GATA-3 control alternative pathways of T-cell differentiation through a shared set of target genes. Proc Natl Acad Sci U S A 106, 17876–17881, (2009). [DOI] [PMC free article] [PubMed] [Google Scholar]
- 43.Jezkova J et al. Brachyury regulates proliferation of cancer cells via a p27Kip1-dependent pathway. Oncotarget 5, 3813–3822, (2014). [DOI] [PMC free article] [PubMed] [Google Scholar]
- 44.Veeman MT, Slusarski DC, Kaykas A, Louie SH & Moon RT Zebrafish prickle, a modulator of noncanonical Wnt/Fz signaling, regulates gastrulation movements. Current biology : CB 13, 680–685, (2003). [DOI] [PubMed] [Google Scholar]
- 45.Mayr C & Bartel DP Widespread shortening of 3’UTRs by alternative cleavage and polyadenylation activates oncogenes in cancer cells. Cell 138, 673–684, (2009). [DOI] [PMC free article] [PubMed] [Google Scholar]
- 46.Landau DA et al. Evolution and impact of subclonal mutations in chronic lymphocytic leukemia. Cell 152, 714–726, (2013). [DOI] [PMC free article] [PubMed] [Google Scholar]
Associated Data
This section collects any data citations, data availability statements, or supplementary materials included in this article.
Supplementary Materials
Data Availability Statement
All 3′-seq and RNA-seq data generated and analyzed for this study have been deposited in the Gene Expression Omnibus database under accession numbers GSE111310 and GSE111793.
The code to analyze the data is available under https://bitbucket.org/leslielab/apa_2018/ and the processed data are available in Supplementary Table S1 (for Fig. 1b–d, 2a, 4a, Extended Data Fig. 3, and 4) and Supplementary Table S2 (for Extended Data Fig. 8a), and in the Source data files (for Fig. 1e, 2c, 2e, 3a, 3d, 4b–d, 4g, Extended Data Fig. 2c, 6j, 7c, and 8a). Data on DNA mutations from CLL patients were provided by Dan A. Landau (Weill-Cornell Medical College) and need to be requested from him. The mutation data on solid cancers was obtained through the MSK cbio portal. The data can be accessed through www.cbioportal.org.