Abstract
Nicotinamide adenine dinucleotide (NAD+) is an essential substrate for sirtuins and ADP-ribose polymerases (PARPs), NAD+-consuming enzymes localized to the nucleus, cytosol, and mitochondria. Fluctuations in NAD+ concentrations within these subcellular compartments are thought to regulate the activity of NAD+-consuming enzymes; however, the challenge in measuring compartmentalized NAD+ in cells has precluded direct evidence for this type of regulation. We describe the generation of a genetically-encoded fluorescent biosensor for directly monitoring free NAD+ concentrations in subcellular compartments. We found that the concentrations of free NAD+ in the nucleus, cytoplasm, and mitochondria approximate the Michaelis constant (Km) for sirtuins and PARPs in their respective compartments. Systematic depletion of enzymes that catalyze the final step of NAD+ biosynthesis revealed cell-specific mechanisms for maintaining mitochondrial NAD+ concentrations.
Beyond its role in redox reactions, NAD+ is an essential substrate for sirtuins and ADP-ribose polymerases (PARPs) (1). Although these enzymes serve different functions—sirtuins catalyze protein deacylation whereas PARPs catalyze ADP-ribosylation— both cleave the glycosidic bond between nicotinamide and ADP-ribose, resulting in the irreversible consumption of NAD+ (2, 3). As a consequence, mammalian cells rely on salvage pathways that recycle the nicotinamide generated by these NAD+-consuming enzymes to maintain NAD+ concentrations above a critical threshold. Nicotinamide phosophoribosyltransferase (NAMPT), the enzyme that converts nicotinamide to nicotinamide mononucleotide (NMN), is essential for maintaining NAD+ concentrations (4). The conversion of NMN to NAD+ is catalyzed by three enzyme isoforms, NMN adenyltransferases (NMNAT1–3) that are differentially localized (NMNAT1: nucleus; NMNAT2: Golgi, cytosol-facing; NMNAT3: mitochondria) (5), suggesting the existence of distinct subcellular NAD+ pools. Localized fluctuations in NAD+ levels may regulate the activity of the NAD+-consuming enzymes, which are also highly compartmentalized (6–8); however, there is no direct experimental evidence for this type of regulation because the concentration of free NAD+ (i.e. NAD+ available as a substrate) within these subcellular compartments is unknown. Moreover, it is unclear whether these NAD+ pools are segregated or readily exchangeable between subcellular compartments.
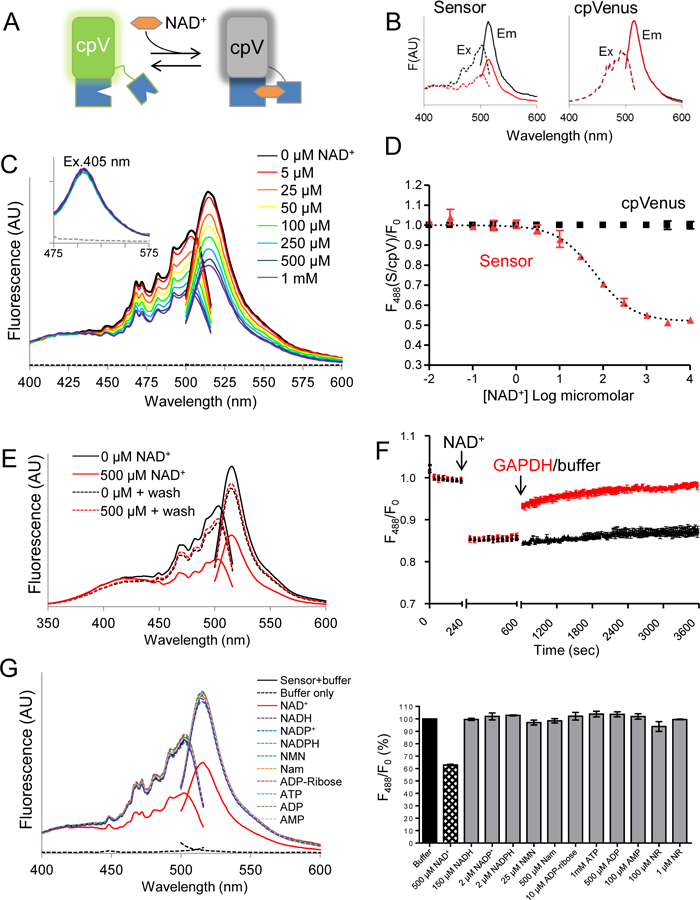
To address these issues, we developed a genetically encoded biosensor (9) for measuring free NAD+ concentrations within subcellular compartments. This sensor comprises a circularly-permuted Venus fluorescent protein (cpVenus) and a bipartite NAD+-binding domain modeled from bacterial DNA ligase (Fig. 1A and fig. S1) that exclusively uses NAD+ as a substrate (10). Point mutations were introduced to prevent NAD+ consumption and allow monitoring of NAD+ within the predicted physiological range. Purified sensor and cpVenus (fig. S2) had major excitation peaks at ~500 nm that fluoresced at ~520 nm (Fig. 1B). NAD+ decreased sensor fluorescence (ex. 488 nm) in a dose-dependent manner and minimally affected cpVenus fluorescence (Fig. 1, B and C). A second excitation peak at 405 nm was unaffected by NAD+ binding (Fig. 1C and fig. S3), allowing ratiometric (488/405 nm) measurements for normalizing sensor expression levels (fig. S4). In vitro, the apparent Kd(NAD+) of the sensor was ~65 µM (Fig. 1D). Absorbance measurements revealed two major species at ~415 nm and ~488 nm that appeared to interconvert upon NAD+ addition around a ~450 nm isosbestic point (fig. S5). This indicates that the NAD+-bound species loses its fluorescence at 488 nm, converting to a species that absorbs at 415 nm but is non-fluorescent. Accordingly, NAD+ did not affect the fluorescence lifetime following 488 nm excitation (fig. S6), providing further evidence that fluorescence following 488 nm excitation solely represents the unbound fraction.
Fig. 1. Characterization of an NAD+ biosensor.

(A) The NAD+ biosensor comprises cpVenus (cpV) and a bipartite NAD+-binding domain (blue). The unbound species fluoresces following excitation at 488 nm; NAD+ binding causes a loss of fluorescence. (B) Excitation (dashed lines) and emission (solid lines) scans of purified sensor with either 0 µM (black) or 500 µM (red) NAD+. Excitation was monitored at 530 nm and emission was monitored after excitation at 488 nm. (C) Fluorescence emission and excitation scans at indicated NAD+ concentrations or buffer only control (dashed lines). Inset shows fluorescence from excitation at 405 nm. (D) Maxima from 488 nm emission peaks of sensor and cpVenus (250 nM) at indicated NAD+ concentrations; mean±SD, n=3. (E) Fluorescence excitation and emission of sensor incubated with 0 µM (black solid) or 500 µM NAD+ (red solid). NAD+ was washed out and fluorescence was re-evaluated in each sample (dotted lines). (F) GAPDH (red) increases sensor fluorescence monitored at 520 nm following excitation at 488 nm. (G) (left) Excitation and emission profiles and (right) maxima from 488 nm emission with indicated substrates. mean±SD, n=3.
To confirm reversibility of NAD+-binding, we showed that elution of NAD+ from the sensor returned fluorescence to that of a control sample (Fig. 1E). We also monitored fluorescence in real time in the presence of glyceraldehyde 3-phosphate dehydrogenase (GAPDH), which has a higher affinity for NAD+ than the sensor and thereby competes for free NAD+ in the absence of substrate. We observed a rapid recovery of fluorescence upon GAPDH addition (Fig. 1F).
To determine sensor specificity, we evaluated fluorescence in the presence of related nucleotides and NAD+ precursors (Fig. 1G). Only NAD+ appreciably decreased sensor fluorescence. The absolute fluorescence intensities of the sensor and cpVenus displayed similar sensitivities to pH and the NAD+-dependent responses of the sensor were similar from pH 6.5 to (fig. S7). Thus, pH effects can be accounted for by normalizing to cpVenus. Fluorescence intensity was slightly affected by temperature but the Kd value of the unbound pool was not appreciably affected between 20–37ºC (fig. S8).
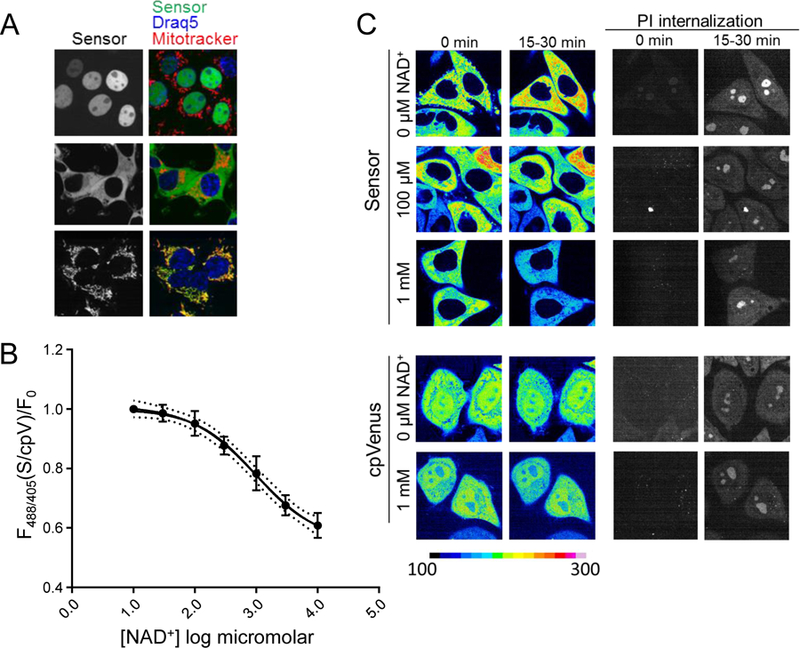
Localization sequences directing the sensor to the nucleus, cytoplasm, and mitochondria (Fig. 2A) did not affect responses to NAD+ in vitro (fig. S9). We generated clonal human embryonic kidney (HEK293T) lines stably expressing the localized sensors or their corresponding cpVenus control and verified that expression of the sensor itself did not affect NAD+ levels (fig. S10). To estimate concentrations of free intracellular NAD+, we permeabilized cells with digitonin to allow internal NAD+ to equilibrate with externally determined concentrations and monitored fluorescence by flow cytometry. Equilibration was assessed with propidium iodide (PI), whose molecular size is similar to NAD+ (fig. S11). NAD+ decreased fluorescence of the cytoplasmic sensor in a dose-dependent manner, (apparent Kd,app ~300 µM, dynamic range 30 µM - 1 mM) (Fig. 2B and fig. S12), and minimally affected cpVenus. The mean of the fluorescence ratio (488/405 nm) for the cytoplasmic sensor in non-permeabilized HEK293T cells relative to cpVenus was interpolated to reveal a free NAD+ value of 106 µM (95% CI, 92 µM to 122 µM). Using the same strategy, we determined that the concentration of free NAD+ was 109 µM in the nucleus (95% CI, 87 µM to 136 µM) (fig. S13) and 230 µM in mitochondria (95% CI, 191 μM to 275 μM). Mitochondrial measurements were fit to the curve obtained with the cytoplasmic sensor, representing a pool that readily equilibrated with externally added NAD+. We confirmed the cytoplasmic calculations with live microscopy using adherent human cervical cancer HeLa cells permeabilized with saponin and equilibrated with varying external NAD+ concentrations (Fig. 2C). Equilibration with 100 µM NAD+ minimally changed sensor fluorescence, compared to the fluorescence decrease observed with 1 mM NAD+. We observed similar fluorescence changes in populations of partially permeabilized HeLa cells analyzed by flow cytometry (fig. S14). Many nuclear and cytoplasmic NAD+-consuming enzymes have Km values for NAD+ around 100 µM and that of mitochondrial SIRT3 is around 250 µM (1), supporting the idea that these enzymes are poised to be regulated by local NAD+ fluctuations. The similarity in nuclear and cytoplasmic NAD+ levels suggests that NAD+ is readily exchangeable between the nucleus and cytoplasm.
Fig. 2. Free intracellular NAD+ measurements.

(A) HEK293T cells stably expressing nuclear, cytoplasmic, or mitochondrial sensors. Nuclear marker Draq5 (blue), mitochondrial marker Mitotracker CMXRos (red), sensor (green). (B) Cytoplasmic sensor (S) was calibrated for NAD+-dependent fluorescence changes in digitonin-permeabilized HEK293T cells. Ratio of 488/405 nm fluorescence measured with flow cytometry were normalized to cpVenus (cpV) and fit with a variable slope model; 95% confidence interval (dotted lines). (C) Representative images from adherent HeLa cells permeabilized with saponin in the presence of indicated NAD+ concentrations, as monitored by propidium iodide (PI) internalization, ex. 561, em. 617/73 (right). Live images were captured every 2.5 minutes and fluorescence intensity from 488 nm excitation is normalized to the indicated scale bar.
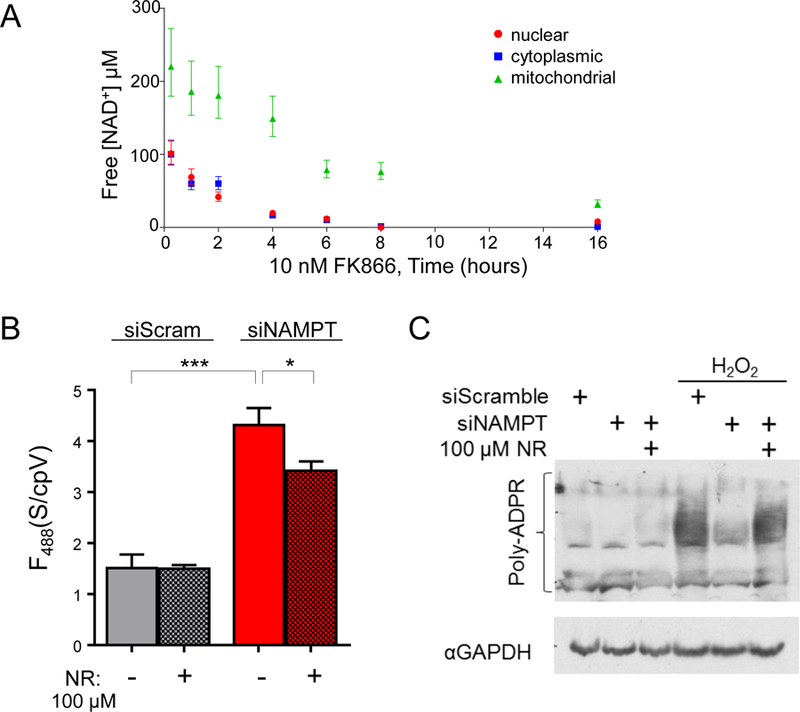
Mammalian cells predominantly rely on the NAMPT-dependent salvage pathway for NAD+ biosynthesis (4), so presumably NAD+ concentrations in all subcellular compartments would be affected by NAMPT inhibition. To test this idea, cells were treated with FK866 [N-[4- (1-benzoyl-4-piperidinyl)butyl]-3-(3-pyridinyl)-2E-propenamide], an NAMPT inhibitor, and NAD+ concentrations in various compartments were monitored with live flow cytometry (Fig. 3A) or microscopy (fig. S15). Changes in NAD+ concentrations were not detectable unless synthesis was blocked (fig. S16). The rate of free NAD+ depletion was similar in the nucleus and cytoplasm (t1/2 ~2 hours) and largely depended on PARP activity, as demonstrated by treatment with inhibitor Tiq-A (Thieno[2,3-c]isoquinolin-5-one) (fig. S16). Depletion of mitochondrial free NAD+ occurred at a slower rate (t1/2 ~8 hours) and was minimally affected by Tiq-A. FK866 treatment for 16 hours significantly decreased free NAD+ by over 85% in all compartments: nuclear (8 µM, 95% CI, 6 µM to 11 µM), cytoplasmic (3 µM, 95% CI, 0.1 µM to 6 µM) and mitochondria (32 µM, 95% CI, 27 µM to 38 µM), and was not prevented by Tiq-A treatment (fig. S16).
Fig. 3. NAD+ fluctuations in cells.

(A) Free NAD+ concentrations in HEK293T cells following treatment with FK866 (10 nM). Fluorescence of Sensor/cpVenus (488/405 nm) were measured by flow cytometry and the fold- change compared to untreated controls was interpolated onto an in vitro standard curve. (B) Cytoplasmic free NAD+ was decreased by NAMPT depletion and partially restored by NR treatment (100 µM). Imaging measurements from ex. 488 nm. REML, mean±SEM, n=3, ***p<0.001, *p<0.05. (C) Effect of free NAD+ availability on PARP activation.
We confirmed our pharmacological studies with NAMPT siRNAs, which depleted free NAD+ in all compartments (fig. S17). Nicotinamide riboside (NR) increased free NAD+ to 83 µM (95% CI, 72 µM to 98 µM) through a parallel pathway that bypasses NAMPT (11) (Fig. 3B and fig. S18). NR itself was not recognized by the sensor (Fig. 1G) and did not alter sensor fluorescence (fig. S19). These differences in free NAD+ availability affected PARP activity in response to H2O2- induced genotoxic stress (Fig. 3C).
An unanswered question is how pools of NAD+ in the nucleus, cytoplasm, and mitochondria are established and maintained. To address the specific roles of NMNAT isoforms on the creation and maintenance of compartmentalized NAD+ pools, we used validated siRNAs (fig. S20) to systematically deplete the NMNAT enzymes that catalyze the final step of NAD+ biosynthesis in each of these subcellular compartments (fig. S21) (5). Depletion of NMNAT2 decreased cytoplasmic NAD+ to 58 µM (95%CI, 50 µM to 67 µM), consistent with its subcellular expression pattern. Nuclear NAD+ concentrations, however, were not significantly affected (fig. S22), indicating that NMNAT1 is sufficient to meet the nuclear NAD+ demand but cannot fully compensate for depletion of NAD+ in the cytoplasm. This is consistent with the lethality of the individual animal knockout models (12, 13). Depletion of NMNAT1 did not significantly change nucleocytoplasmic NAD+ concentrations but levels trended lower (fig. S23A). We wondered whether the relatively similar amounts of NMNAT1 and NMNAT2 in HEK293T cells masked the NMNAT1 contribution to the cytoplasmic compartment, so we examined HeLa cells, which express relatively less NMNAT2 (fig. S24). In HeLa cells, depleting NMNAT1 significantly decreased cytoplasmic NAD+ to 38 µM (95% CI, 32 µM to 44 µM) (fig. S23B). Together, these data demonstrate that NMNAT1 can contribute to the cytoplasmic NAD+ pool and highlight cell-type dependent differences in NAD+ regulation.
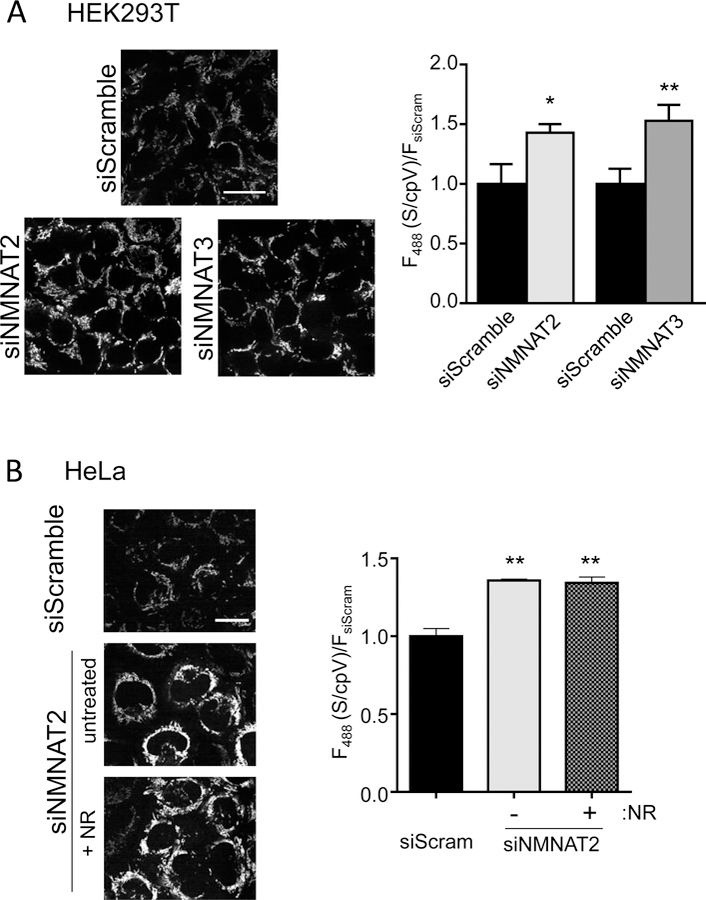
Our data indicate that free NAD+ in mitochondria fluctuates distinctly from the nucleocytoplasm (Fig. 3A and fig. S25). Moreover, the mitochondrial NMNAT isoform, NMNAT3, is thought to generate mitochondrial NAD+. Consistent with this idea, depleting NMNAT3 in HEK293T cells significantly decreased mitochondrial NAD+ concentrations to 103 µM (95% CI, 88 µM to 123 µM) (Fig. 4A and fig. S26). Depleting NMNAT2 also decreased mitochondrial NAD+ concentrations (Fig. 4A and fig. S26). This suggests that NAD+ made in the cytoplasm can influence mitochondrial stores and that NMN is not the sole source of mitochondrial NAD+.
Fig. 4. Multiple sources for mitochondrial NAD+.

(A) Imaging measurements of mitochondrial NAD+ sensor after depletion of either NMNAT2 or NMNAT3 in HEK293T cells. Scale bar, 25 μm. Ex. 488 nm fluorescence was normalized to cpVenusMito. Mean±SEM, n=3, REML, *p=0.03, **p<0.005. (B) Effect of NR treatment (250 µM, 24 hours) on NAD+ levels in the mitochondria of HeLa cells depleted of NMNAT2. Representative images, left. Scale bar, 25 μm. Quantitation of fluorescence, right, relative to cpVenusMito and siScramble. Mean±SEM, n=3, REML, **p<0.01.
Consistent with this idea, NMNAT3 depletion in HeLa cells, which contain low amounts of this enzyme, did not affect mitochondrial NAD+ concentrations (fig. S27). In contrast NMNAT2 depletion decreased both cytoplasmic NAD+ to 38 µM (95% CI, 33 µM to 45 µM) and mitochondrial NAD+ to 134 µM (95% CI, 113 µM to 161 µM) (Fig. 4B and fig. S28). Addition of NR did not restore mitochondrial NAD+ concentrations, implying that cytoplasmic NAD+, and not NMN, maintains mitochondrial NAD+ in HeLa cells (Fig. 4B). Thus, there appear to be multiple mechanisms for maintaining mitochondrial NAD+ in various cell types: conversion of NMN by NMNAT3 and transport of cytoplasmic NAD+. An NAD+ transporter has been identified in bacteria (14), yeast (15), and plants (16), but a mammalian homologue has not yet been identified.
Supplementary Material
Acknowledgments
We thank D. Piston for guidance and the cpVenus construct, C. Brenner and M. Michaud for NR, E. Cambronne for the E. fecalis isolate, J. Wiedrick and S. Markwardt for statistical help, G. Mandel for critical reading of the manuscript, and P. Brehm, J. and C. Galbraith, and H. Zhong for helpful discussions. Imaging, flow cytometry, and HPLC was supported by OHSU cores. Work was supported by the Pew Charitable Trust and the NIH (NS088629, UL1TR000128, P30NS061800, P30CA069533). XAC, MLS, MSC, and RHG are inventors on patent PCT/US15/62003 for the NAD+ sensor. Materials and methods are described in the supplemental data.
References
- 1.Cantó C, Menzies KJ, Auwerx J. NAD(+) Metabolism and the Control of Energy Homeostasis: A Balancing Act between Mitochondria and the Nucleus. Cell Metab 22, 31–53 (2015). [DOI] [PMC free article] [PubMed] [Google Scholar]
- 2.Sauve AA, Celic I, Avalos J, Deng H, Boeke JD, et al. Chemistry of gene silencing: the mechanism of NAD+-dependent deacetylation reactions. Biochemistry 40, 15456–15463 (2001). [DOI] [PubMed] [Google Scholar]
- 3.Hassa PO, Haenni SS, Elser M, Hottiger MO. Nuclear ADP-ribosylation reactions in mammalian cells: where are we today and where are we going? Microbiol Mol Biol Rev 70, 789–829 (2006). [DOI] [PMC free article] [PubMed] [Google Scholar]
- 4.Revollo JR, Grimm AA, Imai S. The NAD biosynthesis pathway mediated by nicotinamide phosphoribosyltransferase regulates Sir2 activity in mammalian cells. J Biol Chem 279, 50754–50763 (2004). [DOI] [PubMed] [Google Scholar]
- 5.Berger F, Lau C, Dahlmann M, Ziegler M. Subcellular compartmentation and differential catalytic properties of the three human nicotinamide mononucleotideadenylyltransferase isoforms. J Biol Chem 280, 36334–36341 (2005). [DOI] [PubMed] [Google Scholar]
- 6.Koch-Nolte F, Fischer S, Haag F, Ziegler M. Compartmentation of NAD+-dependent signalling. FEBS Lett 585, 1651–1656 (2011). [DOI] [PubMed] [Google Scholar]
- 7.Imai S, Guarente L. NAD+ and sirtuins in aging and disease. Trends Cell Biol 24, 464–471 (2014). [DOI] [PMC free article] [PubMed] [Google Scholar]
- 8.Houtkooper RH, Cantó C, Wanders RJ, Auwerx J. The secret life of NAD+: an old metabolite controlling new metabolic signaling pathways. Endocr Rev 31, 194–223 (2010). [DOI] [PMC free article] [PubMed] [Google Scholar]
- 9.Tantama M, Hung YP, Yellen G. Optogenetic reporters: Fluorescent protein-based genetically encoded indicators of signaling and metabolism in the brain. Prog Brain Res 196, 235–63 (2012). [DOI] [PMC free article] [PubMed] [Google Scholar]
- 10.Gajiwala KS, Pinko C. Structural rearrangement accompanying NAD+ synthesis within a bacterial DNA ligase crystal. Structure 12, 1449–1459 (2004). [DOI] [PubMed] [Google Scholar]
- 11.Bieganowski P, Brenner C. Discoveries of nicotinamide riboside as a nutrient and conserved NRK genes establish a Preiss-Handler independent route to NAD+ in fungi and humans. Cell 117, 495–502 (2004). [DOI] [PubMed] [Google Scholar]
- 12.Conforti L, Janeckova L, Wagner D, Mazzola F, Cialabrini L, et al. Reducing expression of NAD+ synthesizing enzyme NMNAT1 does not affect the rate of Wallerian degeneration. FEBS J 278, 2666–2679 (2011). [DOI] [PubMed] [Google Scholar]
- 13.Hicks AN, Campeau L, Burmeister D, Bishop CE, Andersson KE. Lack of nicotinamide mononucleotide adenylyltransferase 2 (Nmnat2): consequences for mouse bladder development and function. Neurourol Urodyn 32, 1130–1136 (2013). [DOI] [PMC free article] [PubMed] [Google Scholar]
- 14.Haferkamp I, Schmitz-Esser S, Linka N, Urbany C, Collingro A, et al. A candidate NAD+ transporter in an intracellular bacterial symbiont related to Chlamydiae. Nature 432, 622–625 (2004). [DOI] [PubMed] [Google Scholar]
- 15.Todisco S, Agrimi G, Castegna A, Palmieri F. Identification of the mitochondrial NAD+ transporter in Saccharomyces cerevisiae. J Biol Chem 281, 1524–1531 (2006). [DOI] [PubMed] [Google Scholar]
- 16.Palmieri F, Rieder B, Ventrella A, Blanco E, Do PT, et al. Molecular identification and functional characterization of Arabidopsis thaliana mitochondrial and chloroplastic NAD+ carrier proteins. J Biol Chem 284, 31249–31259 (2009). [DOI] [PMC free article] [PubMed] [Google Scholar]
Associated Data
This section collects any data citations, data availability statements, or supplementary materials included in this article.


