Abstract
Lipopolysaccharide (LPS) in Gram-negative bacteria is essential for outer membrane formation and antibiotic resistance. The LPS transport proteins A-G (LptA-G) move LPS from the inner to outer membrane. The ATP-binding cassette (ABC) transporter LptB2FG, tightly associated with LptC, extracts LPS out of the inner membrane. The mechanism of the entire LptB2FGC complex and the role of LptC are poorly understood. Here, we used single-particle cryo-EM to characterize the structures of LptB2FG and LptB2FGC in the nucleotide-free and vanadate-trapped states. These cryo-EM structures resolve the bound LPS, reveal the transporter-LPS interactions with side-chain details, and uncover the basis of coupling LPS capture and extrusion to conformational rearrangements of LptB2FGC. LptC inserts its transmembrane helix between the two transmembrane domains of LptB2FG, representing an unprecedented regulatory mechanism for ABC transporters. Our results suggest a role of LptC in coordinating LptB2FG action and the periplasmic Lpt protein interactions to achieve efficient LPS transport.
Gram-negative bacteria are the major cause of antibiotic-resistant infection1. They produce dual membranes with distinct permeation properties that prevent many antibiotics from entering the cells. While the inner membrane (IM) is a typical phospholipid bilayer, the outer leaflet of the outer membrane (OM) is composed almost exclusively of amphipathic lipopolysaccharide (LPS)2. LPS is a glycolipid consisting of lipid A, core oligosaccharides, and O-antigenic polysaccharides3. LPS biosynthesis is critical for building the OM and the survival of bacteria3,4. LPS also plays important roles in bacterial pathogenesis and inducing the host immune response5.
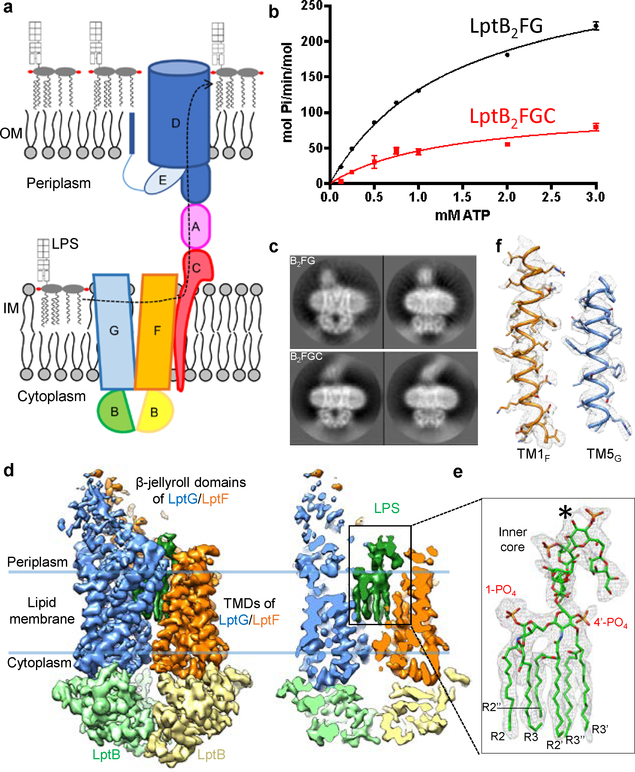
Newly synthesized LPS in the cytoplasmic leaflet of the IM must cross the IM, periplasm and OM6–8, a journey powered by two ATP-binding cassette (ABC) transporters: MsbA and LptB2FG. MsbA flips the nascent LPS across the IM. LptB2FG extracts the mature LPS out of the IM, and drives its unidirectional movement through a physically connected bridge formed by LptC, LptA and LptDE9,10 (Fig. 1a). Despite much structural information available for the Lpt proteins11–18, little is known about the structural basis of Lpt-LPS interactions.
Figure 1 |. Biochemical and cryo-EM studies of the Lpt complexes.
a, Diagram of the Lpt proteins bridging the IM and OM. The seven Lpt proteins are labeled A through G. b, ATPase activities of nanodisc-embedded LptB2FG and LptB2FGC. Each point represents mean ± s.d. (n = 3 biologically independent samples) c, Selected 2D class averages of LptB2FG and LptB2FGC. 2D classification analyses were performed once. d, Surface view and cross-sectional view of the cryo-EM map of LptB2FG, filtered to 4.0-Å resolution. LptF, LptG, two LptB subunits and LPS are colored separately. The boundaries of the IM are indicated by blue lines. e, Zoomed-in view of the atomic model of LPS superimposed with the cryo-EM density (grey). The asterisk indicates the position in the second heptose in the inner core where the outer core is attached. f, Cryo-EM densities of TM1F and TM5G superimposed with their atomic models.
In the LptB2FG ABC transporter, two LptB subunits form the nucleotide-binding domains (NBDs) that bind and hydrolyze ATP, while the transmembrane (TM) helices of LptF and LptG comprise the transmembrane domains (TMDs) that translocate LPS. Unlike most other ABC transporters translocating substrates across the membrane, LptB2FG extrudes LPS out of the membrane, likely via a currently unknown mechanism17,19. Two recently published crystal structures of LptB2FG in nucleotide-free conformations provide the first structural insights16,17, but no bound LPS was resolved.
LptB2FG forms a tight complex with LptC20. LptC has a single N-terminal TM helix (TMC) and a periplasmic β-jellyroll domain (C-bjr). The N- and C-terminal regions of C-bjr interact with LptB2FG and LptA, respectively21–24, mediating LPS movement from the IM to the periplasm21–26 (Fig. 1a). TMC is dispensable for cell viability, but removal of TMC decreases LptC association with LptB2FG22. The precise function of LptC and the mechanism of LptB2FGC remain enigmatic.
We utilized single-particle cryo-electron microscopy (cryo-EM) to characterize the structures of Escherichia coli LptB2FG and LptB2FGC in their nucleotide-free and vanadate-trapped conformations (Extended Data Table 1). Our studies reveal the structural basis of LPS capture and extrusion by the LptB2FGC complex, uncover a previously unknown mechanism by which an ABC transporter (LptB2FG) is regulated by an extra TM helix (TMC), and suggest a role of LptC in coordinating the LptB2FG action in the IM and the Lpt protein bridge formation in the periplasm.
Biochemical characterization of LptB2FG and LptB2FGC in nanodiscs
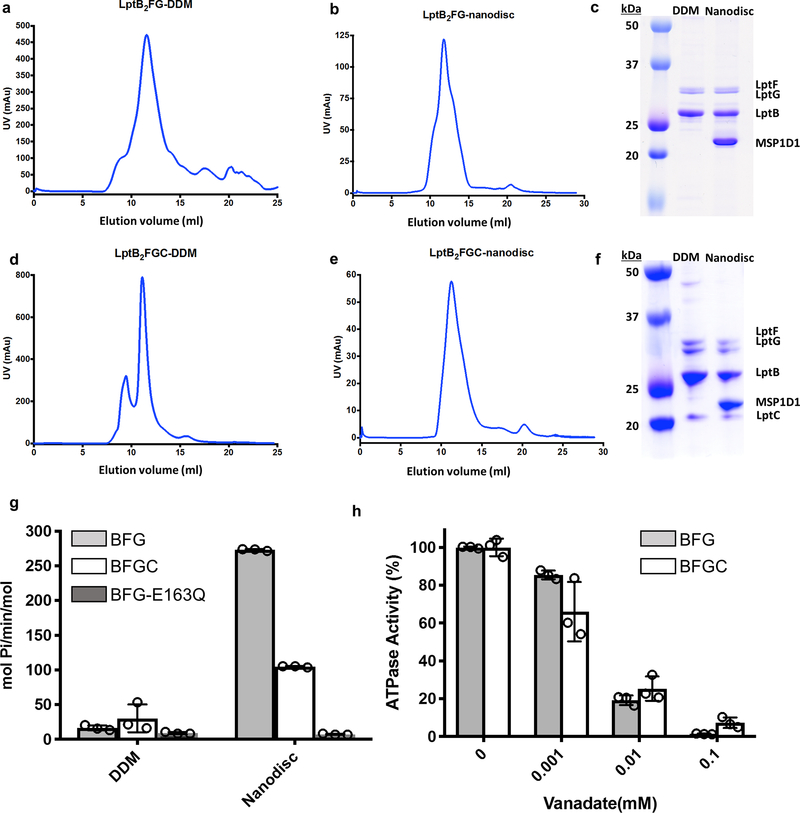
The LptB2FG and LptB2FGC complexes were overexpressed in E. coli BL21(DE3), purified in dodecyl maltoside (DDM), and reconstituted in nanodiscs with palmitoyl-oleoyl-phosphatidylglycerol (POPG) (Extended Data Fig. 1a-f). The ATPase activities of both complexes in nanodiscs were substantially higher than those in DDM (Extended Data Fig. 1g), indicating that lipid membrane is important to support the transporter activity. LptC inhibited the ATPase activity of LptB2FG in nanodiscs (Fig. 1b and Extended Data Fig. 1g), suggesting a regulatory role of LptC in LptB2FGC. Similar modulation by LptC was also observed in a proteoliposome system10.
Structure of LptB2FG with LPS bound inside the TMDs
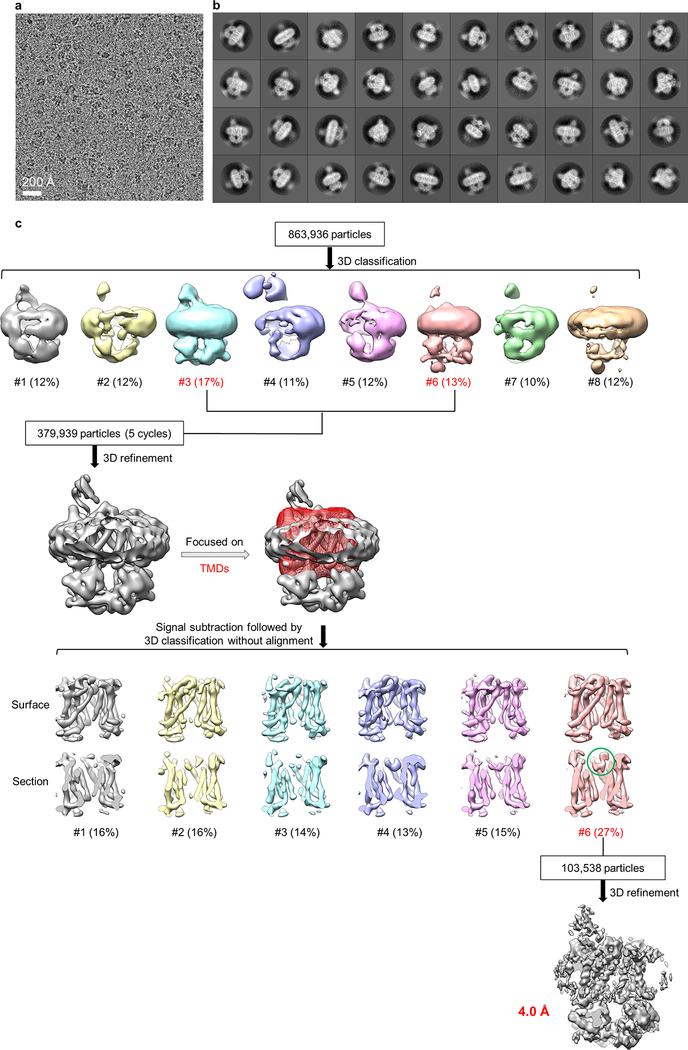
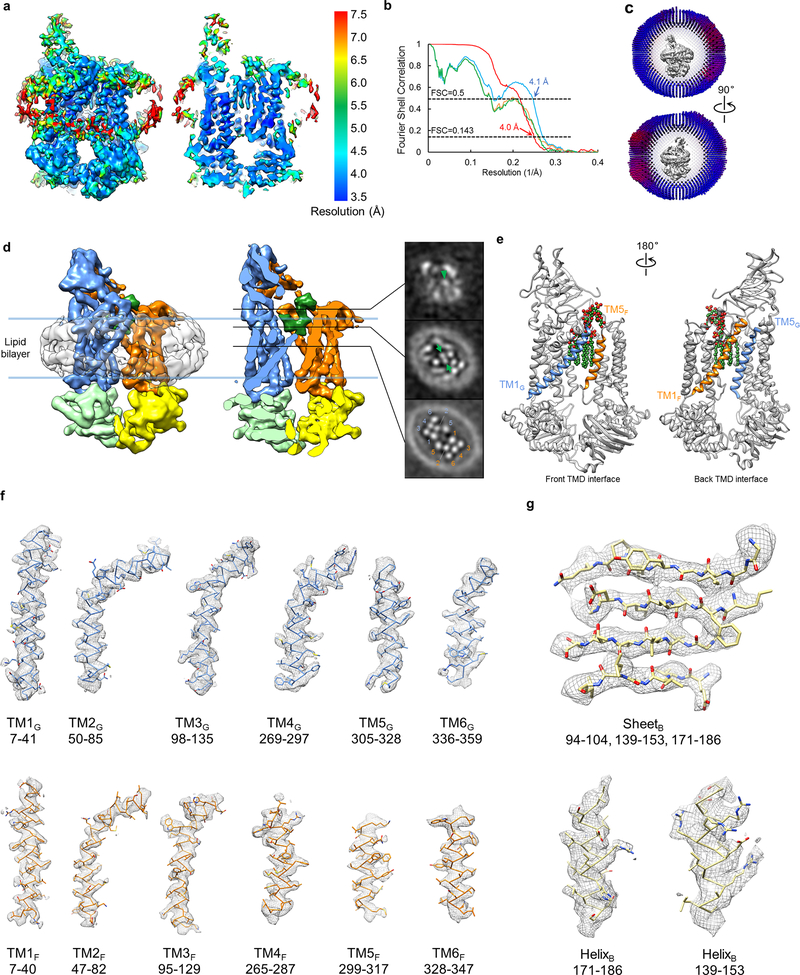
2D class averages of LptB2FG cryo-EM particle images showed clear structural features (first row in Fig. 1c and Extended Data Fig. 2b). The final cryo-EM map at 4.0-Å resolution (Fig. 1d and Extended Data Fig. 3a, b) reveals side-chain densities in the TMDs (Fig. 1f and Extended Data Fig. 3f), and secondary structural elements and many side-chain densities in the NBDs (Extended Data Fig. 3g). The two TMDs, each formed by six TM helices (TM1–6), show limited interactions between TM1 and TM5 (Extended Data Fig. 3e). The lower resolution of the β-jellyroll domains is likely due to mobility. Our cryo-EM structure of E. coli LptB2FG is similar to the crystal structure of K. pneumoniae LptB2FG16 (RMSD 1.46 Å over Cα atoms). Both structures have their β-jellyroll domains tilted to the side of LptG, which is different from the upright positioning of these domains in the crystal structure of LptB2FG from P. aeruginosa17.
An LPS molecule inside the TMDs was resolved, showing all six acyl chains, two phosphorylated glucosamines and the inner core composed of two Kdo (3-deoxy-D-manno-oct-2-ulosonic acid) and three heptose groups (Fig. 1e and Supplementary Video 1). The inner core is positioned above the level of lipid membrane, extending towards the periplasmic space (Fig. 1d and Extended Data Fig. 3d). The outer core is not visible, likely due to flexibility. E. coli BL21(DE3) used to express Lpt proteins possesses genetic modifications that prevent the attachment of O-antigen to LPS27. The LPS observed in our cryo-EM map was likely co-purified, since no exogenous LPS was added during purification or nanodisc reconstitution.
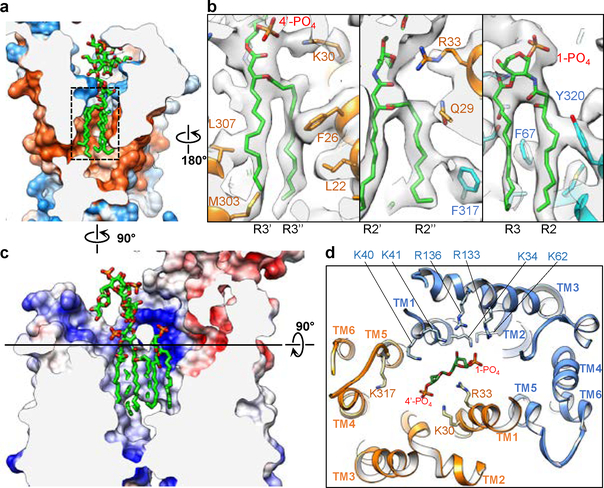
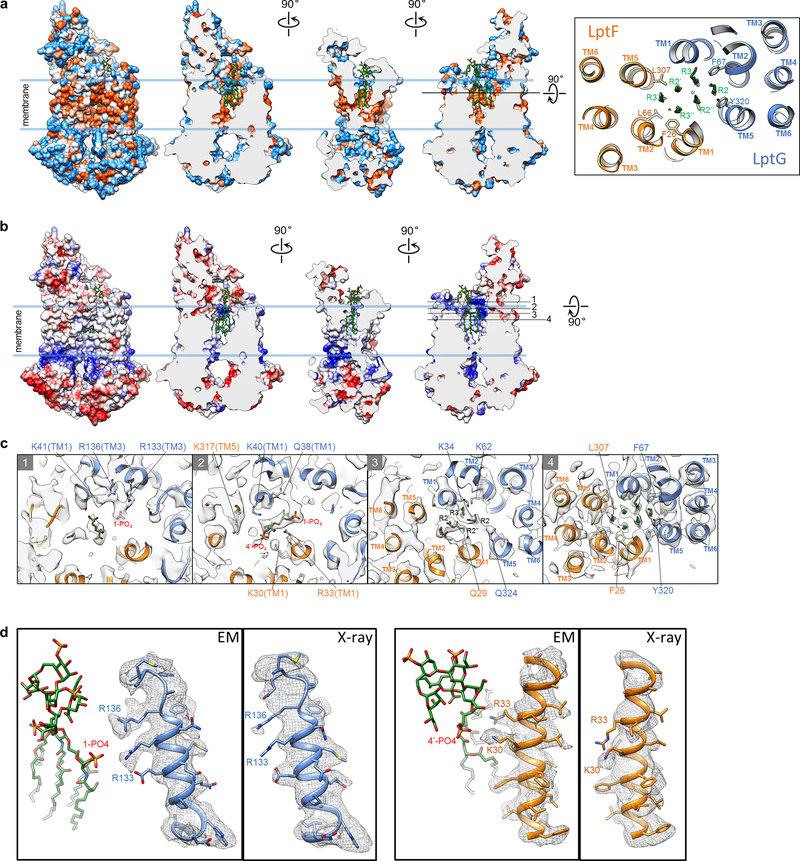
Six lipid acyl chains of LPS tightly fit into a cone-shaped hydrophobic pocket formed by TMs 1, 2, and 5 of LptF and LptG (Fig. 2a and Extended Data Fig. 4a). Leu307 and Phe26 in LptF and Phe317, Phe67 and Tyr320 in LptG form close contacts with the acyl chains (Fig. 2b). A ring of positively charged residues at the periplasmic opening of the pocket form electrostatic interactions with the bound LPS (Fig. 2c, d and Extended Data Fig. 4b, c). The negatively charged 1-PO4 group is accommodated by a cluster of positively charged residues from LptG: Lys34 and Lys41 on TM1G, Lys62 on TM2G, and Arg133 and Arg136 on TM3G; Arg33 from LptF (TM1F) also contributes to the interaction. In comparison, the 4’-PO4 group has fewer positively charged residues in its vicinity: Lys317 on TM5F, Lys40 on TM1G, and Lys30 and Arg33 on TM1F. Lys40G, Lys41G and Arg33F seem within distance to also interact with the inner core containing multiple phosphate groups. The side chains of several above-mentioned residues are disordered in the crystal structure of K. pneumoniae LptB2FG16 (Extended Data Fig. 4d), suggesting that LPS interactions stabilize them in our cryo-EM structure. In summary, the cavity inside the TMDs is highly complementary in both shape and surface properties to accommodate an LPS molecule. The observed LPS interactions with side-chain details provide the basis for understanding the functional effects of mutating the LPS-interacting residues16,17,28.
Figure 2 |. Interactions of LPS with LptB2FG.
a, Cross-sectional view of the hydrophobic surface rendering for the atomic model of LptB2FG, showing the tight fit of the LPS acyl chains into the hydrophobic pocket. Hydrophobic and hydrophilic regions are shown in orange and blue, respectively. LPS is shown as green sticks. b, Zoom-in views of the LPS acyl chains (dashed box in a), showing cryo-EM densities (grey surface) superimposed with the atomic model. c, Cross-sectional view of the electrostatic surface rendering for the atomic model of LptB2FG, indicating areas of positive (blue) and negative (red) charge. d, View perpendicular to the membrane plane of the cross section at the level indicated by the black line in c, showing the phosphorylated glucosamines and the positively charged residues in vicinity.
Structure of LptB2FGC and TMC interactions
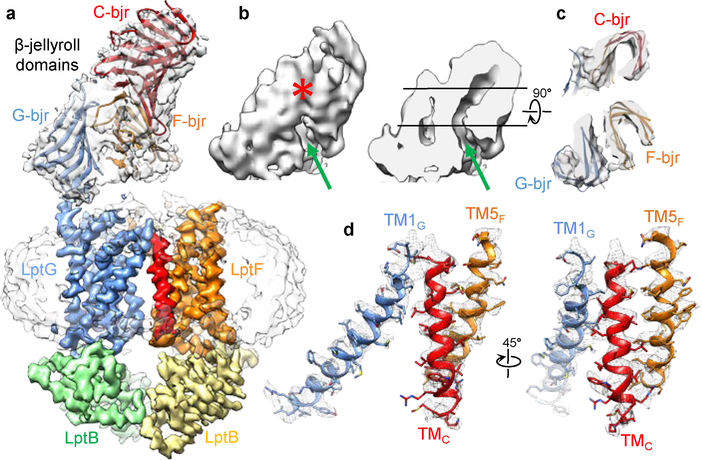
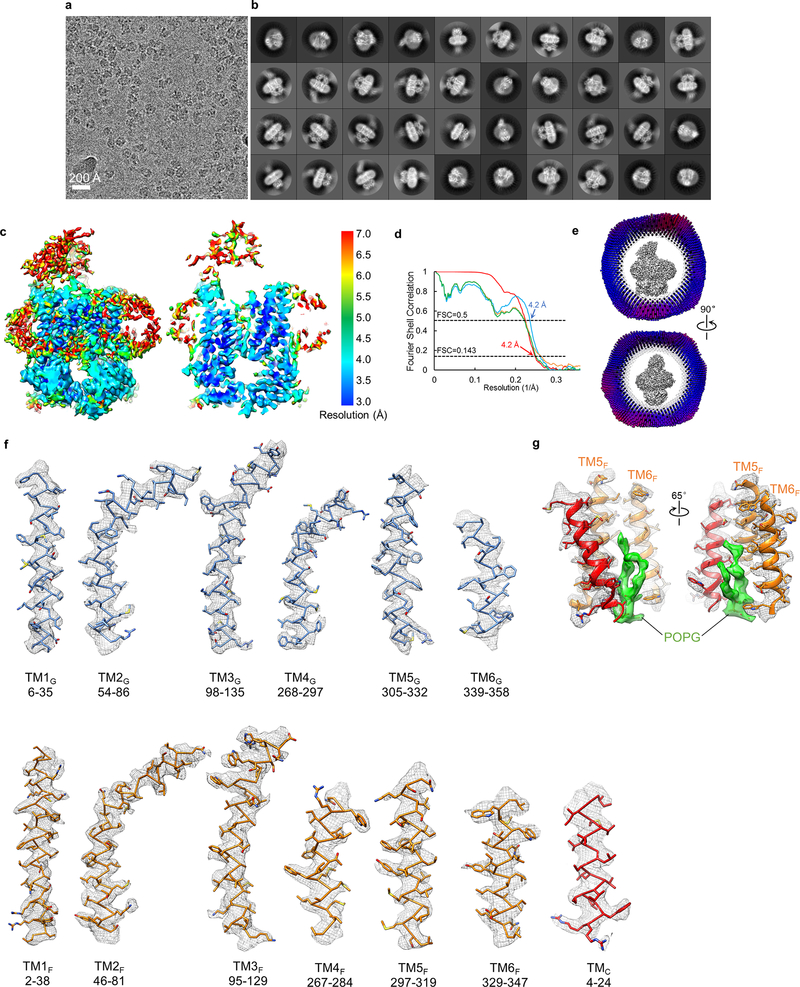
2D class averages of LptB2FGC showed a more extended feature above the nanodisc (second row in Fig. 1c and Extended Data Fig. 6b), which is consistent with the expected attachment of C-bjr on top of the β-jellyroll domains of LptF (F-bjr) and LptG (G-bjr). Image processing focusing on the TMDs and NBDs produced a final LptB2FGC map at 4.2-Å resolution for these regions (Extended Data Figs 5 and 6c, d). The side-chain densities in the TMDs are well defined (Extended Data Fig. 6f), revealing an additional TM helix from LptC (TMC) (Fig. 3a). TMC spans the membrane at a tilted angle, with its C-terminal region sandwiched between TM1G and TM5F at the periplasmic apex of the front TMD interface (Fig. 3a, d). This unexpected positioning of TMC presumably interferes with conformational changes of the TMDs upon ATP binding, thus implying a mechanism for the observed inhibition of LptB2FG by LptC (Fig. 1b). TMC interacts with TM1G weakly, but forms extensive hydrophobic interactions with TM5F through a series of Leu, Val, and Ile residues of the two helices (Fig. 3d). Between TMC, TM5F and TM6F, a lipid density was observed in the membrane inner leaflet and modeled as a POPG molecule (Extended Data Fig. 6g).
Figure 3 |. Structure of the LptB2FGC complex.
a, The final LptB2FGC cryo-EM map filtered to 4.2-Å resolution showing high-quality density for the TM helices and LptB subunits (colored). Superimposed is the long-bjr LptB2FGC map filtered to 4.8-Å resolution showing clear density for the nanodisc and β-jellyroll domains of F-bjr, G-bjr and C-bjr. Atomic models of F-bjr/G-bjr (PDB ID: 5X5Y) and C-bjr (PDB ID: 3MY2) were fit into the EM density as two rigid bodies. b, Surface view and sectional view of the cryo-EM density of the β-jellyroll domains showing a continuous groove (green arrow) extending through F-bjr and C-bjr. Near the periplasmic apex, C-bjr folds over the front of the groove (red asterisk). c, Cross-sectional views of the β-jellyroll domains as viewed from the periplasm at the levels indicated by the black lines in b. F-bjr and G-bjr associate in an antiparallel fashion (bottom), and C-bjr attaches to the top of F-bjr (top). The grooves inside F-bjr and C-bjr display different orientations. d, Two views of the cryo-EM densities of TMC, TM1G and TM5F superimposed with their atomic models.
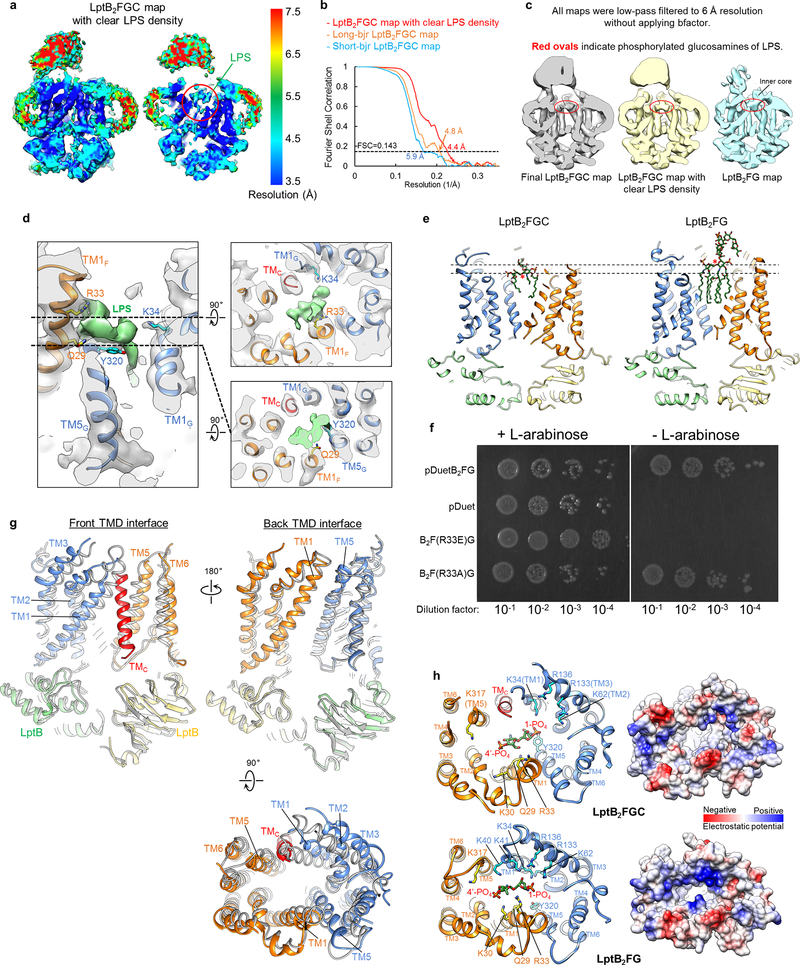
The LptB subunits in the cryo-EM structures of LptB2FGC and LptB2FG are nearly identical, and were used to align the two structures (Extended Data Fig. 7g). The insertion of TMC causes a large shift of TM1G and TM5F, along with the neighboring TM2G, TM3G and TM6F. These TM helices contain the positively charged residues that mediate electrostatic interactions with LPS in LptB2FG (Fig. 2d), and substantial conformational difference in these regions in LptB2FGC presumably leads to weaker LPS binding. Indeed, no well-defined density for bound LPS was observed in the cryo-EM map of LptB2FGC filtered at 4.2-Å resolution. When this map was filtered to a lower resolution (6 Å), a clear density appeared in the inner cavity, which resembles the glucosamine density in the cryo-EM map of LptB2FG filtered to the same resolution (Extended Data Fig. 7c, left and right). These observations suggest that TMC prevents TMDs from forming the optimal conformation for LPS binding, resulting in higher mobility of the bound LPS.
LPS bound inside the TMDs of LptB2FGC
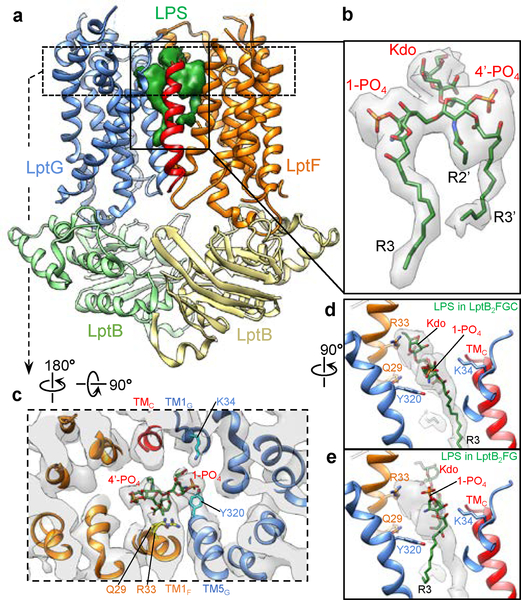
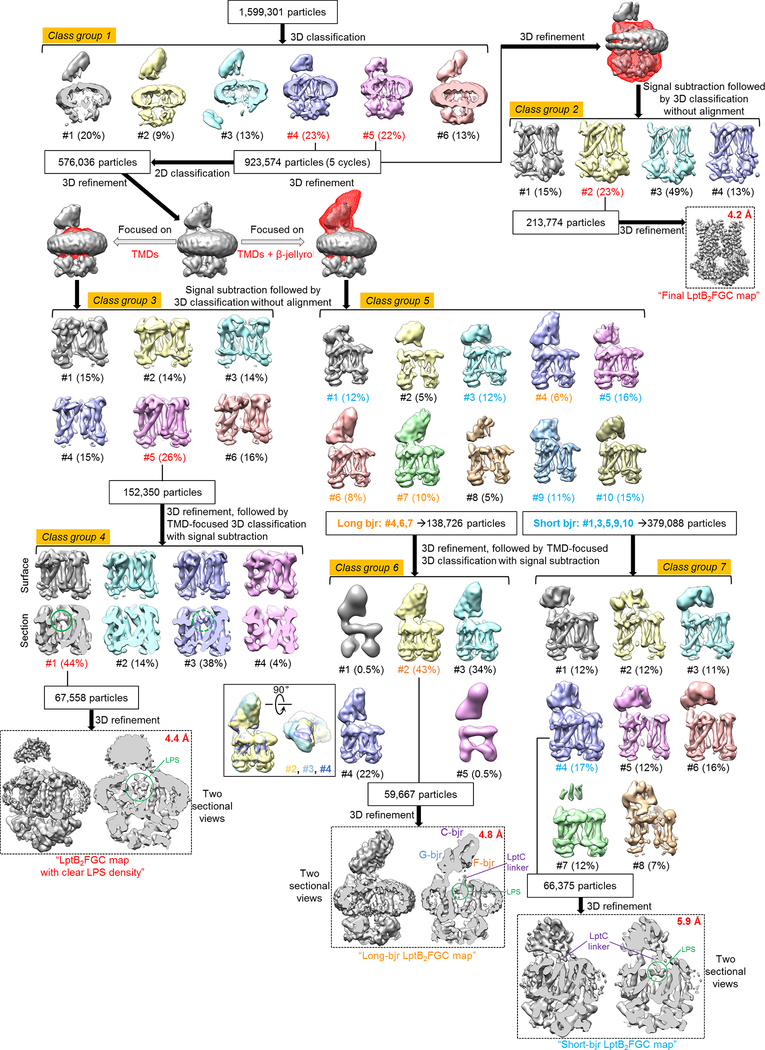
Further 3D classification focused on the TMDs of LptB2FGC showed well-resolved TM helices and strong LPS density (Extended Data Fig. 5, class groups 3 and 4), producing an LptB2FGC map with clear LPS density at 4.4-Å resolution (Extended Data Fig. 7a, b). The LPS density shows phosphorylated glucosamines, R3 and R3’ acyl chains, and the first Kdo group in the inner core (Fig. 4b). Consistent with the observation that LPS is more flexible in LptB2FGC, only four amino acids interact with the glucosamines and inner core; the LPS interactions stabilize these residues, resulting in observable side-chain densities (Fig. 4c, d and Extended Data Fig. 7d). The inner core tilts onto TM1F, forming close contacts with Arg33 and Gln29, which is distinct from the upright positioning of LPS in LptB2FG (Fig. 4d, e and Extended Data Fig. 7e). Additional contacts with LPS are mediated by Lys34 on TM1G and Tyr320 on TM5G, both via the 1-PO4 group. The two positively charged residues, Arg33F and Lys34G, may play critical roles in LPS recognition by forming electrostatic interactions with the inner core and phosphorylated glucosamine, respectively. Indeed, the single amino acid substitution of Arg33F with glutamic acid caused cell death (Extended Data Fig. 7f), and Lys34G is essential for LPS transport and bacterial growth28.
Figure 4 |. Interactions of LPS with LptB2FGC.
a, Cryo-EM structure of LptB2FGC with the LPS density (green surface). b, Cryo-EM density of LPS (grey surface) with the atomic model. c, Cross-section of the cryo-EM map (grey) at the level of the glucosamines and inner core, with the atomic model. Only the four residues with observable side-chain densities are shown. d, Sectional side view of LPS density (grey) with the atomic models of LPS and LptB2FGC. Kdo and 1-PO4 in LPS and the four LPS-interacting residues are labeled. e, Same as d, except that the atomic model of LPS from the LptB2FG structure is shown. The structures of LptB2FG and LptB2FGC are aligned using LptB subunits (Extended Data Fig. 7g).
In our cryo-EM structure of LptB2FGC, TMC pushes TM1–3 of LptG away from LptF, resulting in a wide periplasmic opening of the central cavity and keeping the positively charged residues on these helices away from the bound LPS (Extended Data Fig. 7h). Upon the removal of TMC, the positively charged residues from TM1–3 of LptG move towards the center of the periplasmic mouth of the LPS binding pocket (Supplementary Video 2), creating a highly positively charged surface to tightly bind LPS and to move LPS towards the periplasm (Extended Data Fig. 7e). The periplasmic end of TM1G containing Lys40 and Lys41 is disordered in the structure of LptB2FGC, but becomes ordered in the absence of LptC (Extended Data Fig. 7h, left panels). Thus, LPS-TM1G interaction may play an active role in breaking the weak contact between TMC and TM1G (Fig. 3d) to facilitate TMC displacement.
Dynamic interactions of the β-jellyroll domains in LptB2FGC
The cryo-EM particle images of LptB2FGC showing a short β-jellyroll domain region were almost 3 times more abundant than those showing a long β-jellyroll domain region (Extended Data Fig. 5, class group 5), indicating unstable C-bjr attachment. Further 3D classification revealed three orientations of the long β-jellyroll domain region (Extended Data Fig. 5, class group 6). The largest 3D class produced a 4.8-Å resolution long-bjr LptB2FGC map, in which the published models of F-bjr and G-bjr (PDB ID: 5X5Y)17 and C-bjr (PDB ID: 3MY2)25 were fit as two rigid bodies (Fig. 3a-c). This composite model showed that C-bjr was attached onto F-bjr, forming a continuous twisting groove which presumably accommodates the acyl chains of the extracted LPS. C-bjr appears to be closed (asterisk in Fig. 3b) and would block LPS movement. The C-bjr closure may be due to the lack of LptA binding or the absence of LPS in C-bjr.
3D classification revealed highly variable conformations of short β-jellyroll domain region, and generated a short-bjr LptB2FGC map at 5.9-Å resolution (Extended Data Fig. 5, class group 7). This map showed a curvier and better resolved LptC linker than the long-bjr LptB2FGC map, suggesting that LptC linker is stretched and more mobile when C-bjr is attached to F-bjr.
Structures of LptB2FG and LptB2FGC in vanadate-trapped conformations
Vanadate acts as a potent inhibitor of many ATPases by forming an ADP-vanadate complex that is trapped in the catalytic sites, stabilizing an intermediate conformation. To gain insight into the conformational rearrangements of LptB2FG and LptB2FGC triggered by ATP binding and/or hydrolysis, we characterized their structures in the presence of 1 mM sodium ortho-vanadate, a concentration 10 times higher than required for ~95% inhibition of the ATPase activity (Extended Data Fig. 1h). Most cryo-EM particle images showed tightly dimerized LptB subunits, indicating nearly complete trapping by ADP-vanadate (Extended Data Fig. 8d, e). Further image processing generated the cryo-EM maps of vanadate-trapped LptB2FG and LptB2FGC at resolutions of 4.1 and 4.3 Å, respectively (Extended Data Figs 8 and 9a-e). The TMDs and NBDs in these two structures are essentially identical.
Throughout the image processing for LptB2FGC, no TMC density was observed, even though most particle images showed a long β-jellyroll domain region (Extended Data Fig. 8e) which indicates stably attached C-bjr. Thus, upon ATP binding, TMC moves away from the TM1G-TM5F interface and becomes disordered, which facilitates C-bjr attachment on F-bjr and allows the TMDs to rearrange (discussed below).
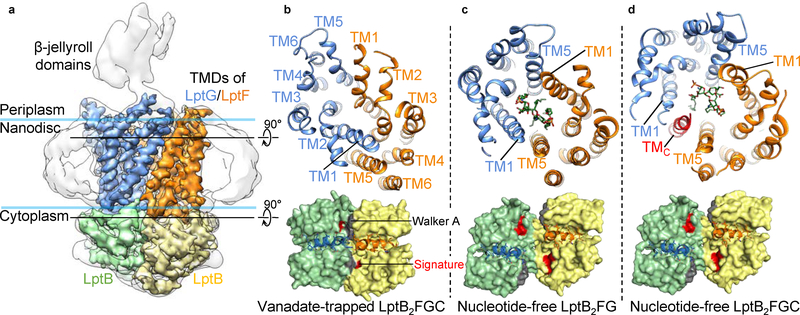
The cryo-EM structures of LptB2FG and LptB2FGC with vanadate revealed tight dimerization of the LptB subunits (Fig. 5a, b), caused by the trapping of ADP-vanadate at the ATP binding sites (Extended Data Fig. 9i). The LptB dimers are essentially the same as the crystal structure of isolated LptB (E163Q) dimer bound with two ATP molecules12 (PDB ID: 4P33, RMSD 1.05 Å over Cα atoms). The resolution of the bound nucleotides in our cryo-EM maps is not sufficient to distinguish between ATP and ADP-vanadate, and we cannot exclude the possibility that one of the two ATP sites contains ATP instead of ADP-vanadate. The dimerization of LptB engages the coupling helices between the TM2 and TM3 helices in LptF and LptG, pushing the two TMDs to rotate towards each other primarily by a rigid-body movement (Fig. 5b, d, lower panels, and Supplementary Video 3). The overall organization of the TM helices with pseudo 2-fold symmetry is maintained after vanadate trapping, which can also be seen in slice views of the 3D reconstructions (Extended Data Fig. 9f, lower panels). The only large local structural transition is the formation of a sharp kink in TM1F, resulting from the upper third of this helix bending outward and running more parallel to the membrane surface (Extended Data Fig. 9h, right). At the front TMD interface between TM1G and TM5F, the helices from each TMD slide past one-another to collapse the LPS-binding pocket (Fig. 5b, top), and no bound LPS was observed. Thus, the vanadate-trapped structures of LptB2FG and LptB2FGC represent a conformation after LPS expulsion. Additional intermediate conformations of LptB2FGC likely exist between the states of initial ATP binding and LPS extrusion. Whether LPS expulsion occurs before, during or after ATP hydrolysis awaits future study.
Figure 5 |. LptB2FGC in the vanadate-trapped conformation.
a, Surface view of the cryo-EM map of vanadate-trapped LptB2FGC filtered to 4.3-Å resolution with the TMDs and LptB subunits colored separately, superimposed with the same map filtered to 6-Å resolution (grey) to show the density for the nanodisc and β-jellyroll domains. b, Sectional views from the periplasm of the LPS-binding pocket (top) and the interface between LptG/F and LptB (bottom). Atomic model of the two LptB subunits (green and yellow) are shown in space-filling representation, with the Walker A and signature motifs colored in grey and red, respectively. The coupling helices of LptF (orange) and LptG (blue) are shown as ribbons. c, Same as b, except for the cryo-EM structure of nucleotide-free LptB2FG. LPS is shown as green sticks. d, Same as c, except for the cryo-EM structure of nucleotide-free LptB2FGC.
Discussion
Our results suggest a model of LPS extraction by LptB2FGC (Extended Data Fig. 9j): (1) LPS laterally enters the inner cavity; (2) LPS is recognized through relatively weak interactions with the TMDs; (3) TMc dissociates from the TMD interface, the TMDs rearrange to tightly bind LPS, and C-bjr stably associates with F-bjr; (4) ATP binding causes LptB dimerization and inward movement of the TMDs, leading to LPS expulsion; (5) additional cycles of the steps 1–4 extract more LPS molecules and push them towards C-bjr. Importantly, TMC appears to coordinate the ATPase activity of LptB2FG, LPS capture and extraction from the IM, and C-bjr binding to F-bjr in the periplasm. This suggests a previously unappreciated role of LptC in forming a highly efficient and tightly regulated LPS transport machinery.
LptB2FGC is a unique ABC transporter that regulates its activity using a TM helix from an associated protein. LptB2FGC captures LPS from the membrane outer leaflet, using a large outward-open cavity. This seemingly ‘outward-open’ conformation is functionally similar to the inward-facing conformations of many well-characterized ABC exporters19,29, because all these conformations show two separated NBDs and are competent for capturing substrates. Extensive LPS interactions lead to tighter association of the two TMDs, which lock the LPS in position, and the subsequent ATP binding and/or hydrolysis trigger an inward movement of the TMDs to collapse the inner cavity. Thus, our results do not support the previous models in which ATP binding induces further outward opening of the TMDs to allow LPS entry16,17,30. Our cryo-EM structures of nucleotide-free LptB2FGC, nucleotide-free LptB2FG and vanadate-trapped LptB2FGC (Fig. 5d, c and b) display a trajectory of structural rearrangements that gradually close the outward-open LPS-binding cavity to first lock and then squeeze out the bound LPS. Future structural studies will reveal whether this ‘lock and squeeze’ mechanism applies to other ABC exporters that extrude hydrophobic or amphipathic substrates from the membrane.
METHODS
Cloning, expression and purification of LptB2FG and LptB2FGC
The two gene fragments containing lptB with NcoI/EcoRI, and lptF-lptG with NdeI/KpnI were amplified individually from E. coli K-12 genomic DNA by PCR. The two fragments were subsequently ligated into the pCDFDuet-1 plasmid. The recombinant plasmid pCDFDuet-lptB-lptFG including an N-terminal His-tag on LptB was used to transform E. coli BL21(DE3) pLysS for LptB2FG expression. To overexpress LptC, the gene fragment containing lptC was amplified from genomic DNA with an N-terminal Strep tag and ligated into pCDFDuet-lptB-lptFG. The recombinant plasmid pCDFDuet-lptCB-lptFG was transformed to E. coli BL21(DE3) pLysS for LptB2FGC expression. The bacterial cells were grown at 37°C in Luria broth (LB) medium with 50 μg ml−1 spectinomycin until the optical density of the culture reached 1.0 at 600 nm. Protein expression was induced with 0.5 mM isopropyl β-D-1-thiogalactopyranoside (IPTG) and cells were grown for 12 h at 16°C. Cells were harvested by centrifugation, flash frozen in liquid nitrogen and stored at −80°C. Frozen cell pellets were re-suspended in lysis buffer containing 25 mM Tris, pH 7.8, 300 mM NaCl and 10% (v/v) glycerol and lysed by sonication (Branson). Unbroken cells and large debris were removed by centrifugation at 10,000g for 30 min at 4°C. Membranes were pelleted by ultra-centrifugation at 100,000g for 1 h at 4°C, re-suspended in lysis buffer, and solubilized with 1% (w/v) n-dodecyl-β-D-maltopyranoside (DDM, Anatrace) for 1 h at 4°C. LptB2FG and LptB2FGC were purified over TALON metal affinity resin (Clontech) followed by size-exclusion chromatography on a Superdex 200 column in a buffer containing 25 mM Tris, pH7.8, 150 mM NaCl, 0.05% DDM and 5% glycerol. Protein fractions with the highest homogeneity were collected and concentrated to 4 mg ml−1 and stored at −80°C.
Nanodisc reconstitution
1-palmitoyl-2-oleoyl-sn-glycero-3-phosphoglycerol (POPG) (Avanti Polar Lipids) was solubilized in chloroform, dried under argon gas to form a thin lipid film, and stored under vacuum overnight. The lipid film was hydrated and re-suspended at a concentration of 10 mM POPG in a buffer containing 25 mM Tris, pH 7.8, 150 mM NaCl and 100 mM sodium cholate. LptB2FG or LptB2FGC, MSP1D1 membrane scaffold protein, and POPG were mixed at a molar ratio of 0.5:1:60 in a buffer containing 25 mM Tris, pH 7.8, 150 mM NaCl and 15 mM sodium cholate, and incubated for 1 h at 4°C. Detergents were removed by incubation with 0.6 mg ml−1 Bio-Beads SM2 (Bio-Rad) overnight at 4°C. Nanodisc-embedded LptB2FG and LptB2FGC were purified using a Superdex 200 column in a buffer containing 25 mM Tris, pH 7.8, and 150 mM NaCl.
ATPase assay
All ATPase activity assays were modified from a previously described procedure31. 1 μg of purified LptB2FG or LptB2FGC in DDM or 0.5 μg LptB2FG or LptB2FGC in nanodiscs was incubated in a 50 μl reaction volume containing 25 mM Tris, pH 7.8, 150 mM NaCl, 0–6 mM ATP and 5 mM MgCl2 for 60 min at 37°C. The reaction was stopped by adding 50 μl 12% (w/v) SDS. Then 100 μl of 6% (w/v) ascorbic acid and 1% (w/v) ammonium molybdate in 1 N HCl was added. A final addition of 150 μl solution containing 25 mM sodium citrate, 2% (w/v) sodium metaarsenite and 2% (v/v) acetic acid was added, followed by incubation for 10 min at room temperature. Absorbance at 850 nm was measured using a SpectraMax M5 spectrophotometer (Molecular Devices). Potassium phosphate (KH2PO4) solutions in a concentration range from 0.05 to 0.6 mM were used to construct a standard curve to determine the total concentration of released phosphate. To obtain the amounts of LptB2FG and LptB2FGC in DDM and nanodiscs for comparison of their ATPase activities, the samples were run on SDS-PAGE followed by Coomassie Blue staining and quantification of the protein bands corresponding to LptF and LptG by densitometry (ImageJ).
Site-directed mutagenesis and functional assays
All mutations were generated following the protocol of NEB site-directed mutagenesis kit. The mutants on pCDFDuet-lptB-lptFG were transformed into the E. coli lptFG depleted NR1113 strain, plated on LB plates with 50 μg ml−1 spectinomycin in the presence of 0.2% L-arabinose, and grown for 12h at 37°C. The wild-type pCDFDuet-lptB-lptFG and empty vector pCDFDuet were transformed into the E. coli NR1113 and used as the positive and negative control, respectively. Single colonies were picked and inoculated into 5 ml LB supplemented with 50 μg ml−1 spectinomycin and 0.2% L-arabinose. The cells were harvested and then diluted in sterile LB to reach OD600 at 0.5. Each sample was subsequently serially diluted and the range was from 10−1 to 10−6. 5 μl of the diluted samples was spotted on LB plates containing 50 μg ml−1 spectinomycin with or without 0.2% L-arabinose. The plates were incubated at 37°C overnight and observed.
EM sample preparation and data acquisition
To prepare samples for cryo-EM analysis, 2.5 μl of purified nanodisc-embedded LptB2FG or LptB2FGC at a concentration of 4 mg ml−1 was applied to glow-discharged Quantifoil holey carbon grids (1.2/1.3, 400 mesh). For vanadate trapping, the samples were incubated in a buffer containing 2 mM ATP, 2 mM MgCl2, and 1 mM sodium orthovanadate for 20 min at room temperature before applying the samples to cryo-EM grids. Sodium orthovanadate stock was prepared as previously described32. Grids were blotted for 2.5–3 s with 92% relative humidity and plunge-frozen in liquid ethane cooled by liquid nitrogen using a Cryoplunge 3 System (Gatan). Cryo-EM data were collected at liquid nitrogen temperature on a Polara, Titan Krios or Talos Arctica electron microscope (ThermoFisher), equipped with a K2 Summit direct electron detector (Gatan). All cryo-EM videos were recorded in super-resolution counting mode with SerialEM data collection software33. The details of EM data collection parameters are listed in Extended Data Table 1.
EM image processing
EM data were processed as previously described34 with minor modifications. Dose-fractionated super-resolution videos collected using the K2 Summit direct electron detector were binned over 2 × 2 pixels, and then subjected to motion correction using the program MotionCor235. A sum of all frames of each videos was calculated following a dose-weighting scheme, and used for all image processing steps except for defocus determination. Defocus values of the summed images from all video frames without dose weighting were calculated using the program CTFFIND436. Particle picking was performed using a semi-automated procedure implemented in Simplified Application Managing Utilities of EM Labs (SAMUEL)37. 2D classification of selected particle images was performed with ‘samclasscas.py’, which uses SPIDER operations to run ten cycles of correspondence analysis, K-means classification and multi-reference alignment, or by RELION 2D classification38. Initial 3D models were generated from 2D class averages by SPIDER 3D projection matching refinement using ‘samrefine.py’, starting from a cylindrical density mimicking the general shape and size of nanodisc-embedded LptB2FG. 3D classification and refinement were carried out in RELION. Masked 3D classification with residual signal subtraction focusing on various structural regions was performed following a previously published procedure39. The orientation parameters of the homogenous set of particle images in selected 3D classes were iteratively refined to yield higher resolution maps using the ‘auto-refine’ procedure in RELION. All 3D classification and refinement steps were carried out without application of symmetry. All refinements followed the gold-standard procedure, in which two half datasets are refined independently. The overall resolutions were estimated based on the gold-standard Fourier shell correlation (FSC) = 0.143 criterion. Local resolution variations were estimated from the two half data maps using ResMap40. The amplitude information of the final maps was corrected by using ‘relion_postprocess’ in RELION or the program bfactor.exe41. The number of particles in each dataset and other details related to data processing are summarized in Extended Data Table 1.
Model building and refinement
The crystal structure of nucleotide-free K. pneumoniae LptB2FG (PDB ID: 5L75) was used as a template to build the initial structure for nucleotide-free E. coli LptB2FG. The structure was fit into the experimental map in UCSF Chimera42 and the sequence register was manually curated to change all amino acids to the correct E. coli sequence and to edit secondary structure restraints. Manual adjustment of the model was first performed in COOT43, followed by iterative rounds of real-space refinement in PHENIX44 and manual adjustment in COOT. Simulated annealing was used in the initial rounds of phenix.real_space_refine to help the model converge to the experimental map, and then omitted from the final rounds of refinement. LPS coordinates from the crystal structure of the TLR4-MD-2-LPS complex45 (PDB ID: 3FXI) were used to generate restraints for the ligand with the PRODRG sever46. The LPS molecule was then manually fit into the experimental map in COOT, followed by refinement in phenix.real_space_refine.
The atomic model of E. coli LptB2FG in the vanadate-trapped conformation was built by using the nucleotide-free structure as a starting model. Manual real-space refinement in COOT was initially used to adjust all TM helices and side chains to their approximate locations in the experimental map of the vanadate-trapped state. Subsequent iterative rounds of real-space refinement in PHENIX and manual adjustment in COOT were performed as described above to fit the model into the experimental map. Restraints for the ADP-vanadate complex were generated with phenix.elbow using the isomeric SMILES string obtained for the PDB Chemical Component Dictionary identifier AOV. The CIF restraint file for AOV generate from phenix.elbow was used in all refinements with phenix.real_space_refine. Figures and videos were prepared using UCSF Chimera, and the hydrophobicity surface was drawn according to the scale of Kyte and Doolittle47.
The models of nucleotide-free and vanadate-trapped E. coli LptB2FGC were built following similar procedures mentioned above. The structure of LptB2FG was initially manually adjusted and fit into the cryo-EM map of LptB2FGC in COOT before real space refinement in COOT and PHENIX. The model of the N-terminal tail and TMC in LptC (residues Met1 to Met24) was then manually built into the density map in COOT, and the entire structure refined with phenix.real_space_refine. Several periplasmic loops between TM helices of LptF or LptG lacked clear density, and were left un-modeled. In the LptB2FGC map with clear LPS density, the LPS molecule from LptB2FG was initially manually fit into the map and real-space refined in COOT. LPS atoms lacking clear density were manually deleted.
Data availability
Seven three-dimensional cryo-EM density maps of E. coli LptB2FG and LptB2FGC in nanodiscs have been deposited in the Electron Microscopy Data Bank under accession numbers EMD-9118 (nucleotide-free LptB2FG), EMD-9125 (nucleotide-free LptB2FGC, final map), EMD-9128 (nucleotide-free LptB2FGC, map with clear LPS density), EMD-9129 (nucleotide-free LptB2FGC, long-bjr map), EMD-9130 (nucleotide-free LptB2FGC, short-bjr map), EMD-9124 (vanadate-trapped LptB2FG) and EMD-9126 (vanadate-trapped LptB2FGC). Four atomic coordinates for the atomic models have been deposited in the Protein Data Bank under accession numbers 6MHU (nucleotide-free LptB2FG), 6MI7 (nucleotide-free LptB2FGC), 6MHZ (vanadate-trapped LptB2FG), 6MI8 (vanadate-trapped LptB2FGC).
Extended Data
Extended Data Figure 1 |. Purification and functional characterization of LptB2FG and LptB2CFG in DDM and in nanodiscs.
a, Gel-filtration chromatography profile of LptB2FG in DDM. b, Gel-filtration chromatography profile of LptB2FG in nanodiscs. c, Coomassie blue-stained SDS-PAGE gel of purified LptB2FG in DDM and in nanodiscs. Individual protein components of the complex are labeled. d, Gel-filtration chromatography profile of LptB2FGC in DDM. e, Gel-filtration chromatography profile of LptB2FGC in nanodiscs. f, Coomassie blue-stained SDS-PAGE gel of purified LptB2FGC in DDM and in nanodiscs. Individual protein components of the complex are labeled. The experiments in a-f were repeated three times independently with similar results. g, ATPase activity of LptB2FG and LptB2FGC in DDM and in nanodiscs. Each point represents mean ± s.d. of three separate measurements. h, Vanadate concentration-dependent inhibition of the ATPase activity of nanodisc-reconstituted LptB2FG and LptB2FGC. Each point represents mean ± s.d. of three separate measurements. For gel source data, see Supplementary Figure 1.
Extended Data Figure 2 |. Image processing for the cryo-EM data of nucleotide-free LptB2FG in nanodiscs.
a, Representative cryo-EM image of nucleotide-free LptB2FG in nanodiscs. b, 2D class averages of cryo-EM particle images. c, 3D classification and refinement of cryo-EM particle images. After the first round of 3D classification, all particles classified into the two best classes (#3 and #6) in the final 5 iterations (indicated as “5 cycles”) were kept for further processing. 3D classification focusing on the TMD was used to obtain the final cryo-EM map. LPS density is indicated with a green circle. EM data collection and 2D classification were performed once.
Extended Data Figure 3 |. Single-particle cryo-EM analysis of nucleotide-free LptB2FG in nanodiscs.
a, Local resolution of the final cryo-EM map of nucleotide-free LptB2FG. b, Fourier shell correlation (FSC) curves: gold-standard FSC curve between the two half maps with indicated resolution at FSC=0.143 (red); FSC curve between the atomic model and the final map with indicated resolution at FSC=0.5 (blue); FSC curve between half map 1 (orange) or half map 2 (green) and the atomic model refined against half map 1. c, Cutaway views of angular distribution of particle images included in the final 3D reconstruction. d, Surface view and sectional view of the cryo-EM map of nucleotide-free LptB2FG filtered to 6 Å resolution to show the lipid nanodisc, overall arrangement of TM helices, β-jellyroll domains and LPS (left). Slices through the cryo-EM map at the indicated planes. Arrowhead and arrows indicate the inner core and the phosphorylated glucosamines, respectively. Individual TM helices are numbered in the lower slice view. This analysis was performed once. e, Front and back TMD interfaces formed by the TM1 and TM5 helices from LptF and LptG, colored in orange and blue, respectively. LPS is shown as spheres. f, Cryo-EM densities superimposed with the atomic model for individual TM helices in the nucleotide-free LptB2FG. g, Cryo-EM densities superimposed with the atomic model for selected regions of the NBDs (LptB), demonstrating the clear separation of the β-strands and side chain densities.
Extended Data Figure 4 |. Hydrophobic and electrostatic interactions between LPS and LptB2FG.
a, Surface and sectional views of hydrophobic surface representation of nucleotide-free LptB2FG showing hydrophobic (orange) and hydrophilic (blue) areas. LPS is shown as green sticks. The right panel shows a view perpendicular to the membrane plane, with the TM helices and several acyl chain-interacting side chains shown as ribbons and sticks, respectively. b, Surface and sectional views of electrostatic surface representation of nucleotide-free LptB2FG showing areas of positive (blue) and negative (red) charge. LPS is shown as green sticks. c, Sectional views from the periplasm at the four different planes indicated in the right panel in a showing electrostatic and hydrophobic interactions of LPS with LptF and LptG. Cryo-EM density (grey surface) is superimposed with the atomic model. Side chains that interact with 1-PO4, 4’-PO4, and the acyl chains of LPS are labeled. d, Side views of the same regions in the 4-Å resolution cryo-EM map (left) and the 2Fo-Fc electron density map for the 3.46-Å resolution crystal structure (PDB: 5L75) (right). Electrostatic interactions with the 1-PO4 and 4’-PO4 groups stabilize the side chains of R133 and R136 in LptG and K30 and R33 in LptF.
Extended Data Figure 5 |. Image processing for the cryo-EM data of nucleotide-free LptB2FGC in nanodiscs.
Different subsets of particle images were selected from different classification schemes to produce four refined cryo-EM maps: final LptB2FGC map at 4.2-Å resolution, LptB2FGC map with clear LPS density at 4.4-Å resolution, long-bjr LptB2FGC map at 4.8-Å resolution and short-bjr LptB2FGC map at 5.9-Å resolution. After the first round of 3D classification, all particles classified into the two best classes (#4 and #5) in the final 5 iterations (indicated as “5 cycles”) were kept for further processing.
Extended Data Figure 6 |. Single-particle cryo-EM analysis of nucleotide-free LptB2FGC in nanodiscs.
a, Representative cryo-EM image of nucleotide-free LptB2FGC in nanodiscs. b, 2D class averages of cryo-EM particle images. c, Local resolution of the final cryo-EM map of nucleotide-free LptB2FGC. d, Fourier shell correlation (FSC) curves: gold-standard FSC curve between the two half maps with indicated resolution at FSC=0.143 (red); FSC curve between the atomic model and the final map with indicated resolution at FSC=0.5 (blue); FSC between half map 1 (orange) or half map 2 (green) and the atomic model refined against half map 1. e, Cutaway views of angular distribution of particles included in the final 3D reconstruction. f, Cryo-EM densities superimposed with the atomic model for individual TM helices in the nucleotide-free LptB2FGC. g, Cryo-EM density superimposed with the atomic model for a lipid molecule (POPG in green) and surrounding TMC, TM5F and TM6F. This density was modeled as a POPG molecule, because POPG was used for nanodisc reconstitution and is also abundant in the IM of E. coli. EM data collection and 2D classification were performed once.
Extended Data Figure 7 |. Analysis of the cryo-EM structure of nucleotide-free LptB2FGC.
a, Local resolution of the LptB2FGC map with clear LPS density. b, Gold-standard FSC curves between the two half maps for the three cryo-EM structures of nucleotide-free LptB2FGC. c, Sectional views of the final LptB2FGC map (4.2-Å resolution), the LptB2FGC map with clear LPS density (4.4-Å resolution) and the final LptB2FG map (4.0-Å resolution), all low-pass filtered to 6.0-Å resolution to compare the density of the phosphorylated glucosamines of the bound LPS. d, Sectional side view (left) and top-down views at two different levels (right) of the LptB2FGC map with clear LPS density (grey), superimposed with the atomic model. LPS density is colored in green. The four LPS-interacting residues are labeled. e, Sectional front views of the atomic models of LptB2FGC and LptB2FG that were aligned using the two LptB subunits as in panel g. LPS molecules are shown as green sticks. The two dashed lines indicate the heights at the level of the oxygen atom (red asterisk) in the ether bond connecting the two glucosamines. The distance between the positions of this oxygen atom in the LptB2FGC and LptB2FG structures is 6 Å. f, Functional analysis of R33F in the lptFG-depleted bacterial strain NR1113. All of the complementation assays were repeated three times independently with similar results, and one representative result is shown. g, Three perpendicular views of the superimposed atomic models of LptB2FG (gray) and LptB2FGC (colored as in Fig. 3a). Two structures are aligned using the two LptB subunits. h, Views from the periplasm of the LPS-binding pocket in the structures of LptB2FGC (upper panels) and LptB2FG (lower panels), shown as ribbon diagram (left) and electrostatic surface (right). The residues mediating electrostatic interactions with LPS in either LptB2FG or LptB2FGC are labeled.
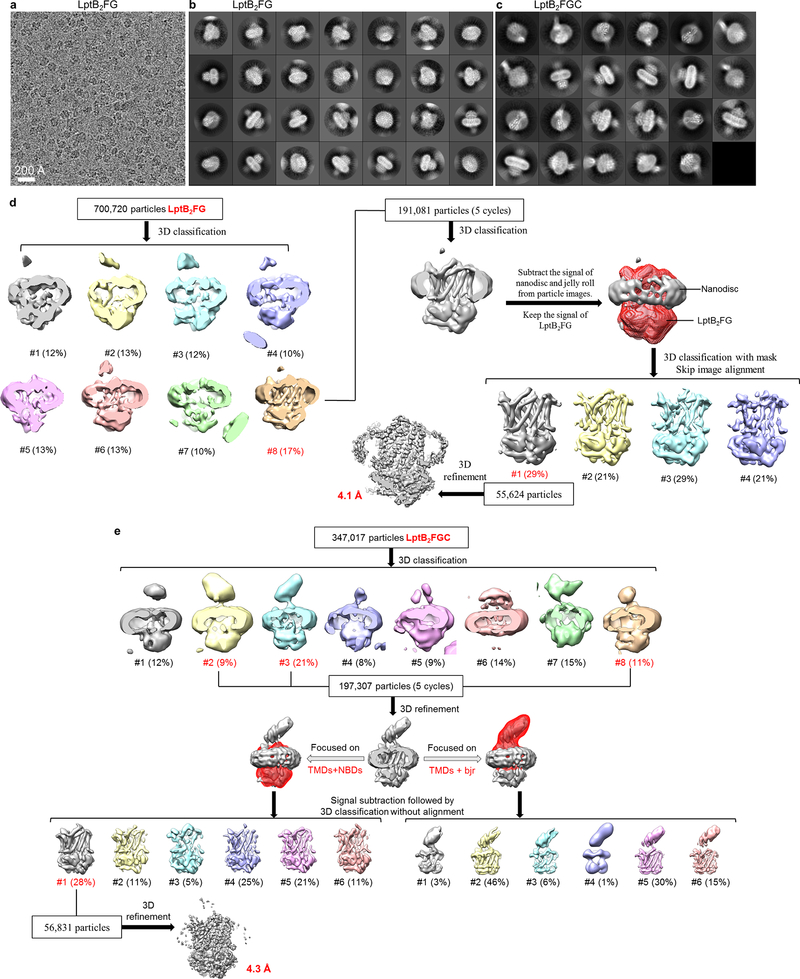
Extended Data Figure 8 |. Image processing for the cryo-EM data of nanodisc-embedded LptB2FG and LptB2FGC with vanadate.
a, Representative cryo-EM image of vanadate-trapped LptB2FG in nanodiscs. b, 2D class averages of cryo-EM particle images of vanadate-trapped LptB2FG in nanodiscs. c, 2D class averages of cryo-EM particle images of vanadate-trapped LptB2FGC in nanodiscs. d, Image processing workflow of vanadate-trapped LptB2FG. e, Image processing workflow of vanadate-trapped LptB2FGC. After the first round of 3D classification, all particles classified into the best classes in the final 5 iterations (indicated as “5 cycles”) were kept for further processing. EM data collection and 2D classification were performed once.
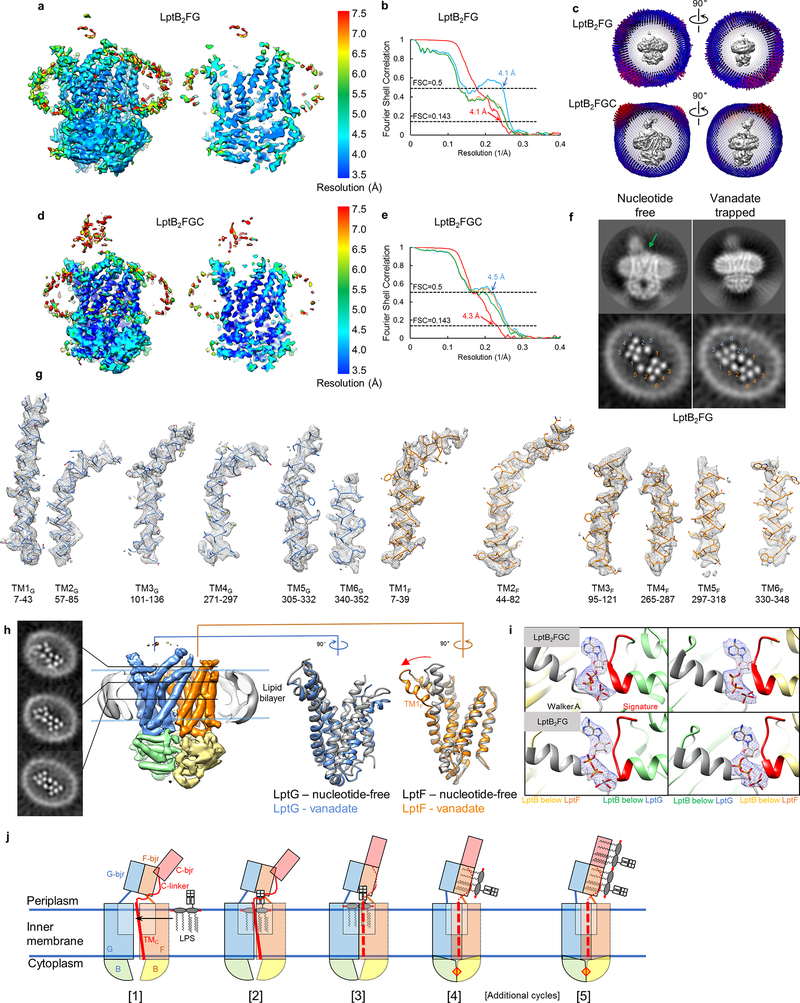
Extended Data Figure 9 |. Single-particle cryo-EM analysis of nanodisc-embedded LptB2FG and LptB2FGC with vanadate.
a, Local resolution of the cryo-EM map of vanadate-trapped LptB2FG. b, Fourier shell correlation (FSC) curves: gold-standard FSC curve between the two half maps with indicated resolution at FSC=0.143 (red); FSC curve between the atomic model and the final map with indicated resolution at FSC=0.5 (blue); FSC between half map 1 (orange) or half map 2 (green) and the atomic model refined against half map 1. c, Cutaway views of angular distribution of particles included in the final 3D reconstructions of vanadate-trapped LptB2FG (top) and LptB2FGC (bottom). d, Same as a, except for vanadate-trapped LptB2FGC. e, Same as b, except for vanadate-trapped LptB2FGC. f, Representative 2D class averages (top) and slices of 3D reconstructions (bottom) of nucleotide-free (left) and vanadate-trapped (right) LptB2FG. LPS density is indicated with a green arrow. These two slices are the same as the bottom slice in Extended Data Fig. 3d and the bottom slice in h. g, Cryo-EM densities with the atomic models for individual TM helices in the vanadate-trapped LptB2FG. h, Cryo-EM map of vanadate-trapped LptB2FG filtered to 6-Å resolution to show the overall arrangement of the TM helices and LptB subunits. Slices through the 3D map at the indicated planes show the positions of individual TM helices and the collapse of the inner cavity (left). Overlays of the TMDs of LptF or LptG in the nucleotide-free (grey) and vanadate-trapped (blue and orange) LptB2FG show only small differences within each TMD (right). Red arrow indicates the bending of TM1F upon nucleotide binding. i, Cryo-EM densities for the ADP-vanadate complexes trapped at the two ATP binding sites between the LptB subunits in LptB2FGC and LptB2FG. The Walker A and signature motifs are colored in grey and red, respectively. j. Proposed model for LptB2FGC-driven LPS extraction. The Lpt proteins are colored as in Fig. 3a. Three β-jellyroll domains, TMC and LptC linker are labeled. LPS is depicted as a cartoon model of lipid A with the inner core. TMC and LptC linker are shown as dashed lines in the steps 3–5 to indicate their increased mobility. The ATP molecule, before or after hydrolysis, is indicated as a red diamond sandwiched between the two LptB subunits. Additional cycles of LPS extraction are between the steps 4 and 5. See text for description of proposed LPS-extraction cycle. The analyses in f and h were performed once.
Extended Data Table 1 |.
Statistics of the cryo-EM structures presented in this study.
| Nucleotide- free LptB2FG | Nucleotide-free LptB2FGC | Vanadate-trapped LptB2FG | Vanadate-trapped LptB2FGC | ||||
|---|---|---|---|---|---|---|---|
| “Final LptB2FGC map” | “LptB2FGC Map with clear LPS” | “Long-bjr LptB2FGC map” | “Short-bjr LptB2FGC map” | ||||
| EMDB-9118 | EMDB-9125 | EMDB-9128 | EMDB-9129 | EMDB-9130 | EMDB-9124 | EMDB-9126 | |
| PDB 6MHU | PDB 6MI7 | PDB 6MHZ | PDB 6MI8 | ||||
| Data collection and processing | |||||||
| Microscope | Polara | Polara / Talos | Polara | Krios | |||
| Magnification | 31,000 | 31,000/36,000 | 31,000 | 130,000 | |||
| Voltage (kV) | 300 | 300 / 200 | 300 | 300 | |||
| Electron exposure (e−/Å2 | 52 | 52/47 | 52 | 45 | |||
| Defocus range (pm) | 1.4–3.0 | 1.0–3.5/1.0 –2.5 | 1.1 –3.0 | 1.6–3.6 | |||
| Pixel size (Å) | 1.23 | 1.23/1.17 | 1.23 | 1.06 | |||
| Number of movies | 4596 | 4600 / 4445 | 4200 | 3823 | |||
| Symmetry imposed | Cl | Cl | Cl | Cl | |||
| Initial particle images (no.) | 863,936 | 805,510/793,791 | 700,720 | 347,017 | |||
| Final particle images (no.) | 103,538 | 213,774 | 67,558 | 59,667 | 66,375 | 55,624 | 56,831 |
| Map resolution (Å) | 4.0 | 4.2 | 4.4 | 4.8 | 5.9 | 4.1 | 4.3 |
| FSC threshold | 0.143 | 0.143 | 0.143 | 0.143 | 0.143 | 0.143 | 0.143 |
| Map resolution range (Å) | 3.5–7.5 | 3.0–7.0 | 3.5–7.5 | 4.8–8.1 | 5.2–9.0 | 3.5–7.5 | 3.5–7.5 |
| Refinement | |||||||
| Initial model used (PDB code) | 5F75 | 6MHU | 6MHU | 6MHU | |||
| Model resolution (Å) | 4.1 | 4.2 | 4.1 | 4.5 | |||
| FSC threshold | 0.5 | 0.5 | 0.5 | 0.5 | |||
| Model resolution range (Å) | 3.5–7.5 | 3.0–7.0 | 3.5–7.5 | 3.5–7.5 | |||
| Map sharpening B factor (Å2) | −220 | −300 | −150 | −150 | −300 | −200 | −240 |
| Model composition | |||||||
| Non-hydrogen atoms | 8812 | 7236 | 7050 | 7050 | |||
| Protein residues | 1112 | 931 | 908 | 908 | |||
| Ligands | 1 | 1 | 1 | 1 | |||
| B factors (Å2) | |||||||
| Protein | 74.1 | 72.3 | 33.1 | 82.1 | |||
| Ligand | 45.7 | 19.2 | 62.6 | ||||
| R.m.s. deviations | |||||||
| Bond lengths (Å) | 0.007 | 0.005 | 0.008 | 0.007 | |||
| Bond angles (°) | 1.213 | 1.132 | 1.323 | 1.250 | |||
| Validation | |||||||
| MolProbity score | 1.9 | 1.8 | 2.0 | 1.9 | |||
| Clashscore | 6.1 | 5.0 | 8.9 | 6.3 | |||
| Poor rotamers (%) | 0.43 | 0.38 | 0.39 | 0.13 | |||
| Ramachandran plot | |||||||
| Favored (%) | 89.3 | 90.7 | 89.9 | 91.2 | |||
| Allowed (%) | 10.7 | 9.3 | 10.0 | 8.8 | |||
| Disallowed (%) | 0.0 | 0.0 | 0.1 | 0.0 | |||
Supplementary Material
Acknowledgements
We are grateful to Z. Li and M. Chambers at HMS and C. Xu and K. Song at UMass cryo-EM facility for EM technical support. We thank T. Silhavy for providing lptFG deletion strain NR1113. We thank T. Walz, T. Rapoport, T. Walther and W. Harper for critical reading of the manuscript. We thank the members of the Liao group for helpful discussions and comments on the manuscript. This work was supported by NIH grant R01GM122797 to M. Liao.
Footnotes
The authors declare no competing financial interests.
REFERENCES
- 1.Boucher HW et al. Bad bugs, no drugs: no ESKAPE! An update from the Infectious Diseases Society of America. Clin Infect Dis 48, 1–12, doi: 10.1086/595011 (2009). [DOI] [PubMed] [Google Scholar]
- 2.Raetz CR & Whitfield C Lipopolysaccharide endotoxins. Annual review of biochemistry 71, 635–700, doi: 10.1146/annurev.biochem.71.110601.135414 (2002). [DOI] [PMC free article] [PubMed] [Google Scholar]
- 3.Raetz CR, Reynolds CM, Trent MS & Bishop RE Lipid A modification systems in gram-negative bacteria. Annual review of biochemistry 76, 295–329, doi: 10.1146/annurev.biochem.76.010307.145803 (2007). [DOI] [PMC free article] [PubMed] [Google Scholar]
- 4.Whitfield C & Trent MS Biosynthesis and export of bacterial lipopolysaccharides. Annual review of biochemistry 83, 99–128, doi: 10.1146/annurev-biochem-060713-035600 (2014). [DOI] [PubMed] [Google Scholar]
- 5.Beutler B & Rietschel ET Innate immune sensing and its roots: the story of endotoxin. Nat Rev Immunol 3, 169–176, doi: 10.1038/nri1004 (2003). [DOI] [PubMed] [Google Scholar]
- 6.Ruiz N, Kahne D & Silhavy TJ Transport of lipopolysaccharide across the cell envelope: the long road of discovery. Nature reviews. Microbiology 7, 677–683, doi: 10.1038/nrmicro2184 (2009). [DOI] [PMC free article] [PubMed] [Google Scholar]
- 7.May JM, Sherman DJ, Simpson BW, Ruiz N & Kahne D Lipopolysaccharide transport to the cell surface: periplasmic transport and assembly into the outer membrane. Philosophical transactions of the Royal Society of London. Series B, Biological sciences 370, doi: 10.1098/rstb.2015.0027 (2015). [DOI] [PMC free article] [PubMed] [Google Scholar]
- 8.Simpson BW, May JM, Sherman DJ, Kahne D & Ruiz N Lipopolysaccharide transport to the cell surface: biosynthesis and extraction from the inner membrane. Philosophical transactions of the Royal Society of London. Series B, Biological sciences 370, doi: 10.1098/rstb.2015.0029 (2015). [DOI] [PMC free article] [PubMed] [Google Scholar]
- 9.Okuda S, Sherman DJ, Silhavy TJ, Ruiz N & Kahne D Lipopolysaccharide transport and assembly at the outer membrane: the PEZ model. Nature reviews. Microbiology 14, 337–345, doi: 10.1038/nrmicro.2016.25 (2016). [DOI] [PMC free article] [PubMed] [Google Scholar]
- 10.Sherman DJ et al. Lipopolysaccharide is transported to the cell surface by a membrane-to-membrane protein bridge. Science 359, 798–801, doi: 10.1126/science.aar1886 (2018). [DOI] [PMC free article] [PubMed] [Google Scholar]
- 11.Suits MD, Sperandeo P, Deho G, Polissi A & Jia Z Novel structure of the conserved gram-negative lipopolysaccharide transport protein A and mutagenesis analysis. Journal of molecular biology 380, 476–488, doi: 10.1016/j.jmb.2008.04.045 (2008). [DOI] [PubMed] [Google Scholar]
- 12.Sherman DJ et al. Decoupling catalytic activity from biological function of the ATPase that powers lipopolysaccharide transport. Proceedings of the National Academy of Sciences of the United States of America 111, 4982–4987, doi: 10.1073/pnas.1323516111 (2014). [DOI] [PMC free article] [PubMed] [Google Scholar]
- 13.Tran AX, Dong C & Whitfield C Structure and functional analysis of LptC, a conserved membrane protein involved in the lipopolysaccharide export pathway in Escherichia coli. The Journal of biological chemistry 292, 18731, doi: 10.1074/jbc.AAC117.000510 (2017). [DOI] [PMC free article] [PubMed] [Google Scholar]
- 14.Dong H et al. Structural basis for outer membrane lipopolysaccharide insertion. Nature 511, 52–56, doi: 10.1038/nature13464 (2014). [DOI] [PubMed] [Google Scholar]
- 15.Qiao S, Luo Q, Zhao Y, Zhang XC & Huang Y Structural basis for lipopolysaccharide insertion in the bacterial outer membrane. Nature 511, 108–111, doi: 10.1038/nature13484 (2014). [DOI] [PubMed] [Google Scholar]
- 16.Dong H, Zhang Z, Tang X, Paterson NG & Dong C Structural and functional insights into the lipopolysaccharide ABC transporter LptB2FG. Nat Commun 8, 222, doi: 10.1038/s41467-017-00273-5 (2017). [DOI] [PMC free article] [PubMed] [Google Scholar]
- 17.Luo Q et al. Structural basis for lipopolysaccharide extraction by ABC transporter LptB2FG. Nat Struct Mol Biol 24, 469–474, doi: 10.1038/nsmb.3399 (2017). [DOI] [PubMed] [Google Scholar]
- 18.Laguri C et al. Interaction of lipopolysaccharides at intermolecular sites of the periplasmic Lpt transport assembly. Sci Rep 7, 9715, doi: 10.1038/s41598-017-10136-0 (2017). [DOI] [PMC free article] [PubMed] [Google Scholar]
- 19.Thomas C & Tampe R Multifaceted structures and mechanisms of ABC transport systems in health and disease. Curr Opin Struct Biol 51, 116–128, doi: 10.1016/j.sbi.2018.03.016 (2018). [DOI] [PubMed] [Google Scholar]
- 20.Narita S & Tokuda H Biochemical characterization of an ABC transporter LptBFGC complex required for the outer membrane sorting of lipopolysaccharides. FEBS letters 583, 2160–2164, doi: 10.1016/j.febslet.2009.05.051 (2009). [DOI] [PubMed] [Google Scholar]
- 21.Freinkman E, Okuda S, Ruiz N & Kahne D Regulated assembly of the transenvelope protein complex required for lipopolysaccharide export. Biochemistry 51, 4800–4806, doi: 10.1021/bi300592c (2012). [DOI] [PMC free article] [PubMed] [Google Scholar]
- 22.Villa R et al. The Escherichia coli Lpt transenvelope protein complex for lipopolysaccharide export is assembled via conserved structurally homologous domains. J Bacteriol 195, 1100–1108, doi: 10.1128/JB.02057-12 (2013). [DOI] [PMC free article] [PubMed] [Google Scholar]
- 23.Martorana AM et al. Functional Interaction between the Cytoplasmic ABC Protein LptB and the Inner Membrane LptC Protein, Components of the Lipopolysaccharide Transport Machinery in Escherichia coli. J Bacteriol 198, 2192–2203, doi: 10.1128/JB.00329-16 (2016). [DOI] [PMC free article] [PubMed] [Google Scholar]
- 24.Schultz KM & Klug CS Characterization of and lipopolysaccharide binding to the E. coli LptC protein dimer. Protein Sci 27, 381–389, doi: 10.1002/pro.3322 (2018). [DOI] [PMC free article] [PubMed] [Google Scholar]
- 25.Tran AX, Dong C & Whitfield C Structure and functional analysis of LptC, a conserved membrane protein involved in the lipopolysaccharide export pathway in Escherichia coli. The Journal of biological chemistry 285, 33529–33539, doi: 10.1074/jbc.M110.144709 (2010). [DOI] [PMC free article] [PubMed] [Google Scholar]
- 26.Okuda S, Freinkman E & Kahne D Cytoplasmic ATP hydrolysis powers transport of lipopolysaccharide across the periplasm in E. coli. Science 338, 1214–1217, doi: 10.1126/science.1228984 (2012). [DOI] [PMC free article] [PubMed] [Google Scholar]
- 27.Jeong H et al. Genome sequences of Escherichia coli B strains REL606 and BL21(DE3). Journal of molecular biology 394, 644–652, doi: 10.1016/j.jmb.2009.09.052 (2009). [DOI] [PubMed] [Google Scholar]
- 28.Bertani BR, Taylor RJ, Nagy E, Kahne D & Ruiz N A cluster of residues in the lipopolysaccharide exporter that selects substrate variants for transport to the outer membrane. Mol Microbiol, doi: 10.1111/mmi.14059 (2018). [DOI] [PMC free article] [PubMed] [Google Scholar]
- 29.Locher KP Mechanistic diversity in ATP-binding cassette (ABC) transporters. Nat Struct Mol Biol 23, 487–493, doi: 10.1038/nsmb.3216 (2016). [DOI] [PubMed] [Google Scholar]
- 30.Dong H, Tang X, Zhang Z & Dong C Structural insight into lipopolysaccharide transport from the Gram-negative bacterial inner membrane to the outer membrane. Biochimica et biophysica acta 1862, 1461–1467, doi: 10.1016/j.bbalip.2017.08.003 (2017). [DOI] [PubMed] [Google Scholar]
- 31.Doerrler WT & Raetz CR ATPase activity of the MsbA lipid flippase of Escherichia coli. The Journal of biological chemistry 277, 36697–36705, doi: 10.1074/jbc.M205857200 (2002). [DOI] [PubMed] [Google Scholar]
- 32.Oldham ML & Chen J Snapshots of the maltose transporter during ATP hydrolysis. Proceedings of the National Academy of Sciences of the United States of America 108, 15152–15156, doi: 10.1073/pnas.1108858108 (2011). [DOI] [PMC free article] [PubMed] [Google Scholar]
- 33.Mastronarde DN Automated electron microscope tomography using robust prediction of specimen movements. J Struct Biol 152, 36–51, doi: 10.1016/j.jsb.2005.07.007 (2005). [DOI] [PubMed] [Google Scholar]
- 34.Mi W et al. Structural basis of MsbA-mediated lipopolysaccharide transport. Nature 549, 233–237, doi: 10.1038/nature23649 (2017). [DOI] [PMC free article] [PubMed] [Google Scholar]
- 35.Zheng SQ et al. MotionCor2: anisotropic correction of beam-induced motion for improved cryo-electron microscopy. Nat Methods 14, 331–332, doi: 10.1038/nmeth.4193 (2017). [DOI] [PMC free article] [PubMed] [Google Scholar]
- 36.Rohou A & Grigorieff N CTFFIND4: Fast and accurate defocus estimation from electron micrographs. J Struct Biol 192, 216–221, doi: 10.1016/j.jsb.2015.08.008 (2015). [DOI] [PMC free article] [PubMed] [Google Scholar]
- 37.Ru H et al. Molecular Mechanism of V(D)J Recombination from Synaptic RAG1-RAG2 Complex Structures. Cell 163, 1138–1152, doi: 10.1016/j.cell.2015.10.055 (2015). [DOI] [PMC free article] [PubMed] [Google Scholar]
- 38.Scheres SH RELION: implementation of a Bayesian approach to cryo-EM structure determination. J Struct Biol 180, 519–530, doi: 10.1016/j.jsb.2012.09.006 (2012). [DOI] [PMC free article] [PubMed] [Google Scholar]
- 39.Bai XC, Rajendra E, Yang G, Shi Y & Scheres SH Sampling the conformational space of the catalytic subunit of human gamma-secretase. Elife 4, doi: 10.7554/eLife.11182 (2015). [DOI] [PMC free article] [PubMed] [Google Scholar]
- 40.Swint-Kruse L & Brown CS Resmap: automated representation of macromolecular interfaces as two-dimensional networks. Bioinformatics 21, 3327–3328, doi: 10.1093/bioinformatics/bti511 (2005). [DOI] [PubMed] [Google Scholar]
- 41.Lyumkis D, Brilot AF, Theobald DL & Grigorieff N Likelihood-based classification of cryo-EM images using FREALIGN. J Struct Biol 183, 377–388, doi: 10.1016/j.jsb.2013.07.005 (2013). [DOI] [PMC free article] [PubMed] [Google Scholar]
- 42.Pettersen EF et al. UCSF Chimera--a visualization system for exploratory research and analysis. J Comput Chem 25, 1605–1612, doi: 10.1002/jcc.20084 (2004). [DOI] [PubMed] [Google Scholar]
- 43.Emsley P, Lohkamp B, Scott WG & Cowtan K Features and development of Coot. Acta Crystallogr D Biol Crystallogr 66, 486–501, doi: 10.1107/S0907444910007493 (2010). [DOI] [PMC free article] [PubMed] [Google Scholar]
- 44.Adams PD et al. PHENIX: a comprehensive Python-based system for macromolecular structure solution. Acta Crystallogr D Biol Crystallogr 66, 213–221, doi: 10.1107/S0907444909052925 (2010). [DOI] [PMC free article] [PubMed] [Google Scholar]
- 45.Kim HM et al. Crystal structure of the TLR4-MD-2 complex with bound endotoxin antagonist Eritoran. Cell 130, 906–917, doi: 10.1016/j.cell.2007.08.002 (2007). [DOI] [PubMed] [Google Scholar]
- 46.van Aalten DM et al. PRODRG, a program for generating molecular topologies and unique molecular descriptors from coordinates of small molecules. J Comput Aided Mol Des 10, 255–262 (1996). [DOI] [PubMed] [Google Scholar]
- 47.Kyte J & Doolittle RF A simple method for displaying the hydropathic character of a protein. Journal of molecular biology 157, 105–132 (1982). [DOI] [PubMed] [Google Scholar]
Associated Data
This section collects any data citations, data availability statements, or supplementary materials included in this article.
Supplementary Materials
Data Availability Statement
Seven three-dimensional cryo-EM density maps of E. coli LptB2FG and LptB2FGC in nanodiscs have been deposited in the Electron Microscopy Data Bank under accession numbers EMD-9118 (nucleotide-free LptB2FG), EMD-9125 (nucleotide-free LptB2FGC, final map), EMD-9128 (nucleotide-free LptB2FGC, map with clear LPS density), EMD-9129 (nucleotide-free LptB2FGC, long-bjr map), EMD-9130 (nucleotide-free LptB2FGC, short-bjr map), EMD-9124 (vanadate-trapped LptB2FG) and EMD-9126 (vanadate-trapped LptB2FGC). Four atomic coordinates for the atomic models have been deposited in the Protein Data Bank under accession numbers 6MHU (nucleotide-free LptB2FG), 6MI7 (nucleotide-free LptB2FGC), 6MHZ (vanadate-trapped LptB2FG), 6MI8 (vanadate-trapped LptB2FGC).


