

SUMMARY
Transcriptional regulation of circadian rhythms is essential for lipid metabolic homeostasis, disruptions of which can lead to metabolic diseases. Whether N6-methyladenosine (m6A) mRNA methylation impacts circadian regulation of lipid metabolism is unclear. Here, we show m6A mRNA methylation oscillations in murine liver depend upon a functional circadian clock. Hepatic deletion of Bmal1 increases m6A mRNA methylation, particularly of PPaRα. Inhibition of m6A methylation via knockdown of m6A methyltransferase METTL3 decreases PPaRα m6A abundance and increases PPaRα mRNA lifetime and expression, reducing lipid accumulation in cells in vitro. Mechanistically, YTHDF2 binds to PPaRα to mediate its mRNA stability to regulate lipid metabolism. Induction of reactive oxygen species both in vitro and in vivo increases PPaRα transcript m6A levels, revealing a possible mechanism for circadian disruption on m6A mRNA methylation. These data show that m6A RNA methylation is important for circadian regulation of downstream genes and lipid metabolism, impacting metabolic outcomes.
In Brief
Zhong et al. reveal that hepatic Bmal1 deletion changes m6A mRNA methylation, particularly of PPaRα. METTL3 or YTHDF2 knockdown affects PPaRα transcription and translation, impacting downstream lipid metabolism. These findings further reveal the overlap between circadian gene network disruption, mRNA m6A modifications, and metabolic state.
Graphical Abstract

INTRODUCTION
Circadian rhythms, present in nearly all eukaryotic and prokaryotic life-forms, are genetically encoded oscillators that govern most physiological processes, including transcriptional rhythms and downstream metabolic homeostasis (Bass, 2012; Yang et al., 2006). Disruption of circadian rhythms by genetic or environmental perturbation results in metabolic diseases such as hyperleptinemia, hypertriglyceridemia, hepatic steatosis, diabetes, and obesity (Asher and Sassone-Corsi, 2015; Masri et al., 2014). These observations highlight the dynamic central role of the circadian clock in regulation of metabolic homeostasis, particularly lipid metabolism. Disruption of lipid metabolism and development of obesity has many serious co-morbidities, including diabetes, hypertension, and cancer, all of which are associated with high morbidity and mortality rates. Further elucidating the mechanistic involvement of the circadian clock in regulating lipid metabolism is of great significance and could provide insight into targeted interventions to prevent and treat metabolic disorders.
Mammalian circadian networks regulate metabolism mainly via a conserved transcriptional-translational feedback loop in which the redox-sensing BMAL1/CLOCK heterodimer drives transcription and translation of PERIOD 1–3 (PER1–3), CRYPTOCHROME 1–2 (CRY1–2), and REV-ERBs (Kume et al., 1999; Padmanabhan et al., 2012). There is extensive crosstalk between circadian clocks and metabolism (Bass, 2012; Nakahata et al., 2009) with growing evidence indicating that this may be occurring via transcriptional epigenomic mechanisms (Belden et al., 2011; Vollmers et al., 2012). The circadian clock drives rhythmic epigenomic programming, including DNA methylation, histone acetylation, histone methylation, and chromatin remodeling, in turn regulating cellular metabolism (Bellet and Sassone-Corsi, 2010). Interestingly, reactive oxygen species (ROS) generated via periodic flux in metabolic cycles also exhibit a 24-hr oscillation within cells (Lai et al., 2012; O’Neill and Feeney, 2014). Moreover, S-adenosyl-methionine (SAM), the universal methyl donor cosubstrate involved in histone and DNA methylation, exhibits diurnal rhythm. Together, these observations suggest that crosstalk between circadian networks and cellular metabolism is mediated, in part, by DNA and RNA methylation. However, circadian gene regulation at the post-transcriptional level through RNA methylation that might affect the crosstalk between circadian networks and cellular metabolism remains largely unexplored.
Among more than 100 types of post-transcriptional modifications, N6-methyladenosine (m6A) is one of the most prevalent modifications in eukaryotic mRNAs (Wei et al., 1975), impacting a variety of physiological events (Dominissini etal., 2012; Roundtree et al., 2017). Modifications driven by m6A on mRNA functions are dynamic and reversible (Jia et al., 2013). m6A on mRNA is post-transcriptionally installed, erased, and recognized by m6A methyltransferases, including methyltransferase-like 3 (METTL3) and METTL14 (Liu et al., 2014; Wang et al., 2014b), de-methylases, including ALKB homolog 5 (ALKBH5), fat mass and obesity-associated protein (FTO) (Jia et al., 2011; Zheng et al., 2013), as well as m6A-specific binding proteins including YTHDF1 and YTHDF2 (Dominissini et al., 2012; Wang and He, 2014; Wang et al., 2014a, 2015c). Modification of m6A on mRNA functionally modulates a variety of cellular processes, including mRNA splicing (Dominissini et al., 2012; Xiao et al., 2016), export (Zheng et al., 2013), localization, translation (Meyer et al., 2015; Wang et al., 2015c; Zhou et al., 2015), and stability (Wang et al., 2014a). Moreover, m6A manipulation by knockdown or deletion of methyltransferases or demethylases affects cellular differentiation, body mass, and metabolism, highlighting its role in obesity, cancer, and other human diseases (Batista et al., 2014; Chen et al., 2015; Dina et al., 2007; Geula et al., 2015; Lin et al., 2016; Wang et al., 2014b; Zheng et al., 2013). Importantly, m6A modification controls mRNA export and regulates circadian rhythms (Fustin et al., 2013; Wang et al., 2015a), which impacts the homeostatic balance of multiple metabolic cellular functions. In turn, metabolic signals (i.e., dietary factors) affect mRNA m6A levels (Li et al., 2016). These recent discoveries suggest m6A RNA methylation, in part, mediates the crosstalk between the circadian clock and cellular metabolism. However, precisely how m6A RNA methylation coordinates circadian clock function and metabolism is unknown.
In this report, we show that gene-targeted deletion of hepatic Bmal1, an essential component of the mammalian clock gene regulatory network, alters m6A mRNA methylation, affecting particularly the nuclear receptor peroxisome proliferator-activator α (PPaRα). In vitro, we found that METTL3 or YTHDF2 knockdown increased both PPaRα mRNA lifetime and expression, resulting in reduced lipid accumulation, revealing that mRNA m6A methylation of PPaRα is a critical regulatory mechanism likely mediated through YTHDF2-mediated mRNA decay. Moreover, we observed that the m6A level of hepatic PPaRα transcript increased after ROS induction via exposure to H2O2 in vitro or following acetaminophen-induced acute liver injury in vivo, providing a potential mechanism for the effect of disrupted circadian networks on m6A mRNA methylation and lipid metabolism.
RESULTS
Deletion of Bmal1 Alters Hepatic Lipid Metabolism and m6A RNA Methylation
Disruption of circadian rhythms by environmental or genetic manipulation can lead to metabolic disorders (Marcheva et al., 2010). Previous studies showed that liver-specific deletion of Bmal1 (Bmal1−/−) in mice increased body weight, total fat content, triglycerides levels, and insulin hypersensitivity (Lamia et al., 2008; Paschos et al., 2012; Rudic et al., 2004). Here we also observed that hepatic Bmal1 deletion increased body weight (Figure 1A) in male mice. We noted that diurnal patterns of total cholesterol (TC) (Figure 1B) and triglyceride (TG) (Figure 1C) levels in male mice harvested every 4 hr over a 12:12 hr light-dark (LD) cycle beginning at ZT2 (Zeitgeber Time [ZT] 0 = 6 a.m.) also were increased in Bmal1−/− mice relative to wild-type (WT) controls at several time points. The gene expression of PPaRα and non-receptor tyrosine phosphatase (SHP), which have counter-regulatory effects on cholesterol and TG biosynthesis, were significantly decreased in the livers of Bmal1−/− mice (Figure 1D). In contrast, the expression of genes involved in cholesterol and TG biosynthesis, including retinoic acid-related orphan receptor α (RORα), acetyl-coenzyme A (CoA) carboxylase (ACC1), and fatty acid binding protein 4 (FABP4), were elevated in the liver of Bmal1−/− mice as compared with WT littermate controls (Figure 1D), whereas no changes were observed in Fatty acid synthase (Fas). Detection of rhythmicity using CircWave analysis presented in Table S1 revealed co-sinor expression patterns for SHP, PPaRγ, as well as PPaRα in both WT and Bmal1−/− mice, despite an overall decrease of PPaRα in Bmal1−/− mice (Figure 1C). Only livers from WT mice exhibited co-sinor expression patterns of RORα, FABP1, and SREBP, whereas ACC and FAS appeared to only exhibit co-sinor expression patterns in Bmal1−/− mice. Together, these data suggest that presence of Bmal1 in the liver drives differential levels and diurnal expression patterns of genes involved in lipid metabolism.
Figure 1. Liver-Specific Bmal1f/f-AlbCre-Knockout Affects Lipid Metabolism and m6A mRNA Methylation in Mice.
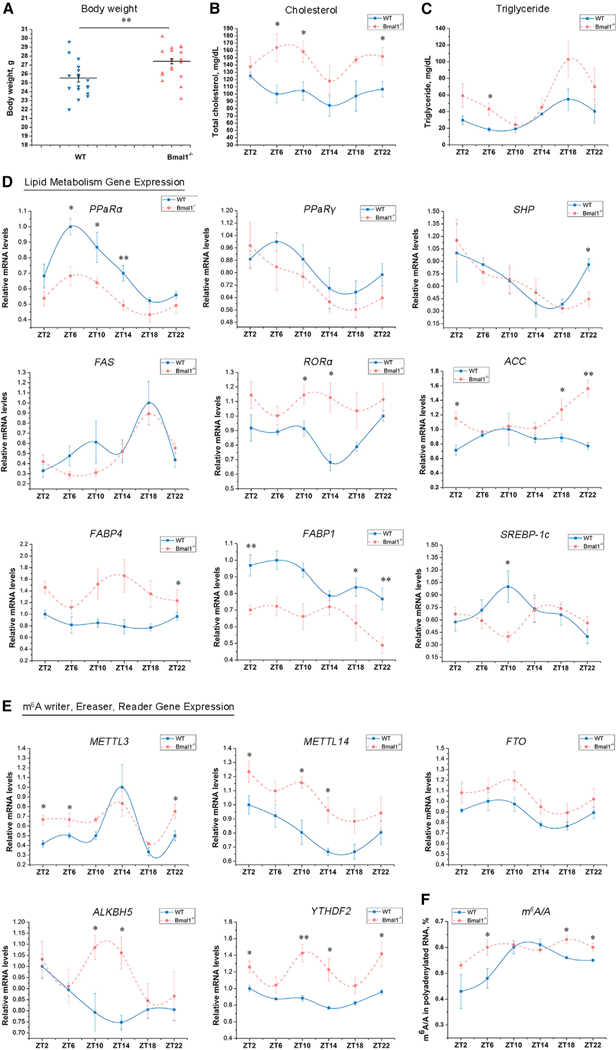
(A) Body weight of Bmal1−/− mice was increased at 12 weeks of age compared with wild-type (WT) mice (male, n = 18 each genotype).
(B and C) Plasma levels of total cholesterol (B) and TG (C) were measured at different Zeitgeber Times (ZTs) in WT and Bmal1−/− mice (n = 4–5 per group).
(D) Expression of lipid metabolism genes in the liver from WT and Bmal1−/− mice determined by qRT-PCR (n = 4–5 per group).
(E) Expression of methyltransferase (METTL3, METTL14), demethylases (FTO), and methyl-specific binding proteins (YTHDF2) mRNA in the liver of WT and Bmal1−/− mice determined by qRT-PCR (n = 4–5 per group).
(F) m6A content was quantified by LC-MS/MS in the liver of WT and Bmal1−/− mice (n = 4–5 per group).
See also Figure S1. Bmal1−/−, Bmalf/f-AlbCre; WT, Bmal−/−. All data are representative of two or three independent experiments. Data are represented as mean ± SEM. *p < 0.05, **p < 0.01 by two-tailed t test.
The circadian clock controls many genes involved in lipid metabolism and cellular homeostasis at the transcriptional level (Adamovich et al., 2014; Fang et al., 2014); however, other mechanisms could be involved, particularly at the post-transcriptional level. m6A RNA methylation is a chemical modification that exhibits broad roles in both physiology and RNA biology (Liu et al., 2015; Roundtree et al., 2017; Wang et al., 2015c). Growing evidence indicates RNA methylation is strongly associated with lipid metabolism (Church et al., 2010; Merkestein et al., 2015). Thus, we hypothesized that changes in lipid metabolism in the absence of liver Bmal1 could, in part, be due to aberrant mRNA methylation. First, we examined the effect of Bmal1 deletion on methyltransferase (writers), demethylase (erasers), and methyl-specific binding protein (readers) mRNA expression in liver. Using qRT-PCR, we found expression of METTL3, METTL14, YTHDF2, and ALKBH5 mRNA were significantly increased in the livers of Bmal1−/− mice compared with controls at several time points across the 12:12 LD cycle, whereas FTO exhibited no significant differences (Figure 1E). Western blot analysis for protein levels showed liver levels of METTL3 and YTHDF2 in Bmal1−/− mice were higher than WT mice at ZT0 (Figure S1). However, no differences in FTO and ALKBH5 were observed (Figure S1). Additionally, absolute m6A levels on poly(A)-tailed RNA were measured using liquid chromatography-tandem mass spectrometry (LC-MS/MS) as previously described (Liu et al., 2014). Contrary to our expectation, the LC-MS/MS results indicated that liver Bmal1 deletion significantly increased m6A in polyadenylated RNA as compared to controls (Figure 1F). Together these findings suggest that m6A RNA methylation exhibits diurnal variation that is differentially impacted by core circadian genes, which were examined next.
RNA Methylation Shows Time-Dependent Differences
Because it is known that there is a circadian basis for genome-wide transcriptional oscillations (Markson et al., 2013), we wished to determine whether RNA methylation also exhibits diurnal dynamics. To initially investigate the possibility that RNA methylation shows time-dependent variation, we measured the expression profiles of m6A RNA methylation genes in livers of WT and Bmal1−/− mice housed under standard 12:12 LD conditions every 4 hr across a 24-hr light-dark cycle, starting from ZT2 (ZT0 = 6 a.m.). Here, CircWave analysis revealed that Mettl14 and FTO both exhibited significant co-sinor diurnal gene expression patterns in livers from both WT and Bmal1−/− mice, whereas only ALKBH5 and YTHDF2 exhibited co-sinor expression in WT livers (Table S1). Conversely, METTL3 gained diurnal co-sinor expression in livers from Bmal1−/− mice (Table S1). Furthermore, liver m6A levels in polyadenylated RNA also exhibited rhythmicity only in WT mice (Figure 1E; Table S1). Together, these results further support the notion that RNA methylation is under circadian gene regulation. Despite the association, more mechanistic insight into the relationship of m6A modification by circadian systems is needed.
Deletion of Bmal1 from the Liver Shifts mRNA Methylation Patterns
We next determined what alterations of m6A methylation pattern are impacted by deletion of Bmal1 at a transcriptome-wide level. We used fragmented mRNA from livers of WT and Bmal1−/− mice as input for RNA immunoprecipitation using an anti-m6A antibody (Figure 2A). Using previously described methods for m6A sequencing (m6A-seq) (Dominissini et al., 2012, 2013), we sequenced the entire methylated RNA species purified from livers of WT and Bmal1−/− mice at ZT0, a time point where many of the m6A-associated genes are predicted to be differentially expressed. Consistent with previous reports (Lin et al., 2016; Zhou et al., 2015), we confirmed the m6A consensus sequence motif as GGAC (Figure 2B). In addition, coinciding with the previously reported pattern of m6A peaks (Liu et al., 2014; Wang et al., 2014a), the majority of m6A sites appear to be enriched in the vicinity of the stop codon and the 3′ UTR (Figure 2C). Significantly increased liver m6A peaks in Bmal1−/− mice (7,017) were found as compared with WT controls (6,309) (Figure 2D). Moreover, nearly 60% of the m6A peaks (4,204 out of 7,017) in Bmal1−/− mice differed from that of WT mice (Figure 2D). The differences in m6A peaks in Bmal1−/− mice (4,204) as compared with WT mice (3,496) covered 3,150 and 2,691 genes, respectively (Figure 2D). GO analysis revealed several distinct gene clusters (Figure 2E). A total of 1,175 (37%) were enriched under GO that are involved in the regulation of RNA-related processes, including RNA binding, RNA processing, and RNA metabolic processes, further suggesting Bmal1 modulates m6A RNA methylation. In particular, the m6A mRNA methylation of PPaRα, a major regulator of hepatic lipid metabolism, in the livers of Bmal1−/− mice was significantly increased as compared with WT controls (Figure 2F). However, the changes of m6A methylation for other lipid metabolic genes, including RORa, ACC (Figure 2F), Sterol regulatory element-binding proteins-1c (SREBP-1c), FABP4, Box binding protein 1 (XBP1), FAS, Diacylglycerol acyltransferase family (DGAT2), and Proprotein convertase subtilisin/kexin type 9 (PCSK9) were not observed (Figures S2B–S2G), suggesting that PPaRa is an essential gene that undergoes aberrant mRNA methylation following deletion of Bmal1.
Figure 2. Liver-Specific Bmal1f/f-AlbCre-Knockout Affects the Profile of mRNA Methylation in Mice.
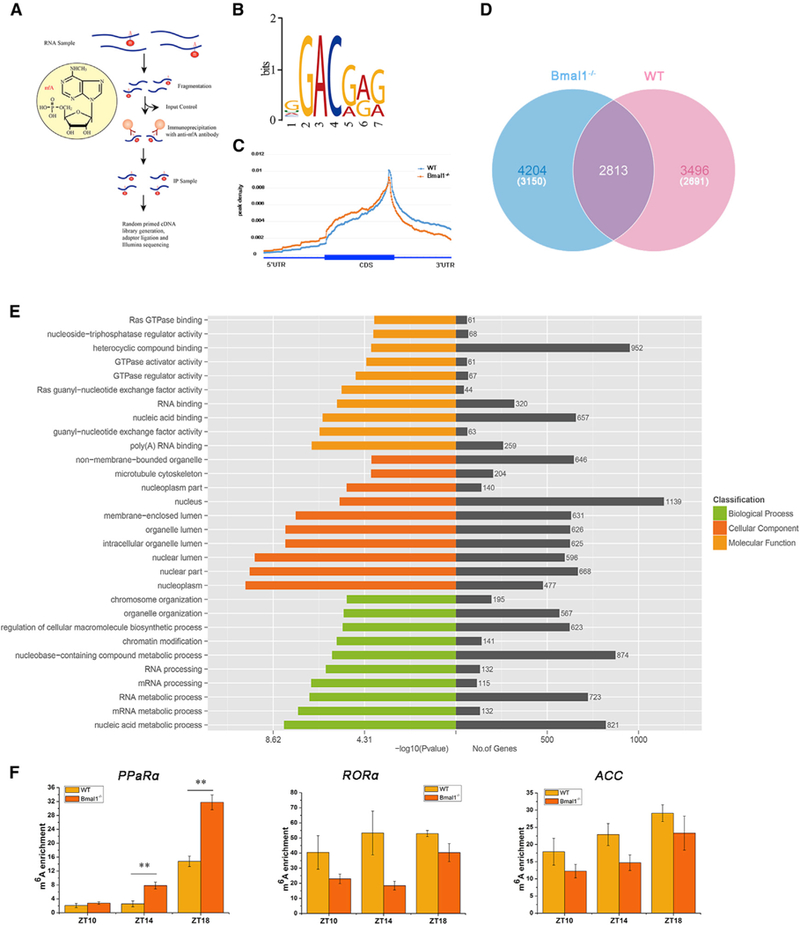
(A) Schematic diagram of the m6A-seq procedure.
(B) Sequence logo representing the consensus motif identified by Multiple Em for Motif Elicitation (MEME). Motif length was restricted to 6–8 nt (n = 3 per group).
(C) Distribution of m6A peaks across the length of mRNAs (n = 3 per group).
(D) Venn diagram showing overlap of peaks between WT mice and Bmal1−/− mice at Zeitgeber Time (ZT) 0 in liver samples. The number of genes in each category is shown in parentheses (n = 3 per group).
(E) GO analysis with the transcript that was covered by a unique peak. The cutoff parameters for enrichment analysis with Cytoscape software are: p < 0.005, FDR q < 0.1, and overlap cutoff > 0.5.
(F) The m6A enrichment of PPaRα, RORα, and ACC mRNA in WT and Bmal1−/− mice at Zeitgeber Times (ZTs) 10, 14, and 18.
See also Figure S2. Bmal1−/−, Bmal1f/f-AlbCre; WT, Bmal1f/f. Data are represented as mean ± SEM. **p < 0.01 by two-tailed t test.
m6A Regulates PPaRα Expression and Impacts Lipid Metabolism
Previous reports suggest that m6A modification regulates mRNA processing including alternative splicing, RNA degradation, and translation (Liu et al., 2015; Wang et al., 2014a, 2015c), thereby impacting a broad range of biological functions (Fustin et al., 2013; Roundtree et al., 2017; Wang et al., 2014b). Our data thus far indicate that circadian clock genes, specifically Bmal1, may control m6A RNA methylation. Therefore, we next examined whether the circadian clock controls dynamic gene expression and downstream lipid metabolism via regulation of m6A RNA methylation. To perturb m6A RNA methylation on lipid metabolism, we knocked down or overexpressed METTL3 in Hepa1–6 and HepG2 cells in vitro. First, the knockdown of METTL3 significantly increased the levels of PPaRα mRNA, whereas expression of SREBP-1c, FAS, and ACC mRNA were reduced in both Hepa1–6 and HepG2 cells (Figures 3A, S3A, and S3B). Because HepG2 cells exhibit high levels of both METTL3 and m6A, whereas Hepa1–6 did not (Figures S3C and S3D) (Yin et al., 2017), we focused our subsequent analyses only on HepG2 cells. Additionally, the levels of PPaRα mRNA were significantly reduced by overexpression of METTL3 in HepG2 cells (Figure 3A). We did not observe consistent changes for additional lipid metabolism genes following knockdown of METTL3 or overexpression of METTL3 in HepG2 cells (Figures S3A and S3E), suggesting that PPaRα may be a specific m6A target gene. On the basis of the sharply increased enrichment of m6A (Figure 2F) and significant change in PPaRα mRNA (Figures 1D and 3A), which is a key transcription factor that regulates the expression of genes associated with lipid metabolism, we chose PPaRα for further analysis as a candidate m6A target in the regulation of lipid metabolism. Using western blot to identify the effect of m6A RNA methylation on PPARα translation, we observed that METTL3 knockdown significantly elevated PPARα protein levels (Figure 3B), which is consistent with our results examining PPaRα mRNA using siMETTL3 versus siControl. To further dissect the profile of PPaRα mRNA methylation, we performed m6A-seq in HepG2 cells treated with siMETTL3 in a similar manner to that presented in Figure 2A. Analysis of m6A-seq showed that the numbers of m6A peaks following siMETTL3 knockdown (5,587) were lower than siControl (5,777), where silencing METTL3 resulted in a 29% (1,655 out of 5,587) difference in m6A peaks as compared with siControl (Figure 3C). The difference in m6A peaks following siMETTL3 (1,655) knockdown versus siControl (1,845) covered 1,505 and 1,629 genes, respectively (Figure 3C). GO analysis of these genes showed transcripts involved in specific RNA biology, including RNA binding, regulation of RNA metabolic and biosynthetic processes, as well as RNA metabolic processes (Figure 3D). Using Integrative Genomics Viewer (IGV), we examined the m6A peak profile of several lipid metabolism-associated mRNAs. The mRNA of PPaRα was found to have one or more m6A peaks near the stop codon (Figure S3G). As expected, we observed an overall decrease in m6A methylation for PPaRα mRNA following METTL3 knockdown compared with control group (Figure 3E). However, we did not find changes in m6A methylation for other lipid metabolism-associated transcripts (Figures S3G and S3H). Indeed, knockdown of METTL3 using specific small interfering RNA (siRNA) led to the decrease of relative cell viability in HepG2 cells and Hepa1–6 cells determined by MTT (3-[4,5-di-methylthiazol-2-yl]-2, 5-diphenyl-tetrazolium bromide) at 24, 48, and 72 hr after transfection (Figures 3F and S3F). BODIPY staining of HepG2 cells showed that lipid accumulation was also significantly decreased at 48 hr after transfection with siMETTL3 (Figure 3G). The result of BODIPY staining was confirmed by direct measurement of TG in HepG2 cells at 48 hr after transfection with siMETTL3 or siControl (Figure 3H), further confirming that knockdown of METTL3 impacts lipid metabolism. Altogether, our data demonstrate that METTL3-mediated m6A modification regulates lipid metabolism through impacting PPaRα expression.
Figure 3. m6A mRNA Methylation Regulates PPaRα to Impact Lipid Metabolism.
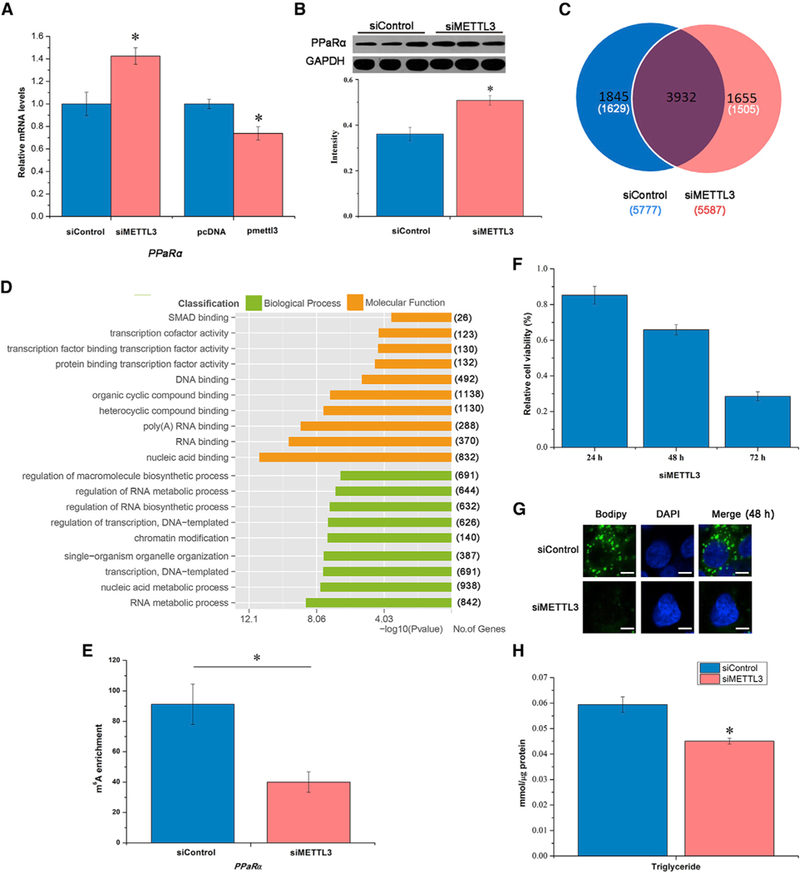
(A) Knockdown or overexpression of METTL3 altered expression of PPaRα mRNA, a lipid-activated transcription factor, in HepG2 cells at 48 hr post-transfection (n = 3).
(B) METTL3 knockdown regulates PPaRα mRNA translation in HepG2 cells (n = 3).
(C) Venn diagram showing overlap of peaks between the samples of siMETTL3 versus siControl. The number of genes in each category is shown in parentheses (n = 2).
(D) Representative GO analysis with the transcript corresponding to different genes (n = 2).
(E) The m6A enrichment of PPaRα in HepG2 cells at 48 hr post-transfection (n = 3).
(F) Knockdown of m6A methyltransferase (METTL3) in HepG2 cells reduced the relative cell viability determined by MTT at 24, 48, and 72 hr post-transfection (n = 6).
(G) METTL3 knockdown decreased lipid accumulation in HepG2 cells reflected by BODIPY staining (green) at 48 hr post-transfection (n = 6). Scale bars, 20 μm.
(H) TG content in HepG2 cells at 48 hr post-transfection with siMETTL3 (n = 6).
See also Figure S3. All data are representative of three independent experiments. Data are represented as mean ± SEM. *p < 0.05 by two-tailed t test.
YTHDF2-Mediated mRNA Stability Contributes to the m6A Regulation of PPaRα
We next used YTHDF2, a well-known m6A “reader” that mediates mRNA stability and decay, to investigate the underlying PPaRα expression by m6A modification. Compared with controls, we observed that the levels of PPaRα mRNA were significantly increased by the knockdown of YTHDF2, whereas we observed decreased levels by overexpression of YTHDF2 in HepG2 cells (Figure 4A), suggesting that YTHDF2 recognition of m6A-modified PPaRα mRNA inhibits PPaRα expression. With the exception of PPaRγ, YTHDF2 did not impact RORα, SREBP-1c, and FAS mRNA expression (Figures S4A and S4B). To validate whether m6A RNA methylation directly modulates PPaRα mRNA, we performed RNA immunoprecipitation after transfection of Flag-tagged YTHDF2. As shown in Figure 4B, the levels of PPaRα mRNA exhibited an 8.15-fold increase relative to input sample, suggesting YTHDF2 can bind to PPaRα mRNA. Next, to test whether YTHDF2 regulates PPaRα expression through mRNA decay, we performed RNA lifetime profiling after knockdown of METTL3 or YTHDF2 as well as overexpression of METTL3 or YTHDF2 on samples obtained at different time points following transcriptional inhibition with actinomycin D. We observed that METTL3 and YTHDF2 knockdown led to a prolonged lifetime of PPaRα mRNA (Figures 4C–4H), owing to the absence of functional m6A modification in siMETTL3 samples or insufficient recognition of m6A modification in siYTHDF2 samples. However, overexpression of METTL3 or YTHDF2 did not alter the lifetime of other select lipid metabolism genes, including PPaRα (Figures 4C and 4D; Figures S4C–S4M). Similar to the phenotype observed in the knockdown of METTL3, knockdown of YTHDF2 using specific siRNA led to the decrease of relative cell viability, lipid accumulation, and abundance of TG in HepG2 cells (Figures 4I–4K), suggesting that YTHDF2 mediates PPaRα mRNA stability to regulate lipid metabolism.
Figure 4. YTHDF2 Mediates PPaRα mRNA Stability and Regulates Lipid Metabolism.
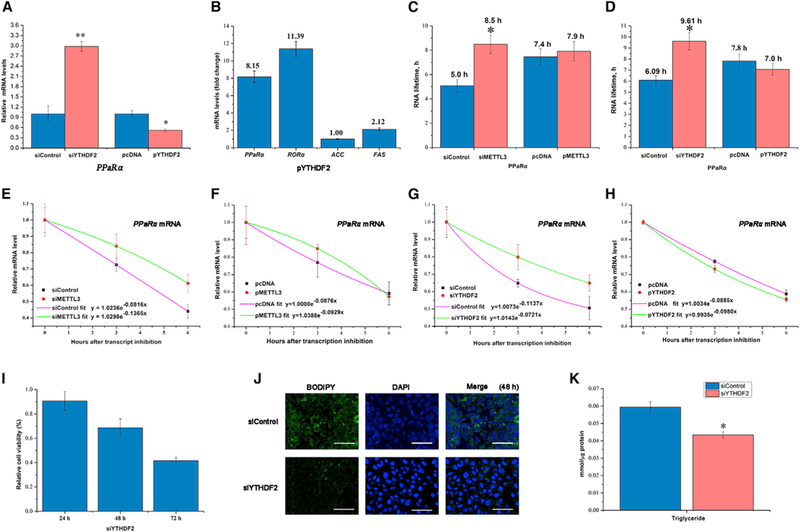
(A) YTHDF2 knockdown or overexpression impacts expression of PPaRα mRNA in HepG2 cells at 48 hr post-transfection (n = 3).
(B) Enrichment (expressed as fold change compared with empty vector) of lipid metabolism genes was determined in HepG2 cells using immunoprecipitation after transfection with flag-tagged YTHDF2 (n = 3).
(C) Lifetime of PPaRα mRNA in samples following knockdown of METTL3 and overexpression of METTL3 (n = 3).
(D) Lifetime of PPaRα mRNA in samples of siYTHDF2 versus siControl and overexpression of YTHDF2 versus control (n = 3).
(E and F) Decay of PPaRα mRNA in samples of siMETTL3 versus siControl (E), and overexpression of METTL3 versus control (F) (n = 3).
(G and H) Decay of PPaRα mRNA in samples of siYTHDF2 versus siControl (G), and overexpression of YTHDF2 versus control (H) (n = 3).
(I) Knockdown of YTHDF2 in HepG2 cells reduced the relative cell viability determined by MTT at 24, 48, and 72 hr post-transfection (n = 6).
(J) YTHDF2 knockdown decreased lipid accumulation in HepG2 cells reflected by BODIPY staining (green) at48hr post-transfection (n = 6). Scale bars, 60 μm.
(K) TG content in HepG2 cells at 48 hr post-transfection with siMETTL3 and siYTHDF2 (n = 6).
See also Figure S4. All data are representative of two or three independent experiments. Data are represented as mean ± SEM. *p < 0.05, **p < 0.01 by two-tailed t test.
Inhibition of PPaRα Partially Rescues siMETTL3-Induced Reduction of Proliferation and Lipid Levels
To determine whether the increased PPaRα expression accounts for the HepG2 cell phenotype following METTL3 knockdown, we performed rescue experiments using the knockdown of PPaRα. Interestingly, inhibition of PPaRα using siRNA rescued the decrease of proliferation induced by the knockdown of METTL3 in HepG2 cells after 48 hr transfection (Figure 5A). In addition, the knockdown of both PPaRα and METTL3 increased lipid accumulation and abundance of TG in HepG2 cells compared with METTL3 knockdown alone (Figures 5B and 5C). Altogether, this rescue experiment further confirmed that METTL3-mediated m6A modification regulates lipid metabolism by impacting PPaRα expression.
Figure 5. Inhibition of PPaRα Rescues Lipid Metabolism Disorder.
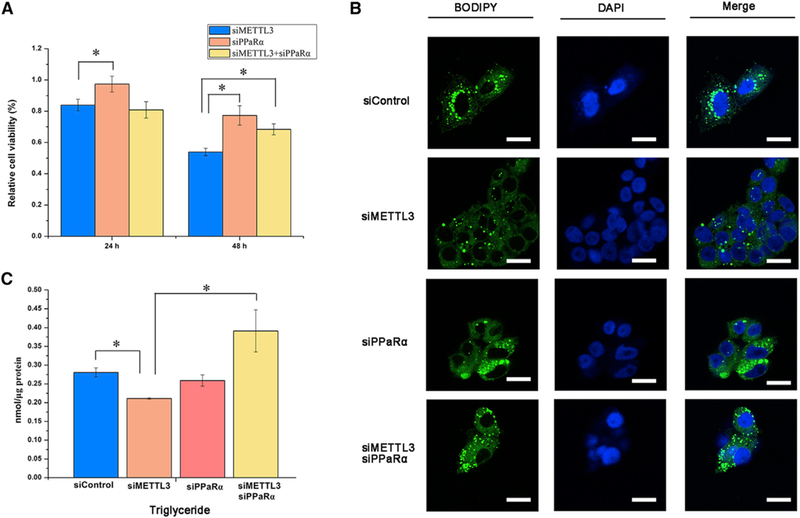
(A) The relative cell viability in the HepG2 cells determined by MTT at 24 and 48 hr post-transfection of siMETTL3 and siPPaRα alone or both (n = 6).
(B) Lipid accumulation in HepG2 cells reflected by BODIPY staining (green) at 48 hr post-transfection of siMETTL3 and siPPaRα alone or both (n = 3). Scale bars, 20 μm.
(C) TG content in HepG2 cells at 48 hr post-transfection with siMETTL3 and siPPaRα alone or both (n = 3).
All data are representative of three independent experiments. Data are represented as mean ± SEM. *p < 0.05 by one-way ANOVA.
ROS Stimulate m6A RNA Methylation
High levels of ROS in different organs of the body, including brain, liver, kidney, and spleen of the global or organ-specific Bmal1−/− mouse have been reported, leading to increased levels of oxidative damage, fatty liver disease, and abnormal lipid metabolism (Geyfman et al., 2012; Jacobi et al., 2015; Lee et al., 2013). In the present study, we also observed an increase of ROS accumulation in livers of Bmal1−/− mice relative to WT littermate controls (Figures 6A and 6B). Given that previous reports showed cellular stress (heat shock and UV) alters characteristic distribution and function of m6A (Dominissini et al., 2012; Meyer et al., 2015; Xiang et al., 2017; Zhou et al., 2015), we assessed the potential impact of ROS on m6A RNA methylation in the context of circadian disruption. To test this, we first examined the cell viability of HepG2 cells treated with H2O2 using the MTT assay. We noted a decrease in relative cell viability in HepG2 cells at 24 hr (Figure 6C) following addition of 100 μM H2O2; therefore, we used this concentration for subsequent experiments. As predicted, the levels of YTHDF2 mRNA and protein in HepG2 cells were significantly induced at 6, 12, and 24 hr after H2O2 treatment (Figures 6D and 6E). This phenomenon was further confirmed by fluorescence immunostaining in HepG2 cells (Figures 6F). Importantly, the majority of YTHDF2 resided in the cytosol (Figure S5); however, the protein level of YTHDF2 was markedly increased in the nucleus after H2O2 treatment (Figure 6F). We next wanted to determine how H2O2 treatment impacts m6A levels in PPaRα transcripts. To do this, we measured the m6A levels in PPaRα mRNA transcripts using m6A immunoprecipitation and gene-specific m6A qRT-PCR analysis. We observed that the m6A level in PPaRα mRNA transcripts was significantly enhanced in HepG2 cells after 48 hr of H2O2 exposure (Figure 6G). These results suggested that m6A RNA methylation is modulated under oxidative stress, which could result in alterations in lipid metabolic function. In order to further examine the effect of ROS on m6A RNA methylation, we performed a liver injury model to induce high levels of ROS in vivo using acetaminophen (APAP) injection in WT mice. As expected, APAP injection significantly induced ROS accumulation (Figures S6A and S6B) as well as increased the levels of METTL3 and YTHDF2 mRNA, but did not change the expression of ALKBH5 and FTO (Figure 6H). In contrast, PPaRα mRNA abundance was significantly reduced after APAP injection (Figure 6H). Moreover, we determined the enrichment of m6A in PPaRα mRNA transcripts using m6A-immunoprecipitation and gene-specific m6A qRT-PCR analysis. Similar to the phenotype observed in the HepG2 cells after 48 hr of H2O2 exposure, we also observed that the m6A level in PPaRα mRNA transcripts was significantly increased after APAP injection in WT mice (Figure 6I), suggesting that ROS induced by APAP injection in WT mice, to some extent, can mimic the effect of ROS observed in Bmal1−/− mice. Together, these data demonstrate that Bmal1 may be a master regulator of lipid metabolism via modulation of m6A methylation within PPaRα mRNA. This may be associated with accumulation of ROS following the loss of Bmal1 within the liver (Figure 7).
Figure 6. ROS Significantly Impacts m6A RNA Methylation.
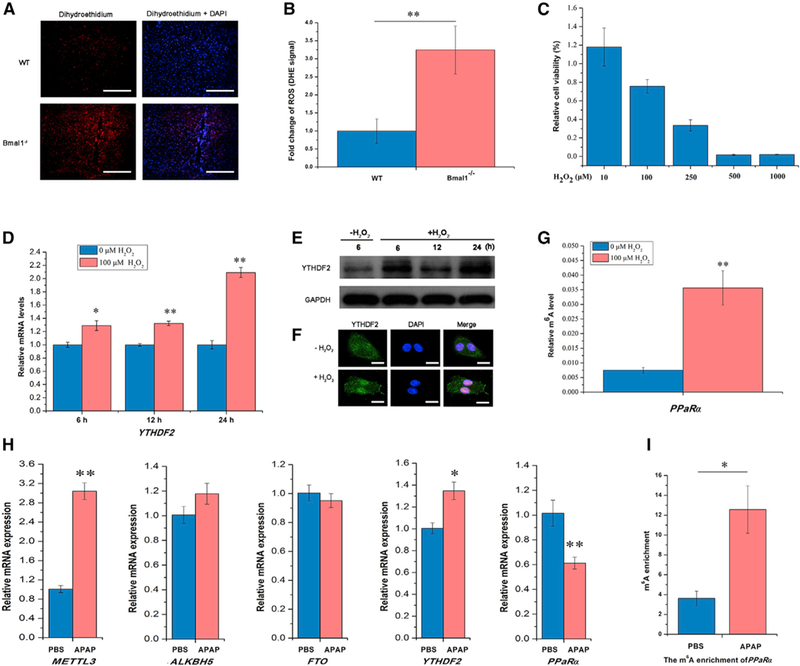
(A) Representative pictures of ROS detection using dihydroethidium (DHE)-stained liver cryosections from WT and Bmal1−/− mice. Scale bars, 100 μm.
(B) Quantification of ROS formation was achieved by measuring mean gray values of DHE signal per cell using ImageJ software (n = 3 per genotype).
(C) The relative cell viability of HepG2 cells assayed by MTT at 24 hr after H2O2 treatment (n = 6).
(D) The expression of YTHDF2 mRNA in HepG2 cells 6, 12, and 24 hr after H2O2 treatment (n = 3).
(E) Immunoblotting of HepG2 cells after H2O2 treatment for YTHDF2 protein levels normalized to GAPDH (n = 3).
(F) Subcellular localization of YTHDF2 in HepG2 cells 6 hr after H2O2 treatment (n = 3). Scale bars, 80 μm.
(G) Gene-specific m6A validation of m6A level changes within the PPaRα gene in HepG2 cells 48 hr after H2O2 treatment (n = 3).
(H) Expression of methyltransferase (METTL3), demethylases (ALKBH5 and FTO), and methyl-specific binding proteins (YTHDF2) mRNA in the liver of WT mice determined by qRT-PCR after injection of APAP or PBS (n = 4–5 per group).
(I) The m6A enrichment of PPaRα in the liver of mice after injection of APAP or PBS (n = 4–5 per group).
See also Figures S5 and S6. Bmal1−/−, Bmal1 -AlbCre; WT, Bmal1f/f; ZT, Zeitgeber Time. All data are representative of two independent experiments. Data are represented as mean ± SEM. *p < 0.05, **p < 0.01 by two-talled t test.
Figure 7. Bmal1 Regulates Hepatic Lipid Metabolism by Modulation of m6A mRNA Methylation.

Model in which Bmal1, a core component of the circadian clock, regulates lipid metabolism by modulating PPaRα mRNA methylation. Circadian disruption, via genetic knockdown of Bmal1 in the liver, leads to the accumulation of ROS, which increases mRNA methylation via increase of METTL3, subsequently resulting in an increase of YTHDF2, which regulates downstream PPaRα transcription to affect lipid metabolism.
DISCUSSION
The circadian clock drives circadian rhythms in 10% of all mRNAs in the mammalian liver, including many genes involved in metabolic processes. However, the precise mechanisms of how circadian networks control the dynamic changes in gene abundance at the post-transcriptional level remain largely unknown. Here, we established that Bmal1, a master regulator of circadian rhythms, modifies m6A RNA methylation, which impacts RNA processing in the murine liver. A number of genes exhibit altered m6A methylation profiles upon liver-specific deletion of Bmal1, including those involved in lipid metabolism, particularly methylation of PPaRα mRNA. Although many of the genes we noted exhibiting altered methylation in the absence of Bmal1 are associated with the regulation of RNA biology, we sought to determine whether modulation of m6A levels by Bmal1 affects RNA splicing, export, or stability.
RNA splicing, polyadenylation, and mRNA stability exhibit circadian dynamics that can exert a direct impact on gene expression control, including clock genes and downstream circadian-controlled genes (Kim et al., 2015; Koike et al., 2012). Fustin et al. (2013) provided the evidence for modulation of m6A RNA methylation on clock gene stability, revealing that m6A RNA methylation regulates RNA processing including RNA export and stability, and affects clock gene dynamics. In contrast with Fustin et al. (2013) observations, we showed that RNA m6A levels, its methyltransferases (METTL14), demethylases (ALKBH5 and FTO), and binding protein YTHDF2 exhibit a robust diurnal rhythm, confirming studies by Wang et al. (2015b). Furthermore, our in vivo data support this finding, in that deletion of liver Bmal1 significantly enhanced the levels of liver m6A in polyadenylated RNA (Figure 1F), particularly in the context of m6A methylation of PPaRα mRNA (Figure 2F). These associated changes in methylation profiles could impact RNA binding, RNA processing, and RNA metabolic processes, providing robust evidence that circadian rhythms control m6A RNA methylation and affect the fundamental function of m6A. Taken together, both our findings and those of Fustin et al. (2013) suggest the relationships between m6A RNA methylation and circadian machinery are bidirectional, and m6A may participate in the circadian transcription-translation feedback loop. However, the exact mechanisms of how circadian rhythms regulate m6A RNA methylation are unclear. Previous work shows that ROS exhibits oscillatory patterns at both the cellular and organismal level, and that Bmal1 deletion results in high levels of ROS and elevated oxidative damage (Geyfman et al., 2012; Jacobi et al., 2015; Lee et al., 2013). This can have negative consequences on DNA, RNA, and protein methylation modifications. Our data using H2O2 treatment in HepG2 cells and APAP injection in WT mice support this notion, in that ROS significantly induces the levels of YTHDF2, with concomitant increases in the m6A level in PPaRα transcript (Figures 6G and 6I). This is consistent with our in vivo observation that Bmal1 deletion from the liver increases METTL3, YTHDF2 (Figures 1E), and PPaRα mRNA methylation (Figure 2F). Thus, it is possible that disruptive m6A RNA methylation induced by loss of hepatic Bmal1 is associated with increases in ROS in the murine liver, a notion that is supported by dihydroethidium staining of liver sections from Bmal1-deficient mice.
There has been speculation that the dynamic and reversible chemical m6A modification on RNA play a potential role in obesity and other diseases. Data from animal and cellular models demonstrate that perturbation of FTO as an m6A de-methylase causes malfunction of energy and adipose homeostasis in mice (Church et al., 2010; Merkestein et al., 2015; Zhao et al., 2014). The present study shows that decrease of m6A RNA methylation reduces cell viability (as shown using specific siRNAs in vitro) and lipid accumulation in hepatocytes, suggesting that proper levels of m6A may be required to maintain metabolic homeostasis. m6A RNA methylation may participate in crosstalk between the circadian clock and cellular metabolism, because we observed that deletion of Bmal1 in murine liver leads to aberrant m6A mRNA methylation and metabolic disruption. Here we show that PPaRα, which is rhythmically expressed and is important for circadian dynamics of lipid metabolism (Canaple et al., 2006; Oishi et al., 2005), is significantly modified by m6A RNA methylation, including changes in m6A abundance, mRNA lifetime, transcript, and translation. Thus, disruption of lipid metabolism in the absence of liver Bmal1 could be because of aberrant PPaRα m6A mRNA methylation. Indeed, our working model suggests genetic deletion of liver Bmal1 leads to ROS accumulation and increases in mRNA methylation via elevated METTL3 and m6A. This increases expression of YTHDF2, which regulates downstream PPaRα transcription and lipid metabolism (Figure 7). Taken together, these results offer a framework for understanding the circadian clock, dynamics of lipid metabolism, and m6A RNA methylation.
In summary, we have discovered a role of m6A RNA methylation, particularly that of PPaRα, on the mechanism of circadian clock regulation of downstream genes and lipid metabolism. Together, this work provides key insights into potential avenues for prevention and treatment of the adverse effects of circadian misalignment associated with obesity and other metabolic diseases.
STAR★METHODS
KEY RESOURCES TABLE
| REAGENT or RESOURCE | SOURCE | IDENTIFIER |
|---|---|---|
| Antibodies | ||
| Mouse polyclonal anti-METTL3 | Novus Biological | H0005G339-B01; RRID: AB_2250484 |
| Mouse monoclonal anti-FTO | Abcam | ab92821; RRID: AB_10565042 |
| Mouse monoclonal anti-GAPDH | Invitrogen | MA5–15738-HRP; RRID: AB_2537659 |
| Mouse monoclonal anti- beta Actin | Abcam | ab8226; RRID: AB_306371 |
| Rabbit polyclonal anti-m6A | Synaptic systems | 202003; RRID: AB_2279214 |
| Rabbit polyclonal anti-METTL3 | Proteintech | 15073–1-AP; RRID: AB_2142033 |
| Rabbit polyclonal anti-ALKBH5 | Abcam | ab174124 |
| Rabbit polyclonal anti-YTHDF2 | Proteintech | 24744–1-AP |
| Rabbit polyclonal anti-BMALI | Abcam | ab93806; RRID: AB_10675117 |
| Rabbit polyclonal anti-PPaRα | Novus Biological | NBP1–03288; RRID: AB_1522109 |
| Donkey anti-rat Alexa Fluor 488 | Molecular Probes | A21208; RRID: AB_141709 |
| Goat anti-rabbit Alexa Fluor 488 | Molecular Probes | A11034; RRID: AB_2576217 |
| Goat anti-mouse Alexa Fluor 594 | Molecular Probes | A11032; RRID: AB_141672 |
| Goat anti-mouse Alexa Fluor 647 | Molecular Probes | A2123G; RRID: AB_141725 |
| Chemicals, Peptides, and Recombinant Proteins | ||
| 3X flag peptide | Sigma | F4799 |
| Actinomycin D | Life technologies | 11805–017 |
| NG-Methyladenosine 5′-monophosphate sodium salt |
Sigma | M2780 |
| Nulcease P1 | Fisher scientific | NC930858 |
| Alkaline phosphatase | Sigma | P5931 |
| Critical Commercial Assays | ||
| Cholesterol assay kit | Wako Pure Chemical Industries | 439–17501 |
| Triglyceride assay kit | Wako Pure Chemical Industries | 465–09791 |
| LDL assay kit | Wako Pure Chemical Industries | 933–00404 |
| HDL assay kit | Wako Pure Chemical Industries | 993–72691 |
| PolyATtract® mRNA Isolation System | Promega | Z5300 |
| Ribominus eukaryote kit v2 | Life technologies | A15020 |
| anti-flag M2 magnetic beads | Sigma | M8823 |
| Deposited Data | ||
| M6A-seq | NCBI database | GSE102G19 and GSE102G20 |
| Experimental Models: Cell Lines | ||
| HepG2 | ATCC | HB-8065 |
| Hepa1–6 | ATCC | CRL-1830 |
| Experimental Models: Organisms/Strains | ||
| Liver-specific Bmal1f/f-AlbCre-knockout mouse | Jackson Laboratory | N/A |
| Oligonucleotides | ||
| Full sequences available in Table S2 | This paper | N/A |
| Software and Algorithms | ||
| Originpro 8.1 | OriginLab | https://www.originlab.com/ |
| CircWave v1.4 | EUCLOCK | https://www.euclock.org/results/item/circ-wave.html |
| ImageJ | NIH | https://imagej.nih.gov/ij/index.html; RRID: SCR_003070 |
CONTACT FOR REAGENT AND RESOURCE SHARING
Further information and requests for resources and reagents should be directed to and will be fulfilled by the Lead Contact, Eugene B. Chang (echang@medicine.bsd.uchicago.edu).
EXPERIMENTAL MODEL AND SUBJECT DETAILS
Mice
All murine experimental procedures were approved by the Institutional Animal Care and Use Committee of the University of Chicago. Liver-specific Bmal1f/f-AlbCre-knockout mice were purchased from Jackson Laboratory. C57BI/6J or Bmal1f/f-AlbCre-knockout male mice were maintained under a 12 hr light/12 hr dark (LD) cycle (ZT0 = 6 AM) and fed ad libitum with normal rodent chow (2018 Global 18% Protein diet, Envigo) and water. At 10–14 weeks of age, 10 male mice per group were sacrificed via CO2 asphyxiation at Zeitgeber Time (ZT) 0,2,6,10,12,14,18,22. In order to induce high levels of ROS in the liver, WT male mice were fasted 12 h and followed by intraperitoneal injection with 300 mg/kg APAP dissolved in PBS and re-fed (Kheradpezhouh et al., 2014; Mossanen and Tacke, 2015). Mice were sacrificed at 6 h after APAP injection. Plasma and liver were collected and stored at −80°C until further analysis.
Cell lines
The human HepG2 cell line and mouse Hepa1–6 cell line used in this study was purchased from ATCC and grown in DMEM (GIBCO, 11965) media supplemented with 10% FBS, 1% 100 × Pen Strep, and GlutaMAX Supplement (GIBCO). Cells were incubated with 5% CO2 and 95% air at 37°C.
METHOD DETAILS
siRNA knockdown and plasmid transfection
AllStars negative control siRNA from QIAGEN (1027281) was used as control siRNA in knockdown experiments. Human METTL3, YTHDF2 and PPaRα siRNAs were ordered from QIAGEN (Hs-METTL3 with target sequence CTGCAAGTATGTTCACTATGA, Hs-YTHDF2 with target sequence AAGGACGTTCCCAATAGCCAA, Hs-PPaRα target with AAGCTTTGGCTTTACGGAATA, CAAGA GAATCTACGAGGCCTA, CAGTGGAGCATTGAACATCGA, or TCGGCGAACGATTCGACTCAA). Murine METTL3 siRNAs were synthesized by RiboBio (RiboBio, Guangzhou) (siMETTL3 Antisense: GCUACCGUAUGGGACAUUA). The plasmids including pcDNA/Flag-METTL3, pcDNA/Flag-tagged YTHDF2, pcDNA/Flag-tagged YTHDF2 C-terminal domain, pcDNA/Flag-tagged YTHDF2 N-terminal domain used for overexpression of METTL3 or YTHDF2 in HepG2 cells were a generous gift from Dr. Chuan He (University of Chicago). Transfection was achieved by using Lipofectamine RNAiMAX (Invitrogen) for siRNA, and Lipofectamine LTX Plus (Invitrogen) for plasmids following the manufacture’s protocols. Cells were collected 48 h after the transfection, snap-frozen in liquid nitrogen, and stored at −80°C for further studies.
RNA isolation and purification
Total RNA was isolated from liver or cells using TRIzol (Invitrogen), and treated by DNaseI to remove contaminant DNA. Messenger RNA for LC-MS/MS was extracted using PolyATtract® mRNA Isolation System III (Promega) followed by further removal of contaminated rRNA by using the Ribominus eukaryote kit v2 (Life technologies).
qRT-PCR
Total RNA was isolated from liver or cells with TRIzol reagent (Invitrogen) and reverse transcription was conducted using High Capacity cDNA Reverse Transcription Kit (Invitrogen). Real-time PCR analysis was performed on a Light Cycler 480II (Roche) using iQ SYBR Green Supermix (Biorad) with 500–1000 ng total RNA template. The primers used for qRT-PCR are listed in Table S2.
Lipid Analysis
Plasma cholesterol, triglyceride, LDL, and LDH levels in Bmal1f/f-AlbCre-knockout and wild-type littermate control mice were measured by using assay kits purchased from Wako Pure Chemical Industries.
Quantification of m6A by LC-MS/MS
Messenger RNA was subjected to liquid chromatography-tandem mass spectrometry (LC-MS/MS) for determination of m6A as previously described (Wang et al., 2014a). 200–400 ng of mRNA was digested by P1 nuclease (Fisher Scientific) in 25 μL of buffer containing 2.0 mM ZnCl2 and 10 mM NaCl for 2 h at 37°C. Subsequently, 1 μL alkaline phosphatase and 2.5 μL NH4HCO3 were added and the sample was incubated for 2 h at 37°C. The sample was then diluted with 75 μL of RNase free water and filtered through a 0.22 μm PVDF filter (Millipore). Finally, the sample was injected into a C18 reverse phase column coupled on-line to Agilent 6410 triple-quadrupole (QQQ) LC mass spectrometer in multiple reactions monitoring (MRM) positive electrospray ionization (ESI) mode. The nucleosides were quantified using the nucleoside to base ion mass transitions of 282.1 to 150.1 (m6A), 268.0 to 136.0 (A), 296 to 164 (m6,6A). m6,6A is used as quality control for mRNA purity, since rRNA has m6,6A, but mRNA does not. Concentrations of nucleosides in mRNA samples were deduced by fitting the signal intensities into the stand curves. The ratios of m6A/A were subsequently calculated, as previously described (Dominissini et al., 2012).
Immunofluorescence staining
Liver tissue was fixed in 10% formalin and imbedded in paraffin for sectioning. 4–5 μm paraffin–imbedded sections were rehydrated followed by antigen retrieval. Cells grown on glass coverslips were fixed in 4% paraformaldehyde in PBS for 10 min at 4°C, and then were permeated with 0.1% Trition X-100 in PBS for 15 min. Protein block was performed using Dako blocking solution (Dakocyto-mation protein block serum-free) for 30–60 min. All primary antibodies were applied in Dakocytomation antibody diluents for 2 h at room temperature or overnight at 4°C followed by 1 h incubation at room temperature with the secondary Alexa series fluorescently labeled antibodies (1:1500 dilution). After washing with PBST, prolong Gold antifade reagent with DAPI staining was used for nuclei detection (Life Technologies). Confocal microscopy images were captured by Leica SP5 II STED-CW Super-resolution Laser Scanning Confocal instrument and analyzed by ImageJ software.
Staining of lipid droplets
Cells cultured on glass coverslips were fixed with buffered 3% formaldehyde for 15 min followed by rinsing with PBS three times. Subsequently, cells were incubated with the diluted BODIPY493/503 (Invitrogen) solution in PBS for 15 min in the dark. After washing with PBS three times, glass coverslips were mounted on a glass slide followed by analysis using confocal microscopy.
Detection of ROS
The levels of ROS were detected by dihydroethidium (DHE) staining in the liver. Briefly, cryosections from snap-frozen liver (5 μm) were stained with 30 μM DHE for 30 min in the dark at RT. Subsequently, sections were incubated with DAPI for 5 min, followed by washing with PBS. The images were taken at 200-fold magnification. Quantification was performed by measuring gray values per cell with ImageJ software.
Cell proliferation and viability assay
The 3-(4,5-dimethylthiazol-2-yl)-2,5-diphenyltetrazolium bromide (MTT) assay was performed according to the manufacturer’s instructions (Roche Applied Science).
Immunoblotting
Total cellular protein was isolated from 200 mg of frozen liver tissue or cells of 6-well plate using Cell Lysis Buffer containing Complete Protease Inhibitor (Roche) and PMSF, followed by separation on reducing SDS-PAGE gels. Protein was then transferred to nitrocellulose membranes. Membranes were blocked for 1 h in TBS containing 5% non-fat milk and 0.1% Tween-20, followed by incubation with primary antibodies overnight at 4°C. After incubation with horseradish-peroxidase-coupled secondary antibodies at room temperature for 1 h, immunoblots were visualized using enhanced chemiluminescence (ECLPlus)
RNA immunoprecipitation
The procedure was performed as previously reported (Wang et al., 2014a). After 24 h transfection of Flag-tagged YTHDF2, HepG2 cells cultured in 15-cm plates were collected via cell scraping, and then pelleted by low-speed centrifugation and washed once with ice cold PBS. The cell pellet was re-suspended with 2 volumes of lysis buffer (150 mM KCl, 10 mM HEPES pH 7.6, 2 mM EDTA, 0.5% NP-40, 0.5 mM DTT, 1:100 protease inhibitor cocktail, 400 U/ml RNase inhibitor), and gently resuspended with a pipette several times. Subsequently, the mRNP lysate was kept on ice for 5 min and snap-frozen in liquid nitrogen, and then stored at −80°C. To remove debris, the mRNP lysate was thawed on ice and centrifuged at 16,000 g for 15 min, and filtered through a 0.22 μm membrane syringe. 50 μL cell lysate was saved as input, added to 1 mLTRIzol. 30 μL of anti-Flag M2 magnetic beads per sample (Sigma) were added and washed with 600 μL NT2 buffer (200 mM NaCl, 50 nM HEPES pH 7.6, 2 mM EDTA, 0.05% NP-40, 0.5 mM DTT, 200 U/ml RNase inhibitor) four times using a magnetic separator followed by resuspension in 800 μL ice-cold NT2 buffer. The mRNP lysate was added to the washed M2 beads, mixed well, and then agitated continuously at 4°C for 4 h or overnight. The beads were collected using the magnetic separator followed by washing eight times with 1 mL ice-cold NT2 buffer. 5 packed volume of 3 X Flag peptide (Sigma) in NT2 buffer (500 μg/ml) were added to each sample, and then rotated at 4°C for 2 h to elute. The supernatant was collected and 1 mLTRIzol was added and saved as IP. RNA was isolated from input and IP samples and subjected to qRT-PCR for analysis of mRNA enrichment.
mRNA lifetime
HepG2 cells were seeded in 24-well plates and transfected with METTL3 and YTHDF1 siRNA versus control siRNA, and plasmids encoding METTL3 or YTHDF2 at 70%–80% confluence. After 48 h, cells were treated with actinomycin (5 μg/ml) for 6 h, 3 h, and 0 h before trypsinization and collection. The total RNA was isolated by TRIzol. After reverse transcription, the mRNA levels of transcripts of interest were detected by qRT-PCR. The degradation rate of RNA k was estimated by
where t is transcription inhibition time (h), At and A0 represent mRNA quantity at time t and time 0. Two k values were calculated: time 3 h versus time 0 h, and time 6 h versus time 0 h. The final lifetime was calculated by using the average of k3 h and k6 h.
m6A-seq
The procedure was performed as previously described (Dominissini et al., 2012). Total RNA was extracted using TRIzol reagent followed by purification using PolyATtract® mRNA Isolation System III (Promega). Subsequently, mRNA fragmentation was performed in fragmentation buffer (10 mM Tris-HCl, pH 7.0,10 mM ZnCl2) for 15 min at 70°C. 500 ng mRNA was saved as input control for RNA-seq. 5 mg fragmented mRNA was incubated with 12 μg anti-m6A antibody (Synaptic Systems) in 1 × IP buffer (10 mM Tris-HCl, pH 7.4, 150 mM NaCl, and 0.1% Igepal CA-630) for 2 h at 4°C. While fragmented mRNA was incubating, recombinant protein A bead (Invitrogen) was washed twice followed by incubation in 1 × IP buffer with 0.5 mg/ml BSA on a rotating wheel for 2 h at 4°C. The m6A-IP mixture was then incubated with protein A beads for additional 2 h at 4°C on a rotating wheel. After washing three times with IP buffer, bound mRNA was eluted using 100 μL elution buffer (6.7 mM N6-Methyladenosine-5′-monophosphate sodium salt in IP buffer) followed by ethanol and sodium acetate precipitation. Immunoprecipitated RNA fragments and comparable amounts of input were subjected to first-strand cDNA synthesis. Sequencing was performed on Illumina HiSeq2500 according to the manufacture’s instructions.
Gene-specific m6A qRT-PCR
The relative abundance of PPaRa mRNA in m6A antibody IP samples and input samples was assessed by qRT-PCR in HepG2 cells after H2O2 treatment. Total RNA was isolated from HepG2 cells with TRIzol reagent (Invitrogen) followed polyadenylated RNA extraction using PolyATtract® mRNA Isolation System III (Promega). A 200-ng aliquot of mRNA was saved as input samples. The remaining mRNA was used for m6A-immunoprecipitation as described above in the m6A-seq procedure. A 5-μg aliquot mRNA was incubated with m6A antibody (abcam) in IP buffer (10 mM Tris-HCl, pH 7.4,150 mM NaCl, and 0.1% Igepal CA-630) supplemented with RNase inhibitor (Fermentas) for 2 h at 4°C. Dynabeads® Protein A (Invitrogen) was added to the solution and rotated for an additional 2 h at 4°C. After washing with IP buffer, mRNA was eluted from the beads via incubation in 300 μL elution buffer (0.1 M NaCI, 10 mM Tris pH 8.0, 1 mM EDTA, 0.05% SDS, 200 mg/mL Proteinase K) for 1.5 h at 50°C. Finally, m6A IP mRNA was recovered by ethanol precipitation, purified by phenol/chloroform extraction, and analyzed by qRT-PCR.
QUANTIFICATION AND STATISTICAL ANALYSIS
Detailed descriptions of sample numbers and statistical tests can be found in Figure Legends and Method Details. Comparisons between the mean ± SEM of two groups were calculated using Student’s unpaired two-tailed t test (with the exception of Figure 5), and performed with SPSS software. Statistical analysis was performed using one-way ANOVA, followed by Dunnett’s multiple comparisons test for rescue experiments (Figure 5). The following p values were considered to be statistically significant: p value ≤ 0.05 (*), p value ≤ 0.01 (**). CircWave v1.4 software was used to analyze rhythmicity of in vivo mRNA gene expression and m6A abundance in livers of mice harvested every 4 hours over a 24-hr light:dark cycle as previously described (results presented in Table S1, Leone et al., 2015).
Supplementary Material
Highlights.
Knockout of Bmal1 in the liver disrupts lipid metabolism
Deletion of Bmal1 increases m6A levels, particularly in PPaRα mRNA
METTL3 and YTHDF2 uniquely impact PPaRα mRNA decay and transcript
Disrupted Bmal1 drives ROS-induced increases of m6A levels in PPaRα transcript
ACKNOWLEDGMENTS
We thank Qinghua Yu and Jianyi Pan for sample collection from mice. We thank Chang Liu for determination of m6A by LC-MS/MS. We are grateful to Xiao Wang (University of Chicago) for critical materials. We are indebted to Dan Dominissini and Qing Dai for critical suggestions (University of Chicago). We also thankXiaolong Cui for RNA-sequencing (RNA-seq) data analysis. This work was supported by the NIDDK (grant DK097268 and K01DK111785), a NIDDK T32 training grant (DK07074), the Gastrointestinal Research Foundation of Chicago, the National Natural Science Foundation of China (grant 31472129), and the Natural Science Foundation of Jiangsu Province (grant BK20161446).
Footnotes
DATA AND SOFTWARE AVAILABILITY
The accession numbers for the m6A-seq data reported in this paper are GEO: GSE102619, GSE102620.
DECLARATION OF INTERESTS
The authors declare no competing interests.
SUPPLEMENTAL INFORMATION
Supplemental Information includes six figures and two tables and can be found with this article online at https://doi.org/10.1016/j.celrep.2018.10.068.
REFERENCES
- Adamovich Y, Rousso-Noori L, Zwighaft Z, Neufeld-Cohen A, Golik M, Kraut-Cohen J, Wang M, Han X, and Asher G (2014). Circadian clocks and feeding time regulate the oscillations and levels of hepatic triglycerides. Cell Metab. 19,319–330. [DOI] [PMC free article] [PubMed] [Google Scholar]
- Asher G, and Sassone-Corsi P (2015). Time for food: the intimate interplay between nutrition, metabolism, and the circadian clock. Cell 161, 84–92. [DOI] [PubMed] [Google Scholar]
- Bass J (2012). Circadian topology of metabolism. Nature 491, 348–356. [DOI] [PubMed] [Google Scholar]
- Batista PJ, Molinie B, Wang J, Qu K, Zhang J, Li L, Bouley DM, Lujan E, Haddad B, Daneshvar K, et al. (2014). m(6)A RNA modification controls cell fatetransition in mammalian embryonic stem cells. Cell Stem Cell 15, 707–719. [DOI] [PMC free article] [PubMed] [Google Scholar]
- Belden WJ, Lewis ZA, Selker EU, Loros JJ, and Dunlap JC (2011). CHD1 remodels chromatin and influences transient DNA methylation at the clock gene frequency. PLoS Genet. 7, e1002166. [DOI] [PMC free article] [PubMed] [Google Scholar]
- Bellet MM, and Sassone-Corsi P (2010). Mammalian circadian clock and metabolism—the epigenetic link. J. Cell Sci. 123, 3837–3848. [DOI] [PMC free article] [PubMed] [Google Scholar]
- Canaple L, Rambaud J, Dkhissi-Benyahya O, Rayet B, Tan NS, Michalik L, Delaunay F, Wahli W, and Laudet V (2006). Reciprocal regulation of brain and muscleArnt-like protein 1 and peroxisome proliferator-activated receptor α defines a novel positive feedback loop in the rodent liver circadian clock. Mol. Endocrinol. 20, 1715–1727. [DOI] [PubMed] [Google Scholar]
- Chen T, Hao YJ, Zhang Y, Li MM, Wang M, Han W, Wu Y, Lv Y, Hao J, Wang L, et al. (2015). m(6)A RNA methylation is regulated by microRNAs and promotes reprogramming to pluripotency. Cell Stem Cell 16, 289–301. [DOI] [PubMed] [Google Scholar]
- Church C, Moir L, McMurray F, Girard C, Banks GT, Teboul L, Wells S, Brüning JC, Nolan PM, Ashcroft FM, and Cox RD (2010). Overexpression of Fto leads to increased food intake and results in obesity. Nat. Genet. 42, 1086–1092. [DOI] [PMC free article] [PubMed] [Google Scholar]
- Dina C, Meyre D, Gallina S, Durand E, Korner A, Jacobson P, Carlsson LMS, Kiess W, Vatin V, Lecoeur C, et al. (2007). Variation in FTO contributes to childhood obesity and severe adult obesity. Nat. Genet. 39, 724–726. [DOI] [PubMed] [Google Scholar]
- Dominissini D, Moshitch-Moshkovitz S, Schwartz S, Salmon-Divon M, Ungar L, Osenberg S, Cesarkas K, Jacob-Hirsch J, Amariglio N, Kupiec M, et al. (2012). Topology of the human and mouse m6A RNA methylomes revealed by m6A-seq. Nature 485, 201–206. [DOI] [PubMed] [Google Scholar]
- Dominissini D, Moshitch-Moshkovitz S, Salmon-Divon M, Amariglio N, and Rechavi G (2013). Transcriptome-wide mapping of N(6)-methyladenosine by m(6)A-seq based on immunocapturing and massively parallel sequencing. Nat. Protoc. 8, 176–189. [DOI] [PubMed] [Google Scholar]
- Fang B, Everett LJ, Jager J, Briggs E, Armour SM, Feng D, Roy A, Gerhart-Hines Z, Sun Z, and Lazar MA (2014). Circadian enhancers coordinate multiple phases of rhythmic gene transcription in vivo. Cell 159, 1140–1152. [DOI] [PMC free article] [PubMed] [Google Scholar]
- Fustin JM, Doi M, Yamaguchi Y, Hida H, Nishimura S, Yoshida M, Isagawa T, Morioka MS, Kakeya H, Manabe I, and Okamura H (2013). RNA-methylation-dependent RNA processing controls the speed of the circadian clock. Cell 155, 793–806. [DOI] [PubMed] [Google Scholar]
- Geula S, Moshitch-Moshkovitz S, Dominissini D, Mansour AA, Kol N, Salmon-Divon M, Hershkovitz V, Peer E, Mor N, Manor YS, et al. (2015). m6A mRNA methylation facilitates resolution of naive pluripotency toward differentiation. Science 347, 1002–1006. [DOI] [PubMed] [Google Scholar]
- Geyfman M, Kumar V, Liu Q, Ruiz R, Gordon W, Espitia F, Cam E, Millar SE, Smyth P, Ihler A, et al. (2012). Brain and muscleArnt-like protein-1 (BMAL1) controls circadian cell proliferation and susceptibility to UVB-induced DNA damage in the epidermis. Proc. Natl. Acad. Sci. USA 109, 11758–11763. [DOI] [PMC free article] [PubMed] [Google Scholar]
- Jacobi D, Liu S, Burkewitz K, Kory N, Knudsen NH, Alexander RK, Unluturk U, Li X, Kong X, Hyde AL, et al. (2015). Hepatic Bmal1 regulates rhythmic mitochondrial dynamics and promotes metabolic fitness. Cell Metab. 22, 709–720. [DOI] [PMC free article] [PubMed] [Google Scholar]
- Jia G, Fu Y, Zhao X, Dai Q, Zheng G, Yang Y, Yi C, Lindahl T, Pan T, Yang YG, and He C (2011). N6-methyladenosine in nuclear RNA is a major substrate of the obesity-associated FTO. Nat. Chem. Biol. 7, 885–887. [DOI] [PMC free article] [PubMed] [Google Scholar]
- Jia G, Fu Y, and He C (2013). Reversible RNAadenosine methylation in biological regulation. Trends Genet. 29, 108–115. [DOI] [PMC free article] [PubMed] [Google Scholar]
- Kheradpezhouh E, Ma L, Morphett A, Barritt GJ, and Rychkov GY (2014). TRPM2 channels mediate acetaminophen-induced liver damage. Proc. Natl. Acad. Sci. USA 111, 3176–3181. [DOI] [PMC free article] [PubMed] [Google Scholar]
- Kim SH, Lee KH, Kim DY, Kwak E, Kim S, and Kim KT (2015). Rhythmic control of mRNA stability modulates circadian amplitude of mouse Period3 mRNA. J. Neurochem. 132, 642–656. [DOI] [PubMed] [Google Scholar]
- Koike N, Yoo SH, Huang HC, Kumar V, Lee C, Kim TK, and Takahashi JS (2012). Transcriptional architecture and chromatin landscape of the core circadian clock in mammals. Science 338, 349–354. [DOI] [PMC free article] [PubMed] [Google Scholar]
- Kume K, Zylka MJ, Sriram S, Shearman LP, Weaver DR, Jin X, Maywood ES, Hastings MH, and Reppert SM (1999). mCRY1 and mCRY2 are essential components of the negative limb of the circadian clock feedback loop. Cell 98, 193–205. [DOI] [PubMed] [Google Scholar]
- Lai AG, Doherty CJ, Mueller-Roeber B, Kay SA, Schippers JHM, and Dijkwel PP (2012). CIRCADIAN CLOCK-ASSOCIATED 1 regulates ROS homeostasis and oxidative stress responses. Proc. Natl. Acad. Sci. USA 109, 17129–17134. [DOI] [PMC free article] [PubMed] [Google Scholar]
- Lamia KA, Storch KF, and Weitz CJ (2008). Physiological significance of a peripheral tissue circadian clock. Proc. Natl. Acad. Sci. USA 105, 15172–15177. [DOI] [PMC free article] [PubMed] [Google Scholar]
- Lee J, Moulik M, Fang Z, Saha P, Zou F, Xu Y, Nelson DL, Ma K, Moore DD, and Yechoor VK (2013). Bmal1 and β-cell clock are required for adaptation to circadian disruption, and their loss offunction leads to oxidative stress-induced β-cell failure in mice. Mol. Cell. Biol. 33, 2327–2338. [DOI] [PMC free article] [PubMed] [Google Scholar]
- Leone V, Gibbons SM, Martinez K, Hutchison AL, Huang EY, Cham CM, Pierre JF, Heneghan AF, Nadimpalli A, Hubert N, et al. (2015). Effects of diurnal variation of gut microbes and high-fat feeding on host circadian clock function and metabolism. Cell Host Microbe 17, 681–689. [DOI] [PMC free article] [PubMed] [Google Scholar]
- Li X, Yang J, Zhu Y, Liu Y, Shi X, and Yang G (2016). Mouse maternal high-fat intake dynamically programmed mRNA m6A modifications in adipose and skeletal muscle tissues in offspring. Int. J. Mol. Sci. 17, e1336. [DOI] [PMC free article] [PubMed] [Google Scholar]
- Lin S, Choe J, Du P,Triboulet R, and Gregory RI (2016). The m(6)A Methyltransferase METTL3 Promotes Translation in Human Cancer Cells. Mol. Cell 62, 335–345. [DOI] [PMC free article] [PubMed] [Google Scholar]
- Liu J, Yue Y, Han D, Wang X, Fu Y, Zhang L, Jia G, Yu M, Lu Z, Deng X, et al. (2014). A METTL3-METTL14 complex mediates mammalian nuclear RNA N6-adenosine methylation. Nat. Chem. Biol. 10, 93–95. [DOI] [PMC free article] [PubMed] [Google Scholar]
- Liu N, Dai Q, Zheng G, He C, Parisien M, and Pan T (2015). N(6)-methyladenosine-dependent RNA structural switches regulate RNA-protein interactions. Nature 518, 560–564. [DOI] [PMC free article] [PubMed] [Google Scholar]
- Marcheva B, Ramsey KM, Buhr ED, Kobayashi Y, Su H, Ko CH, Ivanova G, Omura C, Mo S, Vitaterna MH, et al. (2010). Disruption of the clock components CLOCK and BMAL1 leads to hypoinsulinaemia and diabetes. Nature 466, 627–631. [DOI] [PMC free article] [PubMed] [Google Scholar]
- Markson JS, Piechura JR, Puszynska AM, and O’Shea EK (2013). Circadian control of global gene expression by the cyanobacterial master regulator RpaA. Cell 155, 1396–1408. [DOI] [PMC free article] [PubMed] [Google Scholar]
- Masri S, Rigor P, Cervantes M, Ceglia N, Sebastian C, Xiao C, Roqueta-Rivera M, Deng C, Osborne TF, Mostoslavsky R, et al. (2014). Partitioning circadian transcription by SIRT6 leads to segregated control of cellular metabolism. Cell 158, 659–672. [DOI] [PMC free article] [PubMed] [Google Scholar]
- Merkestein M, Laber S, McMurray F, Andrew D, Sachse G, Sanderson J, Li M, Usher S, Sellayah D, Ashcroft FM, and Cox RD (2015). FTO influences adipogenesis by regulating mitotic clonal expansion. Nat. Commun. 6, 6792. [DOI] [PMC free article] [PubMed] [Google Scholar]
- Meyer KD, Patil DP, Zhou J, Zinoviev A, Skabkin MA, Elemento O, Pestova TV, Qian S-B, and Jaffrey SR (2015). 5′ UTR m6A promotes cap-independent translation. Cell 163, 999–1010. [DOI] [PMC free article] [PubMed] [Google Scholar]
- Mossanen JC, and Tacke F (2015). Acetaminophen-induced acute liver injury in mice. Lab. Anim. 49 (Suppl 1), 30–36. [DOI] [PubMed] [Google Scholar]
- Nakahata Y, Sahar S, Astarita G, Kaluzova M, and Sassone-Corsi P (2009). Circadian control of the NAD+ salvage pathway by CLOCK-SIRT1. Science 324, 654–657. [DOI] [PMC free article] [PubMed] [Google Scholar]
- Oishi K, Shirai H, and Ishida N (2005). CLOCK is involved in the circadian transactivation of peroxisome-proliferator-activated receptor α (PPARalpha) in mice. Biochem. J. 386, 575–581. [DOI] [PMC free article] [PubMed] [Google Scholar]
- O’Neill JS, and Feeney KA (2014). Circadian redox and metabolic oscillations in mammalian systems. Antioxid. Redox Signal. 20, 2966–2981. [DOI] [PMC free article] [PubMed] [Google Scholar]
- Padmanabhan K, Robles MS, Westerling T, and Weitz CJ (2012). Feedback regulation of transcriptional termination by the mammalian circadian clock PERIOD complex. Science 337, 599–602. [DOI] [PubMed] [Google Scholar]
- Paschos GK, Ibrahim S, Song WL, Kunieda T, Grant G, Reyes TM, Bradfield CA, Vaughan CH, Eiden M, Masoodi M, et al. (2012). Obesity in mice with adipocyte-specific deletion of clock component Arntl. Nat. Med. 18, 1768–1777. [DOI] [PMC free article] [PubMed] [Google Scholar]
- Roundtree IA, Evans ME, Pan T, and He C (2017). Dynamic RNA Modifications in Gene Expression Regulation. Cell 169, 1187–1200. [DOI] [PMC free article] [PubMed] [Google Scholar]
- Rudic RD, McNamara P, Curtis AM, Boston RC, Panda S, Hogenesch JB, and Fitzgerald GA (2004). BMAL1 and CLOCK, two essential components of the circadian clock, are involved in glucose homeostasis. PLoS Biol. 2, e377. [DOI] [PMC free article] [PubMed] [Google Scholar]
- Vollmers C, Schmitz RJ, Nathanson J, Yeo G, Ecker JR, and Panda S (2012). Circadian oscillationsofprotein-coding and regulatory RNAs in a highly dynamic mammalian liver epigenome. Cell Metab. 16, 833–845. [DOI] [PMC free article] [PubMed] [Google Scholar]
- Wang X, and He C (2014). Dynamic RNAmodifications in posttranscriptional regulation. Mol. Cell 56, 5–12. [DOI] [PMC free article] [PubMed] [Google Scholar]
- Wang X, Lu Z, Gomez A, Hon GC, Yue Y, Han D, Fu Y, Parisien M, Dai Q, Jia G, et al. (2014a). N6-methyladenosine-dependent regulation of messenger RNA stability. Nature 505, 117–120. [DOI] [PMC free article] [PubMed] [Google Scholar]
- Wang Y, Li Y, Toth JI, Petroski MD, Zhang Z, and Zhao JC (2014b). N6-methyladenosine modification destabilizes developmental regulators in embryonic stem cells. Nat. Cell Biol. 16, 191–198. [DOI] [PMC free article] [PubMed] [Google Scholar]
- Wang CY, Shie SS, Hsieh IC, Tsai ML, and Wen MS (2015a). FTO modulates circadian rhythms and inhibits the CLOCK-BMAL1-induced transcription. Biochem. Biophys. Res. Commun. 464, 826–832. [DOI] [PubMed] [Google Scholar]
- Wang CY, Yeh JK, Shie SS, Hsieh IC, and Wen MS (2015b). Circadian rhythm of RNA N6-methyladenosine and the role of cryptochrome. Bio-chem. Biophys. Res. Commun. 465, 88–94. [DOI] [PubMed] [Google Scholar]
- Wang X, Zhao BS, Roundtree IA, Lu Z, Han D, Ma H, Weng X, Chen K, Shi H, and He C (2015c). N6-methyladenosine modulates messenger RNA translation efficiency. Cell 161, 1388–1399. [DOI] [PMC free article] [PubMed] [Google Scholar]
- Wei CM, Gershowitz A, and Moss B (1975). Methylated nucleotides block 5′ terminus of HeLa cell messenger RNA. Cell 4, 379–386. [DOI] [PubMed] [Google Scholar]
- Xiang Y, Laurent B, Hsu CH, Nachtergaele S, Lu Z, Sheng W, Xu C, Chen H, Ouyang J, Wang S, et al. (2017). RNA m6A methylation regulates the ultraviolet-induced DNA damage response. Nature 543, 573–576. [DOI] [PMC free article] [PubMed] [Google Scholar]
- Xiao W, Adhikari S, Dahal U, Chen YS, Hao YJ, Sun BF, Sun HY, Li A, Ping XL, Lai WY, et al. (2016). Nuclear m6A reader YTHDC1 regulates mRNA splicing. Mol. Cell 61, 507–519. [DOI] [PubMed] [Google Scholar]
- Yang X, Downes M, Yu RT, Bookout AL, He W, Straume M, Mangelsdorf DJ, and Evans RM (2006). Nuclear receptor expression linksthe circadian clock to metabolism. Cell 126, 801–810. [DOI] [PubMed] [Google Scholar]
- Yin H, Wang H, Jiang W, Zhou Y, and Ai S (2017). Electrochemical immunosensor for N6-methyladenosine detection in human cell lines based on biotin-streptavidin system and silver-SiO2 signal amplification. Biosens. Bio-electron. 90, 494–500. [DOI] [PubMed] [Google Scholar]
- Zhao X, Yang Y, Sun B-F, Shi Y, Yang X, Xiao W, Hao YJ, Ping XL, Chen YS, Wang WJ, et al. (2014). FTO-dependent demethylation of N6-methyladenosine regulates mRNA splicing and is required for adipogenesis. Cell Res. 24, 1403–1419. [DOI] [PMC free article] [PubMed] [Google Scholar]
- Zheng G, Dahl JA, Niu Y, Fedorcsak P, Huang CM, Li CJ, Vågbø CB, Shi Y, Wang WL, Song SH, et al. (2013). ALKBH5 is a mammalian RNA demethylase that impacts RNA metabolism and mouse fertility. Mol. Cell 49, 18–29. [DOI] [PMC free article] [PubMed] [Google Scholar]
- Zhou J, Wan J, Gao X, Zhang X, Jaffrey SR, and Qian SB (2015). Dynamic m(6)A mRNA methylation directs translational control of heat shock response. Nature 526, 591–594. [DOI] [PMC free article] [PubMed] [Google Scholar]
Associated Data
This section collects any data citations, data availability statements, or supplementary materials included in this article.