Abstract
The gut microbiota is implicated in the metabolism of many medical drugs, with consequences for interpersonal variation in drug efficacy and toxicity. However, quantifying microbial contributions to drug metabolism is challenging, particularly in cases where host and microbiome perform the same metabolic transformation. We combined gut commensal genetics with gnotobiotics to measure brivudine drug metabolism across tissues in mice that vary in a single microbiome-encoded enzyme. Informed by these measurements, we built a pharmacokinetic model that quantitatively predicts microbiome contributions to systemic drug and metabolite exposure, as a function of bioavailability, host and microbial drug-metabolizing activity, drug and metabolite absorption, and intestinal transit kinetics. Clonazepam studies illustrate how this approach disentangles microbiome contributions to metabolism of drugs subject to multiple metabolic routes and transformations.
One Sentence Summary
Genetic manipulation of drug metabolism in human gut commensal bacteria resolves host and microbiome contributions to a shared metabolic process.
Main Text
Individuals can vary widely in drug response. Most drugs are delivered orally, and over 70% exhibit low solubility, low permeability, or both (1). These drugs likely encounter commensal microbes at densities exceeding 108 cells/mL in the small intestine and 1011 cells/mL in the large intestine (2). Gut microbes collectively encode 150-fold more genes than the human genome, including a rich repository of enzymes with the potential to metabolize drugs and hence influence their pharmacology. Cryptic microbial contributions to drug metabolism, in which host and microbiota produce the same metabolite, are particularly challenging to quantify (Fig. S1A). We used measurements of drug and metabolite levels, collected over time and across tissues from gnotobiotic mice carrying no microbiota, genetically manipulated gut commensals, or a complex microbial community, to build a pharmacokinetic model that quantitatively disentangles host and microbiome contributions to drug metabolism.
Brivudine metabolism by host and microbiota
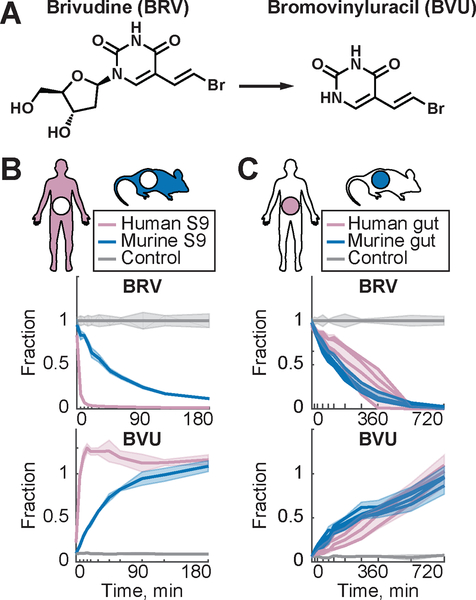
Brivudine (BRV) is an oral antiviral drug that is metabolized to bromovinyluracil (BVU) (Fig. 1A) by both host and microbiota. Indeed, incubation of human and murine S9 liver fractions and unfractionated fecal microbial communities with BRV leads to stoichiometric conversion to BVU, confirming that both liver and microbiota are capable of this enzymatic transformation (Fig. 1B–C, tables S1–S2). Next, we compared serum kinetics of BRV and BVU in conventional (CV) and germ-free (GF) mice following oral BRV administration. CV mice accumulated 5 times more BVU in serum than their genetically identical GF counterparts, without a corresponding decrease in serum BRV, suggesting an intestinal (microbial) contribution to serum BVU (Fig. 2A, tables S3–S7).
Fig. 1. BRV to BVU conversion in vitro by host and microbiome.
(A) Chemical structure of BRV and BVU. (B) Enzymatic conversion of BRV to BVU by human and murine S9 liver fractions. Shaded areas represent STD (n=5). (C) In vitro conversion of BRV to BVU by human and murine gut microbial communities. Lines and shading represent mean (n=4) and STD (n=16), respectively.
Fig. 2. BRV metabolism by GF and CV mice.
(A) BRV and BVU serum kinetics in CV and GF mice. (B) Intestinal BRV and BVU concentrations over time; each field represents the mean of five animals. (C) Cecal BRV and BVU concentrations in individual animals. (D) Total amount of BRV and BVU in cecum and feces. (E) Liver concentrations of BRV and BVU. (F) Liver thymine. For all mouse data: horizontal lines show the mean of five animals and times reflect hours after oral BRV administration. SI: duodenum, SII: jejunum, and SIII: ileum; * p ≤ 0.05, ** ≤ 0.01, *** ≤ 0.001 (t-test with FDR correction for multiple hypotheses testing).
To directly investigate microbial BVU generation in vivo, we quantified BRV and BVU concentrations along the intestinal tract over time (Fig. 2B). CV and GF mice exhibit similar BRV kinetics in the duodenum; by contrast, GF mice maintain significantly higher BRV levels further along the gastrointestinal tract and in feces. BVU levels exhibit the opposite pattern, with increased intestinal concentrations in CV mice as compared to GF controls (Fig. 2C). Since GF animals have a larger cecum than their CV counterparts, we compared the absolute amounts (rather than concentrations) of BRV and BVU in the large intestine. The quantity of BVU in the feces of CV mice is insufficient to account for the amount of intestinal BRV metabolized, consistent with absorption of microbiota-derived BVU from the intestine into circulation (Fig. 2D and S1B–C).
The increased concentration of serum BVU in CV as compared to GF mice is paralleled by increased BVU concentrations in the liver (Fig. 2E). BVU interferes with human pyrimidine metabolism by covalently binding to dihydropyrimidine dehydrogenase (DPD) in the liver, with lethal consequences for patients administered chemotherapeutic pyrimidine analogs such as 5-fluorouracil (5-FU) (3, 4). BRV-treated CV mice also accumulate more endogenous DPD substrates (e.g., thymine (4)) in the liver compared to their GF counterparts, illustrating the contribution of the microbiota to toxicity without 5-FU co-administration (Fig. 2F) (5).
Identification of brivudine-metabolizing gut bacteria and gene products
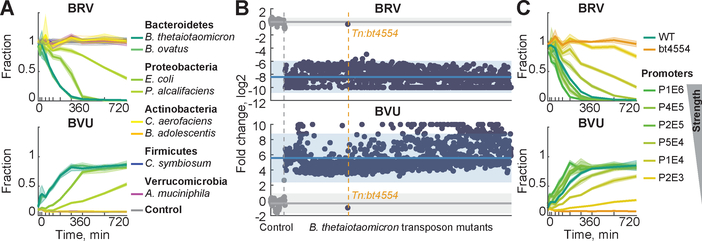
We next sought to directly quantify the contribution of microbial drug metabolism to serum drug and metabolite exposure by specifically modulating this activity in otherwise identical mice. To this end, we first determined the capacity of eight individual bacterial species, representing five major phyla that dominate the mammalian gut microbiota (6), to convert BRV to BVU (Fig. 3A and tables S8–S9). Of these species, Bacteroides thetaiotaomicron and B. ovatus possess the highest metabolic activity, consistent with previous reports that members of this genus can metabolize the structurally similar drug sorivudine (7). To identify BRV-metabolizing enzymes in Bacteroides, we condensed a mapped, arrayed library of B. thetaiotaomicron transposon mutants (8) to eliminate redundancy, resulting in 1290 strains that collectively disrupt expression of 2350 genes (~75% of predicted non-essential genes (8)) (fig. S2 and table S10). We tested each of these strains for the ability to convert BRV to BVU and identified a single mutant, carrying a transposon insertion in bt4554, that exhibits a loss of function phenotype (Fig. 3B). Targeted gene deletion, complementation at different expression levels, and enzyme assays with purified protein confirmed that bt4554, encoding a predicted purine nucleoside phosphorylase (9) that is also present in B. ovatus and conserved among Bacteroidetes (Tables S11–S12), is necessary and sufficient for BRV metabolism and that its expression is rate-limiting (Fig. 3C and S3).
Fig. 3. Identification of a microbiome-encoded enzyme responsible for BRV metabolism.
(A) BRV conversion to BVU by representative human gut isolates. (B) Log2 fold change of BRV and BVU concentrations of B. thetaiotaomicron transposon insertion mutants (blue, n = 1290) compared to media controls (grey, n = 83) after 24 h of incubation. Each point represents one strain, sorted along the x-axis in the same order in top (BRV) and bottom (BVU) panels. Mean fold changes and 95% prediction intervals for controls and strains are indicated by solid lines and shaded areas, respectively. (C) BRV conversion by B. thetaiotaomicron wildtype (n=4), bt4554 mutant (n=4), and complemented strains expressing bt4554 at different levels (n=8). In (A) and (C), lines and shaded areas depict the mean and STD of independent cultures (n=4–8).
Brivudine metabolism in mice that vary in a single microbiome-encoded enzyme
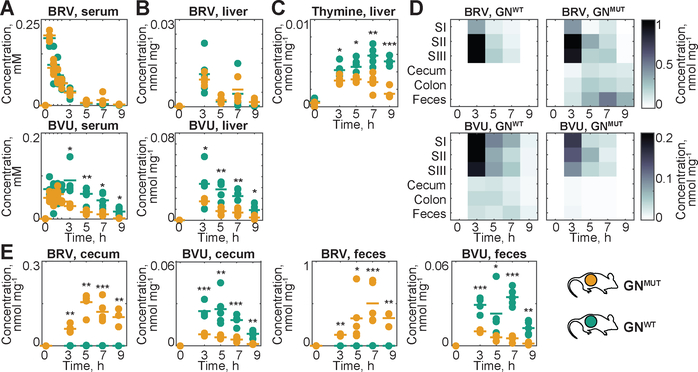
B. thetaiotaomicron wildtype and bt4554 mutant strains exhibit comparable growth rates in vitro and colonize GF mice at similar levels (Fig. S4A–B). Administration of BRV to gnotobiotic (GN) mice mono-colonized with WT (GNWT) or bt4554 mutant bacteria (GNMUT) results in indistinguishable BRV serum kinetics, consistent with the physiological similarity between these animals and further suggesting that microbial BRV metabolizing activity in the intestine does not influence BRV bioavailability or systemic elimination. By contrast, serum BVU exposure is significantly higher in GNWT as compared to GNMUT animals (AUC ratio=2.4, p<0.001, Fig. 4A, S5A and table S7). GNWT mice also exhibit increased BVU levels and thymine accumulation in the liver after BRV administration (Fig. 4B–C). As observed in comparisons between CV and GF animals, increased systemic BVU exposure in GNWT mice is paralleled by significant intestinal BRV metabolism (Fig. 4D and S5B). Because other aspects of host physiology, such as cecum size and intestinal transit time, are matched between GNWT and GNMUT animals, intestinal drug and metabolite concentrations can be directly compared and balanced. This reveals that wildtype B. thetaiotaomicron completely metabolizes cecal BRV, and the resulting BVU is almost entirely absorbed from both cecum and colon. By contrast, BRV is poorly absorbed from the lower intestine and GNMUT mice excrete the drug in feces (Fig. 4E).
Fig. 4. Gnotobiotic mouse model to quantify the microbial contribution to BRV pharmacokinetics and toxicity.
(A) Serum and (B) liver BRV and BVU kinetics in GNWT and GNMUT mice. (C) Liver thymine. (D) Intestinal BRV and BVU concentrations over time; each field represents the mean of five animals. (E) Cecal and fecal BRV and BVU concentrations in individual animals. For all mouse data: horizontal lines show mean of five animals and times reflect hours after oral BRV administration. SI: duodenum, SII: jejunum, and SIII: ileum; * p ≤ 0.05, ** ≤ 0.01, *** ≤ 0.001 (t-test with FDR correction for multiple hypotheses testing).
A physiologically-based pharmacokinetic model of host-microbiome drug metabolism
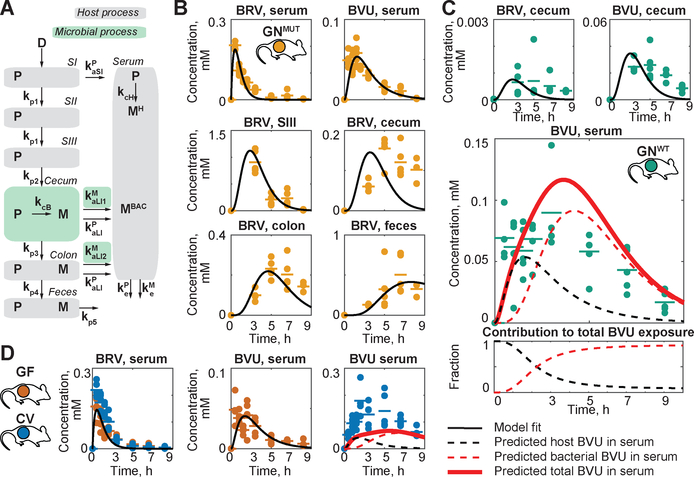
We next used these quantitative drug and metabolite measurements, collected in various compartments over time and in the presence and absence of microbial drug metabolism, to build a pharmacokinetic model (10) that quantifies the contribution of host and microbiota to systemic drug and metabolite exposure. To parameterize processes independent from microbial BRV metabolism (grey compartments in Fig. 5A), we used a global optimization procedure to fit measured BRV and BVU kinetics in serum and intestinal compartments of GNMUT mice. These processes include rates for i) BRV absorption from small and large intestine to blood (kaSIP and kaLIP); ii) BRV elimination (keP); iii) host BRV to BVU conversion (kcH); iv) BVU elimination (keM); and v) intestinal propagation/transit (kp1 to kp5) (Fig. 5B). To parameterize processes dependent on microbial BRV metabolism (green compartments in Fig. 5A), including bacterial BRV to BVU conversion (kcB) and BVU absorption rates from cecum and colon (kaLI1M and kaLI2M), we used measured BRV and BVU kinetics in cecum and colon (but not serum) of GNWT mice (Fig. 5C, S6A–B and table S13). The resulting model is robust (Fig. S6C) and accurately predicts BRV kinetics in serum of GNWT mice (PCC = 0.98). Further, the model predicts host and microbial contributions to serum BVU; the sum of these predicted contributions accurately matches total serum BVU measured in GNWT animals (PCC = 0.76) (Fig. 5C and table S14). Comparison of the area under the curve for estimates of host and microbial contributions to serum BVU reveals that microbial activity accounts for nearly all of the serum BVU measured at later timepoints, and 71% of total BVU exposure in serum of GNWT mice (Fig. 5C). To predict the microbial contribution to serum BVU in context of a complex microbiota, we next parameterized the model using drug and metabolite kinetics from gut and serum of GF mice (Fig. S7A), and gut of CV mice, to predict BVU serum exposure (Fig. 5D and S7B–C). Despite increased microbial complexity, the model accurately predicts serum BRV kinetics in these animals (PCC = 0.99); the sum of predicted host and microbial contributions to serum BVU matches the measured total serum BVU in CV mice (PCC = 0.78) (Fig. 5D and table S14).
Fig. 5. Physiology based model of host and microbial contribution to BRV and BVU pharmacokinetics.
(A) Schematic representation of compartments and sub-processes included in the model. (B) Parameterization of microbiota-independent processes using measurements from GNMUT mice. (C) Parameterization of microbiota-dependent intestinal drug metabolism and prediction of microbial and host contributions to serum BVU in GNWT and (D) CV mice.
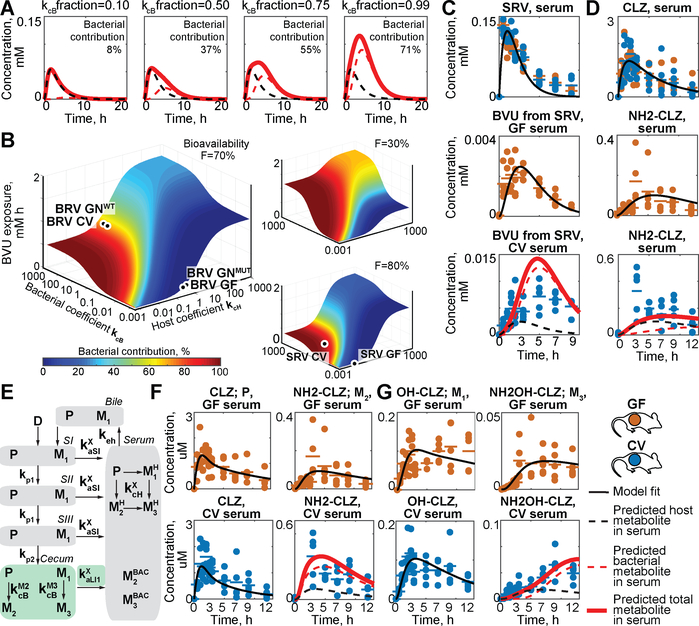
Global sensitivity analysis, which estimates the impact of varying each of the 13 rates included in the model on serum BVU exposure, reveals that the parameters that most effect host and microbial contributions to serum BVU are distinct and that overall serum exposure is dependent on both host and bacterial drug-metabolizing activity (Fig. S8). For example, simulating interpersonal differences in gut community composition or antibiotic exposure by changing bacterial drug conversion rate (kcB) reveals that the predicted microbiome contribution to serum BVU can vary from 0% to 71%, and that total systemic BVU exposure can vary more than three-fold, in response to this parameter (Fig. 6A). Multiple parameters can also be altered simultaneously to predict the pharmacokinetics of other drugs that are subject to different bioavailability, host- and microbiome-mediated drug metabolism, and drug/metabolite absorption. For example, simultaneous alteration of parameters for both host and microbiome-mediated drug metabolism produces a 3-dimensional surface that estimates total serum metabolite exposure and relative microbiome contribution as a function of both parameters; the model further reveals how bioavailability impacts these estimates (Fig. 6B, table S15, and movies S1–S2).
Fig 6. Simulation of the impact of chemical, microbial, and physiological parameters on pharmacokinetics and expansion of the approach to other drugs.
(A) Predicting the impact of microbial drug metabolism rate on microbial contribution to serum BVU. (B) Absolute metabolite exposure and relative bacterial contribution to serum BVU as a function of host and microbial drug metabolism rate at a given bioavailability (tables S24–25). (C) Prediction of host and microbial contribution to serum BVU after oral sorivudine (SRV) administration to CV mice. (D) Prediction of microbial and host contributions to serum clonazepam (CLZ; P) and aminoclonazepam (NH2-CLZ; M) in CV mice. (E) Schematic representation of an extended model that includes enterohepatic circulation and three drug metabolites (M1-M3). (F) Prediction of microbial contribution to serum exposure of CLZ (P) and NH2-CLZ (M2) and (G) OH-CLZ (M1) and NH2OH-CLZ (M3) in CV mice. Horizontal lines show mean of five animals and times reflect hours after oral drug administration. For detailed description of parameters see tables S13 and S21.
Generalization of the approach
We used two additional examples to test whether our approach can model the pharmacokinetics of other microbiome-metabolized drugs. In one example, we focused on sorivudine (SRV), which is structurally similar to BRV but is metabolized to BVU at different rates by both the host and the microbiome (Fig. S9). We orally administered SRV to CV and GF mice, measured drug and metabolite levels across tissues and over time as above, and provided serum drug and intestinal drug and metabolite measurements as inputs to the model for parametrization and prediction (Fig. S10). Predicted serum metabolite kinetics are an order of magnitude lower than BVU from BRV, which matches experimental measurements of serum BVU levels in SRV-treated mice (PCC = 0.86). The model also reveals the relative contribution of host and microbial SRV metabolizing activity to this exposure (Fig. 6C, S11, and table S14). These results demonstrate that the pharmacokinetic model can predict both levels and sources of metabolite exposure for a drug subject to subject to different host and microbiome drug metabolizing rates than BRV.
As a further example, we studied clonazepam (CLZ), an oral anticonvulsant and anti-anxiety drug that undergoes a complex metabolic pattern of oxidation, nitroreduction, glucuronidation and enterohepatic cycling (Fig. S12A) (11). Intestinal microbes have been shown to contribute to the reductive metabolism of CLZ and related drugs, which is associated with toxicity (12). Quantification of CLZ and CLZ metabolite serum kinetics after oral administration to GF and CV mice demonstrated that aminoclonazepam (NH2-CLZ) and aminohydroxyclonazepam (NH2OH-CLZ) are the major systemic metabolites in CV animals (Fig. S13–14 and tables S16–S20). First, we used gut and serum CLZ and NH2-CLZ measurements from GF mice, and gut measurements from CV mice, to parameterize the host-microbiome pharmacokinetic model, which predicted substantial microbial contribution to serum NH2-CLZ (Fig. 6D and S15). Second, we expanded the model topology to allow enterohepatic circulation of CLZ and re-parameterized the model, which predicted that the microbiome contributes 78% to systemic NH2-CLZ (PCC: 0.85 versus 0.56 without enterohepatic circulation) (Fig. 6E–F and S16). Third, we focused on NH2OH-CLZ, which is the product of both hydroxylation (solely performed by host enzymes; Fig. S12) and nitroreduction (performed by both microbial and host enzymes (11)). Hydroxyclonazepam (OH-CLZ) and glucuronidated OH-CLZ are also subject to biliary excretion into the intestinal tract, where microbes can further modify (deglucuronidate and reduce) them. Indeed, quantification of these two metabolites and NH2OH-CLZ in bile and intestinal compartments over time demonstrates biliary excretion and microbial deglucuronidation and reduction of OH-CLZ to NH2OH-CLZ in the distal gut (Fig. S13–14). To quantify the microbial contribution to systemic NH2OH-CLZ, we further expanded the model to include these additional metabolites, used GF and CV metabolite kinetics for parametrization as described, and predicted a microbial contribution of 66% (PCC: 0.93) to serum NH2OH-CLZ (Fig. 6E, G, S16–S18, and tables S21–22). The sum of predicted host and microbiome contributions match observed total metabolite levels in serum and urine (Fig. 6F–G, and S16–S18). Although comparisons between GF and CV animals cannot account for physiological effects of bacterial colonization as is possible in comparisons between gnotobiotic mice that vary in a single microbiome-encoded enzyme (e.g., Fig. 4 and 5B–C), these results illustrate the applicability of host-microbiome pharmacokinetic models to disentangle microbial and host contributions to metabolism of drugs that undergo complex and multi-step in vivo disposition.
Together, this study provides an experimental and computational strategy to disentangle host and microbial contributions to drug metabolism, even in cases when host and microbial activities are chemically indistinguishable. Quantitative understanding of these host and microbiome-encoded metabolic activities will further clarify how nutritional, environmental, genetic and galenic factors impact drug metabolism and could enable tailored intervention strategies to improve drug responses. This approach could be adapted for drugs converted to chemically distinct metabolites by the host and microbiome, and to other xenobiotics, food components and endogenous metabolites.
Methods Summary
Detailed materials and methods are provided as Supplemental Materials.
Chemicals
Brivudine, sorivudine, and 5,6-dihydrouracil were purchased from Santa Cruz Biotechnology, LC-MS grade solvents from Fisher Scientific, and all other chemicals from Sigma Aldrich, if not specified otherwise.
Bacterial Culture Conditions
General culture conditions
Escherichia coli S-17 λ pir strains (13) were grown at 37°C in LB medium supplemented with carbenicillin 50 μg/mL. B. thetaiotaomicron VPI-5482 (ATCC 29148) derived strains were grown anaerobically at 37°C in liquid TYG medium (14). All anaerobic culturing was performed on brain-heart-infusion (BHI; Becton Dickinson) agar supplemented with 10% horse blood (Quad Five Co.). Cultures of bacterial gut communities and isolates for drug degradation assays were grown in Gut Microbiota Medium (GMM) (15). For selection, gentamicin 200 μg/mL, erythromycin 25 μg/mL, and/or 5-fluoro-2-deoxy-uridine (FUdR) 200 μg/mL were added as indicated. A flexible anaerobic chamber (Coy Laboratory Products) containing 20% CO2, 10% H2, and 70% N2 was used for all anaerobic microbiology steps. Growth curves were performed as described in Supplementary Materials and Methods.
Construction of B. thetaiotaomicron Targeted Mutants
Strains and plasmids, and primers are listed in table S8 and table S23, respectively.
Gene deletion and complementation
B. thetaiotaomicron tdk is indistinguishable from its parent strain with respect to BRV to BVU conversion (fig. S3A). A counter-selectable allelic exchange procedure (16) was utilized to generate in-frame, unmarked deletions in a B. thetaiotaomicron VPI-5482 tdk background (wild type; WT). Experimental details of gene deletion and complementation are provided in Supplementary Materials and Methods.
Construction of Condensed Transposon Mutant Library
B. thetaiotaomicron mariner transposon insertion strains were selected from a previously reported library of 7155 B. thetaiotaomicron mutants, which had been clonally arrayed and mapped by Insertion Sequencing (INSeq) (8). Strain selection rationale and assay conditions are described in Supplementary Materials and Methods.
Enzyme Assays
Liver assays of conversion of BRV and SRV to BVU
Human and murine S9 liver fractions were purchased from Thermo Fisher Scientific (HMS9L and MSMCPL, respectively). Enzyme assays were performed as previously described for the deglycosylation of arabinosyluracil derivatives (17) as described in Supplementary Materials and Methods.
Cloning, purification and enzymatic assay of BT4554
BT4554 was purified as an epitope-tagged protein fusion and enzyme assays were performed using the conditions described for liver across a range of BRV concentrations as described in Supplementary Materials and Methods.
Bacterial BRV Conversion Assays
Bacterial community and axenic culture assays
All handling of human materials was conducted with the permission of the Yale Human Investigation Committee. Samples were collected and stored as previously described (15). Assay conditions for bacterial communities, individual species, and transposon mutants are described in Supplementary Materials and Methods.
Animal Experiments
All experiments using mice were performed using protocols approved by the Yale University Institutional Animal Care and Use Committee. Methods for conventional and gnotobiotic husbandry, colonization of gnotobiotic animals, drug administration, serum and tissue collection, and bioavailability studies are provided in Supplementary Materials and Methods.
Sample Preparations for Drug and Metabolite Analysis
Sample extraction
Sample preparation was performed as described previously (18). Experimental procedures for extraction of liquid and solid samples are provided in Supplementary Materials and Methods.
LC-MS Quantification of Drugs and Metabolites
LC-MS analysis
Chromatographic separation was performed on a C18 column and the qTOF (Agilent 6550) was operated in positive scanning mode as described in Supplementary Materials and Methods. Compounds were identified based on the retention time of chemical standards and their accurate mass (tolerance 20 ppm).
Data analysis
The MassHunter Quantitative Analysis Software (Agilent, version 7.0) was used for peak integration. Statistical analysis and plotting was performed in Matlab 2017b (MathWorks). LOQ determination, pharmacokinetic parameter estimation, and additional methods are provided in Supplementary Materials and Methods.
Pharmacokinetic Multi-Compartment Modeling
Model overview
The multi-compartment pharmacokinetic model of drug metabolism in the mouse contained 7 main compartments (small intestine I-III, cecum, colon, feces, and serum, Fig 5A). Two additional compartments (small_intestine_gi and small_intestine_serum) were used as reservoirs for the initial drug dose. The serum compartment incorporated processes occurring in the liver, kidneys and all other body parts apart from the gastrointestinal (GI) tract. Exposure to the drug was modelled as an input to the small_intestine_serum compartment of the initial amount of drug equal to D*F, where D is the provided dose, and F is the bioavailability coefficient, and input to the small_intestine_gi compartment of the initial amount of D*(1-F). Drug propagation through the body was driven by the flow of GI material in different GI tract sections and tissue:serum diffusion coefficients. Model parameters and equations are provided in table S13. All equations were defined for drug and metabolite amounts. For the parameter fitting, metabolite concentrations were converted into amounts using estimated compartment volumes provided in table S13. For drug metabolite levels in serum, the metabolite levels contributed by the host (due to host drug metabolism, MH) were distinguished from the metabolite levels contributed by the microbiota (due to microbial metabolism in the cecum and metabolite absorption, MBAC). The model was created using the MatLab 2017b SimBiology Toolbox (MathWorks).
Extended model overview
The multi-compartment pharmacokinetic model of drug metabolism described above was extended to incorporate enterohepatic circulation and two additional drug metabolism products. Enterohepatic circulation was modelled by adding a bile compartment, enterohepatic cycling coefficient keh (which determines the rate of compound diffusion from serum to bile and from bile to small intestine I), and compound-specific absorption coefficients from the small intestine (table S21).
Detailed methods for parameter fitting, serum metabolite exposure prediction, and sensitivity analysis are provided in Supplementary Materials and Methods.
Model simulation
To investigate the influence of bioavailability (F), host drug to metabolite conversion coefficient, and microbial drug to metabolite conversion coefficient on the total BVU serum exposure and relative microbial contribution to serum BVU, the sbiosimulate function was used to determine BRV model behavior across all combinations of the parameter values ranging from 0.01 to 0.99 for F with step 0.01, and 0.001 to 1000 in logarithmic scale with step 1 (power of 10) for the conversion coefficients. All other parameters were set to values estimated with GNMUT and GNWT data. For each model run, the area under the curve of BVU serum concentrations was calculated. The bacterial contribution was calculated as the ratio between microbial BVU absorbed from cecum to serum, and total BVU in the serum (movie S1 and S2 and table S15).
Supplementary Material
Acknowledgments
We thank the Goodman lab for helpful discussions and N.A. Barry, L. Valle and D. Lazo for technical assistance.
Funding: This work was supported by NIH grants GM118159, GM105456, AI124275, the Center for Microbiome Informatics and Therapeutics, the Burroughs Wellcome Fund, the Yale Cancer Center, and the HHMI Faculty and Pew Scholars Programs to A.L.G. M.Z. received an Early and Advanced Postdoc Mobility Fellowships from the Swiss National Science Foundation (P2EZP3_162256 and P300PA_177915, respectively) and a Long-Term Fellowship (ALTF 670-2016) from the European Molecular Biology Organization. M.Z.K. received an Early Postdoc Mobility Fellowship from the Swiss National Science Foundation (P2EZP3_178482).
Footnotes
Competing interests: The authors declare no competing interests. M.Z., M.Z.K. and A.L.G. have filed a patent application based on these studies with the U.S. Patent and Trademark Office (62/693,741).
Data and materials availability: All data are available in the manuscript or the supplementary materials. The MatLab modeling framework is available at https://github.com/mszimmermann/PBPK_host-microbiome_model under GPLv3 license and archived at Zenodo (27).
Supplementary Materials
Supplementary Materials and Methods
Figs S1–S18
Captions for Tables S1 to S26
Captions for Movies S1 to S2
Movies S1 to S2
Tables S1 to S26
References and Notes
- 1.Dahan A, Miller JM, Amidon GL, Prediction of solubility and permeability class membership: provisional BCS classification of the world’s top oral drugs. AAPS J. 11, 740–746 (2009). [DOI] [PMC free article] [PubMed] [Google Scholar]
- 2.Sender R, Fuchs S, Milo R, Revised Estimates for the Number of Human and Bacteria Cells in the Body. Plos Biol. 14, e1002533 (2016). [DOI] [PMC free article] [PubMed] [Google Scholar]
- 3.Nishiyama T et al. , Mechanism-Based Inactivation of Human Dihydropyrimidine Dehydrogenase by (E)-5-(2-Bromovinyl)uracil in the Presence of NADPH. Mol Pharmacol 57, 899–905 (2000). [PubMed] [Google Scholar]
- 4.Desgranges C et al. , Effect of (E)-5-(2-bromovinyl)uracil on the catabolism and antitumor activity of 5-fluorouracil in rats and leukemic mice. Cancer Res. 46, 1094–1101 (1986). [PubMed] [Google Scholar]
- 5.Van Kuilenburg AB et al. , Genotype and phenotype in patients with dihydropyrimidine dehydrogenase deficiency. Hum. Genet 104, 1–9 (1999). [DOI] [PubMed] [Google Scholar]
- 6.Human Microbiome Project Consortium, Structure, function and diversity of the healthy human microbiome. Nature. 486, 207–214 (2012). [DOI] [PMC free article] [PubMed] [Google Scholar]
- 7.Nakayama H et al. , Intestinal anaerobic bacteria hydrolyse sorivudine, producing the high blood concentration of 5-(E)-(2-bromovinyl)uracil that increases the level and toxicity of 5-fluorouracil. Pharmacogenetics and Genomics. 7, 35 (1997). [DOI] [PubMed] [Google Scholar]
- 8.Goodman AL et al. , Identifying genetic determinants needed to establish a human gut symbiont in its habitat. Cell Host Microbe. 6, 279–289 (2009). [DOI] [PMC free article] [PubMed] [Google Scholar]
- 9.Jensen KF, Nygaard P, Purine Nucleoside Phosphorylase from Escherichia coli and Salmonella typhimurium. FEBS J. 51, 253–265 (1975). [DOI] [PubMed] [Google Scholar]
- 10.Ferl GZ, Theil F-P, Wong H, Physiologically based pharmacokinetic models of small molecules and therapeutic antibodies: a mini-review on fundamental concepts and applications. Biopharm Drug Dispos. 37, 75–92 (2016). [DOI] [PubMed] [Google Scholar]
- 11.Elmer GW, Remmel RP, Role of the intestinal microflora in clonazepam metabolism in the rat. Xenobiotica. 14, 829–840 (1984). [DOI] [PubMed] [Google Scholar]
- 12.Takeno S, Sakai T, Involvement of the intestinal microflora in nitrazepam‐induced teratogenicity in rats and its relationship to nitroreduction. Teratology. 44, 209–214 (1991). [DOI] [PubMed] [Google Scholar]
- 13.Cowles CE, Nichols NN, Harwood CS, BenR, a XylS homologue, regulates three different pathways of aromatic acid degradation in Pseudomonas putida. The Journal of Bacteriology. 182, 6339–6346 (2000). [DOI] [PMC free article] [PubMed] [Google Scholar]
- 14.Holdeman LV, 1929, Moore WEC, Cato EP, Anaerobe laboratory manual (1977). [Google Scholar]
- 15.Goodman AL et al. , Extensive personal human gut microbiota culture collections characterized and manipulated in gnotobiotic mice. Proceedings of the National Academy of Sciences. 108, 6252–6257 (2011). [DOI] [PMC free article] [PubMed] [Google Scholar]
- 16.Koropatkin NM, Martens EC, Gordon JI, Smith TJ, Starch Catabolism by a Prominent Human Gut Symbiont Is Directed by the Recognition of Amylose Helices. Structure. 16, 1105–1115 (2008). [DOI] [PMC free article] [PubMed] [Google Scholar]
- 17.Machida H et al. , Deglycosylation of antiherpesviral 5-substituted arabinosyluracil derivatives by rat liver extract and enterobacteria cells. Biochemical Pharmacology. 49, 763–766 (1995). [DOI] [PubMed] [Google Scholar]
- 18.Lim B, Zimmermann M, Barry NA, Goodman AL, Engineered Regulatory Systems Modulate Gene Expression of Human Commensals in the Gut. Cell. 169, 547–558.e15 (2017). [DOI] [PMC free article] [PubMed] [Google Scholar]
- 19.Warrens AN, Jones MD, Lechler RI, Splicing by overlap extension by PCR using asymmetric amplification: an improved technique for the generation of hybrid proteins of immunological interest. Gene. 186, 29–35 (1997). [DOI] [PubMed] [Google Scholar]
- 20.Degnan PH, Barry NA, Mok KC, Taga ME, Goodman AL, Human gut microbes use multiple transporters to distinguish vitamin B₁₂ analogs and compete in the gut. Cell Host Microbe. 15, 47–57 (2014). [DOI] [PMC free article] [PubMed] [Google Scholar]
- 21.Whitaker WR, Shepherd ES, Sonnenburg JL, Tunable Expression Tools Enable Single-Cell Strain Distinction in the Gut Microbiome. Cell. 169, 538–546.e12 (2017). [DOI] [PMC free article] [PubMed] [Google Scholar]
- 22.Westover BP, Buhler JD, Sonnenburg JL, Gordon JI, Operon prediction without a training set. Bioinformatics. 21, 880–888 (2005). [DOI] [PubMed] [Google Scholar]
- 23.Wilkins MR et al. , Protein identification and analysis tools in the ExPASy server. Methods Mol Biol. 112, 531–552 (1999). [DOI] [PubMed] [Google Scholar]
- 24.Okuda H, Ogura K, Kato A, Takubo H, Watabe T, A possible mechanism of eighteen patient deaths caused by interactions of sorivudine, a new antiviral drug, with oral 5-fluorouracil prodrugs. J Pharmacol Exp Ther. 287, 791–799 (1998). [PubMed] [Google Scholar]
- 25.Sullivan FM, McElhatton PR, A comparison of the teratogenic activity of the antiepileptic drugs carbamazepine, clonazepam, ethosuximide, phenobarbital, phenytoin, and primidone in mice. Toxicol. Appl. Pharmacol. 40, 365–378 (1977). [DOI] [PubMed] [Google Scholar]
- 26.Wattam AR et al. , Improvements to PATRIC, the all-bacterial Bioinformatics Database and Analysis Resource Center. Nucleic Acids Res. 45, D535–D542 (2017). [DOI] [PMC free article] [PubMed] [Google Scholar]
- 27.MatLab modeling framework archived at Zenodo. 10.5281/zenodo.2359598 [DOI]
Associated Data
This section collects any data citations, data availability statements, or supplementary materials included in this article.


