Abstract
In Mendelian randomization (MR), inference about causal relationship between a phenotype of interest and a response or disease outcome can be obtained by constructing instrumental variables from genetic variants. However, MR inference requires three assumptions, one of which is that the genetic variants only influence the outcome through phenotype of interest. Pleiotropy, that is, the situation in which some genetic variants affect more than one phenotype, can invalidate these genetic variants for use as instrumental variables; thus a naive analysis will give biased estimates of the causal relation. Here, we present new methods (constrained instrumental variable [CIV] methods) to construct valid instrumental variables and perform adjusted causal effect estimation when pleiotropy exists and when the pleiotropic phenotypes are available. We demonstrate that a smoothed version of CIV performs approximate selection of genetic variants that are valid instruments, and provides unbiased estimates of the causal effects. We provide details on a number of existing methods, together with a comparison of their performance in a large series of simulations. CIV performs robustly across different pleiotropic violations of the MR assumptions. We also analyzed the data from the Alzheimer’s disease (AD) neuroimaging initiative (ADNI; Mueller et al., 2005. Alzheimer's Dementia, 11(1), 55–66) to disentangle causal relationships of several biomarkers with AD progression.
Keywords: instrumental variables, Mendelian randomization, pleiotropy, smoothed algorithm
1. INTRODUCTION
Mendelian randomization (MR) is a popular epidemiological study design that incorporates genetic information (G) as an instrument to estimate the causal effect of a modifiable exposure (X) on a disease (Y; Figure 1). From a statistical perspective, MR is an application of instrumental variable methods (Didelez & Sheehan, 2007; Lawlor, Harbord, Sterne, Timpson, & Davey Smith, 2008; Smith & Ebrahim, 2003; Wehby, Ohsfeldt, & Murray, 2008) to eliminate bias from unmeasured confounding factors (U). Assuming a structural model set‐up, the following conditions are necessary for G to be a valid instrument: (A1) G and X are not independent; (A2) G and Y are conditionally independent given exposure X and unmeasured confounding factors U; (A3) G and confounders U are independent. MR is complicated by the possible violation of these assumptions; perhaps one of the most important cases is the possible presence of pleiotropy. Pleiotropy occurs when more than one phenotype is influenced by the same group of genotypes. If these phenotypes are found on the causal pathway for the response Y, then pleiotropy is a violation of assumption (A2). However, it is possible to accommodate pleiotropy within an extension of the original causal framework that includes one or more additional phenotypes (Z; Figure 2).
Figure 1.
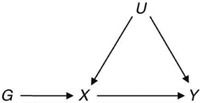
A directed acyclic graph representing a situation where Mendelian randomization using genetic variants G as instruments can be useful for inferring whether a phenotype X is causally related to an outcome Y. U represents unmeasured confounding factors
Figure 2.
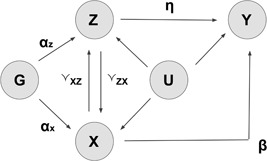
A general diagram representing potential pleiotropic influences in Mendelian randomization studies. αx, αz: genetic association parameters between X~G and Z~G; β: causal effect of interest (X on Y); γxz and γzx: possible direct causal effects of X on Z and Z on X, respectively; η: the pleiotropic pathways of Z on Y; G: genotypes; X: phenotype of exposure; Y: response of interest; Z: potential pleiotropic phenotypes
In econometric research, a framework like Figure 2 has been discussed to account for multiple risk factors simultaneously (Angrist, 2006; Ludwig & Kling, 2007; Wooldridge, 2015). However, in genetic studies the extraction of causal effects for individual risk factors with pleiotropic phenotypes is rarely discussed (Burgess & Thompson, 2015; Kang, Zhang, Cai, & Small, 2016). Instead, most of the recent MR studies are conducted using the two‐stage least squares (2SLS) estimator approach (Baum, Schaffer, & Stillman, 2003). Specifically, a prediction of X is constructed from the ordinary least square (OLS) regression X∼G and called . Then the OLS regression is fit and the slope is proposed as the causal effect estimator.
When there are exogenous variables, they can be included as covariates. Hence a potential extension of 2SLS to accommodate pleiotropy is to control for Z as covariates. This, however, is unsatisfactory. It would be ideal to identify instruments, G, for X that are unrelated to Z to estimate the causal effect of X on Y in the absence of pleiotropic effects. However, adjusting for covariates, Z, will enable construction of an instrument for X|Z, which is not answering the same question. Furthermore, controlling for Z can induce collider bias (Cole et al., 2009; Greenland, 2003). It is worth noting that adjusting for Z as covariates in 2SLS is equivalent to estimating the causal effect on measures that have been residualized for Z. That is, to work with (G ∗, X ∗, Y ∗), where G ∗, X ∗, and Y ∗ are defined as G ∗ = (I − Pz)G, X ∗ = (I − Pz)X, and Y ∗ = (I − Pz)Y, where Pz = ZT(ZTZ)−1Z (Lovell, 2008; Wang & Zivot, 1998). More details can be found in Appendix A.
A second approach to coping with pleiotropy is based on the multiple linear regression of Y on X and Z jointly. However, if X and Z are highly correlated, the resulting estimator of β could be unstable, that is, the standard errors could be large (Farrar & Glauber, 1967; Grapentine, 2000; Grewal, Cote, & Baumgartner, 2004). Collider bias is also a concern here.
In a third approach, Some Invalid Some Valid Instrument Variable Estimator (sisVIVE; Kang et al., 2016), pleiotropy is treated as unobservable and G is modeled as a mixture of “valid” and “invalid” instruments, with an L 1 penalized regression to infer the causal effect of X on Y. This approach is not guaranteed to eliminate pleiotropy: indeed, the sisVIVE estimator would be biased when more than 50% of genotypes are pleiotropic. Moreover, if the α x are much stronger than α z (Figure 2) then sisVIVE may have difficulty identifying the pleiotropic genotypes, which would give biased causal effect estimates.
A variety of additional approaches to coping with pleiotropy can be found in the literature, for example, direct genotype selection, generalized methods of moments (GMM), Egger regression, and so forth. However, there has been limited recent work on solutions for inference when potential pleiotropic phenotypes are observed.
In this paper we present a novel approach to dealing with pleiotropy, based on the general framework of Figure 2: The idea is to construct a new instrumental variable by maximizing the association with X (i.e., instrumental strength) and minimizing possible correlation with potential pleiotropic phenotypes Z. There are three innovative aspects in this method: (a) the pleiotropic effect is eliminated by shrinking the correlation with potential pleiotropic phenotypes toward zero; (b) the instrumental strength is retained coherently in the model; (c) our penalization algorithm forces approximately sparse and valid genotype selection, which reduces the overfitting problem resulting from the use of multiple genotypes, especially when the number of genotypes is larger than the number of samples where most existing IV methods fail.
After introducing notation and outlining a formal framework for pleiotropy that also accommodates existing research (Section 2), we devote Section 3 to the presentation of our novel idea: constrained instrumental variable (CIV). A computationally feasible method, CIV_smooth, is then introduced to implement instrument construction and causal effect estimation. In Section 4 we compare by simulation the performance of our methods with the closest popular approaches, including variants of 2SLS approach, sisVIVE and Allele scores. In Section 5 we conduct an MR study estimating the effects of four biomarkers (amyloid β [Aβ] 1–42, total tau protein [Ttau], phosphorylated tau protein [Ptau], and fluoro‐D‐glucose uptake [FDG_SUVR]) on Alzheimer’s disease (AD) risk using our methods.
2. NOTATION AND BACKGROUND
2.1. Notation
For each individual, i = 1, …n, let Y i denote the response of interest, and Y = (Y 1, …,Y n)T ∈ R n × 1 the vector of observations. Let G i ∈ R p represent the set of genotypes, where p is the number of single nucleotide polymorphisms (SNPs) being analyzed, and G = (G 1, …, G n)T ∈ R n × p the matrix of observations. Also, we denote by Z i ∈ R k the vector of additional phenotypes that may be affected by some elements of G i, and by Z = (Z 1 , …, Z n)T ∈ R n × k the matrix of these observations. Finally, let X = (X 1 , …, X n)T ∈ R n × 1 denote the vector of the phenotype of interest.
Figure 2 lays out a general structure for our explorations. We assume that genotype G, phenotype of interest X, the response Y, and potential pleiotropic phenotypes Z have all been measured for each individual. The total causal effect of X on Y is the sum of the direct causal effect represented by the scalar parameter β, and any indirect causal effects. The latter is a product of the causal effect of X on Z, represented by γ xz, and the direct causal effect of Z on Y, represented by η. Pleiotropy is present when the association between G and Z, represented by the parameter α z, is nonzero. In this case, as previously mentioned, conditioning on Z may induce collider bias. The methods discussed below attempt to address this issue.
The genetic variants in G are strong instruments for X if the association between G and X, represented by α x, is strong. Note that G may contain many genetic variants and only some of them may influence Z. The relationships between phenotype of interest X, potential pleiotropic phenotypes Z, unmeasured confounders U, and outcomes Y may vary from one situation to another, that is, not all of the edges or arrows in Figure 2 need to be present in every particular study or scenario.
The relationships in Figure 2 can be formally expressed in the following linear structural equations:
| (1a) |
| (1b) |
| (1c) |
Or
| (2a) |
| (2b) |
| (2c) |
The parameters ζ x, ζ z, and ζ y represent the impact of unmeasured confounding factors U on X, Z, and Y, respectively. The errors ε x, ε z, and ε y for X, Z and Y, respectively, are assumed to be independent and identically distributed.
Each of the following assumptions for the relationship between X and Z represents an interesting scenario.
-
(i)
X and Z are conditionally independent given G and U (γ zx = γ x z = 0), that is the simplest case of pleiotropy.
-
(ii)
There is a direct causal impact of Z on X (γ zx ≠ 0 and γ xz = 0).
-
(iii)
There is a direct causal impact of X on Z (γ xz ≠ 0 and γ zx = 0). In this case, the total causal effect of X on Y is β + γ xz η. Although this is an important scenario, we do not address it in this paper, since we are focusing on the estimation of β.
Assuming that the set G may be quite large, containing many genetic variants in association with X, using all elements of G in the analysis may introduce bias in the estimation of β: Indeed some components of G may affect Z, so that the total causal effect from G to Y is mediated by both X and Z. In MR applications, those components of G which do have an impact on Z are usually eliminated, possibly causing other types of bias (e.g., weak instrument bias, Burgess, Thompson, & Collaboration, 2011; selection bias, Smith & Ebrahim, 2003; etc.).
Our goal is to determine the best MR estimator of β when possibly pleiotropic variables Z are measured and available and when the set G contains several variants. We are searching for the best approach to remove bias in the estimation of β.
2.2. Two‐stage least squares
The simplest MR method is 2SLS regression. Given valid instruments G, the following two stages define a 2SLS model:
-
1.
In the first stage, a new variable is obtained from the fitted values from OLS regression X∼G.
-
2.
In the second stage, the OLS estimates of β from the regression Y∼ are obtained.
2SLS works well if G is a set of valid instruments with α z = 0. This rarely occurs naturally, but can sometimes be achieved by carefully selecting a subset of variants G that are approximately valid. Most researchers using MR make intensive efforts to select instruments G that are most likely to satisfy the three key assumptions (A1–A3) of MR. Variants known to be in pleiotropic pathways, or variants showing associations with possibly pleiotropic phenotypes, are removed from the set of variants to be considered. However, this selection process is necessarily ad hoc. In this paper, we refer to the original 2SLS as “2SLS_naive.”
A variation of the 2SLS approach—the Allele score method Burgess and Thompson (2013) constructs summarized genetic scores G ∗ = Gw. The weights w correspond to estimated genetic effect sizes for each genotype, and can be derived internally from data under analysis or externally from prior knowledge. Protection against winner’s curse can be incorporated into the estimation of w through internal cross‐validation or external sources for the estimates of genetic associations.
2.3. Statistical methods for selection of valid instruments
Several methods have been proposed for improving causal estimation in the presence of pleiotropy, for example, Egger regression (Bowden, Smith, & Burgess, 2015), CUE (Davies et al., 2015), LIML (Hansen, Heaton, & Yaron, 1996), Allele score (Burgess & Thompson, 2013); these methods generally assume that the pleiotropic phenotypes are unknown, and use all the components of G.
In the same vein, Kang et al. (2016) proposed to select components of G, again without explicitly using the phenotypes Z. The proposed approach, named by the authors as “some invalid some valid IV estimator (sisVIVE),” incorporates all causal effects from G to Y using the following model:
| (3a) |
| (3b) |
| (3c) |
where δ represents the direct effects of the instruments G on outcome Y. Indirect effects of G on Y are captured through X, and β represents the causal effect parameter of interest. α is the association parameter between G and X. The central idea of Kang et al. (2016) is to operate a sparse selection of genetic variants (components of G) by a LASSO type penalization, which leads to the constrained optimization problem:
where P G = G(G T G)−1 G T. In other words, the projected error of predicting Y from G and X is minimized, while controlling the impact of invalid instruments in G on Y (through the penalty term). It has been shown that, under certain conditions, sisVIVE is robust to certain types of invalid instruments, for example, pleiotropic genotypes and their direct causal effect on Y (without going through X).
2.4. Adjustment for exogenous or endogenous variables
In MR terminology, the term “endogenous variable” describes factors that are explained by the genotype–phenotype relationships and impact response Y. For example, common endogenous variables include health‐related behaviors and risk‐related phenotypes. Both X and Z in Figure 2 are endogenous as they are determined by genotypes and have impact on the response, albeit with different functions. Endogenous variables are the variables of primary concern for MR studies.
In contrast, covariates such as age and sex that are not associated with the genotype–phenotype causal pathways of interest are termed “exogenous”; normally it is possible to adjust for these variables in a straightforward way. One solution is to replace G, X, Y by G ∗ = (I − P z)G and X ∗, Y ∗, respectively, where P z = Z T(Z T Z)−1 Z. Then straightforward 2SLS can be applied to the new (G ∗, X ∗, Y ∗); we refer to this method as “2SLS_exo.” It is worth noting that this method is equivalent to controlling for Z as covariates in both first stage and second stage regressions. Details are given in Appendix A.
Although this has sometimes been implemented with pleiotropic phenotypes, this is not an appropriate approach: the estimate of β remains biased, as pleiotropic variables, Z, are not exogenous (Engle, Hendry, & Richard 1983). Note, if α z ≠ 0, treatment of Z as an exogenous variable may introduce collider bias due to dependence between G and u after conditioning on Z.
Another multiple regression‐type approach, this time to account for endogenous variables, can be derived from the underlying linear structural model (Figure 2) by building a multiple linear regression of Y on and jointly in a 2SLS model, where and are the predicted phenotypes using G as the instruments. We refer to this method as “2SLS_mul.” The 2SLS_mul method uses G to account for endogeneity of Z, without controlling for it explicitly. However, using this approach, the resulting estimator of β will be unstable if X and Z are highly correlated (Farrar & Glauber, 1967; Grapentine, 2000; Graham, 2003; Grewal et al., 2004).
Both of these two multiple regression solutions for secondary phenotype variables can be embedded within the Allele score method to adjust for Z variables, and we refer to these methods as “Allele_mul” and “Allele_exo.” The original sisVIVE approach assumes all pleiotropic phenotypes are unmeasured and treats them as sources of the indirect causal effect of G on Y, and thus does not use Z variables directly. If measures of secondary phenotypes are available, Kang et al. (2016) suggested adjusting (G, X, Y) a priori on Z (as in 2SLS_exo), thus treating Z measures as exogenous variables. We refer to this method as “sisVIVE_exo.”
2.5. Design choices: One sample, a first sample with and without an external validation sample, or two sample
In the causal inference literature, the term “one‐sample analysis” refers to the situation in which a single data set (a sample) is used to perform a data analysis task, typically the estimation of the parameters in a model. Unless the sample size is enormous, a one‐sample analysis is often considered flawed due to the problem of overfitting; see Thaler’s work on “winner’s curse” (Thaler, 1988). Using sample splitting techniques—that is cross‐validation or splitting the sample into a “learning sample” and a “testing or validation” sample (James, Witten, Hastie, & Tibshirani, 2013) will alleviate the problem, though not remove it. Obtaining an external validation sample, that is, a second sample from an external source with exactly the same variables as the original one, has been argued to be a better approach to reduce overfitting bias and increase generalizability (Friedman, Hastie, & Tibshirani, 2001).
In the framework of this paper, the model presented in Figure 2 has the parameters of interest α x and β. In Table 1 we distinguish different study designs that could be used with pleiotropic phenotypes Z. In the one sample setup (first row in Table 1) the data includes variables G, X, Z, and Y. An external validation sample, if available, must also contain G, X, Z, and Y (second row of Table 1). We will refer to this situation as “one sample analysis with external validation,” to distinguish it from both the “one sample” and the “two‐sample” setups. Note that we consider one‐sample designs with internal splitting as a one‐sample situation.
Table 1.
A comparison of study designs considered here
| Study design | Number of samples | Variables required |
|---|---|---|
| One sample analysis | One | (X, Z, Y, G) on 1 data set. |
| One sample analysis with external validation sample | Two: (1) learning and (2) validation | (X, Z, Y, G) on both data set 1 and data set 2. |
| Two‐sample analysis in Mendelian randomization | Two: (1) Learning weights and (2) learning causal effects | (X, Z, G) on data set 1. (G, Y) on data set 2. |
Indeed in the causal inference literature, the “two‐sample” setup is a design in which two studies are performed for two distinct analytic tasks. Specifically, in one study given G and X, α x is estimated; and in the other study given G and Y (or G, X, and Y), β is estimated. One advantage to this approach is that large datasets (Study 1) may be available to estimate the instrument strengths even though Y was not measured. Another advantage is that such separation of the data protects against overfitting. If valid instruments are constructed using the data set with G and X, the corresponding causal effect estimates from the second sample should be less subject to the overfitting bias.
Although all methods discussed in this paper work for the one‐sample set‐up, not all of these methods can be adapted to the one sample analysis with external validation or the two‐sample set‐up. The ordinary 2SLS method adapts easily to a two‐sample set‐up (Angrist & Krueger, 1992; Dee & Evans, 2003). However, this adaptation does not improve asymptotic efficiency (Inoue & Solon, 2010). When there are additional phenotypes (Z) to be considered, neither 2SLS_exo nor 2SLS_mul can be adapted to one sample with external validation set‐up or the two‐sample set‐up because they both require one‐sample individual level data to calculate the appropriate residuals. In contrast, methods that propose valid instrument construction using Y include sisVIVE, and its variants (sisVIVE_exo and sisVIVE_mul) can be extended to one sample analysis with external validation. Specifically, the valid instrument selection is obtained from the original sample, and is used to infer the causal effect β on the external validation sample. Furthermore, the Allele method and its variants adjusting for exogenous variables (Allele_exo and Allele_mul) extend to the two‐sample situation as the Allele weights only depend on G, X (and Z).
3. CONSTRAINED INSTRUMENTAL VARIABLE (CIV) METHODS
Let us consider the situation where potentially pleiotropic phenotypes (Z) are measured and available. We propose here a novel approach that we call “CIV”. The central idea is to maximize instrument strength, whereas attempting to control the impact of pleiotropic effects. In what follows we will consider two cases separately. In Section 3.1, we show that in the particular case p < n, a new instrumental variable can be obtained as a solution of an unpenalized maximization problem. In Section 3.2, we show that the addition of an appropriate penalty term to the aforementioned maximization problem leads to workable solutions with no restriction on p.
3.1. CIV_naive: CIV when p < n
We are looking for a linear combination of the genotype data such that the resulting instrument strength is maximized, and the association between new instruments and pleiotropic phenotypes Z is zero. In mathematical terms we aim to find a vector c ∈ R p which solves the following optimization problem:
| (4) |
subject to conditions:
| (5a) |
| (5b) |
Note that Equation (5a) is a normalizing condition which ensures the unicity of the solution (the norm of the projection c on G is constrained to be 1).
This maximization problem is well‐defined when p < n and p ≥ k (where k is the number of possibly pleiotropic phenotypes), and can be solved using simple linear algebra (see Appendix B). Let be the solution to the constrained optimization problem above. We will refer to as the CIV_naive instruments.
The strength of the CIV_naive instruments can be measured by the F‐statistic of linear model X∼G against the null hypothesis that the excluded instruments are irrelevant. As a rule of thumb, instrumental variables with F‐statistics < 10 are usually considered weak instruments. CIV_naive is designed to retain instrument strength, however, it may not always yield the strongest possible global F‐statistic due to constraint (5b; Boyd & Vandenberghe, 2004; Tofallis, 1999).
In a one‐sample analysis, the new instrumental variable Gc is used to infer the causal effect of X on Y using methods from linear structural equation modeling such as 2SLS. Furthermore, the CIV_naive approach translates naturally to two‐sample analyses. The linear vector c is estimated in the first‐stage data set, and the estimate is used in the second‐stage data set to create the new instrumental variable and to estimate the causal effect β.
3.2. A penalized maximization: CIV_smooth
The existence of a unique solution for the optimization problem when p < n (see Section 3.1 and Appendix B) is a definite asset of CIV_naive. In contrast, an important concern is that when p > n, solutions may not exist. Another concern is that, regardless of whether or not p < n, a reduction in the number of components may be desirable to avoid overfitting and to provide insight into the causal impact of SNPs. To address these two concerns, we propose an improvement of CIV_naive which guarantees existence (though not uniqueness) of solutions and allows for variable selection. This is achieved by imposing a penalty on the optimization problem (4). We will call the proposed method CIV_smooth.
Different choices of penalty functions lead to different solutions. However, in this context, neither L 1 nor L 2 penalties will result in a sparse solution under any level of regularization, because of the linear constraint (3c). Figure 3 illustrates this for two instruments G = (g 1, g 2); the L 1 and L 2 penalty contours intersect the linear constraint at nonsparse solutions for c.
Figure 3.
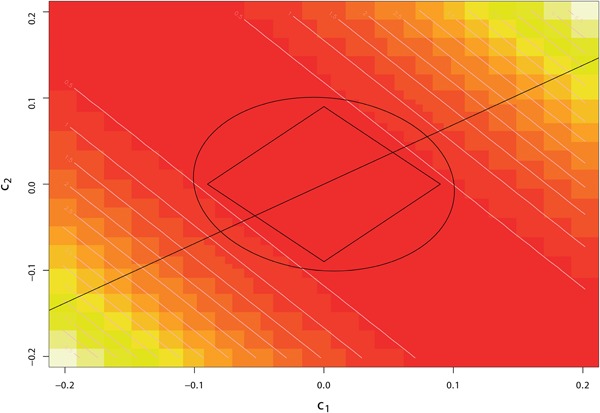
Graph demonstrating the maximization problem with LASSO (L1) penalty and L2 penalty. Rectangle: LASSO penalty contour with the same level of penalization. Circle: L2 penalty contour with the same level of penalization. Straight line: the solution space required by condition (5b); it has zero probability of intersecting a sparse solution here. Pixels with color from yellow to red: co‐ordinates of C = (c1, c2) with absolute correlation values from high to low levels
Therefore, we propose instead to use a L 0 penalty, and to maximize the constrained function
| (6) |
subject to conditions:
| (7a) |
| (7b) |
where |c|0 is the L 0 norm of c and λ is the regularization parameter. The problem described by (4a)–(4c) is equivalent to maximizing a convex function over a convex set. However, even for moderate values of p, it is computationally impractical to exhaustively enumerate all possible sets of |c|0; this problem with the L 0 norm has been proven to be NP‐hard (Natarajan, 1995). Therefore, instead we consider smoothed L 0 penalties: , for σ going to 0. In the limit, , thereby the problem (4) can be approximated by
| (8) |
subject to conditions (7a) and (7b). Equation (8) is solved for a decreasing sequence of (σ → 0) and a given value of λ, resulting in approximately sparse solutions (see Appendix C). Unfortunately there are no theoretical guarantees for the uniqueness of such numerical solutions. Often there are multiple solutions; however, when this occurs the corresponding values of the objective function (8) are usually very similar. See Appendix D for details of the solutions.
Higher values of λ (stronger penalization) lead to somewhat sparser solutions. In practice λ is chosen by K‐fold cross‐validation to minimize the projected prediction error (Kang et al., 2016) ||P G ∗(Y − X β ∗)||, where P G ∗ = G ∗T(G ∗T G ∗)−1 G ∗ is the projector onto the columns of the genetic matrix G ∗ = G given multiple solutions . In the ideal case in which all the components of G ∗ are valid instruments (which implies the absence of pleiotropy), the regression residual Y − X β ∗ is orthogonal to the columns of G ∗: P G ∗(Y − X β ∗) = 0. Notice that this orthogonality condition ensures valid solutions for constrained instrument weights, but not necessarily minimal prediction errors. More discussion about this choice of using projected prediction error as criteria for selecting the regularization parameter λ can be found in Appendix E.
The estimate of the exposure’s causal effect, β, is then obtained using approximately valid instruments G ∗. For example, in the 2SLS, the estimator of the causal effect is given by:
Although asymptotic variance estimates are available for standard 2SLS estimates, they are not available for the CIV methods. Indeed, the new instruments G ∗ depend on all observations of X and Z, so that and are not independent for i ≠ j. As a consequence, this weak law of large numbers cannot be invoked, and the convergence of to E | | is not assured. Instead, bootstrap estimates of the sample variance of can be obtained.
CIV_naive can be extended to two‐sample causal effect estimation. The weight c can be estimated on the first sample, and then applied to the second sample for causal effect estimation. In contrast, CIV_smooth can benefit from an external validation sample where (G, X, and Y) are all available in two data sets. These adaptations to more general study designs are included in our simulations below.
In this paper, MR analyses were restricted to the case of a single risk factor X, although most of the mentioned methods can be extended in some way to allow for a multivariate X. For CIV_naïve and CIV_smooth, we demonstrated how to account for multivariate X in Appendices B and C, respectively. The corresponding multiple solutions can be used with multivariate 2SLS to infer the causal effect of X on Y.
In summary, CIV_naive and CIV_smooth are formulated as optimization problems, which ensures that the resulting instrument G ∗ is strong and valid for estimating the causal effect of X on Y. However, in the construction algorithm for CIV_smooth, we cannot prove convergence to a unique solution for weight c, nor can we establish an analytical form for the variance of c and the estimate of β. In contrast, the most traditional benchmark in MR literature, 2SLS, although always producing consistent estimates for β with an asymptotic formula for its variance, is not designed to produce strong and valid instruments. This validity concern is addressed in both the Allele score method and in sisVIVE, which can both be seen as natural competitors of our approach. Therefore, we designed and carried out a simulation study to compare CIV_naive and CIV_smooth with Allele_score and sisVIVE methods as well as the benchmark 2SLS. These methods are available as an R package, CIVMR, at https://github.com/GreenwoodLab.
4. SIMULATION
The purpose of this simulation study is to assess the performance of our novel approach and of the three most popular methods over a broad variety of scenarios that mimic what we would expect to find in genetic studies. Two scenarios of pleiotropy were simulated in two series of simulations. Also, the association parameters α X and α Z were varied to study the impact of instrument strength on performance. Both one‐sample and two‐sample/validation sample set‐up were simulated in each of the two scenarios.
4.1. Simulation design
With reference to Figure 2, we capture possible violations of the MR assumptions by varying the parameters α z, α x, γ xz, and γ zx, while keeping η and β fixed, as well as the association of the unknown confounder U with X, Z, and Y. For a given set of conditions corresponding to a violation of the MR assumptions, we simulated a set of independent genotypes G, exposures X, pleiotropic phenotypes Z, an unknown confounder U, and outcome Y. We have implemented two series of simulations corresponding to the following scenarios:
Series I. Standard pleiotropy: The pleiotropic phenotype Z is not directly associated with X (γ xz = γ zx = 0 in Figure 2).
Series II. Z → X: Direct causal pathway from Z to X and G to Z (γ zx ≠ 0 and γ xz = 0 in Figure 2).
Table 2 summarizes the general design of the simulations. Notice that the following elements are the same in the two series: n, the number of observations; p, the total number of SNPs (components of G); and MAF, the minor allele frequency of each SNP. In contrast, the following parameters vary in both series: p z, the number of SNPs that have direct causal impact on Z (two values); α x, the association parameter between G and X (two values); α z, the association parameter between G and Z (two values). In total there are 2 × 2 × 2 = 8 combinations of parameters. Finally, (γ xz, γ zx) were set to (0, 0) in Series I and (0, 0.1) in Series II.
Table 2.
The parameter settings used in the two series of simulations
| Simulation | n | β | η | p | pz | MAF | (αx, αz) | γxz | γzx |
|---|---|---|---|---|---|---|---|---|---|
| I. Standard pleiotropy | 500 | 1 | 1 | 100 | 20;50 | 0.33 | (1,1); (1,0.1); (0.1,1); (0.1,0.1) | 0 | 0 |
| II. Z → X | 500 | 1 | 1 | 100 | 20;50 | 0.33 | (1,1); (1,0.1); (0.1,1); (0.1,0.1) | 0.1 | 0 |
Note. αx: association parameter between G and X; αz: association parameter between G and Z; MAF: minor allele frequency of all SNPs in the simulation; n: number of individuals; p: number of genotypes in total; pz: number of pleiotropic genotypes with effects on Z.
Structural equations for simulation Series I: Standard pleiotropy
| (9) |
where εx,i, εz,i, εy,i, ui∼N(0, 1).
Structural equations for simulation Series II: Z → X
| (10) |
where ε x,i , ε z,i , ε y,i , u i∼N(0, 1).
In each simulated data set, 100 SNPs (G in Equation (9)) with a minor allele frequency of 0.33 and n = 500 observations were generated, with values coded as (0, 1, 2). Among all 100 SNPs there are p z ∈ {20, 50} SNPs directly related to Z. Notice that smaller values of α x = 0.1 represent weak instruments G for X, while large values of α z = 1 represent strong instruments G for Z. Therefore, our scenarios comprise weak and strong instruments for one or both of X and Z. Two hundred datasets were generated for each scenario, and results compared the estimates and variance of the causal effect, β.
We conducted both one‐sample and validation sample simulations for Series I and II. In one‐sample simulations we compared the bias of causal effect estimators across all the methods discussed in this study: 2SLS_naive, 2SLS_exo, 2SLS_mul, Allele, Allele_exo, Allele_mul, sisVIVE, sisVIVE_exo, CIV_naive, and CIV_smooth. The strength of constructed instruments G ∗, and correlation between G ∗ and Z, are also compared across all methods except 2SLS_naive, 2SLS_exo, and 2SLS_mul. The pleiotropic correlation of sisVIVE variants is presented as the maximum correlation between Z and genotypes selected by the methods.
In external validation sample and two‐sample simulations, we compared causal effect estimation bias, instrument strength, and pleiotropic correlation across all methods except 2SLS naive, 2SLS_exo, and 2SLS_mul. As explained in Section 2.5, from the first sample, a vector of weights is constructed and used to create a new instrument, G ∗ = G , which is then used to infer the causal effect on the second sample. Notice that the vector of weights is obtained differently for different methods: for Allele score methods it is obtained from ordinary linear regression; for sisVIVE methods from a LASSO regression; and for CIV from the constrained optimization problem (4, 5a, and 5b).
The feature selection performances of sisVIVE, sisVIVE_exo, and CIV_smooth are also reported for all the simulation scenarios. The feature selection result from CIV_smooth is extracted as follows: we first obtain CIV_smooth estimates . For each converged solution , a feature j is recognized as significant if coefficient |c j| ≥ 0.2 × maxj |c j|, j = 1, …, p. All selected features are then recognized as selected valid instruments.
4.2. Simulation results
The simulations were designed to assess the performances of CIV_naive and CIV_smooth. The expectation was that both approaches would provide strong instruments with near zero pleiotropic correlation compared with other methods. Moreover, CIV_smooth should reduce the number of selected pleiotropic genotypes, thus providing more valid instruments and more accurate compared with some competitors; specifically, the validity of the instruments obtained from CIV_smooth should be comparable with those obtained from sisVIVE.
4.2.1. One sample simulation
These expectations were met in one‐sample simulations, as shown in Figures 4, 5, 6 and Table 3 for Series I. The F‐statistics of Figure 4 show that the instrument strengths of CIV_naive and CIV_smooth are superior to that of sisVIVE and sisVIVE_exo across scenarios. Although, as expected, the largest instrument strengths are obtained from the three variants of the Allele score method; across all scenarios the F‐statistics of the CIV approaches are >10, indicating that instrument strength is retained despite the adjustments for pleiotropy. The pleiotropic correlations for one‐sample simulations, presented in Figure 5, show that, confirming our expectations, both CIV_smooth and CIV_naive have exactly zero pleiotropic correlations in all scenarios, whereas sisVIVE, Allele, and Allele_mul show substantial nonzero values.
Figure 4.
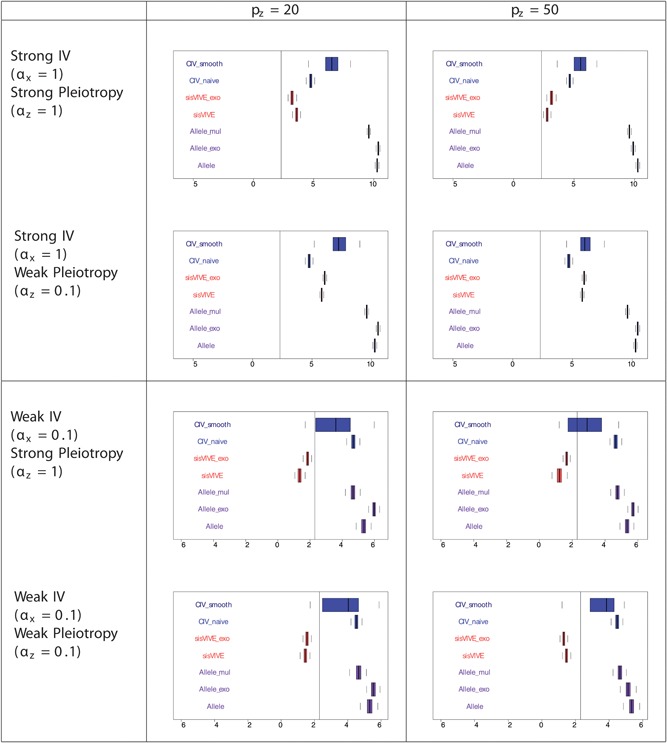
Log‐transformed F‐statistics of X~G ∗ for each Mendelian randomization method in one‐sample set‐up for simulation series I. The panels display results for different values of αx and αz corresponding to different instrument strength and pleiotropy severity. pz denotes the number of pleiotropic components among all 100 single nucleotide polymorphisms in G. Vertical line denotes F‐statistics = 10
Figure 5.
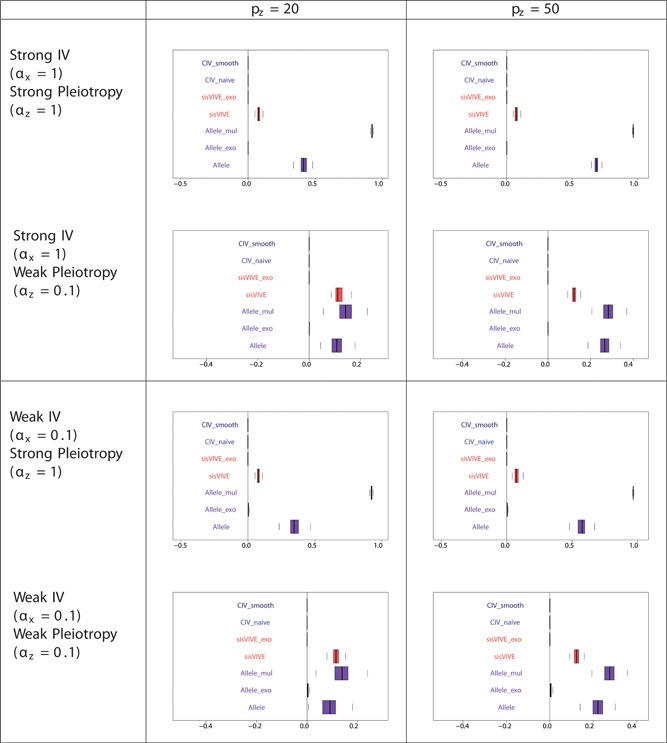
Pleiotropic correlations of Z and G ∗ for each Mendelian randomization method in a one‐sample set‐up for simulation Series I. The panels display results for different values of αx and αz corresponding to different instrument strength and pleiotropy severity. pz denotes the number of pleiotropic components among all 100 single nucleotide polymorphisms in G. Note that the pleiotropic correlations from CIV_smooth, CIV_naive, sisVIVE_exo, and Allele_exo are exactly zero in some scenarios
Figure 6.
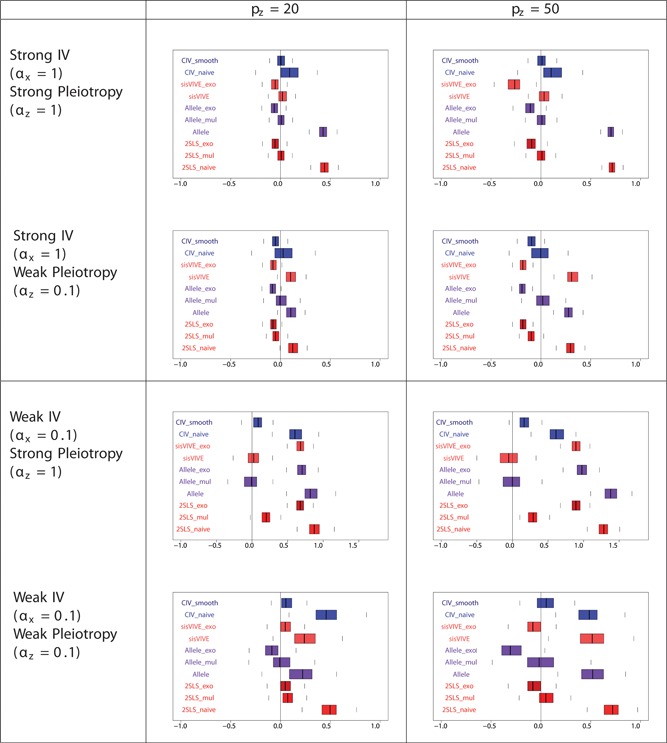
Boxplots of the bias of the causal effect estimates, β−1, from a one‐sample set‐up in simulation Series I. The panels display results for different values of αx and αz corresponding to different instrument strength and pleiotropy severity. pz denotes the number of pleiotropic components among all 100 single nucleotide polymorphisms in G
Table 3.
Feature selection results for CIV_smooth, sisVIVE and sisVIVE_exo from a one‐sample set‐up in simulation Series I
| Scenario | Method |
|
|
||||
|---|---|---|---|---|---|---|---|
| TP | FP | TP | FP | ||||
| Strong IV () | CIV_smooth | 79.55 | 7.42 | 49.98 | 13.15 | ||
| Strong pleiotropy ( | sisVIVE | 73.78 | 0.02 | 36.99 | 0.08 | ||
| sisVIVE_exo | 41.11 | 0.02 | 8.18 | 0.53 | |||
| Strong IV () | CIV_smooth | 77.00 | 14.53 | 46.99 | 27.18 | ||
| Weak pleiotropy ( | sisVIVE | 80.00 | 19.98 | 50.00 | 50.00 | ||
| sisVIVE_exo | 80.00 | 20.00 | 50.00 | 50.00 | |||
| Weak IV () | CIV_smooth | 70.47 | 11.76 | 45.07 | 31.17 | ||
| Strong pleiotropy ( | sisVIVE | 68.22 | 0.00 | 32.72 | 0.26 | ||
| sisVIVE_exo | 79.24 | 19.76 | 50.00 | 50.00 | |||
| Weak IV () | CIV_smooth | 69.72 | 11.80 | 43.29 | 27.53 | ||
| Weak pleiotropy ( | sisVIVE | 80.00 | 20.00 | 49.97 | 49.95 | ||
| sisVIVE_exo | 80.00 | 20.00 | 49.90 | 49.73 | |||
Notes. The panels display results for different values of αxand αzcorresponding to different instrument strength and pleiotropy severity. FP: average number of selected false positive variables out of pz; pz: the number of pleiotropic components among all 100 single nucleotide polymorphisms in G. TP: average number of selected true‐positive variables out of 100−pz.
The feature selection results in Table 3 show that sisVIVE outperforms CIV_smooth in the strong pleiotropy case, with a smaller true positive rate and a much smaller false positive rate. In contrast, in the weak pleiotropy case, it is the CIV_smooth that outperforms sisVIVE: here the sisVIVE approach does not eliminate any genetic variants, whereas CIV_smooth correctly eliminates 30–50% of the invalid genotypes.
The bias of across methods from simulation Series I in one‐sample set‐up is presented in Figure 6. For all methods, this bias is smaller for strong instrument scenarios than for weak instrument scenarios, and is higher for strong pleiotropy scenarios than for weak pleiotropy scenarios. Moreover, for all methods, the most biased estimates are those obtained from weak instruments and strong pleiotropy scenarios. It should be noted that in the latter case, is unbiased for CIV_smooth, sisVIVE and Allele_mul. Also, CIV_smooth outperforms CIV_naive in each scenario in terms of magnitude of the bias. The reason for the discrepancy between CIV_smooth and CIV_naïve is that CIV_smooth includes a prediction optimization procedure, whereas CIV_naive does not (see Appendix E).
The simulation results for Series II in the one sample set‐up, in general, are similar to those for Series I (Figures 7, 8, 9, and Table 4 for Series II). The only difference between the results of Series II and I lies in the performance of 2SLS_mul: unlike Series I, the estimates of from 2SLS_mul are significantly biased in the scenario of weak instruments and strong pleiotropy from Series II (Figure 7). When both pleiotropy and instruments are strong (first row of Figure 7) methods conditional on Z (sisVIVE_exo, Allele_exo, and 2SLS exo) give smaller estimates of than those without conditioning on Z (sisVIVE, Allele, and 2SLS). This is the collider bias induced by conditioning on Z. The same pattern can be seen in two other rows of Figure 7. A different pattern is seen when the instruments are weak but the pleiotropy is strong (third row of Figure 7). Conditioning on Z in this situation may be exacerbating the imprecision due to weak instruments.
Figure 7.
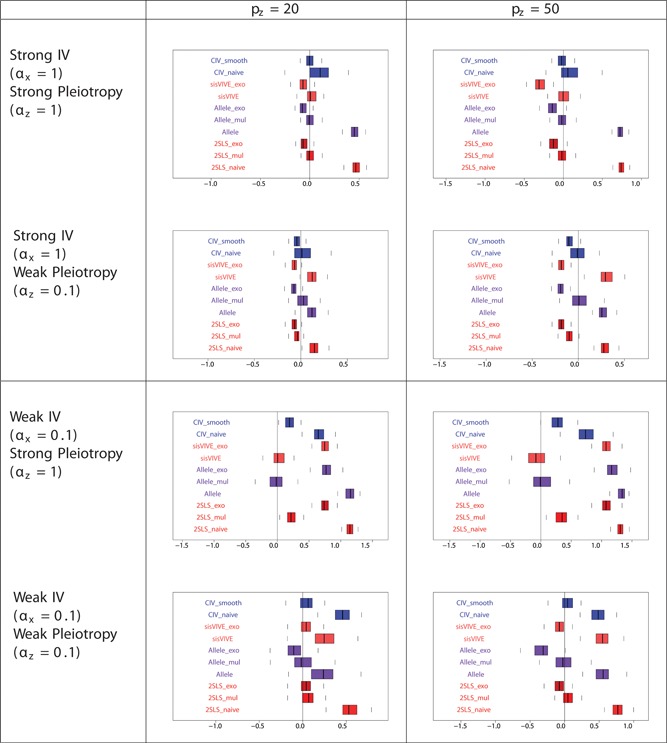
Boxplots of the bias of the causal effect estimates, β−1, from a one‐sample set‐up in simulation Series II. The panels display results for different values of αx and αz corresponding to different instrument strength and pleiotropy severity. pz denotes the number of pleiotropic components among all 100 single nucleotide polymorphisms in G
Figure 8.
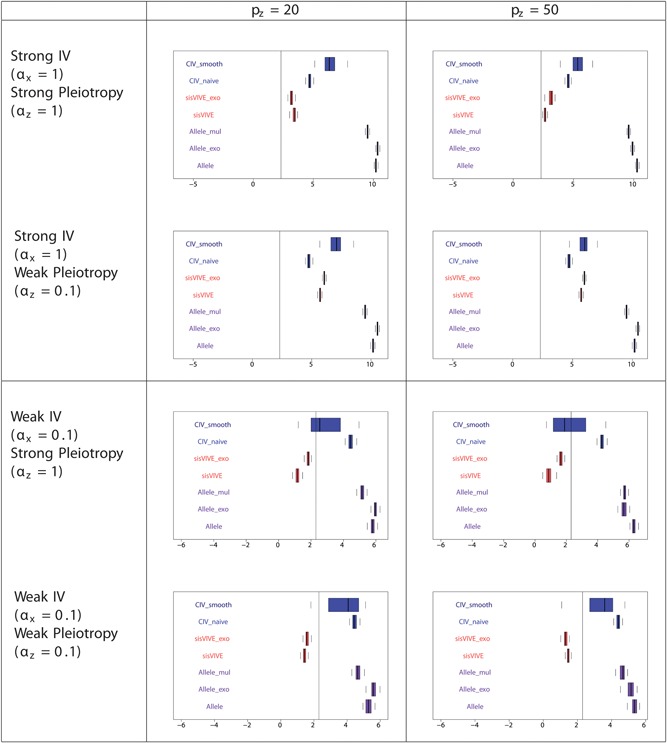
Log‐transformed F‐statistics of X~G ∗ for each Mendelian randomization method in a one sample set‐up for simulation Series II. The panels display results for different values of αx and corresponding to different instrument strength and pleiotropy severity. pz denotes the number of pleiotropic components among all 100 single nucleotide polymorphisms in G
Figure 9.
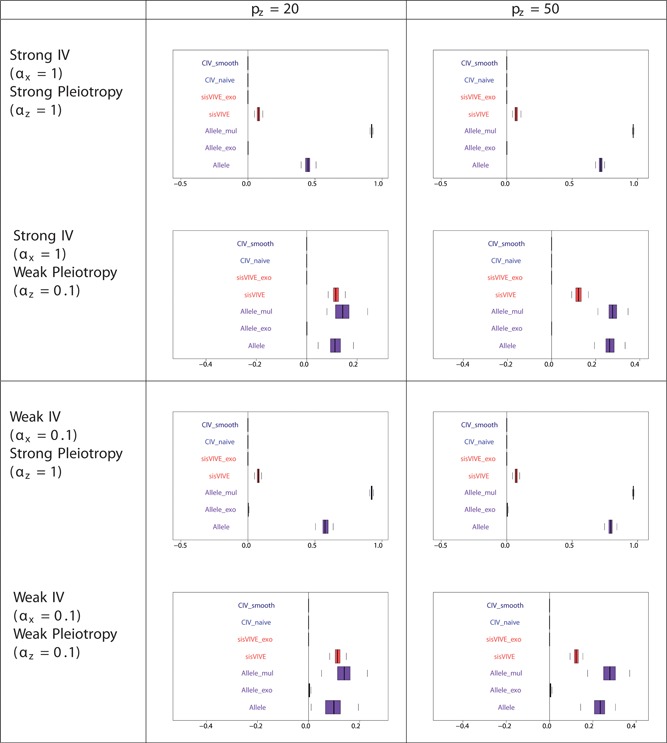
Pleiotropic correlations of Z and G ∗ for each Mendelian randomization method in a one sample set‐up for simulation series II. The panels display results for different values of αx and αz corresponding to different instrument strength and pleiotropy severity. pz denotes the number of pleiotropic components among all 100 single nucleotide polymorphisms in G. Note that the pleiotropic correlations from CIV_smooth, CIV_naive, sisVIVE_exo, and Allele_exo are exactly zero in some scenarios, and, therefore, do not appear on the graphs
Table 4.
Feature selection results for CIV_smooth, sisVIVE, and sisVIVE_exo from a one‐sample set‐up in simulation series II
| Scenario | Method | pz = 20 | pz = 50 | ||
|---|---|---|---|---|---|
| TP | FP | TP | FP | ||
| Strong IV () | CIV_smooth | 79.60 | 6.86 | 48.94 | 12.29 |
| Strong pleiotropy ( | sisVIVE | 73.23 | 0.00 | 36.39 | 0.04 |
| sisVIVE_exo | 39.85 | 0.00 | 8.34 | 0.52 | |
| Strong IV () | CIV_smooth | 77.19 | 15.06 | 47.20 | 26.93 |
| Weak pleiotropy ( | sisVIVE | 80.00 | 20.00 | 50.00 | 49.97 |
| sisVIVE_exo | 80.00 | 20.00 | 59.98 | 49.98 | |
| Weak IV () | CIV_smooth | 70.68 | 12.09 | 46.48 | 34.62 |
| Strong pleiotropy ( | sisVIVE | 68.54 | 0.00 | 31.92 | 0.04 |
| sisVIVE_exo | 78.48 | 19.52 | 50.00 | 50.00 | |
| Weak IV () | CIV_smooth | 70.06 | 12.03 | 43.75 | 27.48 |
| Weak pleiotropy ( | sisVIVE | 80.00 | 20.00 | 49.98 | 49.93 |
| sisVIVE_exo | 79.97 | 19.93 | 50.00 | 50.00 | |
Notes. The panels display results for different values of αx and αz corresponding to different instrument strength and pleiotropy severity. FP: average number of selected false positive variables out of pz; pz: the number of pleiotropic components among all 100 single nucleotide polymorphisms in G. TP: average number of selected true positive variables out of 100−pz.
4.2.2. Two sample simulation
Two‐sample and external validation sample bias results are shown in Figure 10 for Series I simulations. External validation sample results are shown above the horizontal line in each image, and two‐sample results are shown below the line, only for methods that adapt to these situations.
Figure 10.
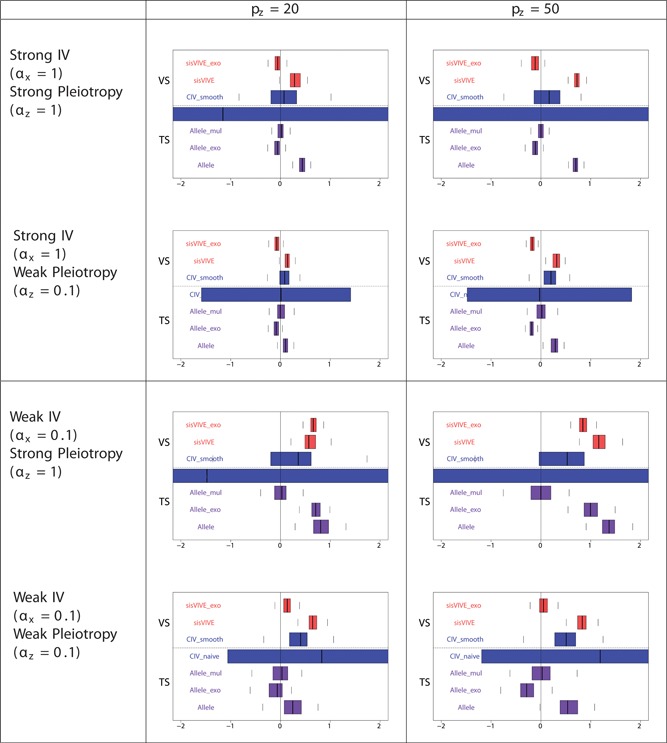
Boxplots of the bias of the causal effect estimates, β−1, from external validation sample and two‐sample set‐ups in simulation Series I. The panels display results for different values of αx and αz corresponding to different instrument strength and pleiotropy severity. pz denotes the number of pleiotropic components among all 100 single nucleotide polymorphisms in G. The dashed line separates external VS results from TS results. TS: two‐sample; VS: validation sample
Across all scenarios, CIV_naive has substantially larger variances than all other methods, to the extent that it is impossible to even evaluate bias. CIV_naive is not designed to optimize prediction of Y in the second sample, and does not use Y in the instrument construction process of the first sample. Hence, CIV_naive weights are not robust across data sets. In fact, the instrument strengths for CIV_naive in two‐sample set‐up (Figure 11) are significantly lower than in one‐sample set‐up (Figure 4). Figure 12 shows that the pleiotropic correlations of CIV_naive from the two‐sample set‐up are larger than those from the one‐sample simulations (Figure 5), for the same reason.
Figure 11.
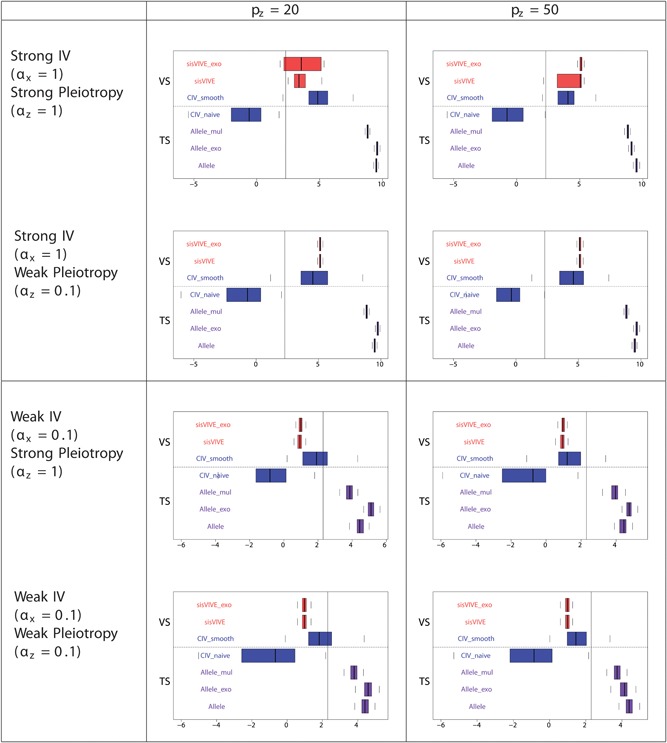
Log‐transformed F‐statistics of X~G ∗ for each Mendelian randomization method (in the second sample) in simulation Series I. The panels display results for different values of αx and αz corresponding to different instrument strength and pleiotropy severity. pz denotes the number of pleiotropic components among all 100 single nucleotide polymorphisms in G. Vertical line denotes F‐statistics = 10. The dashed line separates external VS results from TS results. TS: two‐sample; VS: validation sample
Figure 12.
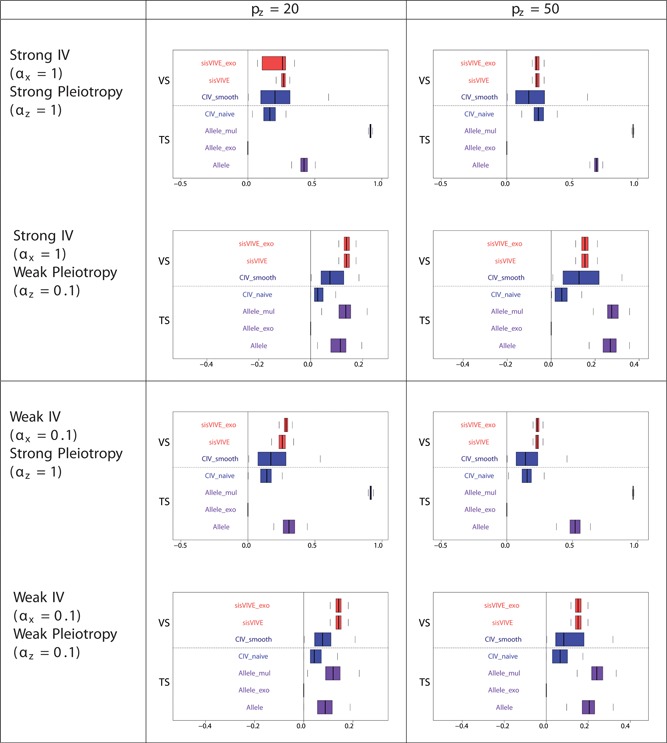
Pleiotropic correlations of Z and G∗ for each Mendelian randomization method (in the second sample) in simulation Series I. The panels display results for different values of αx and αz corresponding to different instrument strength and pleiotropy severity. pz denotes the number of pleiotropic components among all 100 single nucleotide polymorphisms in G. Note that the pleiotropic correlation values from Allele_exo are exactly zero in some scenarios. The dashed line separates external VS results from TS results. TS: two‐sample; VS: validation sample
For the two‐sample set‐up, Allele_mul gives unbiased results in all scenarios; however, the Allele_exo is biased in the scenario of weak instruments and strong pleiotropy. In general, across all scenarios, the strongest instruments as well as highest pleiotropic correlations occur for the three variants of the Allele score method.
The simulation results for Series II in two‐sample set‐up are similar to those for Series I: they are shown in Figures 13, 14, 15.
Figure 13.
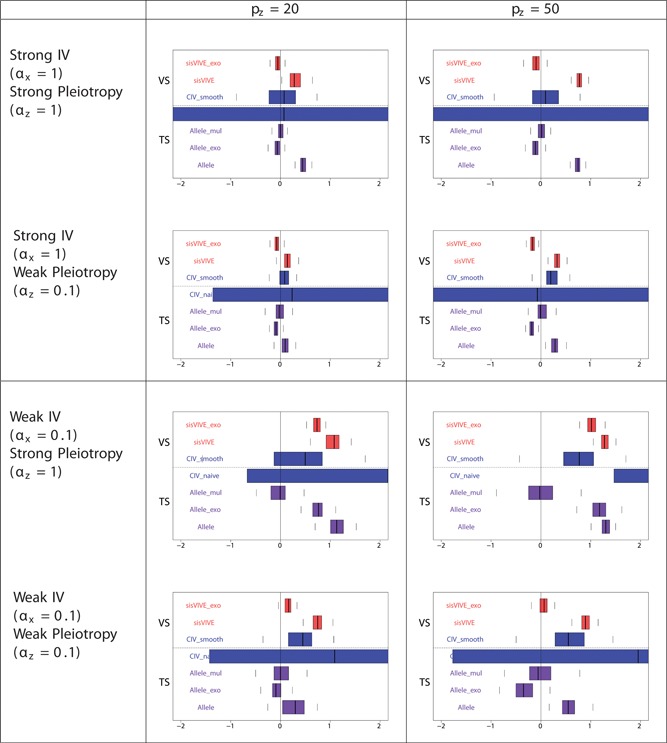
Boxplots of the bias of the causal effect estimates, β‐1, from external validation sample and two‐sample set‐ups in simulation Series II. The panels display results for different values of αx and αz corresponding to different instrument strength and pleiotropy severity. pz denotes the number of pleiotropic components among all 100 single nucleotide polymorphisms in G. The dashed line separates external VS results from TS results. TS: two‐sample; VS: validation sample
Figure 14.
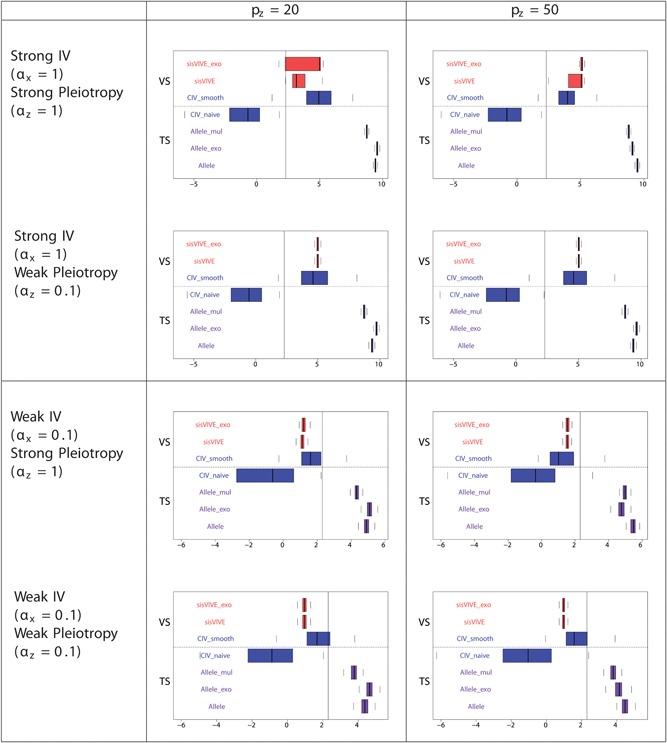
Log‐transformed F‐statistics of X~G ∗ for each Mendelian randomization method (in the second sample) in simulation Series II. The panels display results for different values of αx and αz corresponding to different instrument strength and pleiotropy severity. pz denotes the number of pleiotropic components among all 100 single nucleotide polymorphisms in G. Vertical line denotes F‐statistics = 10. The dashed line separates external VS results from TS results. TS: two‐sample; VS: validation sample
Figure 15.
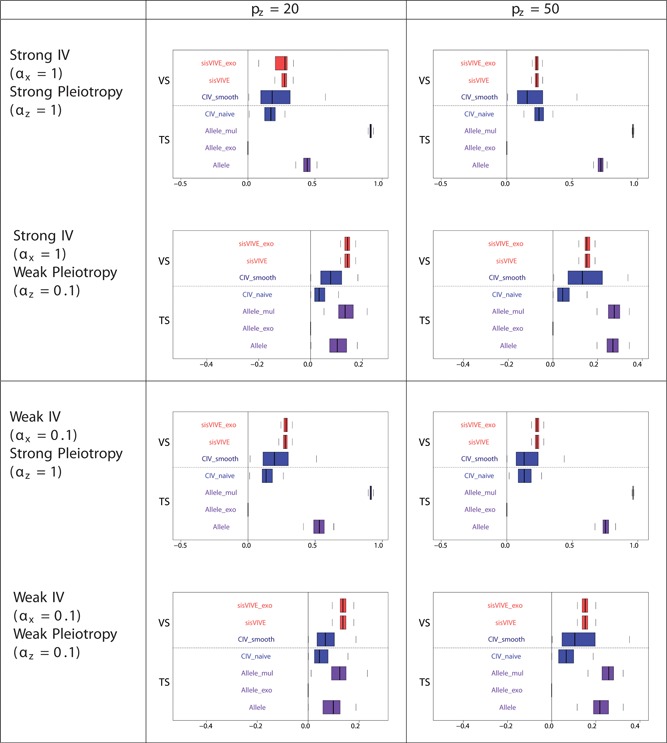
Pleiotropic correlations of Z and G ∗ for each Mendelian randomization method (in the second sample) in simulation series II. The panels display results for different values of αx and αz corresponding to different instrument strength and pleiotropy severity. pz denotes the number of pleiotropic components among all 100 single nucleotide polymorphisms in G. Note that the pleiotropic correlation values from Allele_exo are exactly zero in some scenarios, and therefore nothing can be seen on the graphs. The dashed line separates external VS results from TS results. TS: two‐sample; VS: validation sample
4.2.3. External validation sample simulation
The validation sample simulation results confirm our hypothesis that CIV_smooth is more robust than CIV_naive; CIV_smooth is unbiased in all scenarios and is much less variable than CIV_naive. It is likely that CIV_smooth attains robustness by incorporating a penalty approach to select genotypes, and uses Y in the instrument construction process to optimize projected predictions of X on Y, thus achieving greater stability of .
The F‐statistics of CIV_smooth from Series I in the external validation‐sample set‐up (Figure 11) are substantially lower than the F‐statistics from the one‐sample set‐up, as might be expected. Also, the pleiotropic correlations of CIV_smooth from the two‐sample set‐up (Figure 12) are larger than those from the one‐sample simulations (see Figure 5) for the same reason as was seen for CIV_naive above. In general, across all scenarios, the estimated instrument strength and the pleiotropic correlation of CIV_smooth are comparable with those of sisVIVE and sisVIVE_exo.
4.3. Simulation summary
In conclusion, CIV_smooth and Allele_mul methods provide the only unbiased causal effect estimates in all scenarios. The sisVIVE estimates are biased in some scenarios, especially for weak pleiotropy scenarios. Allele_mul retains high pleiotropic correlation when strong pleiotropy exists, as it does not select the components of G. The estimated instrument strength and pleiotropic correlation of CIV_smooth are always close to those of its close competitors; moreover they are the only unbiased casual effect estimation method that performs feature selection.
5. DATA ANALYSIS: THE ALZHEIMER’S DISEASE NEUROIMAGING INITIATIVE (ADNI) COHORT
AD is a chronic neurodegenerative disorder that causes a slow decline in memory and reasoning skills. It is well known that biomarkers, including cerebrospinal fluid tau protein (CSF‐tau) and cerebrospinal fluid Aβ‐protein ending at amino acid position 42 (CSF‐Aβ 1–42), are reliable measures of AD progression (Frost, Jacks, & Diamond, 2009; Hardy & Higgins, 1992; Shaw et al., 2009). Recently, other biomarkers such as flluoro‐D‐glucose standardized uptake (FDG_SUVR) and neural functional activity have been added when exploring the mechanisms underlying late‐onset Alzheimer’s disease (LOAD) using multifactorial data analysis (Iturria‐Medina, Sotero, Toussaint, Mateos‐Pérez, & ADNI, 2016). However, at this point, there is still uncertainty as to whether the changes in these biomarkers play a causal role in AD progression or are simply associated with AD progression.
We have used instrumental variable methods to try to disentangle causal relationships for AD. Data used in the preparation of this study were obtained from the ADNI database (adni.loni.usc.edu). The ADNI study was launched in 2003 as a public–private partnership, led by Principal Investigator Michael W. Weiner, MD. The primary goal of ADNI has been to test whether serial magnetic resonance imaging, positron emission tomography, other biological markers, and clinical and neuropsychological assessment can be combined to measure the progression of mild cognitive impairment (MCI) and early AD.
The outcome (AD status) studied here is a binary case–control variable, where “case” is a subject with either MCI or early AD. Thus we use logistic regression in the second stage of MR analysis to estimate a causal risk ratio (CRR; Burgess, Granell, Palmer, Sterne, & Didelez, 2014; Clarke & Windmeijer, 2012). The sisVIVE method, however, requires the outcome to be continuous; therefore, we adjusted outcome Y, X, and Z for the exogenous covariates sex, education, and age, and replaced these with their predictors (which can be considered quasicontinuous), and , to which we can apply sisVIVE. In this case, any bias toward the null in the causal effect estimates from sisVIVE would be largely due to the impact of confounding factors (Palmer, Thompson, Tobin, Sheehan, & Burton, 2008).
A very important limitation of performing MR analysis in ADNI data is the retrospective nature of its study design. Ascertainment in ADNI was retrospective by disease status, and therefore, instruments that would be valid for a prospective study design may not remain valid after retrospective sampling (Didelez & Sheehan, 2007). Specifically, the estimated first stage (X∼G) association from case–control samples may be biased relative to the true association in a general population sample (Tapsoba, Kooperberg, Reiner, Wang, & Dai, 2014; Tchetgen Tchetgen, 2013). If the disease being studied is rare, it is possible to conduct a first stage regression only on the control sample, then perform causal effect estimation on the whole sample using MR methods applicable to two‐sample/validation sample set‐ups (Lin & Zeng, 2009).
For illustration of CIV below, we select in turn each of the four available biomarkers (CSF‐Aβ 1–42, CSF‐Ptau, CSF‐Ttau and FDG_SUVR) as X, and then assign the other three to be the pleiotropic phenotypes, Z. This then raises another limitation of our MR analysis of these data: We are assuming there is no causal relationship from X → Z as this would imply a different total causal effect than the one that we are estimating. Given our rotation of phenotypes between the (X, Z) position, we are essentially assuming there is no direct causal relationship between any of these phenotypes and that pleiotropy is induced merely by sharing some genetic contributions. Therefore, we suggest that the results below should be interpreted as simply illustrating our methods and not as making substantive causal statements.
5.1. Outcome, exposures and instruments
Outcome Y: A subject is either from the control group, or is a “case” if diagnosed with MCI or AD. In total we analyzed n = 491 subjects including 151 controls (Y = 0) and 340 cases (Y = 1).
Exposures X: We are interested in estimating the causal effect on AD progression of four biomarkers, including CSF‐Aβ 1–42 (X 1), natural log of Ptau (X 2), natural log of Ttau (X 3) and FDG_SUVR (X 4). It is well known that the isoforms of apolipoprotein E, a class of apolipoprotein that mediates cholesterol metabolism, are associated with both Aβ aggregation and Tau protein phosphorylation (Brecht et al., 2004; Frautschy & Cole, 2010; Strittmatter & Roses, 1995; Sunderland et al., 2004), which implies potential pleiotropy. If there were multiple measurements of the biomarkers, the first one was used. All exposure variables were adjusted for covariates age, sex, and education. Profiles of the subjects are summarized in Table 5.
Table 5.
Characteristics of subjects studied in ADNI
| Number | Age (years; mean ± SD) | Gender (M/F) | Education (years; mean ± SD) | |
|---|---|---|---|---|
| Control | 151 | 75.93 ± 5.86 | 86/65 | 16.3 + 2.7 |
| MCI/AD | 340 | 74.08 ± 7.63 | 212/128 | 15.89 ± 2.92 |
| MCI | 277 | 73.64 ± 7.53 | 173/104 | 16.03 ± 2.81 |
| AD | 63 | 76.03 ± 7.78 | 39/24 | 15.27 ± 3.31 |
Note. AD: Alzheimer’s disease; ADNI: Alzheimer’s disease neuroimaging initiative; MCI: mild cognitive impairment.
Instruments G: For each of the exposures X k , k = 1, …, 4, the strongly associated SNPs reported by the NHGRI‐EBI catalog of published genome‐wide association studies (Burdett et al., 2016) were collected from the ADNI Imputed Genotype data. The missing genotypes were imputed based on the 1,000 Genome Project, utilizing the same protocol for the ROS/MAP and AddNeuroMed study. When there were very highly correlated (ρ ≥ 0.8) SNPs which are known to belong to the same gene, we kept only one representative SNP. The SNP set was then further reduced by using a univariate feature selection based on significant F‐statistics (p ≤ 0.05). Hence, the final selected SNPs comprised 12 SNPs for Aβ (X 1), six SNPs for Ptau (X 2), four SNPs for Ttau (X 3), and 17 SNPs for FDG_SUVR (X 4).
5.2. MR analysis
The assumption (A1) of MR states that the SNPs must be associated with biomarkers of interest. Strong instruments with F‐statistics bigger than 10 are usually preferred in MR applications. The F‐statistics for instrument strength, based on the set of SNPs selected for each biomarker, were 12.44 (Aβ), 12.01 (Ptau), 4.52 (Ttau), and 5.94 (FDG_SUVR). We also performed the Sargan test for over‐identification (Baum et al., 2003) to test the MR assumption (A2) and (A3). The p values of the Sargan test were 1.5e−4, 5e−5, 0.23, and 3e−4 for X k, k = 1, …, 4, implying the existence of invalid instruments in G for MR for Aβ (X 1), Ptau (X 2), and FDG_SUVR (X 4) on AD progression (Y). The reason for these small p‐values is that the selected SNPs that are strongly associated with Ptau have even stronger associations with Aβ. Individual p‐values for instruments G with the four biomarkers are shown in Figures 16 and 17.
Figure 16.

Strength of association, measured by ‐log10 pvalues, between all four biomarkers and SNPs selected through their asssociation with one biomarker. Left: SNPs selected for Amyloid beta; Right: SNPs selected for Ptau
Figure 17.

Strength of association, measured by ‐log10 pvalues, between all four biomarkers and SNPs selected through their asssociation with one of the biomarkers. Left: SNPs selected for Ttau; Right: SNPS selected for SUVR.
MR was performed to evaluate the potential causal effects of variability in each biomarker (X) on the AD progression (Y) in two steps. In the first step, we used only the control samples to obtain weights with applicable methods (Allele methods, sisVIVE methods and CIV_smooth). In the second step, using the whole sample, we constructed instrumental variables using the weights obtained from the first step, and inferred causal effects of each biomarker X k on AD progression while adjusting for the other three biomarkers as secondary phenotypes. In this set‐up, if we assume that the control sample is similar to the whole population from which the individuals were drawn, then the retrospective nature of ADNI is respected. As said above, we also acknowledge that our analyses assume no causal relationship from X to Z for each (G, X, Z, Y) set‐up, and results need to be interpreted in this light. It is important to note that in this analysis, we can only include CIV_smooth, Allele scores, and sisVIVE because not all methods can be adapted to this two‐step approach. We excluded CIV_naive due to its unstable performance in the two‐step approach (see Section 4.2).
5.3. Results
Using CIV_smooth we found a significant causal effect of CSF‐Aβ 1–42 on AD progression, with lower CSF‐Aβ 1–42 levels in AD patients than controls. The 95% confidence intervals of the causal effect estimates (log‐odds) for CSF‐Aβ 1–42 obtained from two‐sample/validation sample analyses are reported in Figure 18. Neither the three variants of Allele score methods, nor the two variants of sisVIVE methods identified a significant causal effect of CSF‐Aβ 1–42 peptide levels on AD progression. In contrast, none of the methods found significant causal effects for Ttau, Ptau, and FDG_SUVR on AD progression.
Figure 18.
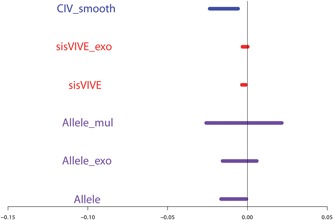
95% bootstrapped confidence interval of causal estimates (log odds) of CSF‐A β 1–42 protein levels on AD progression using CIV_smooth and Allele methods in external validation sample set‐ups. It is important to note that the confidence interval shown here for sisVIVE methods results from treating Y as continuous, since sisVIVE is not designed for binary outcomes. These results show a decrease in AD risk with higher amyloid beta levels.
The observation of a significant causal impact for CSF‐Aβ 1–42 on AD is consistent with some previous publications. In fact, multiple observational studies have reported decreasing Aβ 1–42 in cerebrospinal fluid of patients with AD compared with normal control subjects (Herukka et al., 2007; Maruyama et al., 2001; Sunderland et al., 2003). However, as mentioned above, these results are merely illustrative of the performance of our methods.
6. DISCUSSION
In this paper we proposed a new CIV method for causal inference when pleiotropy is suspected. This method, CIV_smooth, is an improved variant of a conceptually simpler one, CIV_naive, which is defined within the broader framework of instrumental variable theory. CIV_naive optimizes an objective function under a “hard” constraint; CIV_smooth adds to this a soft constraint to favor smoothed L 0 solutions. In our simulation study, we have presented and compared the performance of CIV_smooth, CIV_naive, and other popular methods. A variety of simulation scenarios were constructed to mimic realistic pleiotropic relationships. We found that CIV_smooth compares favorably to its closest competitors with respect to instrument strength, pleiotropic correlation, and causal effect estimation bias in a one‐sample analysis design. We note furthermore that CIV_naive, while outperforming its competitors in specific situations, is uniformly outperformed by CIV_smooth. To illustrate the performance of CIV_smooth and its competitors, we conducted MR analysis on data from ADNI (Mueller et al., 2005), with the aim of estimating the causal effects of the biomarkers CSF‐Aβ 1–42, CSF‐Ptau, CSF‐Ttau and FDG_SUVR on AD progression. CIV_smooth found only one significant causal effect, that of CSF‐Aβ 1–42 on AD progression; this suggests that the previously known association of this biomarker with AD progression may be causal. In contrast, all the other methods failed to uncover any significant causal effect.
The main advantage of the CIV_smooth method is that it constructs valid instruments that are strongly associated with a phenotype of interest. Indeed by construction, CIV_smooth aims to balance the “validity” (pleiotropic correlation) and instrument strength (association with phenotype) of solutions. This balance is desirable, since strong instruments will provide consistent causal effect estimates, whereas approximately valid instruments will reduce the pleiotropy‐induced bias. The simulations show that CIV_smooth provides unbiased causal effect estimates by achieving this balance; although it could be slightly outperformed by its competitors on either pleiotropic correlation or instrument strength, but not both. At the same time, in one‐sample analyses the novel feature selection aspect of CIV_smooth does not introduce significant bias in causal effect estimation.
Another advantage of CIV_smooth is the option of separating instrument construction and causal effect estimation. In fact, the construction of CIV_smooth instruments relies on a coefficient vector c estimated from a sample of G, X, Z, Y. Then, any estimation method for linear structural equations can be applied to CIV_smooth instruments G ∗ → X → Y for causal inference. Due to this separation of first‐stage and second‐stage analysis, CIV_naive, CIV_smooth, and Allele scores can be trained and assessed on different datasets. It should be noted that the consistency of CIV_smooth is reasonable and comparable with that of its closest competitors, while CIV_naive is often found to be severely inconsistent. Therefore, it is clear that CIV_smooth has substantial flexibility in terms of model assessment and causal effect estimation.
In the presence of pleiotropic phenotypes Z (α z ≠ 0 in Figure 2), any method that conditions on Z would induce collider bias. The main advantage of CIV_smooth is to propose a selection of valid instruments G ∗ that are meant to approach, as closely as possible, the ideal situation, α z ∗ = 0. Nevertheless, collider bias in CIV_smooth will still be induced when the pleiotropic correlation between G ∗ and Z is high in absolute values. However, Simulation Series I and II show that CIV_smooth is more robust than sisVIVE and 2SLS methods even though spurious association may have been introduced by the constrained projections (see Figures 7, 8, 9 and 13, 14, 15). We plan additional investigation in future work.
In this paper we did not consider scenario (iii) of Section 2.1 corresponding to γ xz ≠ 0, in which the total causal effect of X on Y includes a contribution through Z. In this scenario, we do have a true X → Z relationship with total causal effect of β + γxz η. Therefore sisVIVE is unlikely to perform well if there are pleiotropic genotypes since by its definition all genotypes are invalid for X (a valid genotype only impacts Y through X). Also, neither CIV_naive nor CIV_smooth estimate β + γxzη, and generalizations do not seem to be easy. Although some preliminary simulation results including an X → Z causal relationship did show that CIV_smooth may have potential in this scenario, in that the direct causal effect β of X on Y can be estimated adequately, a good estimate of the total causal effect requires extensive changes to the present methodology, and is beyond the scope of this paper. Leaving out scenario (iii) is certainly a limitation of this study that will require further careful research. On the other hand, even with this limitation the results of this paper have practical applications. Indeed, it may be plausible that any correlation between Z and X is due to a “common cause” and not to any causal relationship X → Z or Z → X, in which case this “common cause” would be absorbed by U and fall under the case we consider here (both γ xz and γ zx are zero). We note further that conditioning on Z when γ xz ≠ 0 may exacerbate collider bias.
A major limitation of our method is the multiplicity of solutions occurring in certain regions of the parameter space. We have attempted to alleviate this problem by launching the algorithm from multiple initial points, and combining the resulting instruments into a matrix (observation × instrument), which becomes itself an instrument G ∗ (see Appendix C for details).
Another limitation of CIV_smooth is the ad hoc choice of the threshold used in the variable selection step. In this study we are fixing the threshold at 0.2, an empirical choice based on our simulation (see Section 4.1 for details). However, this choice may be problematic in applications featuring large numbers of pleiotropic genotypes.
A third limitation of CIV_smooth is its failure to eliminate the influence of pleiotropic phenotypes when Z contains only some but not all pleiotropic phenotypes. We conducted a sensitivity analysis of CIV_smooth, varying the proportion of observed pleiotropic phenotypes. The results show that in most scenarios sisVIVE and sisVIVE_exo methods estimate the causal effects with the smallest bias among all competitors. However, if α z is small and more than 50% of pleiotropic phenotypes are observed (in Z), then CIV_smooth does provide better (smaller bias) causal effect estimates than sisVIVE methods and Allele methods. This result points to some avenues for future research through investigations of robustness to improve the performance of CIV_naive and CIV_smooth. See Appendix F for details (particularly Supporting Information Figures S3 and S5).
In our MR analysis of the ADNI data set, an important limitation is that ADNI is a retrospectively designed study. In an attempt to alleviate this problem, we implemented the two‐stage approach, introduced by Jiang, Scott, and Wild (2006): in the first stage weighted scores were constructed from the control samples and in the second‐stage instruments were constructed with these scores on the whole data set, and the causal effect of each individual biomarker was estimated while treating the other biomarkers as secondary phenotypes. However, this two‐stage approach cannot completely resolve the problems associated with using an MR approach on a retrospective study (Bowden & Vansteelandt, 2011; Tchetgen Tchetgen, Walter, & Glymour, 2013).
Another limitation of the ADNI data analysis is that we treated causal effect estimation for multiple phenotypes as a series of estimations, each with one of the phenotypes as X and the others as Z. This reduction was necessary to compare methods, since only CIV allows multivariate versions of both X and Z. However, such set‐up is only appropriate when there is no direct causal impact X → Z for each pair (X, Z), in which case the total causal effect of X on Y is equal to the direct causal effect. If this assumption is not true for any pair of (X, Z), the β estimator from different methods would be measuring different effects (total or direct effects) or would even be invalid. Therefore, as already mentioned, the results of ADNI analysis in this paper simply serve as a demonstration of our CIV methods, and must not be used to make definite causal statements regarding AD.
In future research we will attempt to overcome some of the limitations of the CIV methods. One useful direction is to propose a measure of quality of solutions. Such a measure could be used to discard solutions of poor quality, or alternatively to combine solutions using quality based weights. A more complex approach could also be developed by adding further soft constraints (e.g., quality based constraints, group constraints) to the current version of our CIV_smooth algorithm.
In future work we intend to apply our approach to study causation in a larger setting. Such data could be obtained from UKbiobank (Sudlow et al., 2015), which is a prospective data containing health information of 500,000 participants as well as their genetic profiles. UKbiobank is an ideal source to study the causal effects of multiple potentially pleiotropic biomarkers, since it contains information on a rich variety of phenotypes and disease outcomes (including AD) for each participant. However, the large sample size of the UKbiobank presents a serious computational challenge for CIV_smooth. We need, therefore, to develop successful strategies to integrate MR results from subsamples of workable size for CIV_smooth.
In conclusion, this paper proposes a new approach (CIV_smooth) for conducting MR analyses when pleiotropy is suspected. Assuming a linear structural model linking together genotypes, phenotypes, and outcome yields “approximately valid” instruments to adjust causal effect estimation when potential pleiotropic phenotypes are measured. We have shown in simulations that the performance of (CIV_smooth) is comparable, and occasionally preferable, to other popular methods, namely 2SLS, Allele, and sisVIVE. We have also shown in the analysis of a data set on AD that the method produces reasonable results. In view of these results, we hope that CIV_smooth will be integrated into the family of MR analyses methods, making MR a more common practice even when pleiotropy is observed.
Supporting information
Supporting information
ACKNOWLEDGEMENTS
This work was supported by grant PJT‐148620 from the Canadian Institutes of Health Research to CG. The simulation studies in this paper were enabled in part by support provided by the GRAHAM computer cluster of Compute Canada (nzt‐671‐ab). KO is a recipient of the Chercheur‐Boursier grant (31110) from the Fonds de recherche en santé du Québec (FRSQ).
Data collection and sharing for this project was funded by the Alzheimer’s Disease Neuroimaging Initiative (ADNI) (NIH, Grant No. U01 AG024904) and DOD ADNI (Department of Defense Award Number W81XWH‐12‐2‐0012). ADNI is funded by the National Institute on Aging, the National Institute of Biomedical Imaging and Bioengineering, and through generous contributions from the following: AbbVie, Alzheimer’s Association; Alzheimer’s Drug Discovery Foundation; Araclon Biotech; BioClinica, Inc.; Biogen; Bristol‐Myers Squibb Company; CereSpir, Inc.; Cogstate; Eisai Inc.; Elan Pharmaceuticals, Inc.; Eli Lilly and Company; EuroImmun; F. Hoffmann‐La Roche Ltd and its affiliated company Genentech, Inc.; Fujirebio; GE Healthcare; IXICO Ltd.; Janssen Alzheimer Immunotherapy Research & Development, LLC.; Johnson & Johnson Pharmaceutical Research & Development LLC.; Lumosity; Lundbeck; Merck & Co., Inc.; Meso Scale Diagnostics, LLC.; NeuroRx Research; Neurotrack Technologies; Novartis Pharmaceuticals Corporation; Pfizer Inc.; Piramal Imaging; Servier; Takeda Pharmaceutical Company; and Transition Therapeutics. The Canadian Institutes of Health Research is providing funds to support ADNI clinical sites in Canada. Private sector contributions are facilitated by the Foundation for the National Institutes of Health (www.fnih.org). The grantee organization is the Northern California Institute for Research and Education, and the study is co‐ordinated by the Alzheimer’s Therapeutic Research Institute at the University of Southern California. ADNI data are disseminated by the Laboratory for Neuro Imaging at the University of Southern California. Data used in preparation of this study were obtained from the Alzheimer’s Disease Neuroimaging Initiative (ADNI) database (adni.loni.usc.edu). As such, the investigators within the ADNI contributed to the design and implementation of ADNI and/or provided data but did not participate in analysis or writing of this report. A complete listing of ADNI investigators can be found at: https://adni.loni.usc.edu/wp-content/uploads/how_to_apply/ADNI_Acknowledgement_List.pdf.
Jiang L, Oualkacha K, Didelez V, et al. Constrained instruments and their application to Mendelian randomization with pleiotropy. Genet. Epidemiol. 2019;43:373–401. 10.1002/gepi.22184
References
REFERENCES
- Angrist, J. D. (2006). Instrumental variables methods in experimental criminological research: What, why and how. Journal of Experimental Criminology, 2(1), 23–44. [Google Scholar]
- Angrist, J. D. , & Krueger, A. B. (1992). The effect of age at school entry on educational attainment: An application of instrumental variables with moments from two samples. Journal of the American Statistical Association, 87(418), 328–336. [Google Scholar]
- Baum, C. F. , Schaffer, M. E. , & Stillman, S. , et al. (2003). Instrumental variables and gmm: Estimation and testing. Stata Journal, 3(1), 1–31. [Google Scholar]
- Bowden, J. , Davey smith, G. D. , & Burgess, S. (2015). Mendelian randomization with invalid instruments: Effect estimation and bias detection through egger regression. International Journal of Epidemiology, 44(2), 512–525. [DOI] [PMC free article] [PubMed] [Google Scholar]
- Bowden, J. , & Vansteelandt, S. (2011). Mendelian randomization analysis of case‐control data using structural mean models. Statistics in Medicine, 30(6), 678–694. [DOI] [PubMed] [Google Scholar]
- Boyd, S. , & Vandenberghe, L. (2004). Convex optimization. Cambridge University Press; [Google Scholar]
- Brecht, W. J. , Harris, F. M. , Chang, S. , Tesseur, I. , Yu, G.‐Q. , & Xu, Q. , et al. (2004). Neuron‐specific apolipoprotein e4 proteolysis is associated with increased tau phosphorylation in brains of transgenic mice. Journal of Neuroscience, 24(10), 2527–2534. [DOI] [PMC free article] [PubMed] [Google Scholar]
- Burdett, T. , Hall, P. , Hasting, E. , Hindorff, L. , Junkins, H. , Klemm, A. , … et al. (2016). The NHGRI‐EBI catalog of published genome‐wide association studies. Retrieved from www.ebi‐acuk/gwas
- Burgess, S. , Granell, R. , Palmer, T. M. , Sterne, J. A. C. , & Didelez, V. (2014). Lack of identification in semiparametric instrumental variable models with binary outcomes. American Journal of Epidemiology, 180(1), 111–119. [DOI] [PMC free article] [PubMed] [Google Scholar]
- Burgess, S. , & Thompson, S. G. (2013). Use of allele scores as instrumental variables for mendelian randomization. International Journal of Epidemiology, 42(4), 1134–1144. [DOI] [PMC free article] [PubMed] [Google Scholar]
- Burgess, S. , & Thompson, S. G. (2015). Multivariable mendelian randomization: The use of pleiotropic genetic variants to estimate causal effects. American Journal of Epidemiology, 181(4), 251–260. [DOI] [PMC free article] [PubMed] [Google Scholar]
- Burgess, S. , Thompson, S. G. , & Collaboration, C. C. G. (2011). Avoiding bias from weak instruments in mendelian randomization studies. International Journal of Epidemiology, 40(3), 755–764. [DOI] [PubMed] [Google Scholar]
- Clarke, P. S. , & Windmeijer, F. (2012). Instrumental variable estimators for binary outcomes. Journal of the American Statistical Association, 107(500), 1638–1652. [Google Scholar]
- Cole, S. R. , Platt, R. W. , Schisterman, E. F. , Chu, H. , Westreich, D. , Richardson, D. , & Poole, C. (2009). Illustrating bias due to conditioning on a collider. International Journal of Epidemiology, 39(2), 417–420. [DOI] [PMC free article] [PubMed] [Google Scholar]
- Davies, N. M. , Von hinke kessler scholder, S. , Farbmacher, H. , Burgess, S. , Windmeijer, F. , & Smith, G. D. (2015). The many weak instruments problem and Mendelian randomization. Statistics in Medicine, 34(3), 454–468. [DOI] [PMC free article] [PubMed] [Google Scholar]
- Dee, T. S. , & Evans, W. N. (2003). Teen drinking and educational attainment: Evidence from two‐sample instrumental variables estimates. Journal of Labor Economics, 21(1), 178–209. [Google Scholar]
- Didelez, V. , & Sheehan, N. (2007). Mendelian randomization as an instrumental variable approach to causal inference. Statistical Methods in Medical Research, 16(4), 309–330. [DOI] [PubMed] [Google Scholar]
- Engle, R. F. , Hendry, D. F. , & Richard, J.‐F. (1983). Exogeneity. Econometrica: Journal of the Econometric Society, 51, 277–304. [Google Scholar]
- Farrar, D. E. , & Glauber, R. R. (1967). Multicollinearity in regression analysis: The problem revisited. The Review of Economic and Statistics, 49, 92–107. [Google Scholar]
- Frautschy, S. A. , & Cole, G. M. (2010). Why pleiotropic interventions are needed for Alzheimer’s disease. Molecular Neurobiology, 41(2‐3), 392–409. [DOI] [PMC free article] [PubMed] [Google Scholar]
- Friedman, J. , Hastie, T. , & Tibshirani, R. (2001). The elements of statistical learning, 1(No. 10 [Google Scholar]
- Frost, B. , Jacks, R. L. , & Diamond, M. I. (2009). Propagation of tau misfolding from the outside to the inside of a cell. Journal of Biological Chemistry, 284(19), 12845–12852. [DOI] [PMC free article] [PubMed] [Google Scholar]
- Graham, M. H. (2003). Confronting multicollinearity in ecological multiple regression. Ecology, 84(11), 2809–2815. [Google Scholar]
- Grapentine, T. (2000). Path analysis vs. structural equation modeling. Marketing Research, 12(3), 12. [Google Scholar]
- Greenland, S. (2003). Quantifying biases in causal models: Classical confounding vs collider‐stratification bias. Epidemiology, 14(3), 300–306. [PubMed] [Google Scholar]
- Grewal, R. , Cote, J. A. , & Baumgartner, H. (2004). Multicollinearity and measurement error in structural equation models: Implications for theory testing. Marketing Science, 23(4), 519–529. [Google Scholar]
- Hansen, L. P. , Heaton, J. , & Yaron, A. (1996). Finite‐sample properties of some alternative gmm estimators. Journal of Business & Economic Statistics, 14(3), 262–280. [Google Scholar]
- Hardy, J. A. , & Higgins, G. A. (1992). Alzheimer’s disease: The amyloid cascade hypothesis. Science, 256(5054), 184–185. [DOI] [PubMed] [Google Scholar]
- Herukka, S.‐K. , Helisalmi, S. , Hallikainen, M. , Tervo, S. , Soininen, H. , & Pirttilä, T. (2007). Csf aβ 42, tau and phosphorylated tau, apoe e4 allele and mci type in progressive mci. Neurobiology of Aging, 28(4), 507–514. [DOI] [PubMed] [Google Scholar]
- Inoue, A. , & Solon, G. (2010). Two‐sample instrumental variables estimators. The Review of Economics and Statistics, 92(3), 557–561. [Google Scholar]
- Iturria‐Medina, Y. , Sotero, R. , Toussaint, P. , Mateos‐Pérez, J. , Evans, A., & ADNI et al. (2016). Early role of vascular dysregulation on late‐onset Alzheimer’s disease based on multifactorial data‐driven analysis. Nature Communications, 7. [DOI] [PMC free article] [PubMed] [Google Scholar]
- James, G. , Witten, D. , Hastie, T. , & Tibshirani, R. (2013). An introduction to statistical learning (Vol. 112). Springer. [Google Scholar]
- Jiang, Y. , Scott, A. J. , & Wild, C. J. (2006). Secondary analysis of case‐control data. Statistics in Medicine, 25(8), 1323–1339. [DOI] [PubMed] [Google Scholar]
- Kang, H. , Zhang, A. , Cai, T. T. , & Small, D. S. (2016). Instrumental variables estimation with some invalid instruments and its application to mendelian randomization. Journal of the American Statistical Association, 111(513), 132–144. [Google Scholar]
- Lawlor, D. A. , Harbord, R. M. , Sterne, J. A. C. , Timpson, N. , & Davey Smith, G. (2008). Mendelian randomization: Using genes as instruments for making causal inferences in epidemiology. Statistics in Medicine, 27(8), 1133–1163. [DOI] [PubMed] [Google Scholar]
- Lin, D. Y. , & Zeng, D. (2009). Proper analysis of secondary phenotype data in case‐control association studies. Genetic Epidemiology, 33(3), 256–265. [DOI] [PMC free article] [PubMed] [Google Scholar]
- Lovell, M. C. (2008). A simple proof of the theorem. The Journal of Economic Education, 39(1), 88–91. [Google Scholar]
- Ludwig, J. , & Kling, J. R. (2007). Is crime contagious? The Journal of Law and Economics, 50(3), 491–518. [Google Scholar]
- Maruyama, M. , Arai, H. , Sugita, M. , Tanji, H. , Higuchi, M. , Okamura, N. , … Sasaki, H. (2001). Cerebrospinal fluid amyloid β 1–42 levels in the mild cognitive impairment stage of Alzheimer’s disease. Experimental Neurology, 172(2), 433–436. [DOI] [PubMed] [Google Scholar]
- Mueller, S. G. , Weiner, M. W. , Thal, L. J. , Petersen, R. C. , Jack, C. R. , Jagust, W. , & Beckett, L. (2005). Ways toward an early diagnosis in Alzheimer’s disease: The Alzheimer’s disease neuroimaging initiative (ADNI). Alzheimer's & Dementia, 1(1), 55–66. [DOI] [PMC free article] [PubMed] [Google Scholar]
- Natarajan, B. K. (1995). Sparse approximate solutions to linear systems. SIAM Journal on Computing, 24(2), 227–234. [Google Scholar]
- Palmer, T. M. , Thompson, J. R. , Tobin, M. D. , Sheehan, N. A. , & Burton, P. R. (2008). Adjusting for bias and unmeasured confounding in mendelian randomization studies with binary responses. International Journal of Epidemiology, 37(5), 1161–1168. [DOI] [PubMed] [Google Scholar]
- Shaw, L. M. , Vanderstichele, H. , Knapik‐Czajka, M. , Clark, C. M. , Aisen, P. S. , Petersen, R. C. , … Trojanowski, J. Q. (2009). Cerebrospinal fluid biomarker signature in Alzheimer’s disease neuroimaging initiative subjects. Annals of Neurology, 65(4), 403–413. [DOI] [PMC free article] [PubMed] [Google Scholar]
- Smith, G. D. , & Ebrahim, S. (2003). ‘Mendelian randomization’: Can genetic epidemiology contribute to understanding environmental determinants of disease? International Journal of Epidemiology, 32(1), 1–22. [DOI] [PubMed] [Google Scholar]
- Strittmatter, W. J. , & Roses, A. D. (1995). Apolipoprotein E and Alzheimer disease. Proceedings of the National Academy of Sciences of the United States of America, 92(11), 4725–4727. [DOI] [PMC free article] [PubMed] [Google Scholar]
- Sudlow, C. , Gallacher, J. , Allen, N. , Beral, V. , Burton, P. , Danesh, J. , … Collins, R. (2015). Uk biobank: An open access resource for identifying the causes of a wide range of complex diseases of middle and old age. PLOS Medicine, 12(3), e1001779. [DOI] [PMC free article] [PubMed] [Google Scholar]
- Sunderland, T. , Linker, G. , Mirza, N. , Putnam, K. T. , Friedman, D. L. , Kimmel, L. H. , … Cohen, R. M. (2003). Decreased β‐amyloid1‐42 and increased tau levels in cerebrospinal fluid of patients with Alzheimer disease. Journal of the American Medical Association, 289(16), 2094–2103. [DOI] [PubMed] [Google Scholar]
- Sunderland, T. , Mirza, N. , Putnam, K. T. , Linker, G. , Bhupali, D. , Durham, R. , … Cohen, R. M. (2004). Cerebrospinal fluid β ‐amyloid1–42 and tau in control subjects at risk for alzheimer's disease: The effect of apoe ε4 allele. Biological Psychiatry, 56(9), 670–676. [DOI] [PubMed] [Google Scholar]
- Tapsoba, J. D. , Kooperberg, C. , Reiner, A. , Wang, C.‐Y. , & Dai, J. Y. (2014). Robust estimation for secondary trait association in case‐control genetic studies. American Journal of Epidemiology, 179(10), 1264–1272. [DOI] [PMC free article] [PubMed] [Google Scholar]
- Tchetgen Tchetgen, E. J. (2013). A general regression framework for a secondary outcome in case–control studies. Biostatistics, 15(1), 117–128. [DOI] [PMC free article] [PubMed] [Google Scholar]
- Tchetgen Tchetgen, E. J. , Walter, S. , & Glymour, M. M. (2013). Commentary: Building an evidence base for mendelian randomization studies: Assessing the validity and strength of proposed genetic instrumental variables. International Journal of Epidemiology, 42(1), 328–331. [DOI] [PMC free article] [PubMed] [Google Scholar]
- Thaler, R. H. (1988). Anomalies: The winner’s curse. The journal of Economic Perspectives, 2(1), 191–202. [Google Scholar]
- Tofallis, C. (1999). Model building with multiple dependent variables and constraints. Journal of the Royal Statistical Society: Series D (The Statistician), 48(3), 371–378. [Google Scholar]
- Wang, J. , & Zivot, E. (1998). Inference on structural parameters in instrumental variables regression with weak instruments. Econometrica, 66, 1389–1404. [Google Scholar]
- Wehby, G. L. , Ohsfeldt, R. L. , & Murray, J. C. (2008). ‘Mendelian randomization’ equals instrumental variable analysis with genetic instruments. Statistics in Medicine, 27(15), 2745–2749. [DOI] [PMC free article] [PubMed] [Google Scholar]
- Wooldridge, J. M. (2015). Introductory econometrics: A modern approach. Nelson Education.
Associated Data
This section collects any data citations, data availability statements, or supplementary materials included in this article.
Supplementary Materials
Supporting information


