Abstract
Heterodimeric interaction specificity between two DNA strands, and between protein and DNA, is often achieved by varying side chains or bases coming off the protein or DNA backbone -- for example, the bases participating in Watson-Crick base pairing in the double helix, or the side chains of protein contacting DNA in TALEN-DNA complexes. This modularity enables the generation of an essentially unlimited number of orthogonal DNA-DNA and protein-DNA heterodimers. In contrast, protein-protein interaction specificity is often achieved through backbone shape complementarity 1, which is less modular and hence harder to generalize. Coiled coil heterodimers are an exception, but the restricted geometry of interactions across the heterodimer interface (primarily at the heptad a and d positions 2) limits the number of orthogonal pairs that can be created simply by varying sidechain interactions 3,4. Here we demonstrate that heterodimeric interaction specificity can be achieved using extensive and modular buried hydrogen bond networks. We used the Crick generating equations 5 to produce millions of four helix backbones with varying degrees of supercoiling around a central axis, identified those accommodating extensive hydrogen bond networks, and used Rosetta to connect pairs of helices with short loops and optimize the remainder of the sequence. 65 of 97 such designs expressed in E. coli formed constitutive heterodimers, and crystal structures of four designs were in close agreement with the computational models and confirmed the designed hydrogen bond networks. In cells, a set of six heterodimers were found to be fully orthogonal, and in vitro, following mixing of 32 chains from sixteen heterodimer designs, denaturation in 5M GdnHCl and reannealing, the vast majority of the interactions observed by native mass spectrometry were between the designed cognate pairs. The ability to design orthogonal protein heterodimers should enable sophisticated protein based control logic for synthetic biology, and illustrates that nature has not fully explored the possibilities for programmable biomolecular interaction modalities.
Orthogonal sets of protein-protein and protein-peptide interactions play important roles in biological systems 6. Creation of new specificities starting from naturally occuring interacting proteins, such as toxin/antidote pairs 7, by sequence redesign has been difficult, often resulting in promiscuous binding 8; the natural specificity results at least in part from complementary variation in backbone conformation 9. Orthogonal sets of 2–4 interacting coiled coil pairs have been created and experimentally validated 10,11, including the widely used SYNZIPs 12–18, but interaction promiscuity has again hampered the design of larger orthogonal sets.
Guided by the example of the DNA double helix, we hypothesized that large sets of designed heterodimers could be generated by incorporating asymmetric buried hydrogen bond networks into regularly repeating backbone structures. We generated helical bundle heterodimers in which each monomer is a helix-turn-helix starting from four-helix backbones produced using a generalization of the Crick coiled coil parameterization 5,19. For each of the four helices, we exhaustively sampled the helical phase (Δɸ1), supercoil radius (R) and offset along the Z-axis (Z offset) (Fig. 1a), restricting the supercoil phases of the helices to 0, 90, 180 and 270 degrees, and the supercoil twist (ω0) and helical twist (ω1) to the ideal values for either a two layer left handed super coil (ω0=−2.85 and ω1=102.85), or a 5 layer untwisted bundle (ω0=0 and ω1=100) (Extended Data Fig. 1a–d) 20. This yielded 27 million untwisted and 60 million left-handed supercoiled backbones for both parallel and antiparallel orientations of opposing helices (Fig. 1b, Extended Data Fig. 1g).
Fig. 1. Modular heterodimer design.
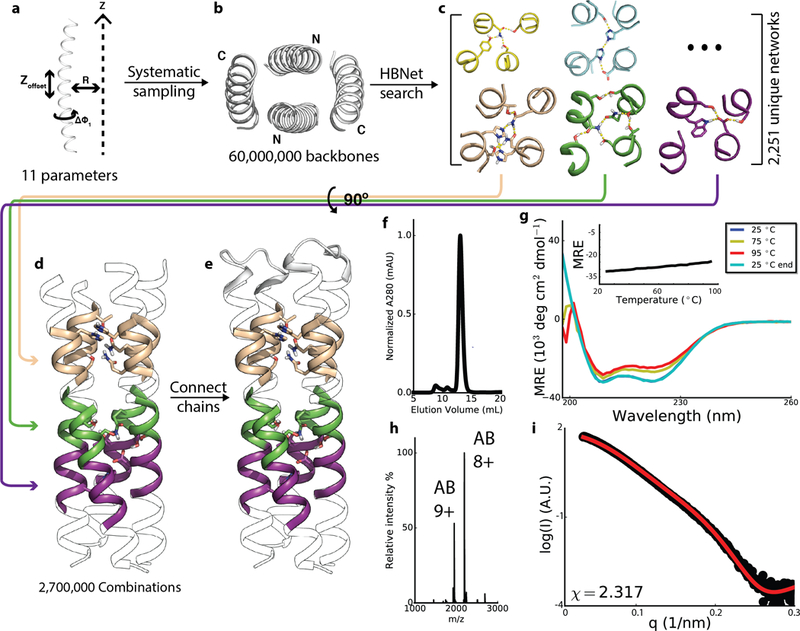
a, Individual helix generation: the helical phase (Δɸ1), supercoil radius (R) and offset along the Z-axis (Z offset) were exhaustively sampled; a total of 11 free parameters since there is no z offset for the first helix. b, Top-down view of the parallel twisted backbone. c, Representative hydrogen bond networks identified using HBNet. d, Matches of multiple HBNet containing heptads to a single full length backbone. e, Addition of loops to connect the 4 helices into two helix hairpins. f-i, SEC trace, CD spectra and (inset) temperature melt, native MS spectrum and SAXS (black, experimental SAXS data; red, spectra computed from the designed backbones) profile of the design DHD37_ABXB. Experiments were performed once.
To identify the modular hydrogen bond network equivalents to DNA base pairs, we used Rosetta HBNet 21 to design buried hydrogen bond networks in the central repeat units of each backbone, and obtained 2251 hydrogen bond networks involving at least 4 side chain residues with all heavy-atom donors and acceptors participating in hydrogen bonds, and connecting all 4 helices (Fig. 1c; Extended Data Fig. 2, Supplementary Table 1). We then identified all of the geometrically compatible placements of these hydrogen bond networks in each backbone (Fig. 1d), selected backbones accommodating at least two networks, and connected pairs of helices with short loops (Fig. 1e). Low energy sequences were identified using RosettaDesign 22 calculations in which the hydrogen bond networks were held fixed. Designs with fully satisfied hydrogen bond networks and tight hydrophobic packing were selected for experimental characterization, excluding those with networks with C2 symmetry to disfavor homodimerization of monomers (Extended Data Fig. 1e,f). Designed heterodimers (DHDs) are referred to by numbers with monomers labeled a or b; for example, DHD15_a refers to monomer “a” of design DHD15.
94 of the 97 selected designs (Supplementary Table 2) were well-expressed in E. coli with both monomers co-purifying by Ni-affinity chromatography (only one monomer contains a hexahistidine tag; Supplementary Table 3). For 85/94, the dominant species observed in size exclusion chromatography (SEC) had the expected size (Fig. 1f). 39 of the 85 were exclusive heterodimers at 15uM by native mass spectrometry (MS) 23,24 (Fig. 1h), 13 were heterodimers with a minor population of hetero-tetramers, and 13 formed heterodimers with one (but never both) monomer also present as a homodimer arising from unbalanced expression in E coli (Supplementary Table 4–6). Native MS experiments with serially diluted samples suggest the DHDs have affinities in the nanomolar range (Supplementary Table 7). Three designs characterized by CD spectroscopy were found to be all alpha helical and stable at 95°C (Fig. 1g, Extended Data Fig. 3).
We explored the extent to which the heterodimer set could be expanded by permuting the hydrogen bond networks in the different helical repeat units, and by permuting the backbone connectivity. Assigning each unique network a letter, DHD37_XBBA indicates a variant where the second, third and fourth repeat units have hydrogen bond networks B, B, and A, and the first heptad has exclusively hydrophobic residues in the core, while DHD103_1:423 indicates a heterodimer where one monomer consists of the first helix of DHD103 and the other monomer consists of helices 2 through 4 (Extended Data Fig. 4). 13 of 14 hydrogen bond network permuted variants and 9 of 10 “3+1” backbone-permuted heterodimers (generated from five starting “2+2” heterodimers) ran as single peaks on SEC and were constitutive heterodimers by native MS (Supplementary Table 8–9). Using the hydrogen bond network permutation approach we were also able to generate a set of four orthogonal homodimers (Fig. 3g–i, Extended Data Fig. 5, Supplementary Table 10).
Fig. 3. New functionality from DHD combinations.
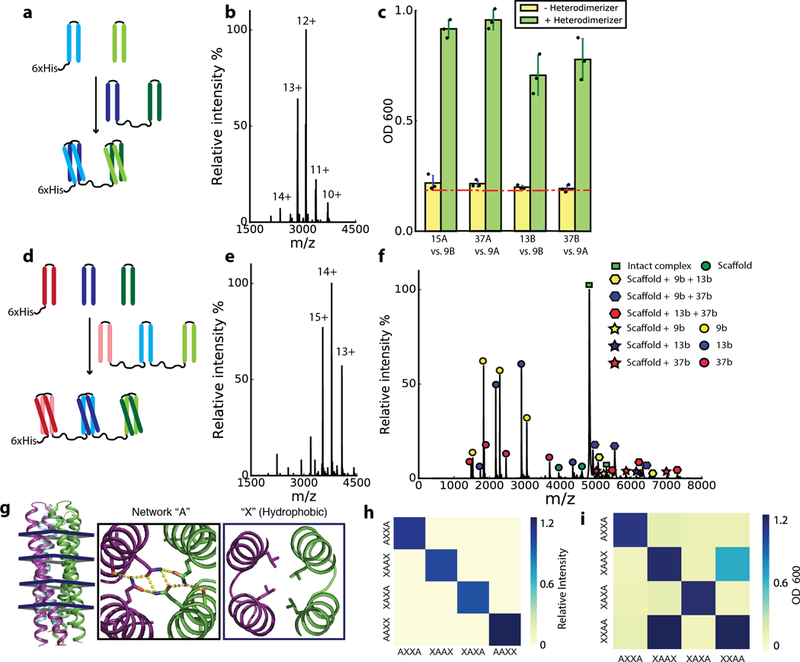
a, Induced dimerizer formed from “b” component of DHD13_XAAA (dark blue) fused to “b” component of DHD37_ABXB (dark green) with an intervening flexible linker. The “a” components of the two heterodimers (light blue and light green) are brought into close proximity by the heterodimerizer. b, Native MS of purified DHD13_XAAA:DHD37_ABXB heterotrimer complex, no heterodimers or monomers were observed. c, Y2H data on 4 induced dimerization systems. Yellow, without heterodimerizer fusion; green, with heterodimerizer fusion. Red dashed line indicates background growth with unfused AD and DBD. Data are mean ± s.d. from 3 biological repeats. d, 9_a (pink), 13_XAAA_a (light blue) and 37_ABXB_a (light green) were covalently linked to form a scaffold, recruiting 9_b (red, hexahistidine tagged), 13_XAAA_b (dark blue) and 37_ABXB_b (dark green). e, Native MS of purified scaffold complex; no heterotrimers, heterodimers or monomers were observed. f, SID of the +11 peak in e, no cross binding between b monomers is detected. g, Backbone of 2L4HC2_23 can accommodate hydrogen bond networks at 4 heptad positions. h, Native MS mixing data of 4 variants generated by hydrogen bond network shuffling; the interactions are orthogonal. i, Y2H data of 4 hydrogen bond shuffling variants. Two biologically independent experiments (b, e, f, h, i) were performed.
SAXS spectra collected for 44 designs that were constitutive heterodimers by native MS were consistent with the design models (Fig. 1i, Fig. 2f–g, Extended Data Fig. 6, Supplementary Table 11). The NMR structure of DHD13_XAAA closely matches the design model: the RMSD over all mainchain α carbon (Cα) atoms is 2 Å between the designed structure and the lowest-energy NMR model (Fig. 2e). The X-ray crystal structures of DHD131, DHD37_1:234, DHD127 and DHD15 had backbone Cα atom RMSDs to the design models ranging from 0.95 to 1.7 Å. The extensive five-residue buried hydrogen bond network of DHD131 (involving two serines, an asparagine, a tyrosine, and a tryptophan) is nearly identical in the crystal structure, with an additional water molecule bridging the interactions (Fig. 2a). The two designed hydrogen bond networks in DHD37_1:234, which contain buried histidine and tyrosine aromatic side chains sterically disfavoring homodimers, are in close agreement with the crystal structure (Fig. 2b). In DHD127, the histidines in the two hydrogen bond networks adopt a rotamer different from the design model (Fig. 2c), making a hydrogen bond with a water molecule. A crystal structure of DHD15 at pH 7.0 is similar to the design model (Fig. 2d), while a structure at pH 6.5 is of a domain-swapped, hetero-tetramer conformation; native MS at pH 6.5 suggests that the designed heterodimer, rather than the heterotetramer, is dominant in solution (Extended Data Fig. 7a–c).
Fig. 2. Structural characterization of designed heterodimers.
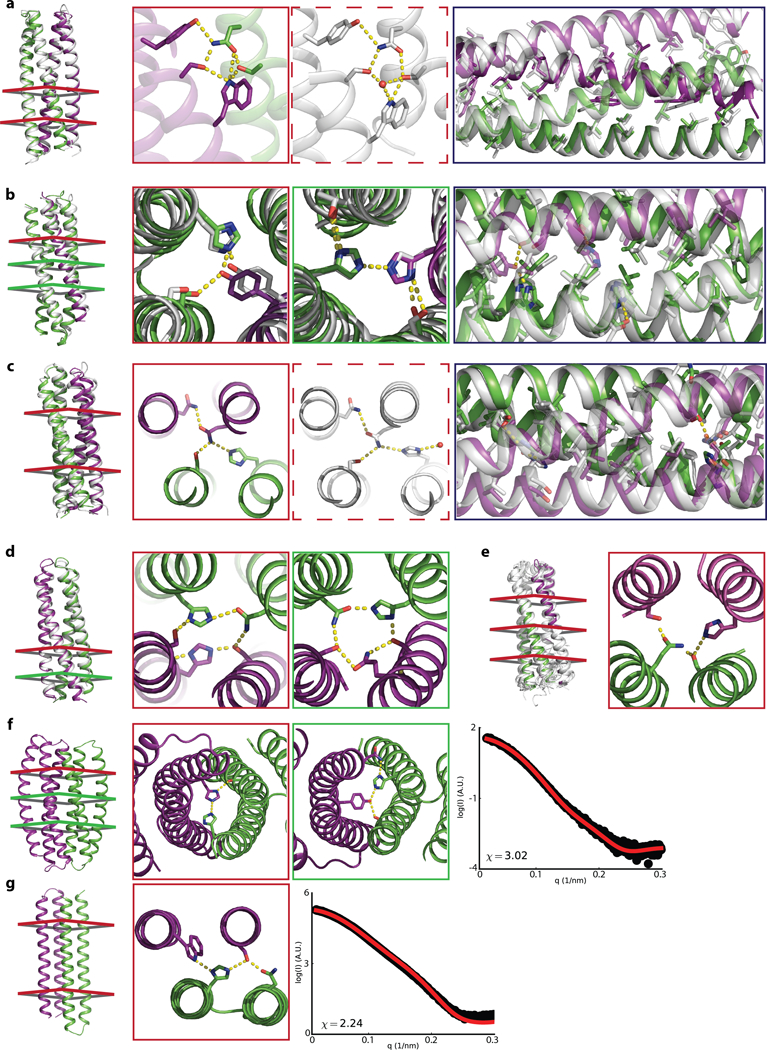
(a-e) Crystal and NMR structures (white) superimposed on design models with monomers colored green and purple; colored cross-sections on backbones (left) indicate locations of designed hydrogen-bond networks (middle panels). Solid and dashed red boxes compare networks in design model and crystal structure. Black boxes compare overall hydrophobic packing. a, DHD_131, 2.4 Å resolution with 1.0 Å Cα RMSD. b, DHD37_1:234, 3.3 Å resolution with 1.4 Å RMSD. c, DHD_127, 1.8 Å resolution with 1.7 Å RMSD. d, DHD_15, 3.4 Å resolution with 0.9 Å RMSD; hydrogen bond networks were not well resolved. e, NMR ensemble (white) of DHD13_XAAA superimposed onto the design model, the assigned sidechain-sidechain NOEs were not sufficient to define hydrogen bond networks. f-g, DHD_39 and DHD_120 backbones and designed hydrogen bond networks. Experimental SAXS data (black) are similar to spectra computed from the designed backbones (red).
We built three induced dimerization systems by fusing one monomer each from two different heterodimers via a flexible linker, and testing whether the remaining two monomers from each pair could be brought together by the fusion (Fig. 3a). In each case, the three components copurified by Ni-NTA chromatography (one monomer has a hexahistidine tag), and native MS showed they formed constitutive heterotrimers (Fig. 3b); no partial complexes (heterodimers) were observed. Surface induced dissociation (SID) mass spectrometry 25,26 resulted in binary complexes consisting of the heterodimerizer bound to either one of the monomers (Supplementary Table 12–13), indicating that the interaction between monomers is mediated by the dimerizer fusion. In yeast two-hybrid assays (Y2H) with monomers from two different heterodimers fused to the DNA binding domain (DBD) and transcriptional activation domain (AD), expression of the heterodimerizer fusion as a separate polypeptide chain increased signal significantly over background (Fig. 3c).
We covalently linked the monomer chain “a” subunits of 3 DHDs via flexible linkers (Fig. 3d), and co-expressed this “scaffold” 27 and the 3 separate chain “b” monomers, one with a hexahistidine tag, in E. coli. Native MS of purified sample revealed a heterotetramer of all 4 proteins (Fig. 3e), with surface induced dissociation producing subcomplexes consisting of the scaffold with 1 or 2 of the 3 chain “b” monomers bound (Fig. 3f); no association between chain “b” monomers was detected. The scaffold plus monomer assembly is stable at 95°C and has a guanidine denaturation midpoint of 4 M (Extended Data Figure 7h–i).
By generating interfaces with many polar groups which are energetically costly to bury without geometrically matched hydrogen bonding interactions, our design protocol implicitly disfavors non-cognate interactions (explicit negative design to disfavor non-cognate interactions is computationally intractable given the very large number of possible off-target binding modes). For 24 designs, strong interactions were observed by Y2H with the two partners fused to DBD and AD, but not when either partner was fused to both domains; the designed heterodimers, but not the homodimers, form in cells (Fig. 4a). The 24 monomers in 12 of these designs were crossed in an all-by-all Y2H experiment; interactions were observed for all cognate pairs, and 27 of the 552 possible non-cognate interactions (Extended Data Fig. 8). Orthogonality was higher for an 8 DHD subset: of 240 possible non-cognate interactions, only 4 were observed (Fig. 4b; the interacting polar residues are depicted schematically in Extended Data Fig. 9 ). Coexpression of unfused monomers eliminated off-target interactions (Fig. 4c); the cognate interactions are evidently stronger than the non-cognate interactions.
Fig. 4. All-against-all orthogonality assessment.
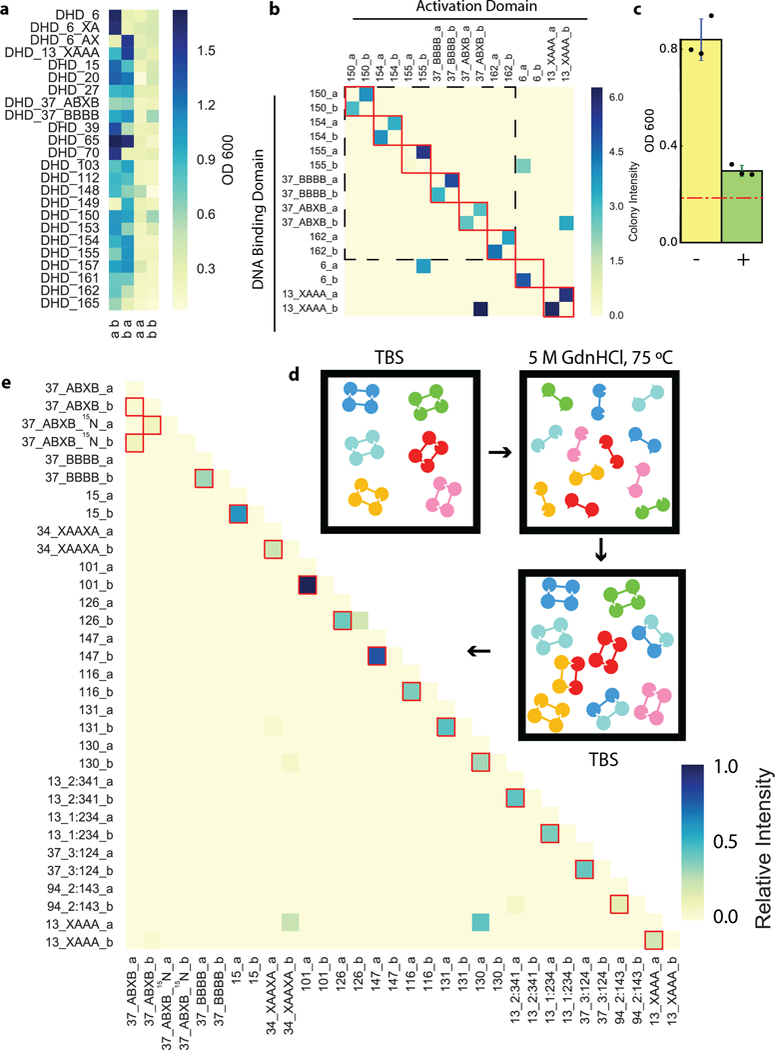
a, Y2H for 21 heterodimers show heterodimer formation with little homodimer formation. First letter at bottom indicates monomer fused to AD, second letter, to DBD. b, Y2H all by all testing of 9 pairs of heterodimers, colors indicate growth. Red boxes indicate designed cognate heterodimer pairs, dashed black box indicates a set of 6 orthogonal heterodimers. c, Off-target binding of DHD15_a and DHD13_XAAA_b, in the absence (yellow) or presence (green) of DHD15_b and DHD13_XAAA_a. Data are mean ± s.d.. Red dashed line indicates background growth with unfused AD and DBD. d-e, All-against-all orthogonality of 16 pairs of heterodimers assessed by native MS mixing assay. Red boxes indicate designed cognate pairs. Exchange of non- and partially 15N-labeled DHD37_ABXB results in a distribution of overlapped species with low individual signal intensities. 2 (a, b) or 3 (c) biologically, or 3 (e) technically independent experiments were performed.
To probe all-by-all interaction specificity of the designed monomers when allowed to associate freely in a single pot, purified DHDs were mixed, denatured in 5M GdnHCl at 75°C (Fig. 4d), and allowed to reanneal by dialysis. An 15N-labeled variant was added as a control for subunit exchange under denaturing conditions; the hybrid labeled/non labeled complexes expected if full exchange was taking place were observed in all cases (Extended Data Fig. 10). The resulting mixture was analyzed by online ion exchange chromatography coupled to high-resolution native MS (Supplementary Table 14). Sixteen designs (15 unique pairs and the 15N-labeled control) with the highest cognate specificity were pooled together. The native MS results on the 32-chain mixture are quite striking (Fig. 4e). All 16 designed pairs were recovered, and of the 512 non-cognate binary complexes possible, only 6 were observed. No trimers or higher-order oligomers were observed. Several of the orthogonal pairs were generated using the hydrogen bond network shuffling and backbone permutation approaches: the orthogonality of the former is due to positioning of the hydrogen bond networks as the backbone is fixed, and the orthogonality of the latter, to the connectivity of the chain as the sequence is identical. The differences in orthogonality observed in the native MS mixing and Y2H experiments arise because the former reports on relative affinity (all monomers are present, and only the lowest energy complexes form) and the latter, on absolute affinity (only two monomers are present at a time).
Our results demonstrate that the domain of unbounded sets of orthogonal heterodimeric biomolecules constructed from a single repeating backbone is not limited to nucleic acids. Interaction specificity arises from extensive buried hydrogen bond networks such as the fully connected TYR-SER-TRP-ASN-SER crystallographically confirmed network in Fig. 2a, and heterogeneity in the size of the residues at the designed interface (Extended Data Fig. 8d–i), analogous to the contribution of steric effects to Watson-Crick base pairing specificity. The power of native MS for determining interaction specificity in complex mixtures is highlighted by the 32 chain mixing experiment in Fig. 4e; of the large number of possible oligomeric complexes that can be formed from these chains (528 two chain species, 5984 three chain species, etc), only the 15 designed heterodimers and 6 off target interactions are observed. The relatively simple encoding of specificity in DNA gave birth to a broad spectrum of new technology, from DNA origami 28 to artificial circuits 29. Our large set of orthogonal interactions, together with the retention of specificity in the fused monomer systems (the induced dimerizer and scaffold of Fig. 3), and the interaction strength hierarchy illustrated by the cognate interaction competition experiment (Fig. 4c), open the door to protein based cellular control circuits with faster response times and better integration with signalling inputs and outputs than current nucleic acid based circuitry.
Methods
Computational Design
1. Systematic sampling of parametric helical backbones
We used a generalization of the Crick coiled-coil parameters 5 to independently sample all four helices of the heterodimers supercoiled around the same axis, as described previously 19–21. The supercoil twist (ω0) and helical twist (ω1) were coupled and ideal values were used 20 with ω0 and ω1 held constant among the helices. A left-handed supercoil results from ω0=−2.85 and ω1=102.85, and a straight bundle with no supercoiling from ω0=0 and ω1=100. The supercoil phases (Δɸ0) for the helices were fixed at 0°, 90°, 180° and 270°, respectively. The offset along the Z-axis (Z offset) for the first helix was fixed to 0 as a reference point, with the rest of the helices independently sampling from −1.51 Å to 1.51 Å, with a step size of 1.51 Å. All helices sampled helical phases (Δɸ1) independently, from 0° to 90°, with a step size of 10°. Two of the helices with a Δɸ0 separation of 180° sampled the radius from Z-axis (R) from 5 Å to 8 Å, while the other two sampled from 7 Å to 10 Å, all with a step size of 1 Å. Each helix is set to have 35 residues to accomodate 5 heptad repeats. After removing redundant sample points from the overlapping regions of radii sampling, the supercoiled helical bundles contained more than 60 million unique backbones, and the straight helical bundles contained more than 27 million unique backbones.
2. HBNet Search
For each parametrically generated backbone, HBNet 21 was used to search the middle heptad for hydrogen bond networks that connect all four helices, contain at least four side chains contributing hydrogen bonds, have all heavy atom donors and acceptors satisfied, and span the intermolecular interface. Symmetry was not enforced during the HBNet search. For buried interface positions, only non-charged polar amino acids were considered; for residues that were at the boundary between protein core and surface, all polar amino acids were considered. A subsequent Rosetta design calculation was performed to optimize hydrophobic packing, with atom pair restraints from HBNet being put on the newly identified hydrogen bond networks. Finally, a minimization step and side chain repacking step was performed without atom pair restraints on hydrogen bonding residues to evaluate how well the networks remained intact in the absence of the constraints. Designs with at most 5 alanines in the middle heptad and no buried unsatisfied polar heavy atoms were selected for downstream design.
3. Generating combinations of HBNets with heptad stacking
The purpose of this step is to identify five-heptad backbones (full backbones) that can accommodate at least 2 HBNets. Instead of generating one-heptad backbones and full backbones separately, searching for HBNets in the one-heptad backbones and aligning them to all full backbones, we reasoned the heptad stacking method remains the same if one simply searches for HBNets in the middle heptad on all full backbones, extracts the middle heptads, and aligns them to all full backbones. We therefore extracted the middle heptads containing HBNets, generated all variants of chain ordering, and did pairwise alignment of middle heptads to full backbones using TMalign 30. All alignments with root mean square deviation (RMSD) less than 0.3 were identified and full backbones that can accommodate at least 2 middle heptads were selected for final design.
4. Connecting parametric helical backbones
Helical backbones are connected with short 2–5 residue loops such that the RMSD of each loop is less than 0.4 RMSD to a nine residues stretch in a native protein. Distance and directionality between helices limit what loops can connect, as such, our closure extends and shrinks helices by up to 3 residues. We then superimpose all short loops from the PDB onto the first and last two helical residues. The loops with the lowest stub-RMSD are minimized using the Rosetta score function onto the helical endpoints to ensure a near perfect closure. Loop quality is assessed by measuring the distance in RMSD to the closest nine stretch in the PDB. The loop with the lowest RMSD is returned as the solution. We repeat this procedure to connect all helices and report the solution with the lowest RMSD.
5. Design calculations
Backbones were regularized using Cartesian space minimization in Rosetta to alleviate any torsional strain introduced by heptad stacking. Two consecutive Rosetta packing rounds were performed with increasing weight on the repulsive energy to optimize hydrophobic packing, while constraining the hydrogen bond network residues. A FastDesign step was subsequently used within a generic Monte Carlo mover to optimize secondary structure shape complementarity, while allowing at most 8% alanine, 3 methionine and 3 phenylalanine in the protein core. The last step of minimization and side chain repacking to identify the movement of HBNets without atom pair constraints is the same as what was described in Step 2.
6. Selection criteria and metrics used to evaluate designs
Designs were selected based on the following criteria: change in polar surface area upon binding (dSASA_polar) greater than 800 Å; secondary structure shape complementarity (ss_sc) score greater than 0.65; holes score around HBNets less than −1.4; no buried unsatisfied heavy atoms; at least one buried bulky polar side chains per monomer. Selected designs were then visually inspected for good packing of hydrophobic side chains, especially the interdigitation of isoleucine, leucine and valine. Surface tyrosines were added at non-interfering positions to aid protein concentration measurement by recording OD280. Surface charge residues for a few of the designs were redesigned to shift the theoretical isoelectric point away from buffer pH.
RMSD calculations
Crystal structures and the corresponding design models were superimposed with TMalign using all heavy atoms. From this alignment, RMSD was calculated across all alpha-carbon atoms, and also across heavy atoms of the hydrogen bond network residues.
Logistic Regression
Designs were first scored with various filters in Rosetta with the filter values reported. Experimental results and Rosetta filter values were used as input to a logistic regression method 31 to find correlations between computational metrics and experimental observations.
Visualization and figures
All structural images for figures were generated using PyMOL 32.
Buffer and media recipe
TBM-5052
1.2% [wt/vol] tryptone, 2.4% [wt/vol] yeast extract, 0.5% [wt/vol] glycerol, 0.05% [wt/vol] D-glucose, 0.2% [wt/vol] D-lactose, 25 mM Na2HPO4, 25 mM KH2PO4, 50 mM NH4Cl, 5 mM Na2SO4, 2 mM MgSO4, 10 μM FeCl3, 4 μM CaCl2, 2 μM MnCl2, 2 μM ZnSO4, 400 nM CoCl2, 400 nM NiCl2, 400 nM CuCl2, 400 nM Na2MoO4, 400 nM Na2SeO3, 400 nM H3BO3
Lysis buffer
20 mM Tris, 300 mM NaCl, 20 mM Imidazole, pH 8.0 at room temperature
Wash buffer
20 mM Tris, 300mM NaCl, 30 mM Imidazole, pH 8.0 at room temperature
Elution buffer
20 mM Tris, 300 mM NaCl, 250 mM Imidazole, pH 8.0 at room temperature
Buffer W
100 mM Tris-HCl pH 8.0, 150 mM NaCl and 1 mM EDTA
Buffer E
Buffer W containing 2.5 mM D-desthiobiotin
TBS buffer
20 mM Tris pH 8.0, 100 mM NaCl
Construction of synthetic genes
For the expression of heterodimers, both monomers were encoded in the same plasmid, separated by a ribosome binding sequence (GAAGGAGATATCATC). Synthetic genes were ordered from Genscript Inc. (Piscataway, N.J., USA) and delivered in pET21-NESG E. coli expression vector, inserted between the NdeI and XhoI sites. For the pET21-NESG constructs, a hexahistidine tag and a tobacco etch virus (TEV) protease cleavage site (GSSHHHHHHSSGENLYFQGS) were added in frame at the N-terminus of the second monomer. A stop codon was introduced at the 3’ end of the second monomer to stop expression of the C-terminal hexahistidine tag in the vector. For purification with Strep-tactin resin, a streptavidin tag (SAWSHPQFEKGGGSGGGSGGSAWSHPQFEKSGENLYFQGS) coding sequence was cloned in frame 5’ of the first monomer sequence.
For the co-expression of 3 and 4 proteins from the same plasmid (induced dimerization and synthetic scaffold designs), synthetic genes were cloned in the pRSFDuet-1 expression vector. The first (in the case of 3 proteins) or first two (in the case of 4 proteins) genes were cloned between NcoI and HindIII sites, with a ribosome binding site separating the 2 proteins in the latter case.The last two genes were cloned between NdeI and XhoI sites, separated by a ribosome binding site. A hexahistidine tag and a TEV protease cleavage site coding sequence were cloned in frame 5’ of the last gene.
Genes for yeast-two-hybrid (Y2H) studies were cloned into plasmids bearing the GAL4 transcription activation domain (poAD) and the GAL4 DNA-binding domain (poDBD).
Protein expression
Plasmids were transformed into chemically competent E. coli expression strains BL21(DE3)Star (Invitrogen) or Lemo21(DE3) (New England Biolabs) for protein expression. Single colonies were picked from agar plates following transformation and growth overnight, and 5 ml starter cultures were grown at 37°C in Luria-Bertani (LB) medium containing 100 μg/mL carbenicillin (for pET21-NESG vectors) or kanamycin (for pRSFDuet-1 vectors) with shaking at 225 rpm for 18 hours at 37°C. Starter cultures were diluted into 500 ml TBM-5052 containing 100 μg/mL carbenicillin or kanamycin, and incubated with shaking at 225 rpm for 24 hours at 37°C.
For expression of 13C15N- or 15N-labeled protein, the plasmids were transformed into the Lemo21(DE3) E. coli expression strain and plated on M9/glucose plates containing 50 μg/mL carbenicillin. For the starter culture, a single colony was used for inoculation of 50 mL LB medium with 50 μg/mL carbenicillin in a 250 mL baffled flask, and incubated with shaking at 225 rpm for 18 hours at 37°C. 10 mL of the starter culture was then transferred to a 2 L baffled flask containing 500 mL of Terrific Broth (Difco), with 25 mM Na2HPO4, 25 mM KH2PO4, 50 mM NH4Cl, 5 mM Na2SO4, and 100 μg/mL carbenicillin. The culture was grown at 37°C to an OD600 of approximately 1.0, then centrifuged at 5000 rcf for 15 minutes to pellet the cells. The Terrific Broth medium was removed, and the cells were washed briefly with 30 mL of phosphate buffered saline (PBS). The cells were then transferred to a fresh 2 L baffled flask containing 500 mL of labeled media (25 mM Na2HPO4, 25 mM KH2PO4, 50 mM 15NH4Cl, 5 mM Na2SO4, 0.2% (w/v) 13C glucose), and 100 μg/mL carbenicillin. The cells were allowed to grow at 37°C for 2 hours, before IPTG (Carbosynth) was added to 1mM and the temperature was reduced to 18°C. The labeled glucose and NH4Cl were obtained from Cambridge Isotopes.
Affinity purification
Cells were harvested by centrifugation for 15 minutes at 5000 rcf at 4°C and resuspended in 20 ml lysis buffer. Lysozyme, DNAse, and EDTA-free cocktail protease inhibitor (Roche) were added to the resuspended cell pellet before sonication at 70% power for 5 minutes. For Immobilized metal affinity chromatography (IMAC), lysates were clarified by centrifugation at 4°C and 18,000 rpm for at least 30 minutes and applied to Ni-NTA (Qiagen) columns pre-equilibrated with lysis buffer. The column was washed two times with 5 column volumes (CV) of wash buffer, followed by 5 CV of elution buffer buffer. For Strep tag purification, elution fractions from IMAC were applied to Strep-Tactin® Superflow resin (IBA) pre-equilibrated in Buffer W. The column was washed with 5 CV Buffer W, before applying 3 CV Buffer E to elute proteins off the column. Mass and purity of eluted proteins were confirmed using electrospray ionization mass spectrometry (ESI-MS) on a Thermo Scientific TSQ Quantum Access mass spectrometer.
Size-exclusion chromatography (SEC)
N-terminal hexahistidine tags and streptavidin tags were cleaved with TEV protease overnight at room temperature, at a ratio of 1 mg TEV for 100 mg of protein. Prior to addition of TEV, buffer was exchanged into lysis buffer. After TEV cleavage, sample was passed over an additional Ni-NTA column and washed with 1.5 CV of lysis buffer, flow through were collected and further purified by SEC using a Superdex 75 10/300 increase column (GE Healthcare) in TBS buffer.
Circular dichroism (CD) measurements
CD wavelength scans (260 to 195 nm) and temperature melts (25 to 95°C) were performed using an AVIV model 420 CD spectrometer. Temperature melts were carried out at a heating rate of 4°C/min and monitored by the change in ellipticity at 222 nm; protein samples were diluted to 0.25 mg/mL in PBS pH 7.4 in a 0.1 cm cuvette. Guanidinium chloride (GdmCl) titrations were performed on the same spectrometer with automated titration apparatus in PBS pH 7.4 at 25°C, with a protein concentration of 0.025 mg/mL in a 1 cm cuvette with stir bar. Each titration consisted of at least 40 evenly distributed GdmCl concentration points with one minute mixing time for each step. Titrant solution consisted of the same concentration of protein in PBS + GdmCl.
Nuclear Magnetic Resonance (NMR)
SEC purified 13C15N-labeled protein was concentrated to >1 mM and buffer exchanged into 50 mM NaCl, 20 mM sodium phosphate, 10% D2O, 0.01% NaN3 at pH 6.3. Sample was loaded into a 5.0 mm Shigemi tube and 4 NMR experiments were recorded and analyzed: 2D-TROSY-HSQC, 4D HNCH NOESY, 4D HNCH TOCSY and 4D HCCH NOESY. The data were acquired with a non-uniform sampling scheme (NUS) and subsequently reconstructed with the SMILE program in nmrPipe. For the NOESY experiments, the mixing time was 120 ms and for the NUS protocol the data was recorded with 0.3% and 3.0% of sparsity for the HNCH and HCCH experiments, respectively. The final spectra were loaded and analyzed on Sparky 3.115.
The spin systems were identified based on supervised NMR data analysis and 148 residues were successfully assigned (93.67% ). The completeness in terms of protons assigned was 87.4% (Table S4). For the structural determination, 3423 peaks were extracted from the NOESY data. 24 long-range contacts (|i-j|>4) were manually assigned with the 4D HNCH NOESY experiment and 29 in 4D HCCH. Due to the lack of stereospecific assignments (ambiguous data) the NOE contacts were considered as non-stereospecific assignments for the methyl groups of Leu and Val residues. Those contacts were principally located at the beginning, center and end of both sequences. The assignments, chemical shifts and proton-proton constraints were used for the RASREC or AutoNoe structural calculations in ROSETTA 3. Summaries of refinement statistics are provided in Supplementary Table 16.
Crystallization of protein samples
Purified protein samples were concentrated to approximately 20 mg/ml in 25 mM Tris pH 8.0 and 150 mM NaCl. Samples were screened with a 5-position deck Mosquito crystal (ttplabtech) with an active humidity chamber, utilizing the following crystallization screens: JCSG+ (Qiagen), Crystal Screen (Hampton Research), PEG/Ion (Hampton Research), PEGRx HT (Hampton Research), Index (Hampton Research) and Morpheus (Molecular Dimensions). The optimal conditions for crystallization of the different designs were found as follows: OPHD_37_N3C1, 0.15 M potassium bromide and 30% w/v polyethylene glycol monomethyl ether 2000; OPHD_127, 0.12 M ethylene glycols, 0.1 M buffer system 3 pH 8,5, and 50% v/v precipitate mix 1 from the Morpheus screen; OPHD_15, 0.2 M Ammonium sulfate, 0.1 M BIS-TRIS pH 6.5, 18% v/v Polyethylene glycol 400; OPHD_15, 0.1 M Imidazole pH 7.0, and 25% v/v Polyethylene glycol monomethyl ether 550; OPHD_131, 0.2 M Ammonium acetate, 0.1 M HEPES pH 7.5, 25% w/v Polyethylene glycol 3,350. Crystals were obtained after 1 to 14 days by the hanging drop vapor diffusion method with the drops consisting of a 1:1, 2:1 and 1:2 mixture of protein solution and reservoir solution.
X-ray data collection and structure determination
The crystals of the designed proteins were looped and placed in the corresponding reservoir solution, containing 20% (v/v) glycerol if the reservoir solution did not contain cryoprotectant, and flash-frozen in liquid nitrogen. The X-ray data sets were collected at the Advanced Light Source at Lawrence Berkeley National Laboratory with beamlines 8.2.1 and 8.2.2. Data sets were indexed and scaled using either XDS 33 or HKL2000 34. Initial models were generated by the molecular-replacement method with the program PHASER 35 within the Phenix software suite 36, using the design models as the initial search models. Efforts were made to reduce model bias through refinement with simulated annealing using Phenix.refine 37, or, if the resolution was sufficient, by using Phenix.autobuild 38 with rebuild-in-place set to false, simulated annealing and prime-and-switch phasing. Iterative rounds of manual building in COOT 39 and refinement in Phenix were used to produce the final models. Due to the high degree of self-similarity inherit in coiled-coil-like proteins, datasets for the reported structures suffered from a high degree of pseudo translational non-crystallographic symmetry, as report by Phenix.Xtriage, which complicated structure refinement and may explain the higher than expected R values reported. RMSDs of bond lengths, angles and dihedrals from ideal geometries were calculated with Phenix 36. The overall quality of all final models was assessed using the program MOLPROBITY 40. Summaries of diffraction data and refinement statistics are provided in Supplementary Table 17.
Small Angle X-ray Scattering (SAXS)
Samples were purified by SEC in 25 mM Tris pH 8.0, 150 mM NaCl and 2% glycerol; fractions preceding the void volume of the column were used as blanks for buffer subtraction. Scattering measurements were performed at the SIBYLS 12.3.1 beamline at the Advanced Light Source. The X-ray wavelength (λ) was 1.27 Å, and the sample-to-detector distance was 1.5 m, corresponding to a scattering vector q (q = 4π sin θ/λ, where 2θ is the scattering angle) range of 0.01 to 0.3 Å−1. A series of exposures, in equal sub-second time slices, were taken of each well: 0.3 second exposures for 10 seconds resulting in 32 frames per sample. For each sample, data was collected for two different concentrations to test for concentration-dependent effects; “low” concentration samples ranged from 2–3 mg/mL and “high” concentration samples ranged from 5–7 mg/mL. Data was processed using the SAXS FrameSlice online serve and analyzed using the ScÅtter software package 41,42. FoXS 43,44 was used to compare design models to experimental scattering profiles and calculate quality of fit (χ) values.
Yeast two-hybrid assay
For each pair of binders tested, chemically competent cells of yeast strain PJ69–4a (MATa trp1–901 leu2–3,112 ura3–52 his3–200 gal4(deleted) gal80(deleted) LYS2::GAL1-HIS3 GAL2-ADE2 met2::GAL7-lacZ) were transformed with the appropriate pair of plasmids containing DNA binding domain or activation domains, using the LiAc/SS carrier DNA/PEG method 45. In the case of induced dimerization, the heterodimerizer was cloned downstream of one of the “monomer proteins”, separated by a p2a and nuclear locolization sequence (GSGATNFSLLKQAGDVEENPGPGDKAELIPEPPKKKRKVELGTA). The p2a sequence ensures translational cleavage to make the heterodimerizer a separate protein from the “monomer protein”. The selection of transformed yeast cells was performed in synthetic dropout (SDO) media lacking tryptophan and leucine for 48 hours with shaking at 1000 rpm at 30°C. The resulting culture was diluted 1:100 and grown for 16 hours in fresh SDO media lacking tryptophan and leucine, before transferring to a 96 well plate and diluted 1:100 into SDO media containing 100 mM 3-Amino-1,2,4-triazole (3-AT), lacking tryptophan, leucine and histidine (5 mM 3-AT in the case of induced dimerization). The culture was incubated with shaking at 1000 rpm at 30°C. Since bringing the DNA binding domain and the transcription activation domain into proximity is necessary for the growth of yeast cells in media lacking histidine, binding of two proteins was indicated by the growth of yeast cells 46,47. The optical density of yeast cells was recorded after 48 hours. For Y2H assay on agar plates, the 1:100 diluted overnight culture was transferred onto Nunc™ OmniTray™ (Thermo Fisher) using a 96 Solid Pin Multi-Blot Replicator (V&P Scientific), with the agar lacking tryptophan, leucine and histidine, and containing 100 mM 3-AT. The plates were imaged daily until Day 5 to monitor the sizes of colonies. Images were analyzed by the ColonyArea 48 package on ImageJ.
Native MS assessment of heterodimer affinity
Samples were buffer exchanged into 200 mM ammonium acetate using Micro Bio-Spin 6 columns (Bio-Rad). Protein concentrations were determined spectroscopically by a NanoDrop 2000c (Thermo Fisher Scientific). After dilution with 200 mM ammonium acetate, proteins were allowed to equilibrate for 24h at 4 ⁰C. Mass spectra were subsequently recorded by nanoESI-MS using an Exactive Plus EMR Orbitrap instrument (Thermo Fisher Scientific) modified to incorporate a quadrupole mass filter and allow surface-induced dissociation 25,26,49.
Native MS of individual heterodimers
Sample purity and integrity were first analyzed using a self-packed buffer exchange column 50 (P6 polyacrylamide gel, BioRad, Hercules CA), coupled online to an Exactive Plus EMR Orbitrap instrument (Thermo Fisher Scientific) modified to incorporate a quadrupole mass filter and allow surface-induced dissociation. For online buffer-exchange, 200 mM ammonium acetate, pH 6.8 (AmAc) was used as a mobile phase. Samples that showed specific dimer formation and a good correlation with the theoretical monomer/dimer masses were selected for mixing experiments.
Native MS mixing assay and data analysis
In the mixing experiment, heterodimers were mixed in equimolar ratio of 10 uM. Guanidine hydrochloride (GdnHCl) was added to a final concentration of 5M and the mixture was incubated at 75 ⁰C for 30 min to ensure complete denaturation. To allow for the relative quantification of exchanged species, a control mixing experiment was performed where the denaturation and refolding steps were omitted. The mixtures were then dialyzed against 150 mM AmAc solution for refolding and subsequent formation of protein protein interactions. 8 μL of sample was injected on a ProPac WCX-10 column and separately, a ProPac WAX-10 column (Thermo Scientific) and separated using a Dionex UltiMate 3000 HPLC (Thermo Scientific) by a salt gradient elution from 20 mM AmAc to 1000 mM AmAc over a period of 55 min. The eluting proteins were detected online by a modified Exactive Plus EMR Orbitrap mass spectrometer. LC-MS analysis was performed for mixtures in full MS mode (no collision voltage applied) and all-ion fragmentation (MSMS) mode with high energy collision-induced dissociation (HCD) 100 V and surface-induced dissociation (SID) 85 V, respectively (manuscript in preparation). Details on instrument settings are in Supplementary Table 15. Data were deconvoluted using Xcalibur™ (Thermo Scientific), UniDec 51 and Intact Mass™ (Protein Metrics 52). The detailed deconvolution parameters are listed in Supplementary Table 15. The deconvoluted mass lists from Intact Mass™ were searched against a theoretical mass list of all possible monomers to tetramers combinations. Only one trimeric species was found, which corresponds to the cognate 13_XAAA_b + 13_2:341_a + 13_1:234_a hetero-trimer formation, which constitutes the 13_XAAA design with the two helices of its “a” monomer coming from 13_2:341_a and 13_1:234_a. Dimers were identified based on the full MS runs and MSMS runs with both subunits being detected at the same retention time. The mass tolerance was set to 2 Da and intensity tolerance was set to 1% of the highest intensity. The relative intensity was calculated using the equation
where is the relative intensity of a dimer identified in the mixing experiment. is the intensity of the species in the run involving denaturation and refolding. and are the intensity of the cognate pairs and in the run that skipped denaturation and refolding. The native MS mixing workflow is shown in Extended Data Fig. 10.
Native MS of higher-order hetero-oligomers
Samples were buffer exchanged into 200 mM ammonium acetate using Micro Bio-Spin 6 columns (Bio-Rad). 20% (v/v) 200 mM triethylammonium acetate (Sigma) was added for charge-reduction. Surface-induced dissociation (SID) was performed on an in-house modified SYNAPT G2 HDMS (Waters Corporation) with an SID device incorporated between a truncated trap travelling wave ion guide and the ion mobility cell 25. The following instrument parameters were used: sampling cone, 20 V; extraction cone, 2 V; source temperature, 20 °C; trap gas flow, 2 mL/min; trap bias, 45V. The SID settings are listed in Supplementary Table 15.
Extended Data
Extended Data Fig. 1. Overview of different topologies designed.
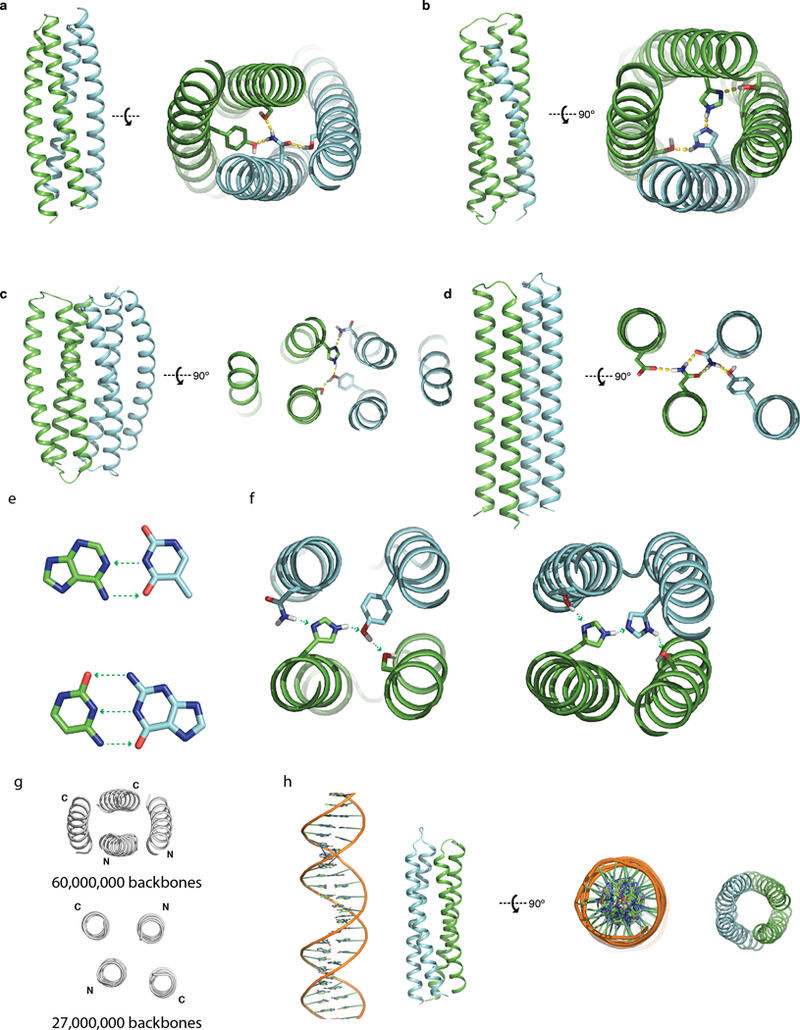
a-d, Overall topology on the left and example HBNets on the right. a, A left-handed supercoil backbone, with each monomer being helix hairpins. b, A backbone permuted “3+1” design, one monomer is a single helix and the other is a three helix bundle. c, A left-handed supercoil backbone, with each monomer being a three helix bundle. d, A straight, untwisted backbone, with each monomer being helix hairpins. e, Hydrogen bond pairing in DNA bases. Top, A-T pairing. Bottom, C-G base pairing. Green arrows point from hydrogen bond donors to acceptors. f, Hydrogen bond pairing in designed protein hydrogen bond networks. g, Top-down view of antiparallel twisted (top) and parallel untwisted (bottom) backbones sampled in this study. h, Comparing a designed protein heterodimer with B-form DNA on the same scale.
Extended Data Fig. 2. Example HBNets resulting from the systematic search.
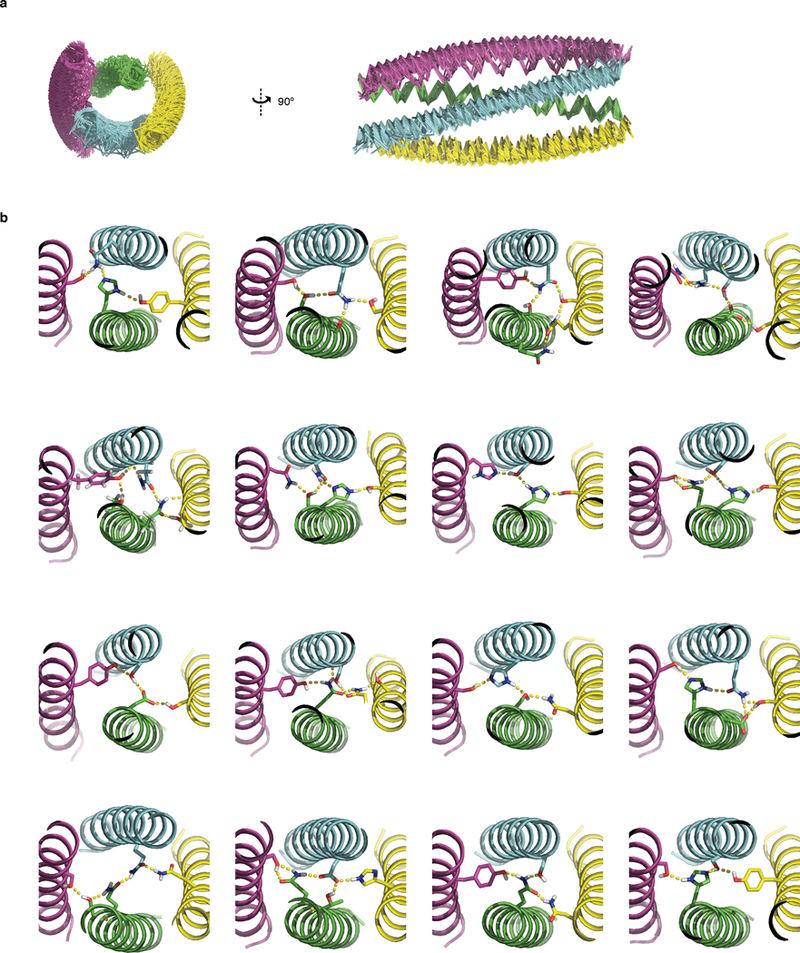
a, Overlay of 50 backbones with different Crick parameters for each helix. b, Example hydrogen bond networks from the systematic search, each involving at least 4 residues and contacting all 4 helices.
Extended Data Fig. 3. Thermal and chemical denaturation of DHDs.
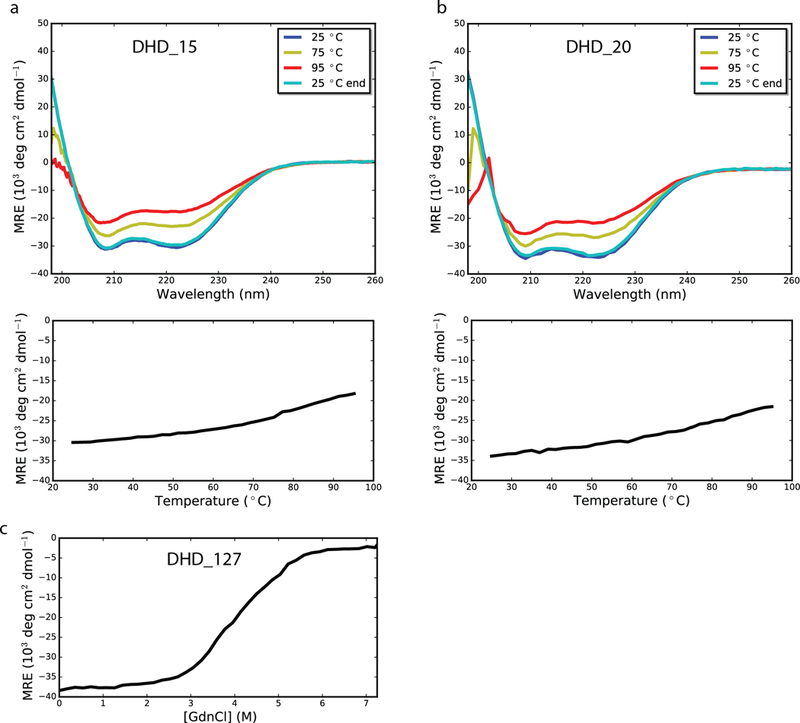
a-b, CD spectra for thermal denaturation of DHD_15 and DHD_20, respectively. Top, wavelength scan at 25°C, 75°C, 95°C, and final 25°C. Designs were alpha helical and stable up to 95°C. Bottom, CD temperature melts, monitoring absorption at 222 nm as temperature was increased from 25°C to 95°C. c, GdnHCl denaturation of DHD_127 by CD monitoring absorption at 222 nm. All CD experiments were performed once.
Extended Data Fig. 4. Backbone and hydrogen bond network permutations.
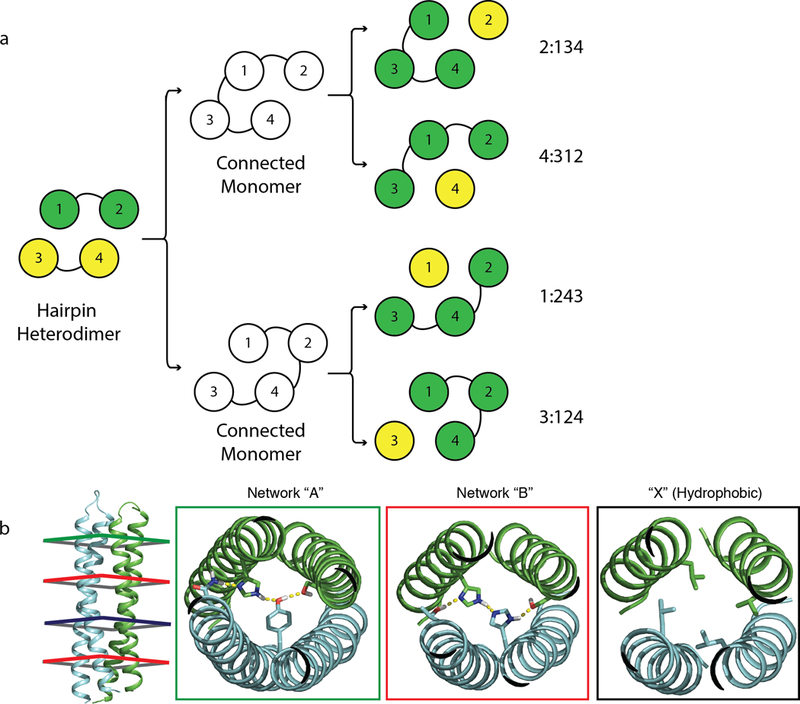
a, On a 2+2 backbone (left), two loops were designed to connect the 4 helices into a single monomer in 2 different ways (middle), after which 4 different cut points were introduced to generate 4 possible backbone permuted heterodimers of a single helix and a three helix bundle (3+1 heterodimers, right). For example, 2:134 refers to a heterodimer where the original helix 2 is a single helix, and helices 1, 3, and 4 were connected into a 3 helix bundle. b, Hydrogen bond network permutation. Each unique network was assigned a letter (Networks “A” and “B” in this case), and with the hydrophobic packing assigned X. The backbone on the left reads “ABXB”, with its first heptad accommodates network “A”, its second and fourth heptad accommodate network “B”, and its third heptad accommodates hydrophobic packing only.
Extended Data Fig. 5. Biophysical characterization of hydrogen bond network permuted homodimers.
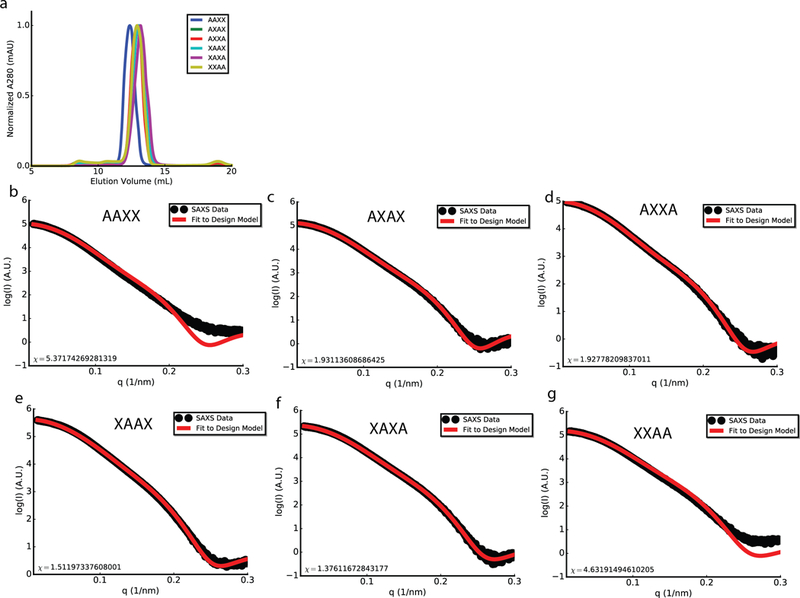
a, SEC traces of all 6 homodimer designs. b-g, SAXS profiles of hydrogen bond network permuted homodimer designs. Black, experimental SAXS data; red, spectra computed from the designed backbones. 2 (a) or 1 (b-g) biologically independent repeats were performed.
Extended Data Fig. 6. SAXS profiles of all tested DHDs.
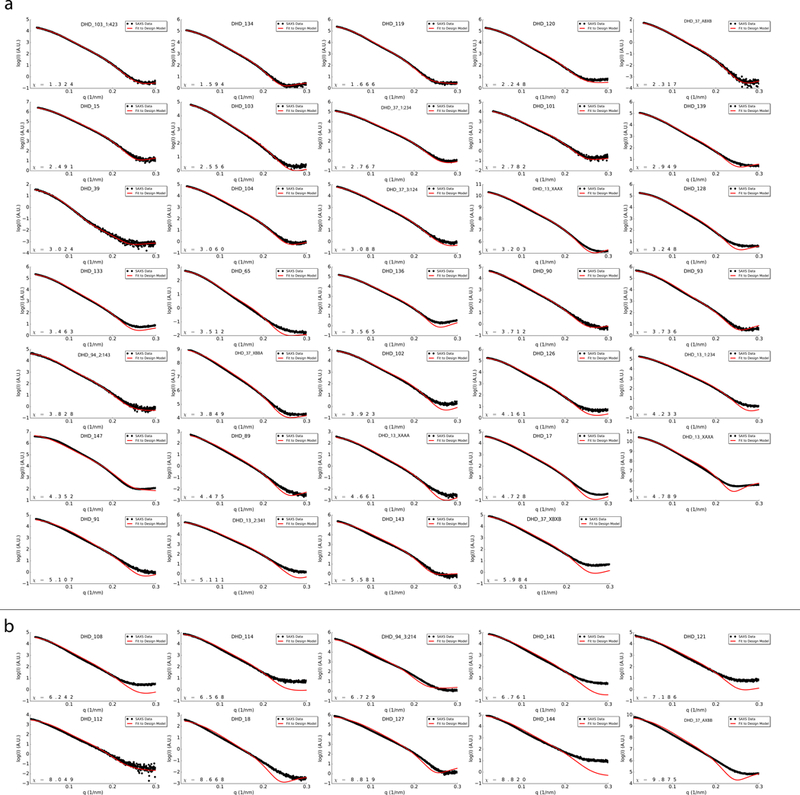
Black, experimental SAXS data; red, spectra computed from the designed backbones. a, SAXS profiles with χ values smaller than 6. b, SAXS profiles with χ values greater than 6. All tested designs showed close agreement to expected radius of gyration (Rg) and maximum distance (dmax).
Extended Data Fig. 7. Crystal structure of the domain swapped DHD_15 and biophysical characterization of higher order oligomers.
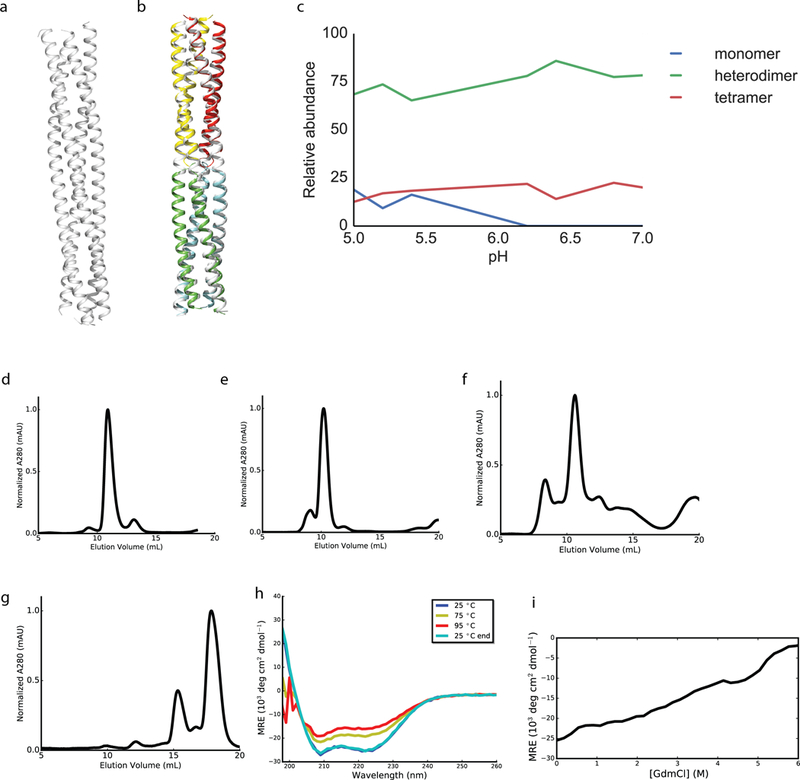
a, Crystal structure of DHD_15 at pH 6.5, with 2.25 Å resolution. b, Superposition of design models in color onto both halves of the crystal structure in white, with backbone RMSD of 1.83 Å. c, Native MS study of DHD_15 at different pH indicates the heterodimers, rather than heterotetramers, are dominant in solution. d-g, SEC traces of the induced dimerization DHD_9–13 fusion, DHD_15–37 fusion, DHD_13–37 fusion, and the scaffolding complex in Fig. 3d (the peak at around 15 mL corresponds to the fully assembled complex, followed by a peak representing excess of individual components). h, CD thermal melt curves for the scaffolding complex in Fig. 3d. Wavelength scan was performed at 25°C, 75°C, 95°C, and final 25°C. Design was alpha helical and stable up to 95°C. i, CD chemical denaturation profile of the scaffolding complex in Fig. 3d. 2 (c-g) or 1 (h-i) biologically independent repeats were performed.
Extended Data Fig. 8. Y2H all-against-all assay of 16 DHDs.
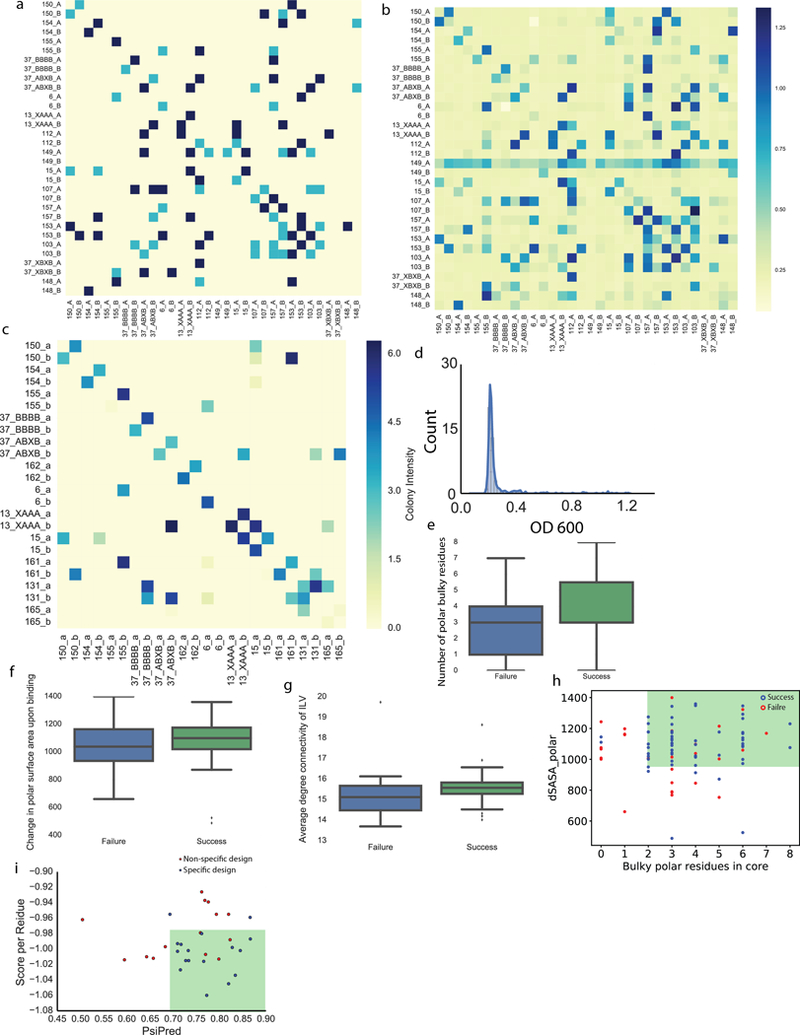
a, Y2H assay with cell growth on agar plates containing 100 mM 3-AT, lacking tryptophan, leucine and histidine. Plates were imaged at Day 5. Yellow, no growth on agar plates; light blue, weak growth forming non-circular colonies; dark blue, strong growth. b, Y2H result by growing yeast culture in liquid media containing 100 mM 3-AT, lacking tryptophan, leucine and histidine. OD 600 values were measured at Day 2 to evaluate cell growth. c, An additional set of DHDs tested by Y2H showing improved orthogonality. d, Distribution of OD 600 values for non-cognate interactions in b, the majority of cells grew to OD 600 values less than 0.4, indicating weak interactions for non-cognate binding. e-g, box plots of various properties for designs that assembled to off-target oligomeric states by native MS (failure) and that assembled into constitutive heterodimers (success). n=88, 25th, 50th and 75th percentiles are shown in the box with the center being median, extended to 1.5 ✕ IQR beyond the box. e, More buried bulky polar residues strongly correlates with design success. f, Successful designs tend to have bigger polar interface surface area. g, Designs with better hydrophobic packing (as reported by the Rosetta filter value Average Degree on Ile, Leu and Val residues) tend to have a higher chance of being constitutive heterodimers as assessed by native MS. h, Contribution of bulky residues and hydrogen bond networks to specific dimer formation. “dSASA_polar” measures interface hydrophilicity and positively correlates with the surface area of hydrogen bond networks at the interface. “Bulky polar residues in core” counts the total number of buried bulky residues that participate in hydrogen bond networks. Constitutive heterodimer formation (blue circles) or off-target oligomer formation (red circles) were determined with native MS. Filter cutoff values of dSASA_polar > 970 Å2 and more than 1 polar bulky residues buried in the core includes most of the successful designs while excludes most of design failures. i, Based on the Y2H data in b, all 32 monomers from the 16 pairs were categorized as being specific (blue, has fewer than or equal to 1 non-cognate binding), or non-specific (red, has more than 1 non-cognate binding). Applying secondary structure prediction scores (PsiPred 53) and Rosetta centroid energy score per residue as filters, designs with higher PsiPred values and lower Rosetta centroid score per residue are more specific (green box). Two (a-c) independent experiments were performed.
Extended Data Fig. 9. Hydrogen bond network sequence motifs of the set of 6 orthogonal pairs in Y2H experiments.
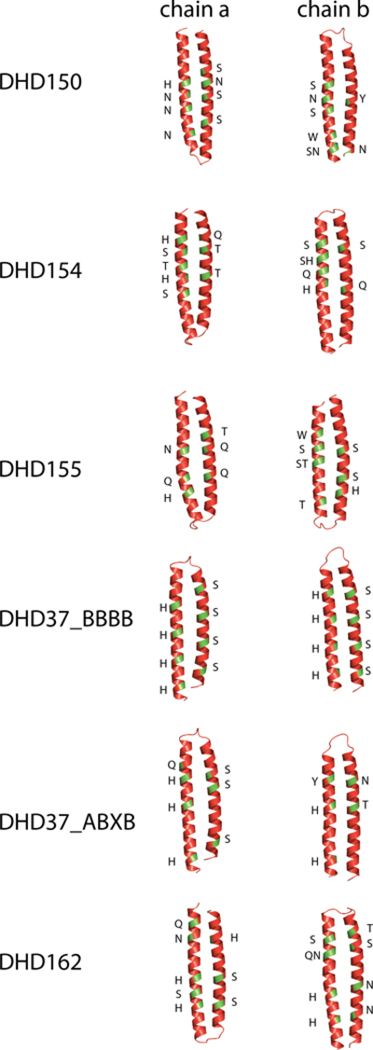
Green patches mark the location of hydrogen bond network forming residues on the backbones. Letters along the backbones indicate residue identities.
Extended Data Fig. 10. The workflow of Native MS mixing experiment.
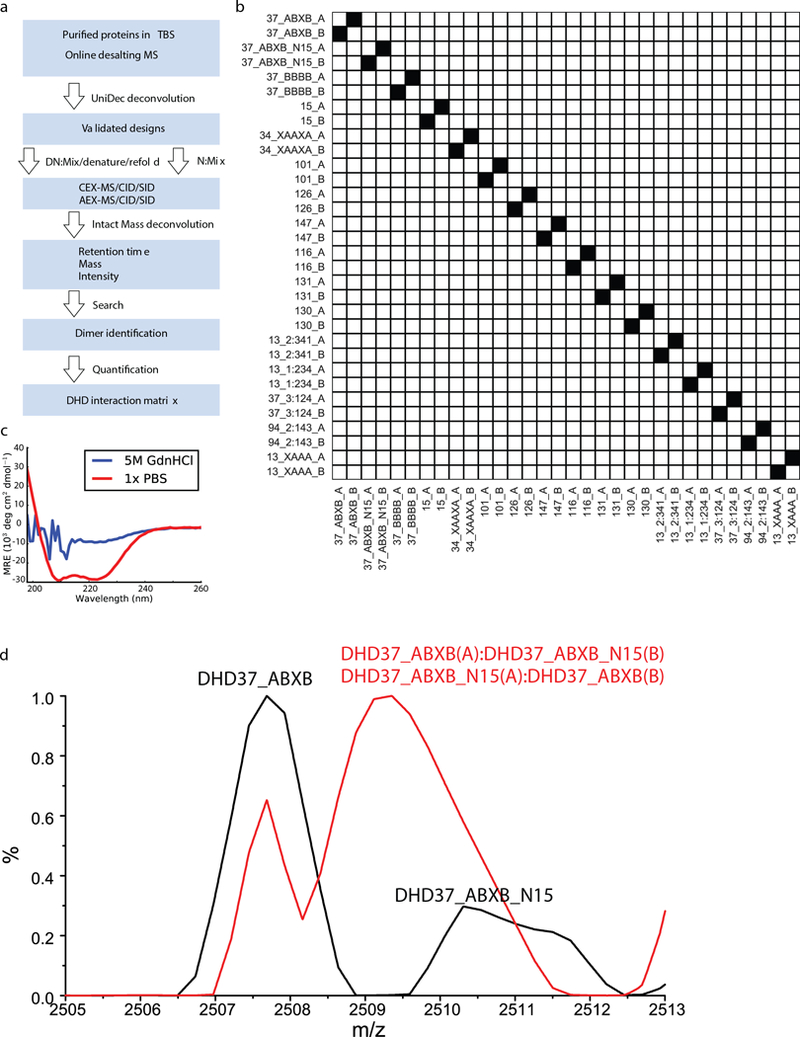
a, Protein samples were characterized using online-desalting coupled to native MS and deconvoluted using UniDec software. Proteins shown expected masses were mixed in equimolar ratio, and the final mix was divided into two parts: in the experimental group (DN), proteins were denatured by 5M GdnHCl at 75°C and refoled into 150mM AmAc; in the control mixing experiment (N), denaturation and refolding steps were omitted. Sample mixtures in each group was further equally divided into 3 parts and was individually injected on LC-MS with WCX and WAX respectively. LC-MS analysis was performed for mixtures in full MS mode and MSMS mode with HCD and SID, respectively. Data were deconvoluted using Intact Mass™. The deconvoluted mass lists from Intact Mass™ were searched against a theoretical mass list of all possible monomer, dimer, trimer and tetramer combinations. Dimers were identified based on the full MS runs and MSMS runs with both subunits being detected at the same retention time. b, In the control mixing experiment (N), after mixing all 16 proteins in solution without the denaturation and renaturation steps, no exchange among proteins were observed. c, CD data for a mixture of purified DHDs in PBS (red) or 5M GdnHCl and 75°C (blue). Protein mixture was fully denatured under the latter condition. d, A mixing experiment of DHD_37_ABXB and 15N labeled DHD_37_ABXB with (red) or without (black) the denaturation and refolding steps. MS peaks merged after subunit exchange due to the similarity in the masses of 15N labeled and unlabeled subunits. Two biologically independent experiments (b-d) were performed.
Supplementary Material
Acknowledegements
We thank Rosetta@Home volunteers for contributing computing resources, A. Kang for protein crystallization support; B. Sankaran for assistance with diffraction data collection; K. Lau and B. Groves for assistance with Y2H assays; S. Rettie for mass spectrometry support; S. Ovchinnikov for help with TMalign; M. Marty, M. Bern and A. Norris for assistance with native MS; S. Pennington for making media for Y2H assays; the SIBYLS mail-in SAXS program, supported by the DOE BER IDAT grant (DE-AC02-05CH11231) and ALS-ENABLE (P30 GM124169) for SAXS, and A. Keating, G. Rocklin and N. Woodall for feedback on the manuscript. Full list of funding and computing resources is listed in the supplementary information.
Footnotes
Code Availability
All program code is in Rosetta or can be downloaded from Github repository https://github.com/uagaug/DeNovoHeterodimers
Data Availability
Coordinates and structure files have been deposited to the Protein Data Bank with accession codes: 6DMP (DHD13_XAAA), 6DKM (DHD131), 6DCL (DHD37_1:234), 6DLM (DHD127), 6DMA (DHD15 heterodimer), 6DM9 (DHD15 heterotetramer). The native MS spectra generated and analysed during the current study are available at http://files.ipd.uw.edu/pub/de_novo_heterodimers_2018/180813_native_ms_raw.zip Raw X-ray diffraction images have been deposited at proteindiffraction.org. All source data are available upon request.
References
- 1.Jones S & Thornton JM Principles of protein-protein interactions. Proc. Natl. Acad. Sci. U. S. A. 93, 13–20 (1996). [DOI] [PMC free article] [PubMed] [Google Scholar]
- 2.Harbury PB, Zhang T, Kim PS & Alber T A switch between two-, three-, and four-stranded coiled coils in GCN4 leucine zipper mutants. Science 262, 1401–1407 (1993). [DOI] [PubMed] [Google Scholar]
- 3.Diss ML & Kennan AJ Orthogonal recognition in dimeric coiled coils via buried polar-group modulation. J. Am. Chem. Soc. 130, 1321–1327 (2008). [DOI] [PubMed] [Google Scholar]
- 4.Thomas F, Boyle AL, Burton AJ & Woolfson DN A set of de novo designed parallel heterodimeric coiled coils with quantified dissociation constants in the micromolar to sub-nanomolar regime. J. Am. Chem. Soc. 135, 5161–5166 (2013). [DOI] [PubMed] [Google Scholar]
- 5.Crick FHC The Fourier transform of a coiled-coil. Acta Cryst (1953). Q6, 685–689 [doi: 10.1107/S0365110X53001952] 6, 1–5 (1953). [DOI] [Google Scholar]
- 6.Zarrinpar A, Park S-H & Lim WA Optimization of specificity in a cellular protein interaction network by negative selection. Nature 426, 676–680 (2003). [DOI] [PubMed] [Google Scholar]
- 7.Aakre CD et al. Evolving new protein-protein interaction specificity through promiscuous intermediates. Cell 163, 594–606 (2015). [DOI] [PMC free article] [PubMed] [Google Scholar]
- 8.Joachimiak LA, Kortemme T, Stoddard BL & Baker D Computational design of a new hydrogen bond network and at least a 300-fold specificity switch at a protein-protein interface. J. Mol. Biol. 361, 195–208 (2006). [DOI] [PubMed] [Google Scholar]
- 9.Skerker JM et al. Rewiring the specificity of two-component signal transduction systems. Cell 133, 1043–1054 (2008). [DOI] [PMC free article] [PubMed] [Google Scholar]
- 10.Crooks RO, Baxter D, Panek AS, Lubben AT & Mason JM Deriving Heterospecific Self-Assembling Protein-Protein Interactions Using a Computational Interactome Screen. J. Mol. Biol. 428, 385–398 (2016). [DOI] [PMC free article] [PubMed] [Google Scholar]
- 11.Gradišar H & Jerala R De novo design of orthogonal peptide pairs forming parallel coiled-coil heterodimers. J. Pept. Sci. 17, 100–106 (2011). [DOI] [PubMed] [Google Scholar]
- 12.Thompson KE, Bashor CJ, Lim WA & Keating AE SYNZIP protein interaction toolbox: in vitro and in vivo specifications of heterospecific coiled-coil interaction domains. ACS Synth. Biol. 1, 118–129 (2012). [DOI] [PMC free article] [PubMed] [Google Scholar]
- 13.Reinke AW, Grant RA & Keating AE A synthetic coiled-coil interactome provides heterospecific modules for molecular engineering. J. Am. Chem. Soc. 132, 6025–6031 (2010). [DOI] [PMC free article] [PubMed] [Google Scholar]
- 14.Acharya A, Rishi V & Vinson C Stability of 100 homo and heterotypic coiled-coil a-a’ pairs for ten amino acids (A, L, I, V, N, K, S, T, E, and R). Biochemistry 45, 11324–11332 (2006). [DOI] [PubMed] [Google Scholar]
- 15.Grigoryan G & Keating AE Structure-based prediction of bZIP partnering specificity. J. Mol. Biol. 355, 1125–1142 (2006). [DOI] [PubMed] [Google Scholar]
- 16.Gonzalez L, Woolfson DN Jr & Alber T Buried polar residues and structural specificity in the GCN4 leucine zipper. Nat. Struct. Biol. 3, 1011–1018 (1996). [DOI] [PubMed] [Google Scholar]
- 17.Lumb KJ & Kim PS A buried polar interaction imparts structural uniqueness in a designed heterodimeric coiled coil. Biochemistry 34, 8642–8648 (1995). [DOI] [PubMed] [Google Scholar]
- 18.Tatko CD, Nanda V, Lear JD & DeGrado WF Polar Networks Control Oligomeric Assembly in Membranes. J. Am. Chem. Soc. 128, 4170–4171 (2006). [DOI] [PubMed] [Google Scholar]
- 19.Grigoryan G & DeGrado WF Probing Designability via a Generalized Model of Helical Bundle Geometry. J. Mol. Biol. 405, 1079–1100 (2011). [DOI] [PMC free article] [PubMed] [Google Scholar]
- 20.Huang P-S et al. High thermodynamic stability of parametrically designed helical bundles. Science 346, 481–485 (2014). [DOI] [PMC free article] [PubMed] [Google Scholar]
- 21.Boyken SE et al. De novo design of protein homo-oligomers with modular hydrogen-bond network-mediated specificity. Science 352, 680–687 (2016). [DOI] [PMC free article] [PubMed] [Google Scholar]
- 22.Leaver-Fay A et al. ROSETTA3: an object-oriented software suite for the simulation and design of macromolecules. Methods Enzymol. 487, 545–574 (2011). [DOI] [PMC free article] [PubMed] [Google Scholar]
- 23.Ruotolo BT & Robinson CV Aspects of native proteins are retained in vacuum. Curr. Opin. Chem. Biol. 10, 402–408 (2006). [DOI] [PubMed] [Google Scholar]
- 24.Sahasrabuddhe A et al. Confirmation of intersubunit connectivity and topology of designed protein complexes by native MS. Proc. Natl. Acad. Sci. U. S. A. 115, 1268–1273 (2018). [DOI] [PMC free article] [PubMed] [Google Scholar]
- 25.Zhou M, Huang C & Wysocki VH Surface-induced dissociation of ion mobility-separated noncovalent complexes in a quadrupole/time-of-flight mass spectrometer. Anal. Chem. 84, 6016–6023 (2012). [DOI] [PubMed] [Google Scholar]
- 26.Zhou M & Wysocki VH Surface induced dissociation: dissecting noncovalent protein complexes in the gas phase. Acc. Chem. Res. 47, 1010–1018 (2014). [DOI] [PubMed] [Google Scholar]
- 27.Anderson GP, Shriver-Lake LC, Liu JL & Goldman ER Orthogonal Synthetic Zippers as Protein Scaffolds. ACS Omega 3, 4810–4815 (2018). [DOI] [PMC free article] [PubMed] [Google Scholar]
- 28.Rothemund PWK Folding DNA to create nanoscale shapes and patterns. Nature 440, 297–302 (2006). [DOI] [PubMed] [Google Scholar]
- 29.Qian L & Winfree E Scaling up digital circuit computation with DNA strand displacement cascades. Science 332, 1196–1201 (2011). [DOI] [PubMed] [Google Scholar]
- 30.Zhang Y & Skolnick J TM-align: a protein structure alignment algorithm based on the TM-score. Nucleic Acids Res. 33, 2302–2309 (2005). [DOI] [PMC free article] [PubMed] [Google Scholar]
- 31.Rocklin GJ et al. Global analysis of protein folding using massively parallel design, synthesis, and testing. Science 357, 168–175 (2017). [DOI] [PMC free article] [PubMed] [Google Scholar]
- 32.Schrödinger LLC. The PyMOL Molecular Graphics System, Version 1.8. (2015). [Google Scholar]
- 33.Kabsch W XDS. Acta Crystallogr. D Biol. Crystallogr. 66, 125–132 (2010). [DOI] [PMC free article] [PubMed] [Google Scholar]
- 34.Otwinowski Z & Minor W Processing of X-ray diffraction data collected in oscillation mode. Methods Enzymol. 276, 307–326 (1997). [DOI] [PubMed] [Google Scholar]
- 35.McCoy AJ et al. Phaser crystallographic software. J. Appl. Crystallogr. 40, 658–674 (2007). [DOI] [PMC free article] [PubMed] [Google Scholar]
- 36.Adams PD et al. PHENIX: a comprehensive Python-based system for macromolecular structure solution. Acta Crystallogr. D Biol. Crystallogr. 66, 213–221 (2010). [DOI] [PMC free article] [PubMed] [Google Scholar]
- 37.Afonine PV et al. Joint X-ray and neutron refinement with phenix.refine. Acta Crystallogr. D Biol. Crystallogr. 66, 1153–1163 (2010). [DOI] [PMC free article] [PubMed] [Google Scholar]
- 38.Terwilliger TC et al. Iterative model building, structure refinement and density modification with the PHENIX AutoBuild wizard. Acta Crystallogr. D Biol. Crystallogr. 64, 61–69 (2008). [DOI] [PMC free article] [PubMed] [Google Scholar]
- 39.Emsley P & Cowtan K Coot: model-building tools for molecular graphics. Acta Crystallogr. D Biol. Crystallogr. 60, 2126–2132 (2004). [DOI] [PubMed] [Google Scholar]
- 40.Davis IW et al. MolProbity: all-atom contacts and structure validation for proteins and nucleic acids. Nucleic Acids Res. 35, W375–83 (2007). [DOI] [PMC free article] [PubMed] [Google Scholar]
- 41.Dyer KN et al. High-throughput SAXS for the characterization of biomolecules in solution: a practical approach. Methods Mol. Biol. 1091, 245–258 (2014). [DOI] [PMC free article] [PubMed] [Google Scholar]
- 42.Rambo RP & Tainer JA Characterizing flexible and intrinsically unstructured biological macromolecules by SAS using the Porod-Debye law. Biopolymers 95, 559–571 (2011). [DOI] [PMC free article] [PubMed] [Google Scholar]
- 43.Schneidman-Duhovny D, Hammel M & Sali A FoXS: a web server for rapid computation and fitting of SAXS profiles. Nucleic Acids Res. 38, W540–4 (2010). [DOI] [PMC free article] [PubMed] [Google Scholar]
- 44.Schneidman-Duhovny D, Hammel M, Tainer JA & Sali A Accurate SAXS profile computation and its assessment by contrast variation experiments. Biophys. J. 105, 962–974 (2013). [DOI] [PMC free article] [PubMed] [Google Scholar]
- 45.Schiestl RH & Gietz RD High efficiency transformation of intact yeast cells using single stranded nucleic acids as a carrier. Curr. Genet. 16, 339–346 (1989). [DOI] [PubMed] [Google Scholar]
- 46.Chien CT, Bartel PL, Sternglanz R & Fields S The two-hybrid system: a method to identify and clone genes for proteins that interact with a protein of interest. Proc. Natl. Acad. Sci. U. S. A. 88, 9578–9582 (1991). [DOI] [PMC free article] [PubMed] [Google Scholar]
- 47.Bartel PL, Roecklein JA, SenGupta D & Fields S A protein linkage map of Escherichia coli bacteriophage T7. Nat. Genet. 12, 72–77 (1996). [DOI] [PubMed] [Google Scholar]
- 48.Guzmán C, Bagga M, Kaur A, Westermarck J & Abankwa D ColonyArea: an ImageJ plugin to automatically quantify colony formation in clonogenic assays. PLoS One 9, e92444 (2014). [DOI] [PMC free article] [PubMed] [Google Scholar]
- 49.Dyachenko A et al. Tandem Native Mass-Spectrometry on Antibody-Drug Conjugates and Submillion Da Antibody-Antigen Protein Assemblies on an Orbitrap EMR Equipped with a High-Mass Quadrupole Mass Selector. Anal. Chem. 87, 6095–6102 (2015). [DOI] [PubMed] [Google Scholar]
- 50.Waitt GM, Xu R, Wisely GB & Williams JD Automated in-line gel filtration for native state mass spectrometry. J. Am. Soc. Mass Spectrom. 19, 239–245 (2008). [DOI] [PubMed] [Google Scholar]
- 51.Marty MT et al. Bayesian deconvolution of mass and ion mobility spectra: from binary interactions to polydisperse ensembles. Anal. Chem. 87, 4370–4376 (2015). [DOI] [PMC free article] [PubMed] [Google Scholar]
- 52.Bern M et al. Parsimonious Charge Deconvolution for Native Mass Spectrometry. J. Proteome Res. 17, 1216–1226 (2018). [DOI] [PMC free article] [PubMed] [Google Scholar]
- 53.Jones DT Protein secondary structure prediction based on position-specific scoring matrices. J. Mol. Biol. 292, 195–202 (1999). [DOI] [PubMed] [Google Scholar]
Associated Data
This section collects any data citations, data availability statements, or supplementary materials included in this article.


