Abstract
Background:
Predictions that overestimate post-lobectomy lung function are more likely than underestimates to lead to lobectomy. Studies of post-lobectomy lung function have included only surgical patients, so overestimates are overrepresented. This selection bias has led to incorrect estimates of prediction bias which has led to inaccurate threshold values for determining lobectomy eligibility.
Objective:
The objective of this study was to demonstrate and adjust for this selection bias in order to arrive at correct estimates of prediction bias, the 95% limits of agreement, and adjusted threshold values for determining when exercise testing is warranted.
Methods:
We conducted a retrospective study of patients evaluated for lobectomy. We used multiple imputation to determine postoperative results for patients that did not have surgery because their predicted postoperative values were low. We combined these results with surgical patients to adjust for selection bias. We used the Bland-Altman method and the bivariate normal distribution to determine threshold values for surgical eligibility.
Results:
Lobectomy evaluation was performed in 114 patients; 79 had lobectomy while 35 were ineligible based on predicted values. Prediction bias using the Bland-Altman method changed significantly after controlling for selection bias. To achieve a postoperative FEV1≥30% and DLCO≥30% required a predicted FEV1≥46% and DLCO≥53%. Compared to current guidelines, using these thresholds would change management in 17% of cases.
Conclusion:
The impact of selection bias on estimates of prediction accuracy was significant but can be corrected. Threshold values for determining surgical eligibility should be reassessed.
Surgical resection often provides the best chance for cure in early stage non-small cell lung cancer (NSCLC). However, poor preoperative lung function can increase the risk of post-operative complications and result in unacceptable degrees of dyspnea, resulting in decreased quality of life. Therefore, the American College of Chest Physicians (ACCP) and the British Thoracic Society recommend an evaluation of lung function prior to lobectomy.(1, 2) Guidelines recommend that both FEV1 and DLCO be measured preoperatively, and that predicted postoperative (ppo) FEV1 and ppoDLCO be calculated.(1-3) The goal of the evaluation is to estimate the risk of operative mortality as well as the impact of lung resection on pulmonary function.
The main methods used to calculate ppoFEV1 and ppoDLCO are the segment counting method (SC) and quantitative perfusion scans (Q).(1, 2, 4) Accurate predictions of FEV1 and DLCO are important, since inaccuracy will either expose patients to high risk surgery or deny patients potentially curative surgery. However, there is relatively limited data demonstrating how well predictions match actual postoperative values.(4-18)
In addition, all previous studies in this area evaluated patients that had surgical resections and compared the predicted with the observed values to arrive at estimates of prediction bias and limits of agreement (LOA). This design is subject to selection bias. Predictions that overestimate actual values are more likely to result in surgery and these overestimates are included when assessing prediction bias. However, predictions that underestimate actual values lead to patients not having surgery and therefore do not show up in the data. The consequence is that our current estimates of prediction bias are incorrect, since we have included most of the overestimates while not taking into account many of the underestimates. These incorrect estimates of prediction bias have in turn been integrated into current guidelines, resulting in incorrect threshold values for determining when exercise testing is warranted.(2)
The objective of this study was to demonstrate and adjust for this selection bias in order to arrive at correct estimates of prediction bias, the 95% LOA, and adjusted threshold values for determining when exercise testing is warranted. We hypothesized based on our clinical experience that existing prediction rules were overly optimistic for patients with borderline performance. Therefore our secondary objective was to determine whether prediction bias was correlated with postoperative values.
Methods
Patient population
We conducted a retrospective cohort study of consecutive patients undergoing evaluation for lobectomy for stage I or II NSCLC from January 1, 2010 thru May 31, 2015. We used the thoracic surgery and pulmonary quantitative perfusion databases to identify patients that were deemed borderline in terms of pulmonary reserve such that it warranted additional testing beyond routine pulmonary functions. At our institution Q scan is the standard of care for determining ppoFEV1 and ppoDLCO so only patients that had Q scans as part of their assessment were included. Patients that had a pneumonectomy, bilobectomy, right middle lobectomy, lobe plus a segment, segmentectomy, or wedge planned or performed were excluded. Post-operative pulmonary functions were measured at 3-6 months after surgery. The study was approved by institutional review board committee-4.
Quantitative Perfusion Scans
Radionuclide perfusion for determining regional pulmonary function was performed using a multidetector system (Canberra Industries, Meriden, CT, USA) according to the method described by Ali et al.(19) We considered the upper half of the tumor-bearing lung measurements to represent the functional loss after upper lobectomy and the lower half the functional loss for lower lobectomy.
Prediction Models
We evaluated three prediction models: Q scan, SC using 18 segments (SC18), and SC using 19 segments (SC19). For the Q prediction model, ppo value= preoperative value * (1–x), where x= % of perfusion going to the lobe being resected. For the SC method, ppo value= preoperative value * (1–y/z), where y is the number of segments resected and z is the number of segments in the lungs. The difference in SC models reflects variability in the literature, with investigators considering the LUL to have either 4 or 5 segments. We predicted FEV1 % of predicted and DLCO % of predicted (see online supplement). For ease of annotation we will use FEV1 and DLCO henceforth.
Assessment of Model Performance
Agreement between predicted and actual postoperative values was assessed by Bland-Altman plots.(20) We evaluated whether differences between predicted and actual values varied depending on what the actual value was by regressing the value of the difference between predicted and actual postoperative values on the actual postoperative value and providing regression based 95% LOA.(21)
Assessing and Correcting for Selection Bias
The mean prediction bias is derived from paired observations (predicted and actual), and is expressed as the mean of the predicted minus actual value.(20) A given prediction is either an underestimate (negative) or an overestimate (positive) of the true value.
If we choose to selectively not include predictions that are underestimates while including overestimates this leads to inaccurate estimates of prediction bias. Selection bias arises because patients that have predictions that underestimate postoperative values are less likely to have surgery and do not show up in the data while overestimates have surgery and are counted (see online appendix for details).
We first assessed prediction model performance without adjustment for selection bias, as has been done previously.(4-18) Patients who had surgery and had postoperative follow up with pulmonary functions at our institution were included (Cohort A). Patients that did not have surgery because of limited pulmonary reserve were not included.
To adjust for selection bias we performed a second analysis, this time including not only patients who had surgery but also patients that met inclusion criteria but were deemed ineligible for surgery based on predictions of limited pulmonary reserve (Cohort B). Patients who were ineligible for surgery based on limited pulmonary reserve were identified by cross checking the surgical and pulmonary databases to identify patients not in the surgery database that had Q scans for preoperative assessment. Patients that were deemed inoperable after Q scans because of low pulmonary reserve were included. If patients were offered surgery but refused or if there were medical comorbidities other than pulmonary that precluded surgery they were not included.
Because MDACC is a tertiary referral center, many patients have their follow-up care provided locally with only a percentage of patients returning for longitudinal care. This is not problematic if we look only at patients that had surgery (Cohort A) since the data is missing completely at random (MCAR). We therefore took the same percentage of non-surgery patients to combine with the surgery patients to generate cohort B (see online supplement), since presumably the same percentage of non-surgical patients would have had their follow-up care locally.
Multiple Imputation
In cohort B, patients that did not have surgery due to limited pulmonary reserve had no postoperative values, so it was necessary to impute what the postoperative values would have been. We did this by using the multiple imputation method (proc MI procedure in SAS).(22) We used a parametric regression method for monotone missing data patterns for FEV1 imputation. Using data from patients that had surgery, we fit a model where actual postoperative FEV1 was the dependent variable and ppoFEV1 using Q, SC18, and SC19 were the independent variables (see online supplement). We generated 30 sets of imputed data in order to achieve a 1% power fall off tolerance as compared to an infinite number of imputations.(23) We used Bland-Altman plots to assess agreement between predicted and actual values.(20) We did the same for DLCO.
Clinical Implications: Threshold Values
In clinical practice physicians need to be relatively certain that when they recommend surgery patients will be left with sufficient postoperative function such that their quality of life is maintained. How much certainty is required is a clinical judgment based on perceived benefits and harms and treatment alternatives for a given patient.(24) For our analysis we used three potential levels of certainty (95%, 97.5%, and 99%). What constitutes sufficient postoperative function varies, but generally between 30-40% of predicted is considered sufficient.(2) Since both predicted and observed postoperative values are normally distributed and correlated, we used the bivariate normal distribution to calculate the minimum threshold predicted values necessary to achieve target postoperative values of either 30% or 40% over a range of certainty levels (95%, 97.5%, and 99%) (see online supplement).
Results
Cohort A
We identified 300 patients that had a lobectomy. No patients died within 6 months of surgery. Of the 300 patients, 79 (26.3%) met inclusion criteria and had both predicted and actual postoperative pulmonary functions determined (Cohort A, see table 1).
Table 1.
Patient Characteristics
| Clinical Characteristics | Value |
|---|---|
| Age (years) | 64 ± 11* |
| Sex | |
| Male | 32 (41%) |
| Female | 47 (59%) |
| Ethnicity | |
| White | 62 (79%) |
| Black | 11 (14%) |
| Hispanic | 4 (5%) |
| Asian | 2 (3%) |
| Zubrod | |
| 0 | 56 (71%) |
| 1 | 22 (28%) |
| 2 | 1 (1%) |
| Smoking history | |
| Never | 10 (13%) |
| Current or former | 69 (87%) |
| COPD | |
| Absent | 58 (73%) |
| Present | 21 (27%) |
mean and standard deviation; all other values are count data and percentage.
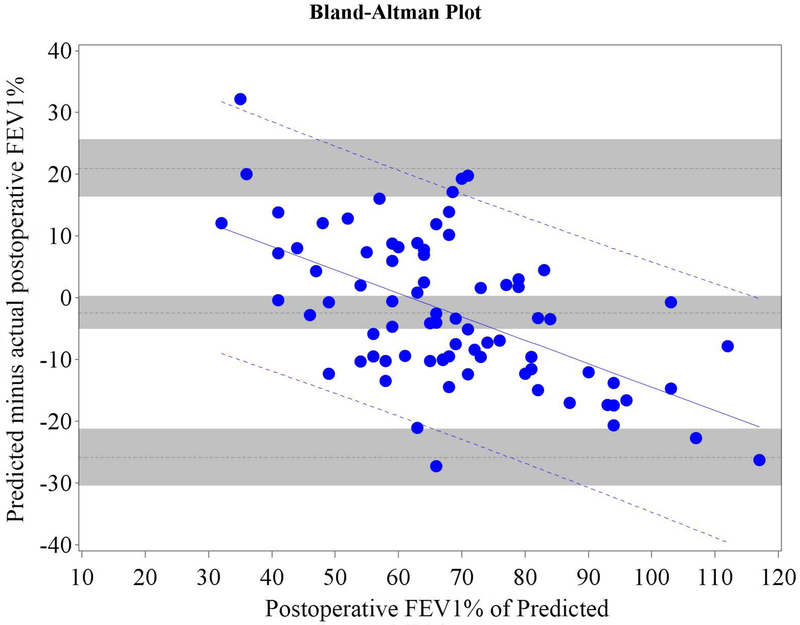
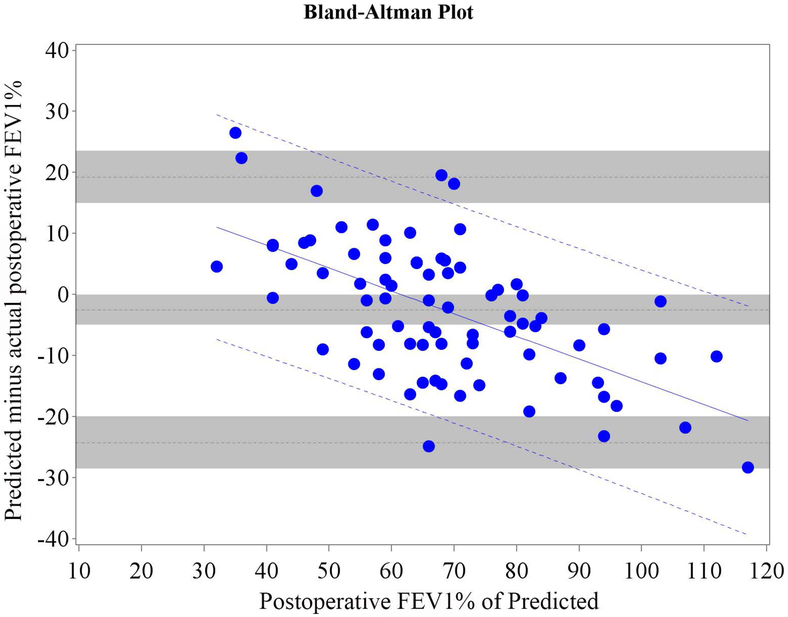
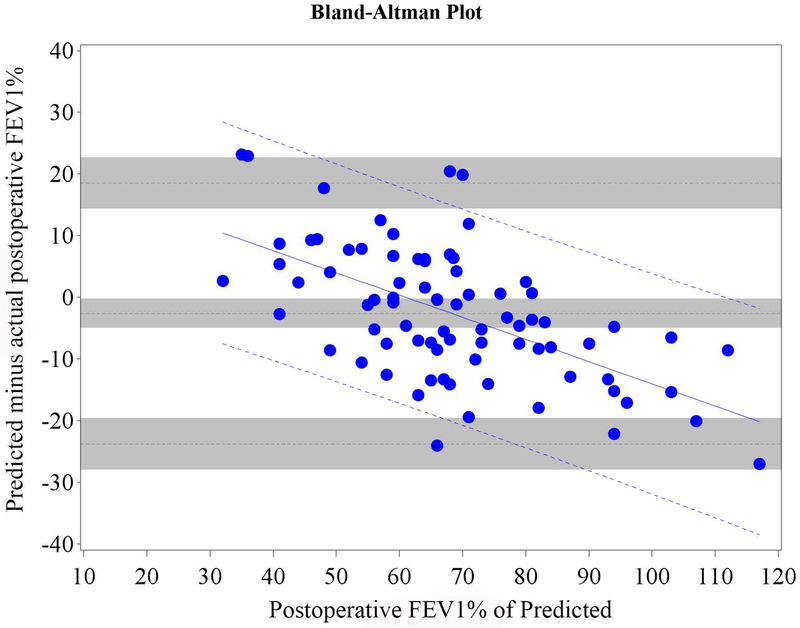
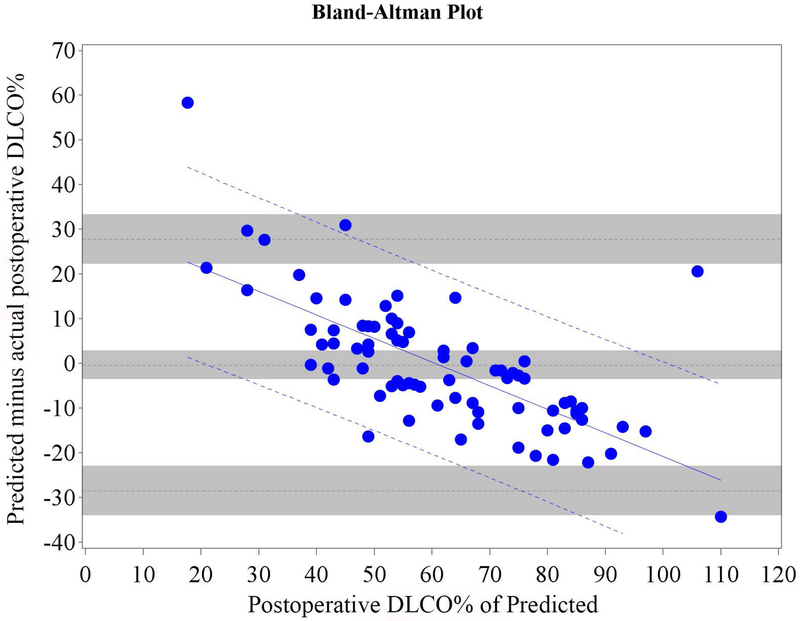
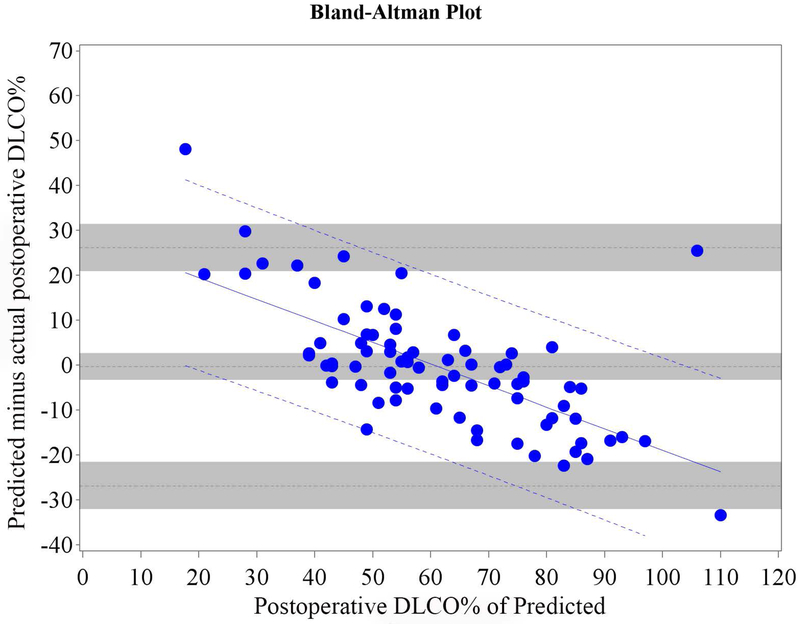
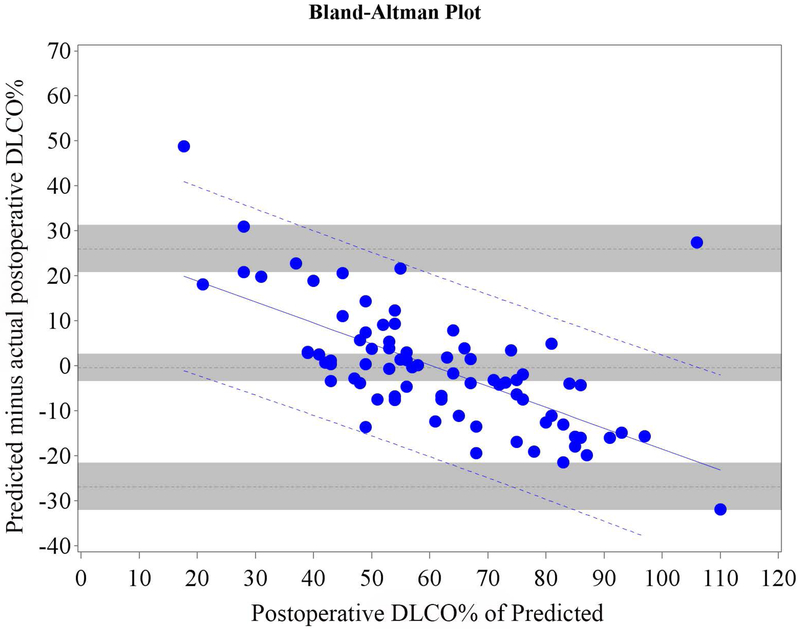
Mean bias and 95% LOA between predicted and actual postoperative values of FEV1 and DLCO for Cohort A are shown in table 2; Bland-Altman plots are shown in Figures 1 and 2.
Table 2.
Cohort A: Mean difference between predicted and actual postoperative FEV1% and DLCO% for different predictive models (79 surgery patients)
| Method of Prediction |
FEV1% | ||||||||
|---|---|---|---|---|---|---|---|---|---|
| Mean difference |
95% CI | 95% limits of agreement* | 95% CI lower limit** | 95% CI upper limit*** | |||||
| Quantitative Perfusions Scan |
−2.44 | −5.12 | 0.24 | −25.9 | 20.98 | −30.5 | −21.2 | 16.34 | 25.62 |
| Segment counting with 18 segments |
−2.53 | −5.01 | −0.04 | −24.3 | 19.21 | −28.6 | −20.0 | 14.91 | 23.52 |
| Segment counting with 19 segments |
−2.63 | −5.05 | −0.22 | −23.8 | 18.52 | −28.0 | −19.6 | 14.34 | 22.71 |
| DLCO% | |||||||||
| Mean | 95% CI | 95% limits of agreement | 95% CI lower limit | 95% CI upper limit | |||||
| Quantitative Perfusions Scan |
−0.38 | −3.62 | 2.86 | −28.5 | 27.76 | −34.1 | −22.9 | 22.15 | 33.36 |
| Segment counting with 18 segments |
−0.36 | −3.41 | 2.69 | −26.9 | 26.15 | −32.2 | −21.6 | 20.87 | 31.44 |
| Segment counting with 19 segments |
−0.45 | −3.49 | 2.59 | −26.9 | 25.99 | −32.2 | −21.6 | 20.72 | 31.26 |
CI: Confidence interval. Mean difference is model’s predicted value minus actual postoperative value.
Figure 1.
Cohort A Bland-Altman Plot for FEV1 % of Predicted for a) Q model, b) SC18 model, and c) SC19 model. Difference is predicted postoperative value for that model minus actual postoperative value. Mean bias and 95% LOA are the horizontal black dashed lines. The grey zones around each represent the range of possible error in the estimate due to sampling error. The solid blue line represents the regression of the difference between predicted and observed as a function of the actual postoperative value. Blue dashed line represents the regression based 95% LOA.
Figure 2.
Cohort A Bland-Altman Plot for DLCO % of Predicted for a) Q model, b) SC18 model, and c) SC19 model. Difference is predicted postoperative value for that model minus actual postoperative value. Mean bias and 95% LOA are the horizontal black dashed lines. The grey zones around each represent the range of possible error in the estimate due to sampling error. The solid blue line represents the regression of the difference between predicted and observed as a function of the actual postoperative value. Blue dashed line represents the regression based 95% LOA.
We found that the bias varied significantly in association with the actual value as assessed by regression of the difference vs. the actual postoperative values (Figures 1 and 2 regression lines).(21) Therefore, rather than representing the bias and LOA as constant across all values as previously reported in the literature,(4-18) it is more correct to represent the bias and LOA by using the regression equation and regression-based 95% LOA (Figure 1-2 blue lines).(21)
Cohort B
There were 130 patients that did not have surgery because pulmonary reserve was deemed insufficient based on Q scan. These 130 patients had a very different distribution of ppo values (p<0.0001), confirming the missing data was not missing completely at random (e-tables 1-2).(25) Not including such patients would therefore result in selection bias.
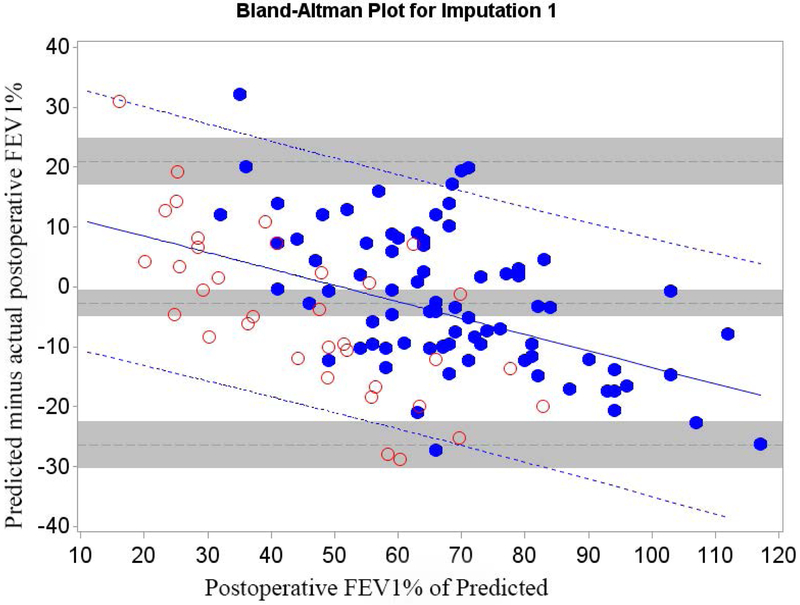
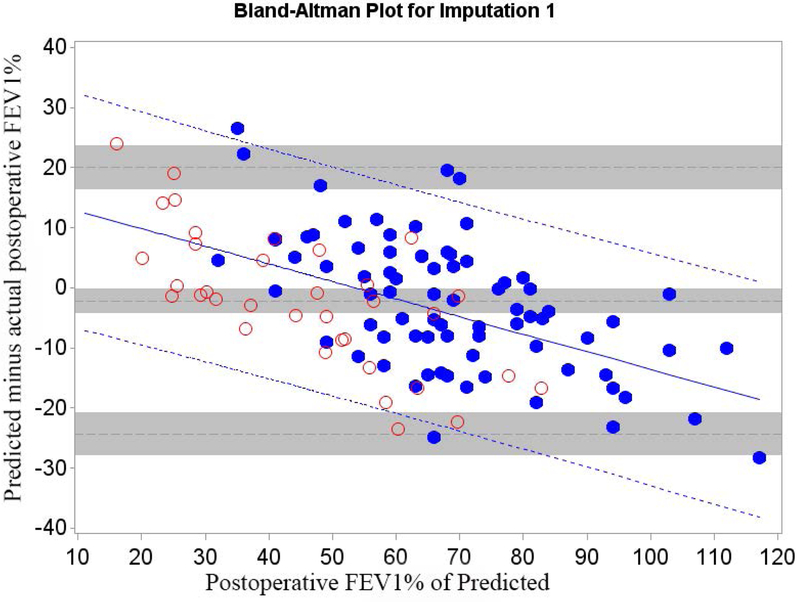
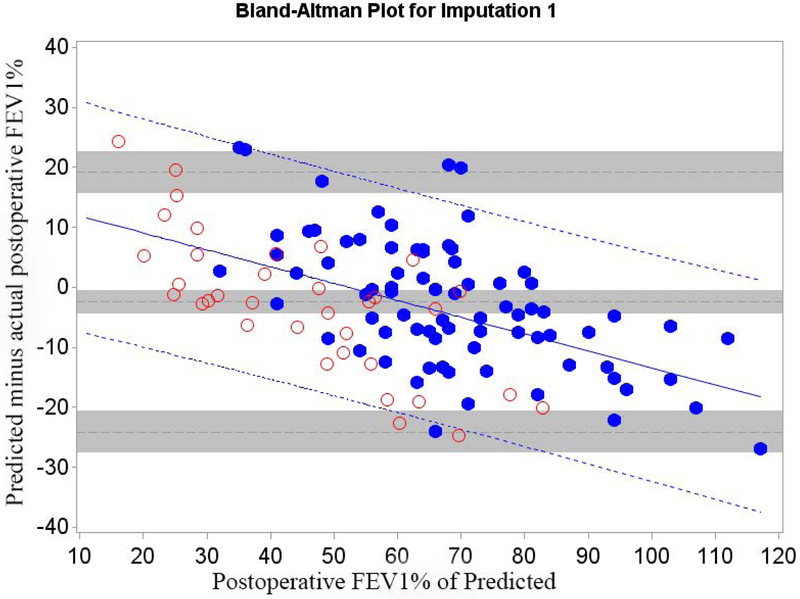
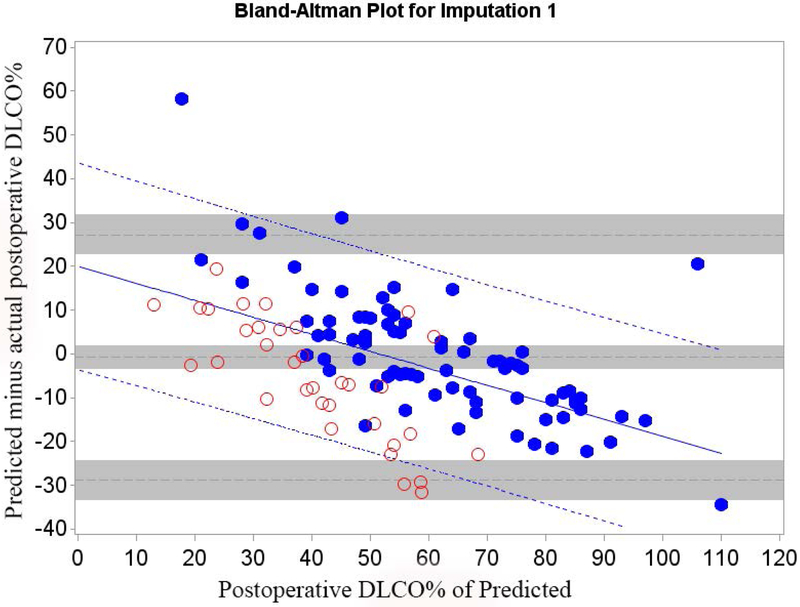
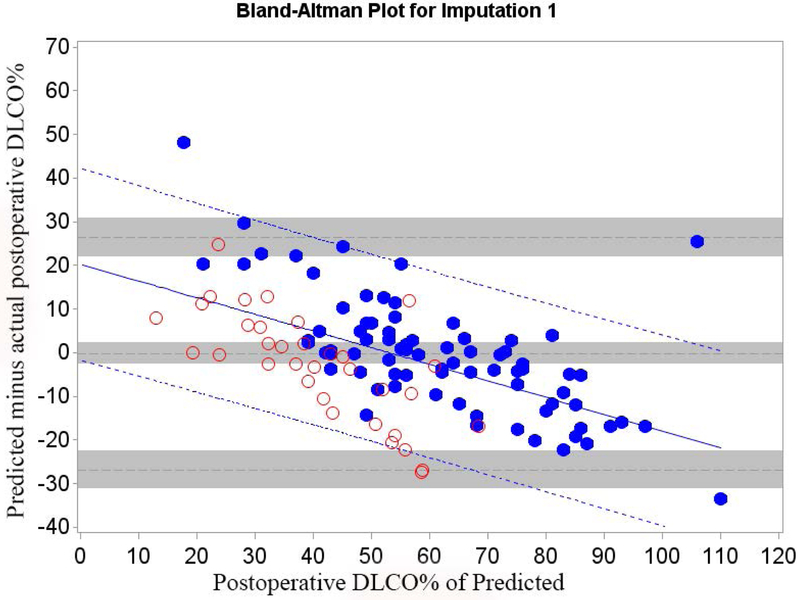
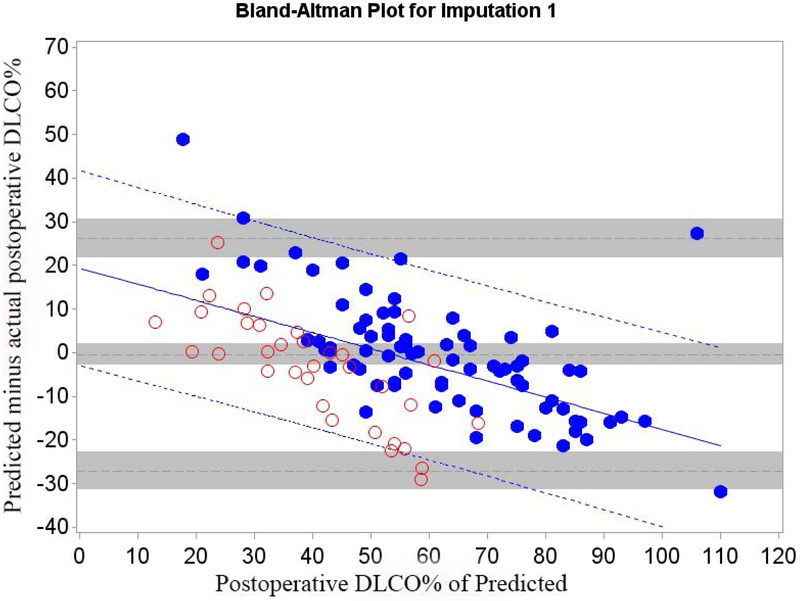
Of all patients that had surgery, 26.3% returned for follow-up. We therefore randomly selected 26.3% (n=35) of the 130 patients that did not have surgery because of insufficient pulmonary reserve and combined them with Cohort A (n=79) to form Cohort B (n=114) in order to control for selection bias. The relative efficiency of imputation (as compared to an infinite number of iterations) was 99.2% for FEV1 and 99.2% for DLCO. The mean bias and 95% LOA are shown in table 3; Bland-Altman plots are shown in Figures 3 and 4. Bias varied significantly in association with the actual value. The regression equation and regression-based 95% LOA are shown in Figures 3 and 4.(21) When postoperative values were low, predictions were overly optimistic; when postoperative values were high, predictions were overly pessimistic.
Table 3.
Cohort B: Mean difference between predicted and actual postoperative FEV1 and DLCO for different predictive models (79 surgery patients + 35 imputed non-surgical patients) based on 30 imputations
| Method of Prediction |
FEV1 % of predicted | ||||||||
|---|---|---|---|---|---|---|---|---|---|
| Mean difference |
95% CI | 95% limits of agreement* | 95% CI lower limit* | 95% CI upper limit* | |||||
| Quantitative Perfusions Scan |
−2.79 | −5.01 | −0.58 | −26.4 | 20.86 | −30.3 | −22.6 | 16.98 | 24.74 |
| Segment counting with 18 segments |
−2.20 | −4.28 | −0.13 | −24.4 | 19.97 | −28.0 | −20.7 | 16.33 | 23.61 |
| Segment counting with 19 segments |
−2.50 | −4.53 | −0.48 | −24.1 | 19.13 | −27.7 | −20.6 | 15.58 | 22.67 |
| DLCO % of predicted | |||||||||
| Mean | 95% CI | 95% limits of agreement | 95% CI lower limit | 95% CI upper limit | |||||
| Quantitative Perfusions Scan |
−0.82 | −3.45 | 1.80 | −28.8 | 27.21 | −33.4 | −24.3 | 22.61 | 31.80 |
| Segment counting with 18 segments |
−0.21 | −2.71 | 2.28 | −26.9 | 26.44 | −31.2 | −-22.5 | 22.07 | 30.81 |
| Segment counting with 19 segments |
−0.43 | −2.93 | 2.06 | −27.1 | 26.20 | −31.4 | −22.7 | 21.84 | 30.57 |
CI: Confidence Interval. Mean difference is model’s predicted value minus actual postoperative value.
For methods of calculating limits of agreement and CI with m imputed data sets, see the online supplement methods section.(23)
Figure 3.
Cohort B Bland-Altman Plot for FEV1 % of Predicted for a) Q model, b) SC18 model, and c) SC19 model. Difference is predicted postoperative value for that model minus actual postoperative value. Mean bias and 95% LOA are the horizontal black dashed lines. The grey zones around each represent the range of possible error in the estimate due to sampling error. The solid blue line represents the regression of the difference between predicted and observed as a function of the actual postoperative value. Blue dashed line represents the regression based 95% LOA.
Blue dots are patients that had surgery with observed data. Red dots are patients that had predictions made but did not have surgery because of limited pulmonary reserved; for these patients the “actual” postoperative values are imputed.
Figure 4.
Cohort B Bland-Altman Plot for FEV1 % of Predicted for a) Q model, b) SC18 model, and c) SC19 model. Difference is predicted postoperative value for that model minus actual postoperative value. Mean bias and 95% LOA are the horizontal black dashed lines. The grey zones around each represent the range of possible error in the estimate due to sampling error. The solid blue line represents the regression of the difference between predicted and observed as a function of the actual postoperative value. Blue dashed line represents the regression based 95% LOA.
Blue dots are patients that had surgery with observed data. Red dots are patients that had predictions made but did not have surgery because of limited pulmonary reserved; for these patients the “actual” postoperative values are imputed.
The regression equations describing the bias and LOA between predicted and actual values for Cohorts A and B are summarized in Table 4. Adjustment for selection bias significantly changed the equations. In both cohorts the magnitude of the bias varied in association with the actual value of FEV1 and DLCO. However, both the magnitude of the slope and the intercepts are lower for Cohort B. The adjusted estimates show that the prediction bias is actually significantly more negative than the unadjusted data would have suggested.
Table 4.
The Impact of Selection Bias on Estimates of Bias
| Prediction of FEV1 % of Predicted | ||||
|---|---|---|---|---|
| Method of Prediction |
Unadjusted Model Cohort A (N=79) |
Adjusted Prediction Model Cohort B (N=114) |
||
| Intercept (95% CI) |
Slope (95% CI) |
Intercept (95% CI) |
Slope (95% CI) |
|
| Quantitative Perfusions Scan |
23.54 (14.67, 32.42) |
−0.38 (−0.51, −0.25) |
13.94 (6.43, 21.45) |
−0.27 −0.38, −0.17) |
| Segment counting with 18 segments |
22.96 (14.95, 30.97) |
−0.37 (−0.49, −0.26) |
15.69 (8.55, 22.82) |
−0.29 (−0.39, −0.19) |
| Segment counting with 19 segments |
21.98 (14.15, 29.81) |
−0.36 (−0.47, −0.25) |
14.64 (7.50, 21.77) |
−0.28 (−0.38, −0.18) |
| Prediction of DLCO % of Predicted | ||||
| Unadjusted Prediction Model Cohort A (N=79) |
Adjusted Prediction Model Cohort B (N=114) |
|||
| Intercept (95% CI) |
Slope (95% CI) |
Intercept (95% CI) |
Slope (95% CI) |
|
| Quantitative Perfusions Scan |
31.97 (24.16, 39.79) |
−0.53 (−0.65, −0.41) |
19.97 (13.07, 26.87) |
−0.39 (−0.50, −0.27) |
| Segment counting with 18 segments |
29.09 (21.49, 36.69) |
−0.48 (−0.60, −0.36) |
20.19 (13.36, 27.02) |
−0.38 (−0.49, −0.27) |
| Segment counting with 19 segments |
28.23 (20.50, 35.96) |
−0.47 (−0.59, −0.35) |
19.38 (12.45, 26.32) |
−0.37 (−0.48, −0.26) |
Cohort A consists of all surgical patients, Cohort B includes patients that did not have surgery (n=35) as well as those that did have surgery to adjust for selection bias.
The SC19 method had the smallest LOA although the absolute difference was modest. The variance of SC19 was significantly smaller than the variance of the Q model (p=0.046) for FEV1 but failed to reach significance for DLCO.
Clinical Implications
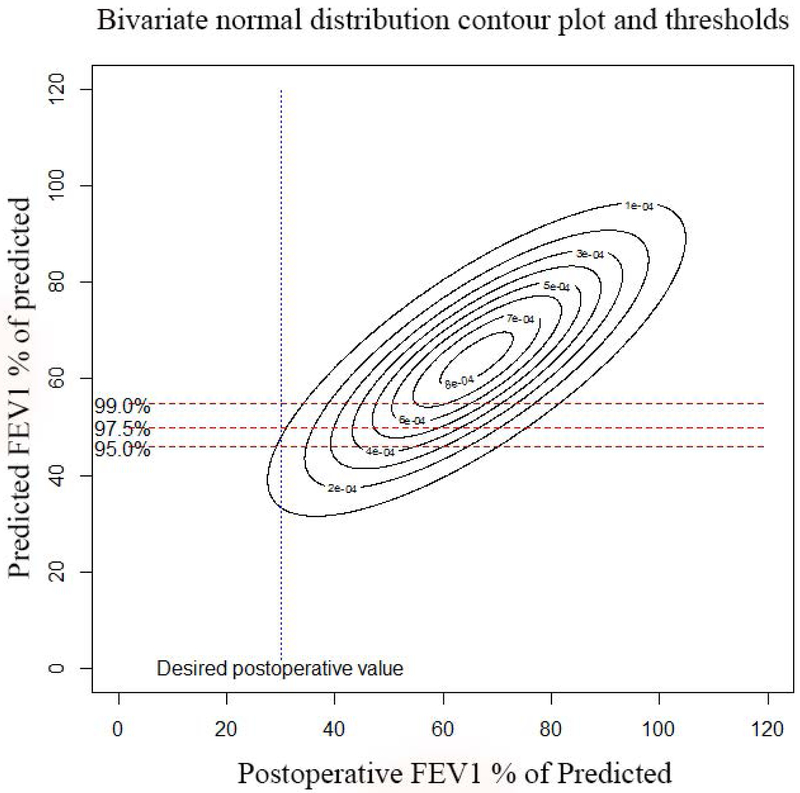
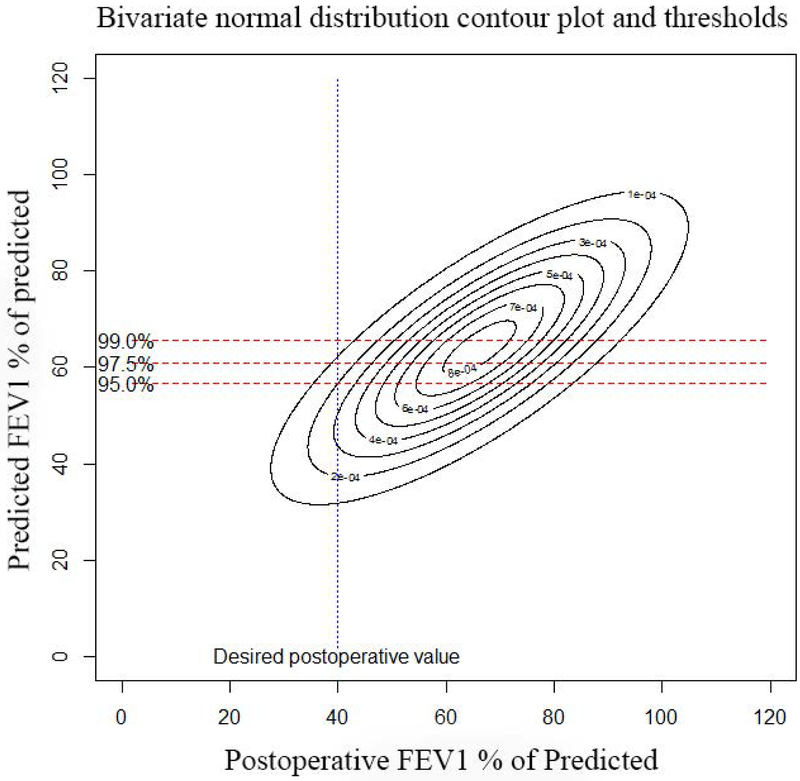
To make this clinically useful we need to derive bias adjusted minimum predicted value thresholds for guiding clinical decision making. Using the bivariate normal distribution, we derived minimum predicted threshold values necessary to achieve actual postoperative target values of 30% or 40% (Table 5, figure 5, and e-figures 1-3 for additional plots).
Table 5.
Threshold Values for Prediction of Postoperative Function
| Prediction of FEV1 % of predicted | |||
|---|---|---|---|
| Desired Postoperative Value | Clinical certainty threshold – probability that the postoperative value will be equal to or higher than the threshold | Predicted value threshold (i.e. you need this value or higher to “pass” with that much clinical certainty) | |
| Q model | SC19 model | ||
| ≥30% | .99 | 54.8 | 53.0 |
| ≥30% | .975 | 50.0 | 49.1 |
| ≥30% | .95 | 45.9 | 45.6 |
| ≥40% | .99 | 65.7 | 63.0 |
| ≥40% | .975 | 60.9 | 59.0 |
| ≥40% | .95 | 56.8 | 55.6 |
| Prediction of DLCO % of predicted | |||
| Q model | SC19 model | ||
| ≥30% | .99 | 63.7 | 61.1 |
| ≥30% | .975 | 58.0 | 55.7 |
| ≥30% | .95 | 53.0 | 51.1 |
| ≥40% | .99 | 74.6 | 72.0 |
| ≥40% | .975 | 68.8 | 66.6 |
| ≥40% | .95 | 63.9 | 62.0 |
Physician must choose what the minimum desired postoperative value is (1st column). They also must choose how much certainty they want to have that the patient will achieve this (2nd column). Using the bivariate normal model, we can then determine what the corresponding threshold predicted value must be. If the patient’s predicted value is greater than or equal to the corresponding threshold value, then the probability of the patient having the desired postoperative value will be at least equal to or greater than the clinical certainty threshold.
Figure 5.
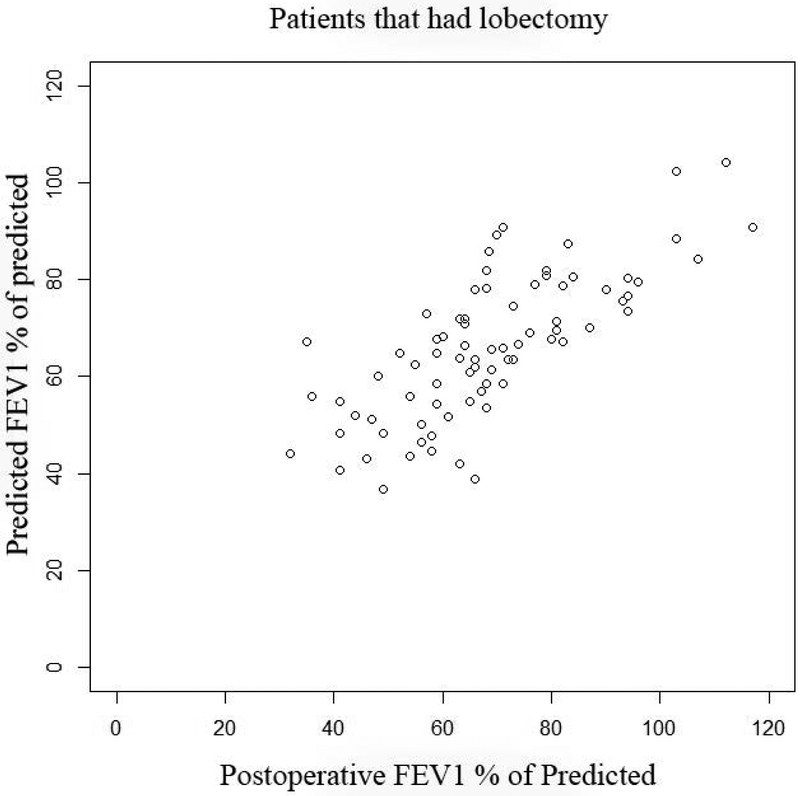
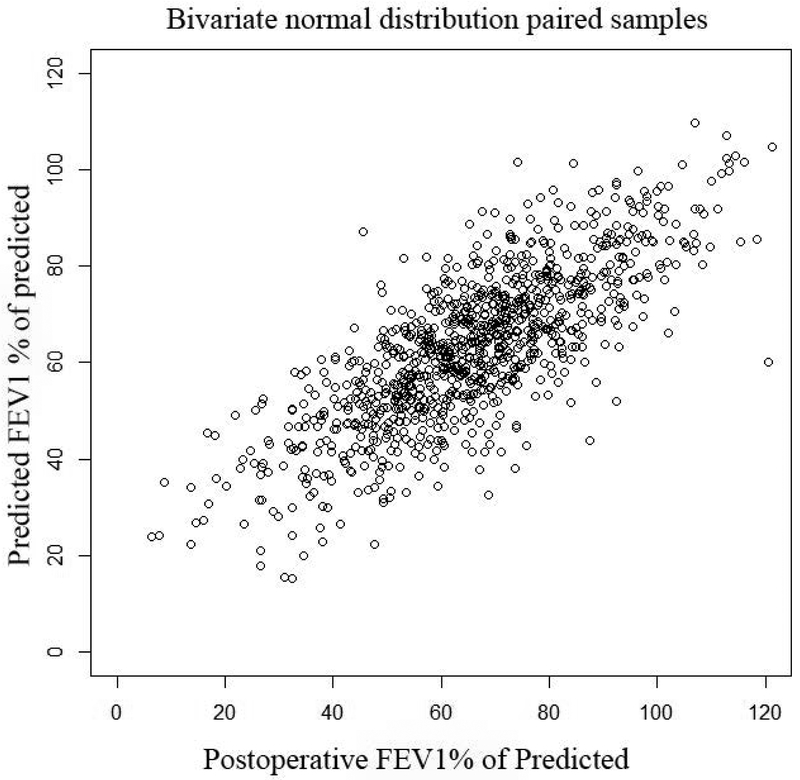
Actual postoperative FEV1 vs. Predicted FEV1 using quantitative perfusion scans: Panel A, (top left): Scatter plot of actual FEV1 vs. predicted FEV1 using Q scan for patients that had surgery. Note how the the original data demonstrates selection bias, as evidenced by the fact that there are very few patients with ppoFEV1 values less than 40%. Panel B, (top right): Random samples of 1000 pairs generated from the underlying bivariate normal distribution for predicted and observed values. Note that the truncation of the normal distribtution due to selection bias has been corrected. Panel C, (bottom left): Contour plot of underlying bivariate normal distribution. For a desired actual postoperative value of 30%, a given minimum threshold predicted value can be calculated, depending on the level of clinical certainty required. The three horizontal lines represent values of clinical certainty at the 95%, 97.5%, and 99% levels. Panel D, (bottom right): Contour plot of underlying bivariate normal distribution. The desired actual postoperative value is now set at 40% with corresponding minimum threshold values.
We compared how the current ACCP guidelines threshold of FEV1>60% and DLCO%>60% agreed with the bias adjusted minimum predicted value thresholds to estimate how often there would be a change in management strategy. Using the bias adjusted minimum predicted thresholds for a target postoperative value of ≥30% of predicted with 95% certainty, management would have been changed in 20 (17%) of the 115 patients. Using the bias adjusted threshold would have allowed these 20 patients to avoid additional exercise testing. In these 20 patients, the actual postoperative FEV1 was >30% of predicted in all 20 patients; the actual postoperative DLCO% was >30% of predicted in 19 of the 20 patients.
Discussion
Quantitative perfusion scans have been the gold standard for predicting postoperative FEV1 and DLCO for many years.(2, 26, 27) However, we found that the gold standard is actually not that great, as evidenced by the wide LOA between predicted and actual values. Indeed, all methods of predicting postoperative lung function had limited predictive power, with SC19 being slightly better than the Q model for FEV1. We were also able to demonstrate and adjust for selection bias introduced by and inherent to the prediction process itself. Selection bias in this case is inherent because the ppoFEV1 and ppoDLCO impact the decision on whether or not patients have surgery. We were able to adjust for this by analyzing all patients being assessed for surgery and using imputation for patients that did not have surgery because their ppo values were too low. We then used the bivariate normal distribution to derive more accurate threshold values for defining what constitutes an acceptable ppoFEV1 and ppoDLCO for any given postoperative target value.
These findings are consistent with those of other investigators that have evaluated different methods of predicting postoperative lung function.(4-18) Prior studies suggest that the 95% limits of agreement (LOA) between predicted and actual values are fairly wide. For example, the 95% LOA between ppoFEV1 and actual postoperative FEV1 using the segment counting method in one study was −0.79 L to +0.38 L.(4) Consistent with these other studies, we found that the LOA for Q, SC18, and SC19 were fairly wide. Our findings suggest that routine use of Q scans does not offer significant advantages over the simpler SC19 method, especially given the cost. However, in special instances Q scan may still be warranted; for example when there is marked heterogeneity of emphysema with hyperinflation on the side of the resection or when there are large areas of non-functional lung being resected.
This study adds to the existing body of knowledge on prediction of postoperative lung function by addressing the issue of selection bias. To our knowledge this is the first study to identify and correct for this inherent selection bias.(4-18) The solution to this problem is to include all patients evaluated for surgery rather than only including patients that have surgery. This has important implications for future studies involving new methods of predicting postoperative lung function. The presence of selection bias from the prediction itself means that any future study comparing current standard of care prediction methods (e.g. Q scan) with new techniques should analyze all patients being evaluated for surgery, irrespective of whether or not they eventually have the surgery, so long as the current standard of care prediction method is being ordered. In this way we can control for the inherent selection bias created by prediction.
However, even after adjusting for selection bias, we found that the bias of all prediction models varied depending on the actual postoperative value. When bias varies with the true value, regression based 95% LOA should be used.(21) However, prior studies have not done this and have not emphasized its clinical relevance.(4-18) Physicians should be aware that not only are the LOA for existing prediction methods wide, but the bias also varies with the true value such that when actual values are low predictions become overly optimistic.
The bivariate normal distribution allows us to handle this problem. The use of the bivariate normal distribution allows us to derive the minimum threshold values of ppoFEV1 and ppoDLCO needed to achieve any specified postoperative value for a given degree of certainty. For example, if physicians want to have a 95% probability that their patient will have an actual postoperative FEV1 of ≥30% of predicted, the ppoFEV1 using the SC19 methods needs to be ≥46% (table 5).
Of note, measurements of FEV1 and DLCO demonstrate different degrees of variability,(28, 29) hence if a postoperative value of ≥30% of predicted is desired for both FEV1 and DLCO, the threshold values for FEV1 must be different than DLCO. However, current ACCP guidelines use a single threshold value of 60% for both FEV1 and DLCO.(2) The bivariate normal distribution allows us to handle each of these measure separately and more accurately.
This problem of selection bias impacting assessment of prediction tools is present in other areas of medicine. Examples where this may apply include agreement between pulmonary artery pressures assessed by echocardiography vs. right heart catheterization (30) or non-invasive cardiac monitoring devices in perioperative medicine.(31) The approach described above should be generalizable and hopefully useful for dealing with these problems.
However, it is also important to recognize the limitations of this study when applying the results. This is a single-center, retrospective study with a relatively small cohort size, therefore the results cannot be generalized. Since the study is retrospective it also warrants prospective validation. This is particularly important in order to control for selection bias. While we controlled for one type of selection bias, other forms of selection bias may still be present. For instance, it may be that patients who experienced a greater decline in FEV1 and were more short of breath were more likely to return to MDACC despite the distance. If this occurred, it would bias our results, since patients with lower postoperative FEV1 results would be more likely to be sampled than those with higher results. Prospective studies could control for this in the design rather than the analysis, which would be more effective. In addition, there are differences in how Q scans are used to predict postoperative lung functions. It may be that alternative methods of Q scan analysis would impact the results. However, our unadjusted prediction bias and LOA are similar to those of others.(4-18)
In summary, this study demonstrates that existing methods of predicting postoperative lung function following lobectomy have significant limitations, including wide LOA and a tendency to be overly optimistic when values are low. It also demonstrates the impact of selection bias on estimates of prediction bias and provides a solution to this problem using imputation and the bivariate normal distribution. Our method provides added insight by correcting for selection bias, changing the threshold based on the desired postoperative value being targeted, specifying the degree of certainty associated with any given threshold, and by accounting for differences in variability between FEV1 and DLCO. These changes should allow physicians to use existing technology more effectively which should improve outcomes. The method to adjust for selection bias inherent to the prediction process is also generalizable to other areas of medicine. But this study can only improve test interpretation and application, it does not improve the prediction instrument itself. More accurate prediction methods are needed as evidenced by the wide LOA. Future studies that wish to compare new prediction methods to the existing standard will need to include all patients undergoing the evaluation process, irrespective of whether or not they eventually have surgery, in order to control for selection bias inherent in the prediction process.
Supplementary Material
Acknowledgements:
Dr. Ost was the principal investigator (PI) for this study and was responsible for project conception, oversight, organization, data collection and auditing, statistical analysis, and manuscript writing. Mrs. Ontiveros, Dr. Eapen-John, Mrs. Osorio, Mr. Tian, and Mrs. Ghosh were involved in data collection and auditing and manuscript writing. Drs. Li and Song, were the primary biostatisticians for the project, constructed the models and analyses and contributed to writing. Drs. Vaporciyan, Walsh, and Correa were involved in the data collection through the thoracic surgery data base and contributed to writing. Drs. Grosu and Sheshadri were involved in writing and editing.
Funding: Statistical analysis work supported in part by the Cancer Center Support Grant (NCI Grant P30 CA016672).
Abbreviation list:
- ACCP
American College of Chest Physicians
- DLCO
Diffusion capacity of carbon monoxide
- FEV1
Forced expiratory volume
- LOA
Limits of agreement
- MCAR
missing completely at random
- NSCLC
non-small cell lung cancer
- ppo
Predicted postoperative
- Q
Quantitative perfusion scan
- SC18
Segment counting with 18 segment method
- SC19
Segment counting with 19 segment method
Footnotes
Conflicts of Interest: none to declare
References
- 1.Lim E, Baldwin D, Beckles M, Duffy J, Entwisle J, Faivre-Finn C, Kerr K, Macfie A, McGuigan J, Padley S, Popat S, Screaton N, Snee M, Waller D, Warburton C, Win T, British Thoracic S, Society for Cardiothoracic Surgery in Great B, Ireland. Guidelines on the radical management of patients with lung cancer. Thorax 2010; 65 Suppl 3: iii1–27. [DOI] [PubMed] [Google Scholar]
- 2.Brunelli A, Kim AW, Berger KI, Addrizzo-Harris DJ. Physiologic evaluation of the patient with lung cancer being considered for resectional surgery: Diagnosis and management of lung cancer, 3rd ed: American College of Chest Physicians evidence-based clinical practice guidelines. Chest 2013; 143: e166S–190S. [DOI] [PubMed] [Google Scholar]
- 3.Brunelli A, Rocco G. Spirometry: predicting risk and outcome. Thorac Surg Clin 2008; 18: 1–8. [DOI] [PubMed] [Google Scholar]
- 4.Bolliger CT, Guckel C, Engel H, Stohr S, Wyser CP, Schoetzau A, Habicht J, Soler M, Tamm M, Perruchoud AP. Prediction of functional reserves after lung resection: comparison between quantitative computed tomography, scintigraphy, and anatomy. Respiration 2002; 69: 482–489. [DOI] [PubMed] [Google Scholar]
- 5.Ohno Y, Seki S, Koyama H, Yoshikawa T, Matsumoto S, Takenaka D, Kassai Y, Yui M, Sugimura K. 3D ECG- and respiratory-gated non-contrast-enhanced (CE) perfusion MRI for postoperative lung function prediction in non-small-cell lung cancer patients: A comparison with thin-section quantitative computed tomography, dynamic CE-perfusion MRI, and perfusion scan. J Magn Reson Imaging 2015; 42: 340–353. [DOI] [PubMed] [Google Scholar]
- 6.Ueda K, Tanaka T, Li TS, Tanaka N, Hamano K. Quantitative computed tomography for the prediction of pulmonary function after lung cancer surgery: a simple method using simulation software. Eur J Cardiothorac Surg 2009; 35: 414–418. [DOI] [PubMed] [Google Scholar]
- 7.Wu MT, Chang JM, Chiang AA, Lu JY, Hsu HK, Hsu WH, Yang CF. Use of quantitative CT to predict postoperative lung function in patients with lung cancer. Radiology 1994; 191: 257–262. [DOI] [PubMed] [Google Scholar]
- 8.Wu MT, Pan HB, Chiang AA, Hsu HK, Chang HC, Peng NJ, Lai PH, Liang HL, Yang CF. Prediction of postoperative lung function in patients with lung cancer: comparison of quantitative CT with perfusion scintigraphy. AJR Am J Roentgenol 2002; 178: 667–672. [DOI] [PubMed] [Google Scholar]
- 9.Zhu X, Zhao M, Liu C, Zhou J. Prediction of the postoperative pulmonary function in lung cancer patients with borderline function using ventilation-perfusion scintigraphy. Nucl Med Commun 2012; 33: 283–287. [DOI] [PubMed] [Google Scholar]
- 10.Detterbeck F, Gat M, Miller D, Force S, Chin C, Fernando H, Sonett J, Morice R. A new method to predict postoperative lung function: quantitative breath sound measurements. Ann Thorac Surg 2013; 95: 968–975. [DOI] [PubMed] [Google Scholar]
- 11.Liu F, Han P, Feng GS, Liang B, Xiao J, Tian ZL, Lei ZQ. Using quantitative CT to predict postoperative pulmonary function in patients with lung cancer. Chinese medical journal 2005; 118: 742–746. [PubMed] [Google Scholar]
- 12.Sverzellati N, Chetta A, Calabro E, Carbognani P, Internullo E, Olivieri D, Zompatori M. Reliability of quantitative computed tomography to predict postoperative lung function in patients with chronic obstructive pulmonary disease having a lobectomy. J Comput Assist Tomogr 2005; 29: 819–824. [DOI] [PubMed] [Google Scholar]
- 13.Westhoff M, Herth F, Albert M, Dienemann H, Eberhardt R. A new method to predict values for postoperative lung function and surgical risk of lung resection by quantitative breath sound measurements. Am J Clin Oncol 2013; 36: 273–278. [DOI] [PubMed] [Google Scholar]
- 14.Win T, Laroche CM, Groves AM, White C, Wells FC, Ritchie AJ, Tasker AD. Use of quantitative lung scintigraphy to predict postoperative pulmonary function in lung cancer patients undergoing lobectomy. Ann Thorac Surg 2004; 78: 1215–1218. [DOI] [PubMed] [Google Scholar]
- 15.Win T, Tasker AD, Groves AM, White C, Ritchie AJ, Wells FC, Laroche CM. Ventilation-perfusion scintigraphy to predict postoperative pulmonary function in lung cancer patients undergoing pneumonectomy. AJR Am J Roentgenol 2006; 187: 1260–1265. [DOI] [PubMed] [Google Scholar]
- 16.Chae EJ, Kim N, Seo JB, Park JY, Song JW, Lee HJ, Hwang HJ, Lim C, Chang YJ, Kim YH. Prediction of postoperative lung function in patients undergoing lung resection: dual-energy perfusion computed tomography versus perfusion scintigraphy. Invest Radiol 2013; 48: 622–627. [DOI] [PubMed] [Google Scholar]
- 17.Ohno Y, Hatabu H, Higashino T, Takenaka D, Watanabe H, Nishimura Y, Yoshimura M, Sugimura K. Dynamic perfusion MRI versus perfusion scintigraphy: prediction of postoperative lung function in patients with lung cancer. AJR Am J Roentgenol 2004; 182: 73–78. [DOI] [PubMed] [Google Scholar]
- 18.Ohno Y, Koyama H, Takenaka D, Nogami M, Kotani Y, Nishimura Y, Yoshimura M, Yoshikawa T, Sugimura K. Coregistered ventilation and perfusion SPECT using krypton-81m and Tc-99m-labeled macroaggregated albumin with multislice CT utility for prediction of postoperative lung function in non-small cell lung cancer patients. Acad Radiol 2007; 14: 830–838. [DOI] [PubMed] [Google Scholar]
- 19.Ali MK, Ewer MS, R. AM, Mountain CF, Dixon CL, Johnston DA, Haynie TP. Regional and overall pulmonary function changes in lung cancer. Correlations with tumor stage, extent of pulmonary resection, and patient survival. Journal of Thoracic and Cardiovascular Surgery 1983; 86: 1–8. [PubMed] [Google Scholar]
- 20.Bland JM, Altman DG. Statistical methods for assessing agreement between two methods of clinical measurement. Lancet 1986; 1: 307–310. [PubMed] [Google Scholar]
- 21.Bland JM, Altman DG. Measuring agreement in method comparison studies. Stat Methods Med Res 1999; 8: 135–160. [DOI] [PubMed] [Google Scholar]
- 22.SAS Institute Inc. The MI Procedure. SAS/STAT 141 User's Guide. Cary, NC: SAS Institute, Inc; 2015. p. 5918–5919. [Google Scholar]
- 23.Yuan YC. Multiple Imputation for Missing Data: Concept and New Development. [cited 2017. 3/8/2017]. Available from: http://www.ats.ucla.edu/stat/sas/library/multipleimputation.pdf.
- 24.Ost DE, Gould MK. Decision making in patients with pulmonary nodules. Am J Respir Crit Care Med 2012; 185: 363–372. [DOI] [PMC free article] [PubMed] [Google Scholar]
- 25.Fielding S, Fayers PM, Ramsay CR. Investigating the missing data mechanism in quality of life outcomes: a comparison of approaches. Health Qual Life Outcomes 2009; 7: 57. [DOI] [PMC free article] [PubMed] [Google Scholar]
- 26.Colice GL, Shafazand S, Griffin JP, Keenan R, Bolliger CT. Physiologic evaluation of the patient with lung cancer being considered for resectional surgery: ACCP evidenced-based clinical practice guidelines (2nd edition). Chest 2007; 132: 161S–177S. [DOI] [PubMed] [Google Scholar]
- 27.Datta D, Lahiri B. Preoperative evaluation of patients undergoing lung resection surgery. Chest 2003; 123: 2096–2103. [DOI] [PubMed] [Google Scholar]
- 28.Enright PL, Beck KC, Sherrill DL. Repeatability of spirometry in 18,000 adult patients. Am J Respir Crit Care Med 2004; 169: 235–238. [DOI] [PubMed] [Google Scholar]
- 29.Punjabi NM, Shade D, Patel AM, Wise RA. Measurement variability in single-breath diffusing capacity of the lung. Chest 2003; 123: 1082–1089. [DOI] [PubMed] [Google Scholar]
- 30.D'Alto M, Romeo E, Argiento P, D'Andrea A, Vanderpool R, Correra A, Bossone E, Sarubbi B, Calabro R, Russo MG, Naeije R. Accuracy and precision of echocardiography versus right heart catheterization for the assessment of pulmonary hypertension. Int J Cardiol 2013; 168: 4058–4062. [DOI] [PubMed] [Google Scholar]
- 31.Joosten A, Desebbe O, Suehiro K, Murphy LS, Essiet M, Alexander B, Fischer MO, Barvais L, Van Obbergh L, Maucort-Boulch D, Cannesson M, Handling editor: Paul M. Accuracy and precision of non-invasive cardiac output monitoring devices in perioperative medicine: a systematic review and meta-analysisdagger. Br J Anaesth 2017; 118: 298–310. [DOI] [PubMed] [Google Scholar]
Associated Data
This section collects any data citations, data availability statements, or supplementary materials included in this article.


