Abstract
Background:
Predicting a favorable cardiac resynchronization therapy (CRT) response holds great clinical importance.
Objective:
To examine proteins from broad biological pathways and develop a prediction tool for response to CRT.
Methods:
Plasma was collected from patients prior to CRT (SMART-AV trial) whereby a CRT response was pre-specified as a ≥15 mL reduction in LV end-systolic volume (LVESV) at 6 months, which resulted in a binary CRT response (Responders: 52%, Non-Responders: 48%; n=758).
Results:
Candidate proteins (n=74) were evaluated from the inflammatory, signaling, and structural domains, which yielded 12 candidate biomarkers, but only a subset of these demonstrated predictive value for CRT response: soluble suppressor of tumorgenicity-2, soluble tumor necrosis factor receptor-II (sTNFr-II), matrix metalloproteinases-2, and C-reactive protein. These biomarkers were used in a composite categorical scoring algorithm (Biomarker CRT Score), which identified patients with a high/low probability of a response to CRT (p<0.001) when adjusted for a number of clinical covariates. For example, a Biomarker CRT Score of 0 yielded 5 times higher odds of a response to CRT compared to a Biomarker CRT Score of 4 (p<0.001). The Biomarker CRT Score demonstrated additive predictive value when considered against a composite of clinical variables.
Conclusion:
These unique findings demonstrate that developing a biomarker panel for predicting individual response to CRT is feasible and holds potential for point of care testing and integration into evaluation algorithms for patients presenting for CRT.
Keywords: heart failure, CRT response, prediction modeling, biomarkers, multiplex assays, scoring algorithm, clinical algorithm
INTRODUCTION
Cardiac resynchronization therapy (CRT), is an important treatment for heart failure (HF) in addition to standardized medical therapy.1–8 Prior studies have obtained plasma samples from patients undergoing CRT in order to examine the effects of this device treatment upon bioactive signaling molecules and determinants of myocardial structure.8–12 The central hypothesis of this study was that a specific biomarker panel obtained prior to CRT could be developed that would predict a pre-specified CRT response. Biomarker profiling was performed in pre-CRT samples obtained as part of the trial: SmartDelay Determined AV Optimization: A Comparison to Other AV Delay Methods Used in Cardiac Resynchronization Therapy (SMART-AV: ClinicalTrials.gov Identifier: NCT00677014). The pre-specified primary response definition was an absolute change in LV end-systolic volume (LVESV) at 6 months following CRT. The initial findings from this CRT trial have been reported previously.7 While this pre-specified LV response yielded a relatively lower CRT response rate than studies utilizing quality of life measures, this stratification of response to CRT provided a unique opportunity to examine whether and to what degree prospectively collected and blinded blood samples, subjected to unbiased biomarker assessment, would predict this pre-specified response to CRT. This study quantified and evaluated a large and diverse group of analytes with potential relevance to HF, and using statistical modeling, developed a composite biomarker score, the Biomarker CRT Score, in order to predict CRT response. The rationale for the Biomarker CRT Score was to move beyond complex multivariable predictive models and to provide a potentially clinically relevant and applicable tool in the context of evaluating patients with HF for CRT.
METHODS
Patients enrolled in the SMART-AV trial biomarker sub-study informed consent which was approved by the participating institutional IRB. The study was performed in a step-wise fashion. First, Biomarker Identification was performed. Next, Biomarker CRT Score Development and Validation was performed. Finally, the Biomarker CRT Score Utilization was examined with respect to established clinical/demographic variables that have been associated previously with CRT response.5
Detailed methodological approaches are provided in the Supplemental Methods. Age and gender matched normal subjects were incorporated into the analysis (n=26) for the purpose of defining referent normal values.
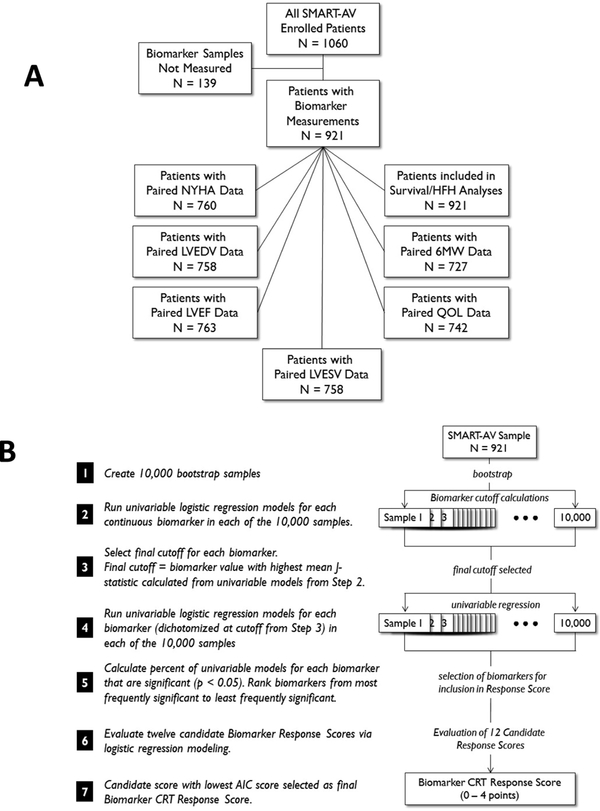
The Biomarker Identification Phase evaluated 74 candidate proteins for potential association with response to CRT (Supplemental Table 1). Two sets of 50 SMART-AV patients (each set consisting of 25 responders/25 non-responders) were used and 12 of the initial 74 biomarkers were selected as candidates (Supplemental Table 1). The values from Biomarker Identification Phase were included in the full composite data set. Specific sample sizes and distribution for the primary response variable is shown in Figure 1A. The Biomarker CRT Score was created through dichotomizing and combining selected biomarkers using a bootstrap statistical methodology (Supplemental Methods and Figure 1B. A multivariable logistic regression model adjusted for age, gender, ischemic etiology, presence of left bundle branch block (LBBB), New York Heart Association (NYHA) classification, LV ejection fraction (LVEF), and QRS duration. A previously developed clinical CRT, the MADIT-CRT study (MADIT-CRT Score),5 was evaluated with respect to the Biomarker CRT Score.
Figure 1.
(A) Sample sizes and distribution for biomarker measurements and primary/secondary end-points utilized in the present study from the SMART-AV trial. (B) Biomarker selection algorithm for predicting response to CRT whereby 12 candidate biomarkers were moved forward for evaluation.
RESULTS
Biomarker Identification
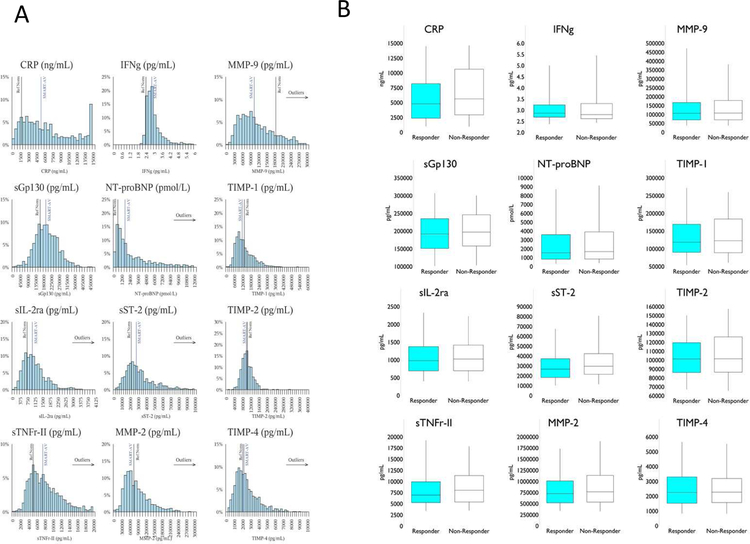
A final subset of 12 biomarkers were selected as candidates for the Biomarker CRT Score: soluble suppressor of tumorgenicity-2: sST2; C-reactive protein: CRP; soluble glycoprotein-130: SGP-130; soluble interleukin-2 receptor: sIL-2R; soluble tumor necrosis factor receptor-II: sTNFR-II; interferon gamma: IFNg), natriuretic (brain natriuretic peptide fragment: NT-proBNP, matrix metalloproteinase −2 and −9: MMP-2/−9; and tissue inhibitors of MMP: TIMP-1, −2, −4 (Table 1). When dichotomized in terms of CRT response, baseline LV volumes were higher and ejection fraction lower in the CRT Responder group, with a higher percentage of patients with a positive response to CRT presenting with LBBB. The percentage of males was higher in the CRT Non-Responder group. Overall, the patient demographics for the SMART-AV group were similar to past CRT clinical trials.1,2,4–7 The values for the majority of final selected biomarkers were significantly different in the SMART-AV group compared to referent normal subjects. The distribution for the 12 candidate biomarkers is shown in Figure 2A and as a function of 1st and 3rd quartile and median values shown in Figure 2B.
Table 1.
Demographics and Candidate Biomarker Values for SMART-AV Patients and Referent Normal Subjects*
| Characteristic | Statistic | Referent Normal (N = 26) |
Smart-AV (N =921) |
p-value | Responders (N =391) |
Non-Responders (N = 367) |
p-value |
|---|---|---|---|---|---|---|---|
| Age (y) | Mean ± SE Median (25th, 75th %ile) |
66.6 ± 1.8 66.0 (63.0, 73.0) |
66.2 ± 0.4 67.0 (59.0, 75.0) |
0.97 | 65.9 ± 0.5 66.0 (59.0, 74.0) |
65.7 ± 0.6 67.0 (58.0, 74.0) |
0.91 |
| Gender | M/F (% M) | 18/8 (69.2%) | 625/296 (67.9%) | 0.88 | 244/147 (62.4%) | 263/104 (71.7%) | 0.007 |
| LBBB | N (%) | Not Collected | 692 (75%) | N/A | 322 (82%) | 252 (69%) | < 0.001 |
| LVEF (%) | Mean ± SE Median (25th, 75th %ile) |
67.9 ± 1.4 67.0 (63.8, 72.6) |
27.5 ± 0.3 26.9 (21.0, 33.9) |
< 0.001 | 25.7 ± 0.4 25.3 (20.0, 31.0) |
30.0 ± 0.5 29.8 (23.1, 36.8) |
< 0.001 |
| LVESV (mL) | Mean ± SE Median (25th, 75th %ile) |
35 ± 2 34 (26, 43) |
130 ± 2 117 (84, 157) |
< 0.001 | 144 ± 3 128 (98, 170) |
117 ± 3 103 (75, 146) |
< 0.001 |
| CRP (ng/mL) | Mean ± SE Median (25th, 75th %ile) |
2984 ± 617 1779 (1067, 3400) |
6514 ± 146 5436 (2831, 9756) |
< 0.001 | 5874 ± 211 4784 (2383, 8199) |
6806 ± 237 5632 (2941, 10646) |
0.004 |
| sGp130 (pg/mL) | Mean ± SE Median (25th, 75th %ile) |
165123 ± 8951 162625 (123059, 207369) |
200198 ± 2144 196123 (154450, 244425) |
0.006 | 196763 ± 32 6 191736 (150888, 235030) |
200837 ± 3342 196943 (157929, 246126) |
0.27 |
| sIL-2ra (pg/mL) | Mean ± SE Median (25th, 75th %ile) |
846 ± 70 762 (598, 974) |
1145 ± 21 1015 (701, 1410) |
0.008 | 1134 ± 34 978 (695, 1375) |
1141 ± 33 1027 (697, 1418) |
0.68 |
| sTNFr-II (pg/mL) | Mean ± SE Median (25th, 75th %ile) |
6404 ± 621 5259 (4672, 6542) |
9250 ± 263 7635 (5333, 10929) |
0.002 | 8913 ± 493 6950 (5260, 9939) |
9190 ± 286 8052 (5396, 11322) |
0.003 |
| IFNg (pg/mL) | Mean ± SE Median (25th, 75th %ile) |
3.2 ± 0.8 2.4 (2.4, 2.6) |
4.3 ± 0.5 2.9 (2.6, 3.2) |
< 0.001 | 3.4 ± 0.2 2.9 (2.7, 3.2) |
5.5 ± 1.3 2.8 (2.6, 3.3) |
0.56 |
| NT-proBNP (pmol/L) | Mean ± SE Median (25th, 75th %ile) |
851 ± 104 673 (467, 1294) |
2952 ± 96 1735 (874, 4045) |
< 0.001 | 2631 ± 139 1534 (820, 3601) |
2877 ± 145 1679 (846, 3897) |
0.16 |
| sST-2 (pg/mL) | Mean ± SE Median (25th, 75th %ile) |
23741 ± 2094 22056 (18079, 26244) |
34720 ± 762 28557 (20462, 41837) |
0.003 | 31184 ± 987 26769 (18394, 37317) |
35749 ± 1197 29748 (21583, 42503) |
0.001 |
| MMP-2 (pg/mL) | Mean ± SE Median (25th, 75th %ile) |
790795 ± 45595 770113 (666576, 905448) |
877129 ± 15968 767645 (536830, 1104317) |
0.98 | 832740 ± 22341 724524 (519381, 1010567) |
899773 ± 27573 767645 (534363, 1135681) |
0.13 |
| MMP-9 (pg/mL) | Mean ± SE Median (25th, 75th %ile) |
191221 ± 19994 186979 (91462, 295038) |
146066 ± 4779 106801 (67204, 172259) |
0.004 | 144978 ± 6879 106801 (69433, 167351) |
149221 ± 8196 108319 (70022, 179013) |
0.80 |
| TIMP-1 (pg/mL) | Mean ± SE Median (25th, 75th %ile) |
142776 ± 6463 138676 (124832, 167069) |
139950 ± 2303 122630 (90070, 176917) |
0.12 | 136534 ± 3572 118659 (90029, 169334) |
138547 ± 3429 122867 (88969, 184127) |
0.44 |
| TIMP-2 (pg/mL) | Mean ± SE Median (25th, 75th %ile) |
104209 ± 2799 106349 (95839, 110460) |
105103 ±9 25 101823 (86769, 120942) |
0.68 | 103811 ± 1338 101243 (86066, 119650) |
106265 ± 1585 101533 (86468, 126132) |
0.34 |
| TIMP-4 (pg/mL) | Mean ± SE Median (25th, 75th %ile) |
2510 ± 207 2112 (1905, 3087) |
2608 ± 52 2263 (1550, 3225) |
0.77 | 2618 ± 85 2249 (1524, 3301) |
2599 ± 81 2276 (1575, 3201) |
0.65 |
The 12 candidate biomarkers shown here were selected from an initial screening of 74 biomarkers, and these 12 were then subjected to further analysis for developing a final composite Biomarker CRT Score. The clinical demographic variables were considered as covariates/confounding variables in developing predictive models for the Biomarker CRT Score. Referent Normal values are presented as a frame of reference for the SMART-AV patient values.
Figure 2.
(A) Histograms for the 12 candidate biomarkers measured in the entire SMART-AV CRT sample set (n=758) with a vertical line representing the mean of the SMART-AV sample. The referent normal values (“Ref Norm”; age-matched control subjects (n=26)) vertical line has been superimposed as a frame of reference. (B) Distribution of the 12 candidate biomarkers as a function of 1st and 3rd quartile and the median value (box and whisker plots), dichotomized for the pre-specified response to CRT. NT-proBNP: 1pmol/L = 0.445 ng/mL
Biomarker CRT Score Performance and Validation
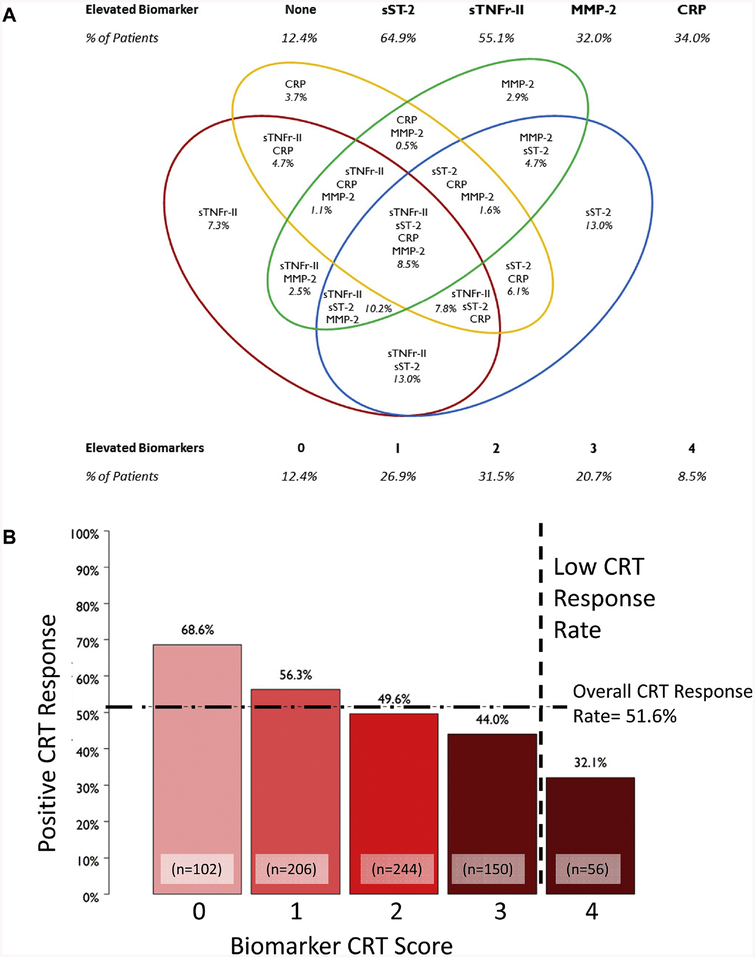
The Biomarker CRT Score was developed as shown in Table 2A whereby the set-point for inclusion was greater than 70% of the univariate models being significant (Table 2A), which resulted in inclusion of 4 biomarkers: sTNFr-II, sST-2, CRP, and MMP-2. The Biomarker CRT Score was then developed; 1 point value was assigned for each biomarker that exceeded a specific threshold: sTNFr-II ≥ 7,090 pg/mL, sST-2 ≥ 23,721 pg/mL, CRP ≥ 7,381 ng/mL, and MMP-2 ≥ 982,000 pg/mL (Table 2A). The biomarker values and the Biomarker CRT Scores are shown in Figure 3A. The Biomarker CRT Score was significantly associated with response to CRT (Figure 3B). Of the patients with a Biomarker CRT Score of 0, approximately 70% were CRT responders compared to only 32% with a Biomarker CRT Score of 4. When the Biomarker Identification Phase cohort (2 sets of 50 SMART-AV patients) was removed from this analysis, the findings remained unchanged (Supplemental Table 2). The Biomarker CRT Score was significantly associated with absolute and relative reductions in LVESV (Table 2B).
Table 2A.
Biomarker Selection Results Used to Develop Final Biomarker Cassette for Biomarker CRT Score*
| Biomarker | Cutoff | Percent of Significant Bootstrap Univariable Models | Median (2.5th, 97.5th Percentiles) Odds Ratio* from Bootstrap Models | Mean AIC from Bootstrap Response Score Model (Model Included Biomarker and all preceding Biomarkers) | Contribution to Biomarker Response Score |
|---|---|---|---|---|---|
| sTNFr-II (pg/mL) | 7,090 | 91.4% | 1.64 (1.22, 2.19) | 1040.93 | ≥ 7,090 = 1 point |
| sST-2 (pg/mL) | 23,721 | 90.7% | 1.65 (1.23, 2.23) | 1033.45 | ≥ 23,721 = 1 point |
| CRP (ng/mL) | 7,381 | 74.6% | 1.50 (1.10, 2.05) | 1031.02 | ≥ 7,381 = 1 point |
| MMP-2 (pg/mL) | 982,000 | 70.1% | 1.49 (1.09, 2.03) | 1028.69 | ≥ 982,000 = 1 point |
| TIMP-2 (pg/mL) | 124,257 | 63.7% | 1.50 (1.06, 2.12) | 1029.00 | Not selected |
| NT-proBNP (pmol/L) | 1,430 | 36.9% | 1.27 (0.95, 1.69) | 1033.74 | Not selected |
| sGp130 (pg/mL) | 218,820 | 31.9% | 1.25 (0.93, 1.70) | 1032.23 | Not selected |
| TIMP-1 (pg/mL) | 173,634 | 30.1% | 1.27 (0.92, 1.78) | 1031.38 | Not selected |
| IFNg (pg/mL) | 3.4 | 30.0% | 1.29 (0.91, 1.83) | 1030.00 | Not selected |
| sIL-2ra (pg/mL) | 978 | 16.7% | 1.16 (0.87, 1.54) | 1030.74 | Not selected |
| MMP-9 (pg/mL) | 155,246 | 6.4% | 1.05 (0.77, 1.43) | 1032.72 | Not selected |
| TIMP-4 (pg/mL) | 2,923 | 5.5% | 0.95 (0.70, 1.30) | 1033.07 | Not selected |
Odds Ratio of CRT Response, comparing < cutoff to ≥ cutoff
The 12 candidate biomarkers were subjected to Bootstrapping modeling and a set-point of >70% of the univariate models was established for final inclusion.
Figure 3.
(A) The final 4 biomarkers selected were used to develop a categorical Biomarker CRT Score. The distribution of the different permutations for elevated biomarker clusters is presented and was used in the composite score algorithm. (B) Distribution of response to CRT as a function of the Biomarker CRT Score, whereby the overall positive response to CRT was ~52%. A Biomarker CRT Score of 0 identified patients with a much higher likelihood of a favorable response to CRT and a score of 4 conferred a poor likelihood of response to CRT (Chi-Square analysis, p<0.001). As shown by the vertical dashed line, the Biomarker CRT Score identified a subset of patients with a very low probability for a response to CRT. The sample sizes for these Biomarker CRT Score quartiles are shown.
Table 2B.
Changes in the Primary Response Variable from the SMART-AV Trial as a Function of Biomarker CRT Score*
| Biomarker CRT Score | Absolute Change in LVESV* | Relative Change in LVESV+ |
|---|---|---|
| 0 | −30 ± 39 | −22.1% ± 30.5% |
| 1 | −25 ± 50 | −15.7% ± 34.2% |
| 2 | −14 ± 43 | −9.1% ± 35.4% |
| 3 | −13 ± 41 | −6.9% ± 31.8% |
| 4 | −5 ± 36 | −0.2% ± 25.9% |
The Biomarker CRT Score when considered as 5 ordinal treatment groups, was associated with a significant difference in both absolute and percent changes in LVESV (absolute change: Cuzick trend test statistic=5.2, *= p<0.001; relative change: Cuzick trend test statistic=5.9, +p<0.001). Specifically, with a lower Biomarker CRT Score the mean decrease in LVESV was greater, whereas with a higher Biomarker CRT Score a much smaller mean decrease in LVESV occurred.
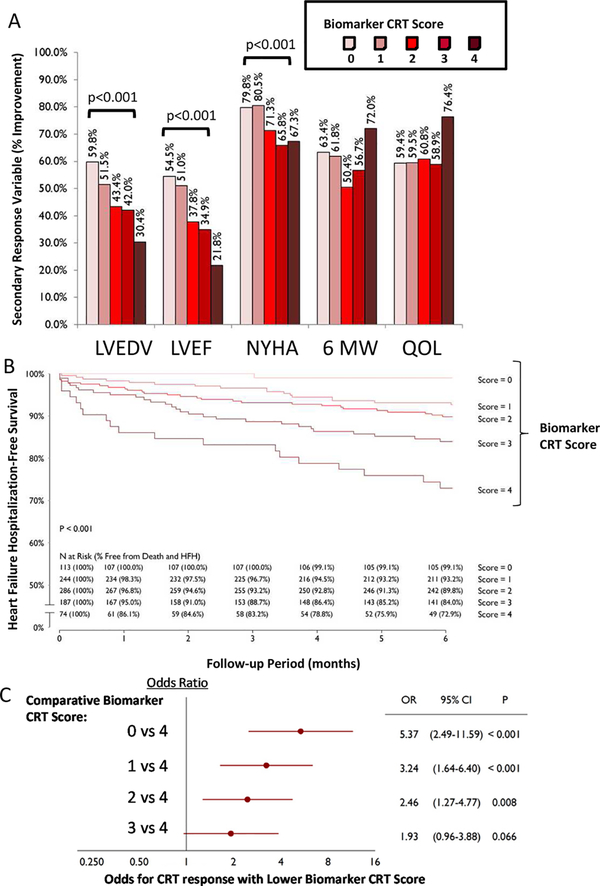
The Biomarker CRT Score was next examined for association with secondary response variables: LV end-diastolic volume (LVEDV), LVEF, NYHA classification, Six Minute Walk, and Quality of Life (QOL) Questionnaire (Supplemental Methods). Significant relationships were observed for several of these secondary outcomes (Figure 4A). For example, a reduction in LVEDV and an increase in LVEF occurred in patients with a low Biomarker CRT Score, whereas these changes occurred in a much lower percentage of patients with a high Biomarker CRT Score. The composite freedom from HF/death was highest in those patients with a low Biomarker CRT Score and was lower with a high Biomarker CRT Score (Figure 4B).
Figure 4.
(A) Distribution of Biomarker CRT Score as a function of changes in secondary response variables: LV end-diastolic volume (EDV), LV ejection fraction (EF), NYHA classification, Six Minute Walk test (6 MW), and Quality of Life (QOL) questionnaire. With a higher Biomarker CRT Score, LV functional indices and NYHA worsened at the end of the follow-up period in those patients with a high CRT response score vs those with a low Biomarker CRT Score (all p<0.001 as indicated). However, 6 MW and QOL score were not related to Biomarker CRT Score (p=0.965, p=0.174, respectively). (B) A Composite Freedom from Death and Heart Failure Hospitalization over the course of the observation period (6 months) was constructed as a function of Biomarker CRT Score. As the Biomarker CRT Score increased, the composite mortality/morbidity outcome worsened (log-rank test; p<0.001). The table shows the values computed at each time point and the relative risk as a function of Biomarker CRT Score. (C) Comparison of Odds of CRT Response between Biomarker CRT Scores, adjusted for confounding variables described in the text. A high Biomarker CRT Score resulted in low odds for a positive response to CRT. For example, a Biomarker CRT Score of 4 yielded a 5 times lower odds for a positive response to CRT compared to a Biomarker CRT Score of 0 (p<0.001).
Biomarker CRT Score Utilization
Patient demographics and functional variables for the entire SMART-AV patient group as a function of Biomarker CRT Scores are shown in Supplemental Table 3. With a low Biomarker CRT Score, the patients were younger, with a higher percentage female, presenting with LBBB, and a non-ischemic HF etiology. These demographic characteristics have been reported to be associated with a positive CRT response previously.4−7 The Biomarker CRT Score was independently predictive of a CRT response after adjusting for these clinical covariates (Figure 4C). The comparative odds for a positive CRT response following covariate adjustment demonstrated that with a high Biomarker CRT Score, patients were 5 times more likely not to respond to CRT when compared to a low Biomarker CRT Score.
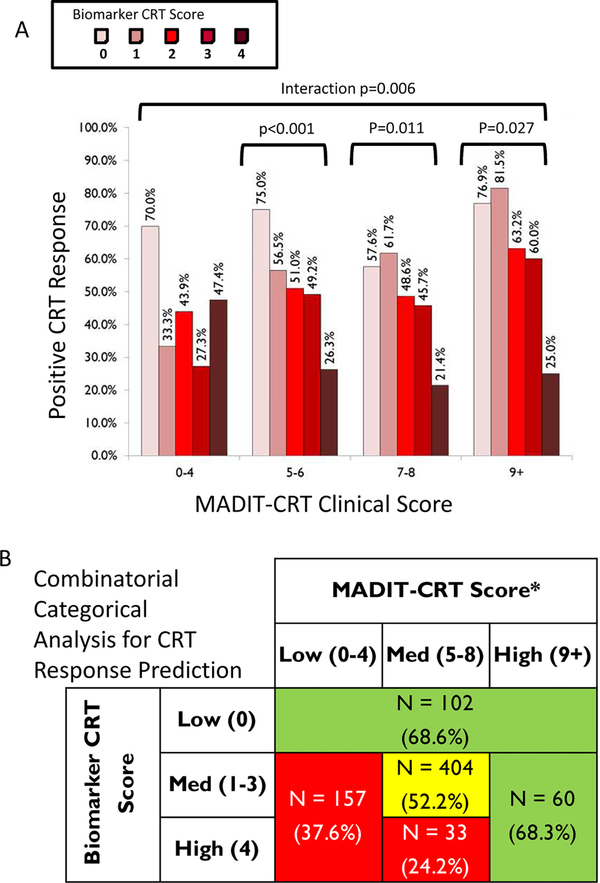
The entire patient dataset was next examined in relation to the previously established MADIT-CRT Score5 (Supplemental Table 3). There was no relation between the MADIT-CRT Score and the Biomarker CRT Score at enrollment (p=0.135). An interaction between the Biomarker CRT Score and the MADIT-CRT Score occured (Figure 5A, Mantel-Haenszel p=0.006). In three of the MADIT-CRT Score groups, the Biomarker CRT Score provided additional CRT response stratification which would not have been identified by this clinical scoring algorithm alone. In order to further integrate both the Biomarker CRT and MADIT-CRT Scores, an adaptive design, using recursive partitioning was utilized (Supplemental Methods) and illustrated in Supplemental Figure 1. Briefly, the Biomarker CRT and MADIT-CRT Scores were placed into 3 groups and the distribution of response to CRT re-examined (Figure 5B). This analysis further demonstrated that the Biomarker CRT Score uniquely and in an additive fashion, identified a subset of patients with a low likelihood of responding to CRT, which would not have been realized by a clinical scoring algorithm alone. Specifically, a high Biomarker CRT Score continued to identify a cohort of patients with low likelihood of a response to CRT.
Figure 5.
(A) Distribution of Biomarker CRT Score as a function of a composite MADITCRT Score.5 With higher MADIT-CRT Scores (>5), a subset of patients could still be identified with a high probability of a favorable response to CRT using the Biomarker CRT Score (bracket indicates p<0.05). Thus, despite classifying patients using a previously established CRT clinical scoring algorithm, a subset of patients could be identified over and above this clinical scoring algorithm. (B) Using an adaptive design and recursive partitioning (Supplemental Methods) demonstrated that the Biomarker CRT Score identified a subset of patients with a low likelihood of response to CRT, which would not have been realized by a clinical scoring algorithm alone.
DISCUSSION
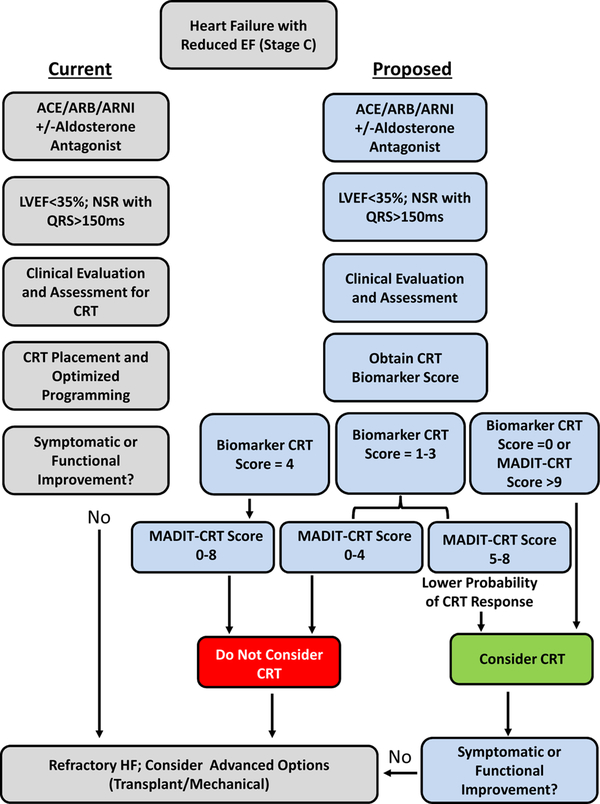
In patients presenting with a very similar HF phenotype, a sizeable proportion of patients do not respond to CRT.5–7 Thus, while the reported relative response rate to CRT is influenced by definition, improved prediction of those patients at greatest risk for either equivocal or poor response to CRT would address a significant unmet medical need. The present study performed a prospective approach of biomarker analysis prior to CRT implant and developed a prediction model for response to CRT. The unique and significant findings were 4-fold. First, in a large CRT patient sample size, pre-CRT values were different between CRT response groups for biomarkers from several functional domains. Second, a specific biomarker panel, which included indices of inflammation (sST-2, sTNFr-II, CRP) and extracellular matrix structure (MMP-2), provided predictive value in terms of a pre-specified response to CRT. Third, when these biomarkers were clustered to form an a categorical index, the Biomarker CRT Score, subsets of patients were identified with a very low and very high likelihood of a favorable response to CRT. This Biomarker CRT Score was independent of other clinical/demographic variables that can influence response to CRT. Finally, when examined in conjunction to a clinical CRT scoring algorithm, the Biomarker CRT Score identified a specific subset of patients with a low likelihood of a CRT response, which heretofore would have gone unrecognized. These unique findings demonstrate that a cassette of blood based biomarkers can be used to develop a clinically applicable index for predicting individual response to CRT and holds potential for point of care testing and integration into the CRT evaluation algorithm. One potential strategy for integrating this Biomarker CRT Score into the clinical workflow is provided in Figure 6. In this illustration, the Biomarker CRT Score identified a subset of patients with a low probability of a CRT response, which would not be identified using clinical demographics or a composite CRT clinical scoring algorithm alone.
Figure 6.
A proposed integration of the Biomarker CRT Score into a clinical HFrEF algorithm. The left sequence is the current standard of care recommendations3 and the right sequence identifies how the Biomarker CRT Score in combination with a clinical CRT score (MADIT-CRT)5 would identify unique cohorts of patients with a low and high likelihood of a favorable CRT response. In patients with a high Biomarker CRT Score, a low probability of a CRT response exists and alternative/advanced HF treatment may be appropriate. A low Biomarker CRT Score coupled with a high MADIT-CRT score would confer a high probability of a CRT response. A moderate Biomarker CRT Score coupled with a low MADIT-CRT would also suggest a low likelihood of a favorable CRT response. This schematic is derived from results shown in Figure 5B.
Biomarker Profiling and Response to CRT
While past studies have identified changes in a specific biomarker and relation to outcomes following CRT,8–12 a prospectively collected and unbiased biomarker array approach had not been performed. The present study identified a cassette of biomarkers with predictive value for a CRT response, but it is unlikely this is the optimal set of biomarkers for CRT response prediction. For example, expanding the domain of biomarker candidates to non-peptide structures, such as microRNAs, may hold relevance.13 Nevertheless, the present study, to our knowledge, is the first of its kind to encompass a broad protein screening approach of plasma samples collected in a prospective fashion for the purposes of predictive modeling to a pre-defined CRT response. Consistent with the HF phenotype, the present study identified that a number of biomarkers reflective of a pro-inflammatory state were elevated and past studies have identified that changes in several of these inflammatory markers were associated with the generalized functional response to CRT.14 In the present study, our approach identified that sST-2 and CRP levels provided predictive value for response to CRT. The function of sST-2 in general appears to be that of a decoy receptor for a member of the interleukin family and can induce a generalized induction of inflammatory mediators.15 Changes in plasma MMP and TIMP levels have been identified previously in patients with HF and primary systolic or diastolic dysfunction.16,17 While not included in the final cassette, our univariate analysis identified both TIMP-1 and TIMP-2 as potential biomarker candidates. Tolosana et al identified in a retrospective set of samples with a 12 month follow-up from CRT that TIMP-1 levels may hold predictive value in terms of response to CRT.11 The findings from this past study and the present findings underscores the concept that it is unlikely that a single biomarker will be sufficient to provide predictive information in terms of response to CRT, but rather a cassette of biomarkers will likely need to be considered in terms of providing potential predictive value.
Limitations and Summary
One of the limitations of biomarker profiling is that it can be considered descriptive from a mechanistic standpoint. However, a direct mechanistic association between specific biomarkers to underlying cellular-molecular events does not preclude utility in terms of clinical applications for diagnosis and prognosis. It must also be recognized that the present study removed a number of potential biomarkers from further analysis due to performance characteristics rather than a lack of association with response to CRT. This study was predicated upon utilizing an LV volumetric variable (LVESV) to define the pre-specified definition of response to CRT, and thus future work using the Biomarker CRT Score to predict other measures of response to CRT will be required.
Prior to this study, any biomarker study performed in the context of CRT was, in general, a retrospective, non-blinded study that often was statistically underpowered and considered a pre-specified set of biomarkers. Moreover, past studies have utilized a modeling algorithm that makes clinical deployment of the biomarker measurement problematic. The report presented herein is the first study that prospectively designed a biomarker analysis using a large sample size, which demonstrated that a Biomarker CRT Score could be utilized to identify subsets of patients with different likelihood of response to CRT. The significance of this finding is further underscored by recent consensus guidelines that propose integration of biomarker profiling in patients with developing HF.3
Supplementary Material
Conflict of Interest.
The authors wish to acknowledge the technical expertise and assistance of Robert Stroud, MUSC. This work was supported by the National Institute of Health grant HL095608 (FGS), a Merit Award from the Veterans’ Affairs Health Administration (FGS), and an unrestricted grant from Boston Scientific (FGS).
TEM, CMS, NW, KMS are employees of Boston Scientific.
Footnotes
Publisher's Disclaimer: This is a PDF file of an unedited manuscript that has been accepted for publication. As a service to our customers we are providing this early version of the manuscript. The manuscript will undergo copyediting, typesetting, and review of the resulting proof before it is published in its final citable form. Please note that during the production process errors may be discovered which could affect the content, and all legal disclaimers that apply to the journal pertain.
Identifier: NCT00677014
References
- 1.Bristow MR, Saxon LA, Boehmer J, et al. Cardiac-resynchronization therapy with or without an implantable defibrillator in advanced chronic heart failure. N Engl J Med. 2004;350(21):2140–50. [DOI] [PubMed] [Google Scholar]
- 2.Cleland JG, Daubert JC, Erdmann E, Freemantle N, Gras D, Kappenberger L, Tavazzi L, Cardiac Resynchronization-Heart Failure (CARE-HF) Study Investigators. The effect of cardiac resynchronization on morbidity and mortality in heart failure. N Engl J Med. 2005;352(15):1539–49. [DOI] [PubMed] [Google Scholar]
- 3.Yancy CW, Jessup M, Bozkurt B, et al. 2017 ACC/AHA/HFSA Focused Update of the 2013 ACCF/AHA Guideline for the Management of Heart Failure: A Report of the American College of Cardiology/American Heart Association Task Force on Clinical Practice Guidelines and the Heart Failure Society of America. J Card Fail. 2017;23(8):628–651. [DOI] [PubMed] [Google Scholar]
- 4.Boriani G, Gasparini M, Landolina M, et al. Effectiveness of cardiac resynchronization therapy in heart failure patients with valvular heart disease: comparison with patients affected by ischaemic heart disease or dilated cardiomyopathy. The InSync/InSync ICD Italian Registry. Eur Heart J. 2009;30(18):2275–83. [DOI] [PMC free article] [PubMed] [Google Scholar]
- 5.Goldenberg I, Moss AJ, Hall WJ, et al. Predictors of response to cardiac resynchronization therapy in the Multicenter Automatic Defibrillator Implantation Trial with Cardiac Resynchronization Therapy (MADIT-CRT). Circulation. 2011;124(14):1527–36. [DOI] [PubMed] [Google Scholar]
- 6.Pires LA, Abraham WT, Young JB, Johnson KM, MIRACLE and MIRACLE-ICD Investigators. Clinical predictors and timing of New York Heart Association class improvement with cardiac resynchronization therapy in patients with advanced chronic heart failure: results from the Multicenter InSync Randomized Clinical Evaluation (MIRACLE) and Multicenter InSync ICD Randomized Clinical Evaluation (MIRACLE-ICD) trials. Am Heart J. 2006;151(4):837–43. [DOI] [PubMed] [Google Scholar]
- 7.Ellenbogen KA, Gold MR, Meyer TE, et al. Primary results from the SmartDelay determined AV optimization: a comparison to other AV delay methods used in cardiac resynchronization therapy (SMART-AV) trial: a randomized trial comparing empirical, echocardiography-guided, and algorithmic atrioventricular delay programming in cardiac resynchronization therapy. Circulation. 2010;122(25):2660–8. [DOI] [PubMed] [Google Scholar]
- 8.Berger R, Shankar A, Fruhwald F, Fahrleitner-Pammer A, Freemantle N, Tavazzi L, Cleland JG, Pacher R. Relationships between cardiac resynchronization therapy and N-terminal pro-brain natriuretic peptide in patients with heart failure and markers of cardiac dyssynchrony: an analysis from the Cardiac Resynchronization in Heart Failure (CARE-HF) study. Eur Heart J. 2009;30(17):2109–16. [DOI] [PubMed] [Google Scholar]
- 9.Pitzalis MV, Iacoviello M, Di Serio F, et al. Prognostic value of brain natriuretic peptide in the management of patients receiving cardiac resynchronization therapy. Eur J Heart Fail. 2006;8(5):509–14. [DOI] [PubMed] [Google Scholar]
- 10.Hessel MH, Bleeker GB, Bax JJ, Henneman MM, den Adel B, Klok M, Schalij MJ, Atsma DE, van der Laarse A. Reverse ventricular remodelling after cardiac resynchronization therapy is associated with a reduction in serum tenascin-C and plasma matrix metalloproteinase-9 levels. Eur J Heart Fail. 2007;9(10):1058–63. [DOI] [PubMed] [Google Scholar]
- 11.Tolosana JM, Mont L, Sitges M, et al. Plasma tissue inhibitor of matrix metalloproteinase-1 (TIMP-1): an independent predictor of poor response to cardiac resynchronization therapy. Eur J Heart Fail. 2010;12(5):492–8. [DOI] [PMC free article] [PubMed] [Google Scholar]
- 12.Lellouche N, De Diego C, Cesario DA, Vaseghi M, Horowitz BN, Mahajan A, Wiener I, Boyle NG, Fonarow GC, Shivkumar K. Usefulness of preimplantation B-type natriuretic peptide level for predicting response to cardiac resynchronization therapy. Am J Cardiol. 2007;99(2):242–6. [DOI] [PubMed] [Google Scholar]
- 13.Marfella R, Di Filippo C, Potenza N, et al. Circulating microRNA changes in heart failure patients treated with cardiac resynchronization therapy: responders vs. non-responders. Eur J Heart Fail. 2013;15(11):1277–88. [DOI] [PubMed] [Google Scholar]
- 14.Tarquini R, Guerra CT, Porciani MC, Michelucci A, Padeletti M, Ricciardi G, Chiostri M, Jelic S, Padeletti L. Effects of cardiac resynchronization therapy on systemic inflammation and neurohormonal pathways in heart failure. Cardiol J. 2009;16(6):545–52. [PubMed] [Google Scholar]
- 15.Miller AM, Liew FY. The IL-33/ST2 pathway--A new therapeutic target in cardiovascular disease. Pharmacol Ther. 2011;131(2):179–86. [DOI] [PubMed] [Google Scholar]
- 16.Zile MR, Desantis SM, Baicu CF, Stroud RE, Thompson SB, McClure CD, Mehurg SM, Spinale FG. Plasma biomarkers that reflect determinants of matrix composition identify the presence of left ventricular hypertrophy and diastolic heart failure. Circ Heart Fail. 2011;4(3):246–56. [DOI] [PMC free article] [PubMed] [Google Scholar]
- 17.Sundström J, Evans JC, Benjamin EJ, Levy D, Larson MG, Sawyer DB, Siwik DA, Colucci WS, Wilson PW, Vasan RS. Relations of plasma total TIMP-1 levels to cardiovascular risk factors and echocardiographic measures: the Framingham heart study. Eur Heart J. 2004;25(17):1509–16. [DOI] [PubMed] [Google Scholar]
Associated Data
This section collects any data citations, data availability statements, or supplementary materials included in this article.


