Abstract
In this paper, the effect of coupled thermal dilation and stress on interstitial fluid transport in tumour tissues is evaluated. The tumour is modelled as a spherical deformable poroelastic medium embedded with interstitial fluid, while the transvascular fluid flow is modelled as a uniform distribution of fluid sink and source points. A hyperbolic-decay radial function is used to model the heat source generation along with a rapid decay of tumour blood flow. Governing equations for displacement, fluid flow and temperature are first scaled and then solved with a finite-element scheme. Results are compared with analytical solutions from the literature, while results are presented for different scaling parameters to analyse the various physical phenomena. Results show that temperature affects pressure and velocity fields through the deformable medium. Finally, simulations are performed by assuming that the heat source is periodic, in order to assess the extent to which this condition affects the velocity field. It is reported that in some cases, especially for periodic heating, the combination of thermoelastic and poroelastic deformation led to no monotonic pressure distribution, which can be interesting for applications such as macromolecule drug delivery, in which the advective contribution is very important owing to the low diffusivity.
Keywords: thermoporoelasticity, tissue mechanics, tumour drug delivery, tumour modelling, hyperthermia
1. Introduction
Interstitial fluid flow plays a fundamental role in drugs transport, especially for high molecular weight drugs; therefore a deep understanding of its underpinning mechanisms could be instrumental in describing and improving drug delivery to tumour masses. Furthermore, since the diffusivity of macromolecules is low, it is important to enhance the advective contribution for mass transfer. It has been shown that the interstitial fluid pressure drops drastically at the boundaries of a solid tumour [1,2], that a rapid microvascular pressure rise might enhance convection owing to the increase in transmural pressure gradients [3–5], and that interrupting blood flow slowly makes the pressure and the velocity equal to zero in the whole tumour [5].
Because of the mutual interactions between flow field and deformations, a tumour can be modelled as a deformable porous material [5], i.e. as a poroelastic medium [6,7]. This approach has been used and validated for tumours such as mammary adenocarcinoma [2] or human colon adenocarcinoma [5]. When squeezed, the interstitial fluid tends to go out of the tissue because of the deformations; on the other hand, the interstitial fluid pressure influences the solid-phase deformation. The tumour tissue equilibrium is perturbed if external parameter modulations are performed; for example, an increase in vascular pressure or a rapid decay in tumour blood flow (TBF) [5].
It is widely known that temperature can influence solid deformations. The thermal stress effects on microwave liver ablation have been numerically investigated by Keangin et al. [8], who showed that considering thermal deformations increases the reliability of the model. The effects of thermal expansion on low-density lipoprotein (LDL) deposition in arteries, together with Dufour and Soret effects, have been analysed by Chung & Vafai [9]. These authors concluded that temperature enhancement can increase the LDL concentration through the tunica intima owing to both the Soret effect (see Iasiello et al. [10,11]) and thermal dilation of the arterial wall. Fluid–structure interactions under hyperthermia in pulsatile blood conditions have been analysed by AlAmiri [12] and by AlAmiri et al. [13].
The temperature effect on solid deformations is also valid for porous materials with the so-called thermoporoelasticity theory [14], where thermal expansion effects are considered in the constitutive equations. However, the interest of the scientific community in the thermal expansion effects on fluid transport in tissues is very recent and only a few contributions are currently present in the literature.
In this work, a thermoporoelasticity model coupling thermal expansion and poroelasticity for fluid transport in a tumour tissue is presented. The scope is to assess whether programmed hyperthermia can also positively affect the fluid velocity field to induce an enhancement of the advective contribution for large molecule delivery. Volume-averaged scaled governing equations are derived for a spherical geometry. The flow field is described by the deformable porous medium Darcy law, if the tissue is purely elastic. A radial-decay heat generation function is used to simulate heat generation from the core of the tissue. Energy and displacement equations are coupled by assuming that the thermal expansion is isotropic and equal for both the solid and fluid phases and under the assumption of local thermal equilibrium (LTE) between the solid and fluid phases of the porous medium. The transient condition for the fluid flow is given by a rapid interruption of the TBF. A sensitivity analysis of the variables is presented to understand the effect of the various physical processes, and a case in which the heat source is assumed to be periodic is presented. Finally, implications for therapy are discussed.
2. Mathematical model
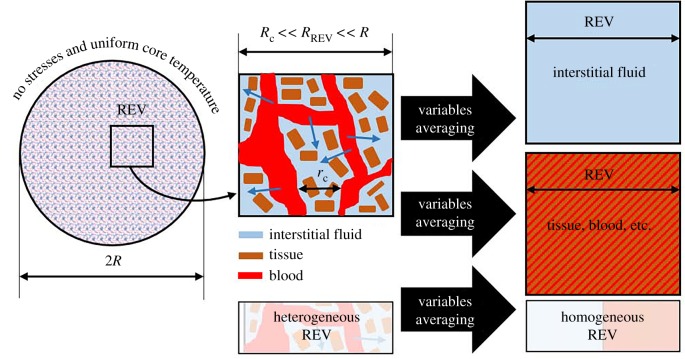
Tumour tissue is made up of interstitial or extracellular matrix, a cellular component and vascular space [15]. The tumour is here assumed to be a spherical deformable porous medium consisting of two phases: the solid phase is the extracellular space and cells, while the fluid phase is the interstitial fluid. Tumour growth effects are neglected since the time scales of these fluid transport and solid deformation phenomena herein investigated are relatively short. It is assumed that the tissue is a fluid-saturated homogeneous poroelastic medium. For the solid phase, it is assumed that, over several intercapillary distances, the domain is homogeneous and capillaries are described as sink–source points. A sketch of the geometrical model is presented in figure 1, together with the porous medium averaging process that will be described later. The physics of the problem, described by thermoporoelastic theory, is similar to the problem of a fluid that moves through an internally heated sponge: thermally induced deformations lead to a new flow distribution. Under normal conditions, the fluid goes from the vascular region to the interstitial space. When there is a pressure change, or a matrix deformation, the solid and fluid phases tend to rearrange: the fluid can go back to the capillary network or out from the poroelastic medium. The time scales in which these effects occur depend on the matrix and fluid properties.
Figure 1.
A sketch of the spherical tumour model averaging process. (Online version in colour.)
Governing equations will now be derived based on porous medium theory. A summary of all the symbols that will be introduced in the following is given in table 1. A representative elementary volume (REV) of the porous medium is defined as the volumetric average of the generic variable ζ
| 2.1 |
where ζ is a generic variable, V is the representative elementary volume and is referred to as the volumetric average [16]. In figure 1, a sketch of the porous averaged domain is presented. From here onwards, the last symbol will be dropped for the sake of simplicity.
Table 1.
Symbols used in the present work.
| symbols | ||
|---|---|---|
| cp | = | heat capacity, J kg−1 K−1 |
| C0 | = | arbitrary constant |
| e | = | electric field, V m−1 |
| E, e | = | strain tensor and volumetric strain |
| h | = | heat transfer coefficient, W m−2 K−1 |
| I | = | identity matrix |
| k | = | thermal conductivity, W m−1 K−1 |
| K | = | hydraulic conductivity, m2 Pa−1 s−1 |
| Lp | = | hydraulic permeability, m Pa−1 s−1 |
| pv, p | = | vascular and hydraulic pressure, Pa |
| Q | = | heat generation, W m−3 |
| r, r | = | radial coordinate vector and scalar, m |
| R | = | radius, m |
| S/V | = | specific surface area, m−1 |
| S | = | stress tensor, Pa |
| t | = | time, s |
| T | = | temperature, K |
| u, u | = | displacement tensor, vector and scalar, m |
| v, v | = | velocity vector and scalar, m s−1−1 |
| V | = | volume, m3 |
| Greek letters | ||
| α | = | thermal expansion coefficient, K−1 |
| αdiff | = | thermal diffusivity, m2 s−1 |
| ϕ | = | porosity |
| φ | = | voltage, V |
| λ, μ | = | Lamé parameters, Pa |
| Ω | = | Starling source term, s−1−1 |
| ρ | = | density, kg m−3 |
| σ | = | normal stress, Pa |
| τ | = | time constant, s |
| ζ | = | generic variable |
| ω | = | dimensionless pulsation |
| subscripts | ||
| c | = | capillaries |
| eff | = | effective |
| f | = | fluid phase |
| gen | = | generation |
| heat | = | heating |
| hyp | = | hyperthermia |
| i | = | interstitial |
| met | = | metabolic |
| rel | = | relative |
| REV | = | representative elementary volume |
| rif | = | reference |
| s | = | solid phase |
| t | = | thermal |
| v | = | vascular |
| dimensionless numbers | ||
| = | interstitial to transcapillary resistance | |
| γ = Fo/t* = αdiff/K(2μ + λ) | = | thermal to poroelastic time number |
| ΔT* = ΔT/Trif | = | temperature |
| Fo = αdifft/R2 | = | heating time (Fourier number) |
| Gl = (3λ + 2μ)αTrif/(2μ + λ) | = | thermal to mechanical stresses (Gay–Lussac number) |
| Nu = hR/keff | = | convection to conduction (Nusselt number) |
| p* = p/(2μ + λ) | = | pressure |
| pv* = pv/(2μ + λ) | = | vascular pressure |
| Perel = Rvrel/αdiff | = | heat convection number (Péclet number) |
| Pomet = Qmet R2/Trif keff | = | metabolic heat generation (Pomerantsev number) |
| Pohyp(r*) = Qhyp(r*) R2/Trif keff | = | hyperthermia heat generation (Pomerantsev number) |
| r* = r/R | = | radius |
| t* = t/[R2/K(2μ + λ)] | = | poroelastic time |
| u* = u/R | = | displacement |
| v* = vR/[K(2μ + λ)] | = | velocity |
Assuming that both phases have the same specific volume [5], the mass equation is presented as
| 2.2 |
where ϕ is porosity, t is time, v is fluid velocity and u is the spatial position of the solid matrix referred to a certain reference system. In equation (2.2), both the interstitial fluid velocity and solid matrix displacement velocity are related to the porosity variation with respect to the time. The source term in equation (2.2) is known as the Starling (transcapillary) term. This refers to the fluid flow across the vascular wall. Assuming that lymphatic drainage is negligible [17], this term is equal to
| 2.3 |
where Lp is the hydraulic permeability, S/V is the specific surface area, pv is the vascular pressure and p is the interstitial fluid pressure. The momentum equation for the fluid phase is written by referring to Darcy's law for a deformable porous medium, i.e. the velocity is referred to as the relative velocity between the two phases,
| 2.4 |
where K is the hydraulic conductivity.
The momentum equation for the tissue is derived in the following. For a steady-state solid without inertial forces, it is possible to write [18–20]
| 2.5 |
where S is the stress tensor.
Under the assumption of an elastic material under thermoporoelastic stresses, it is possible to write
| 2.6 |
where λ and μ are Lamé parameters, e is the volumetric strain, α is the linear thermal dilation coefficient, ΔT is the temperature difference with respect to a reference temperature, I is the identity matrix and E is the strain tensor. From equation (2.6), various contributions are split
| 2.7 |
where the porous term derives from the solid and fluid pressure hydrostatic stresses (the velocity field can be assumed to be conservative [17])
| 2.8a |
Thermal stresses are derived in the same way as the porous terms. So, it is assumed that the solid and fluid phases dilate equally since both are made up of something that essentially is water (αs = αf)
| 2.8b |
Further, in thermoporoelasticity theory, the thermal stresses are a function of only solid phase thermal dilation [14]. From infinitesimal strain theory, it is possible to write
| 2.9 |
and
| 2.10 |
Stress tensor divergence is derived as
| 2.11 |
By combining equations (2.9)–(2.11), it is possible to derive the momentum equation in the displacement formulation
| 2.12 |
where u, p and T are the unknown variables. The divergence of this equation is coupled with the equation obtained by combining equations (2.2) and (2.4),
| 2.13 |
Finally, it is possible to derive the expression
| 2.14 |
The source term on the right-hand side has the pressure as a variable, thus it is necessary to decouple this term from the rest of the equation [5]. In order to do so, equation (2.11) is written for a spherical one-dimensional reference system
| 2.15 |
The generic solution of this ODE is
| 2.16 |
where the constant C0 has to be obtained. By assuming that e (p = 0) = (3λ + 2μ)αΔT/(2μ + λ) on the external surface of the sphere (the validity of this boundary condition will be exhaustively described later), the final value is C0 = 0. Equation (2.16) with respect to p becomes
| 2.17 |
Equation (2.14) can be written under a one-dimensional spherical coordinate and combined with equation (2.17)
| 2.18 |
This can be rearranged in order to obtain
| 2.19 |
where the relationship between the volumetric strain e and displacement u for a one-dimensional spherical coordinate system is
| 2.20 |
2.1. Energy equation
Equation (2.19) is a PDE in which the temperature appears in terms of the temperature difference ΔT. This means that the temperature field has to be solved simultaneously, since it is a transient-convection-diffusion problem that depends on the flow velocity. In spherical coordinates, we have
| 2.21 |
In this equation, the second and third terms on the right-hand side are, respectively, heat generation due to metabolism and hyperthermia, if applied. Note that, in a porous medium, the metabolic heat rate depends on the relative density, which is equal to (1 − ϕ) [21]. The metabolic heat rate depends on the part of the human body considered. Values are between 227 and 102 202 [22]. The term referred to hyperthermia often depends on the radial coordinate. For example, if reference is made to thermal ablation, microwave or radiofrequencies generate heat by means of the electric field generated by an antenna. The heat generation term decreases with the radius. In the following, a law to qualitatively describe the heat generation decay along the radius is presented.
Let us consider that an antenna is placed inside the sphere, at r = 0. This antenna generates heat from a distance that is a differential higher than the axis. If the waves are in the radiofrequency range, one can assume that the propagation is totally resistive, without any source term. In this case, the Laplace equation has to be solved to determine the voltage field. In spherical coordinates, the voltage equation is
| 2.22 |
After solving the voltage equation, it is possible to derive the heat generation due to hyperthermia. It is possible to conclude that it has an inverse relationship with the fourth power of the radius, i.e.
| 2.23 |
Details on how to describe this function are presented in the next section.
Finally, the fourth term of equation (2.21) is the term due to the Starling equation (see equation (2.3)). In particular, the flow exchange through the vascular wall carries energy if there is a temperature difference between the fluid (interstitial) and solid (others) phases. Since a rapid TBF decay is investigated in this work, the Starling term goes to zero for t > 0, thus the energy term related to it is neglected in the present study.
2.2. Dimensionless form
2.2.1. Strain equation
The dimensionless form of the governing equations will now be derived. Let us define the following dimensionless variables: r* = r/R, t* = t/[R2/K(2μ + λ)], pv* = pv/(2μ + λ) and . The last dimensionless number is the ratio between the filtration resistance and transcapillary flow exchange [5]. Equation (2.19) becomes
| 2.24 |
In order to scale the thermal part of equation (2.24), a dimensionless temperature ΔT* = ΔT/Trif and the thermoelastic Gay–Lussac (Gl) number [23] are now introduced. The latter represents the ratio between the thermal and mechanical deformation, and for zero-thermal deformation (α = 0) such deformations are independent [23]
| 2.25 |
After this, it is possible to obtain the final version of the scaled thermoporoelastic equation
| 2.26 |
It should be noted that the term in square brackets is equal to
| 2.27 |
which is the ratio between the thermal and elastic components of the stress tensor presented in equation (2.7). This can give information on how the thermal stresses relate to the mechanical ones. However, since the temperature difference ΔT varies with time and space, the two numbers are analysed separately in order to split the solid matrix properties from the thermodynamic conditions of the system. Now the problem is reduced to the variables e = f(t*, r*, β, pv*, GlΔT*). The equation can also be expressed as
| 2.28 |
where the first term in round brackets on the right-hand side of the equation refers to the Starling term; see equations (2.3) and (2.17).
2.2.2. Pressure equation
The dimensionless pressure is defined as p* = p/(2μ + λ). With this, and by employing the dimensionless temperature ΔT* and the thermoelastic Gay–Lussac number, it is possible to obtain the following form for dimensionless pressure:
| 2.29 |
which for ΔT* or Gl = 0 (α = 0) reduces to the isothermal case.
2.2.3. Velocity equation
First, we scale equation (2.2). In spherical coordinates, we have
| 2.30 |
A dimensionless displacement is defined as u* = u/R, which gives us information about how much we are moving from the domain dimensions; the dimensionless velocity is v* = vR/[K(2μ + λ)]
| 2.31 |
which is the scaled form of the Darcy equation, from which it is possible to derive v*. It is important to underline that the dimensionless velocity v* is averaged over a volume that considers only the fluid phase of the porous domain. In order to obtain the whole porous domain-averaged dimensionless velocity (seepage velocity), v* should have been multiplied by the porosity ϕ. The dependence of the porosity on the fluid pressure and thermal expansion is considered in the present work, thus it is possible to write that porosity is related to the volumetric strain e by means of ϕ = (ϕ0 + e)/(1 + e), with ϕ0 = 0.20 [17]. The hydraulic conductivity K also depends on the direction and on the pressure (equivalently, on the volumetric strain e) [24], since the deformation makes the fluid pass more or less easily through the pores. Chooi et al. [24] derived a method to obtain poroelastic properties by taking into account pressure and directionality effects. From their results, it seems that for very low pressures, which are typical of capillaries and therefore of the pressure investigated in this work, the dependence of poroelastic properties on both pressure and direction vanishes; for this reason, the isotropic assumption can be used in this work. With reference to the volumetric strain dependence, by employing the correlation from Lai & Mow [25], the ratio between hydraulic conductivity and hydraulic conductivity with zero deformations is exp(2e), where the number 2 has been used in Støverud et al. [26]. It can be shown that the maximum value of exp(2e) found in the present work is less than about 3%, thus it is reasonable to neglect hydraulic conductivity variations with strain.
Now we scale equation (2.20), which is the relationship between displacement and strain for a sphere. By employing the dimensionless variables u* and v*, we obtain the final form
| 2.32 |
2.2.4. Energy equation
Starting from equation (2.21), we regroup the term 1 − ϕ in the metabolic heat term, and a relative velocity is defined as vrel = v − ∂u/∂t,
| 2.33 |
The following dimensionless groups are defined as Fo = αdifft/R2, Perel = Rvrel/αdiff, and also using r*
| 2.34 |
We recall the definition of dimensionless temperature ΔT* = ΔT/Trif, and the dimensionless heat source terms are defined as Pomet = QmetR2/Trifkeff and Pohyp(r*) = Qhyp(r*)R2/Trifkeff (known also as Pomerantsev numbers); thus the following expression is obtained:
| 2.35 |
It has been written previously that the hyperthermia heat source inversely varies with the fourth power of the radius. The function that qualitatively describes this behaviour will now be derived for the dimensionless form. By assuming that the maximum heat power is where the heat source is located, this value (Pohyp, which is the dimensionless form of Qhyp) has to be multiplied by a fourth-power hyperbolic function, f(r*), that has to guarantee f(r* = 0) = 1 and f(r* = 1) = 0. In other words, it has to have the following behaviour:
| 2.36 |
The function has been computed by using the nonlinear equation system tool of Matlab, obtaining values of −0.9845 and −0.0645 for r0 and f0, respectively.
It is possible to regroup the heat generation terms as Pogen(r*) = Pomet + Pohyp(r*), which is also known as the Pomerantsev number in its scaled form
| 2.37 |
It is important to observe that when hyperthermia occurs one can assume that Pohyp(r*) ≫ Pomet, since they have between 1 and 3 orders of magnitude difference, thus it is reasonable to assume for some cases that Pogen(r*) ≈ Pohyp(r*).
The scaled form of the energy equation is derived, with ΔT* = f(Fo, Perel, r*, Pogen(r*)). It is possible to relate scaled times Fo and t* by equalling both with the time t (an exhaustive analysis of time scales is reported later in a dedicated section)
| 2.38 |
where αdiff is the thermal diffusivity and γ is a characteristic time constant. This means that the thermal and mechanical problems are related by means of a constant. By manipulating equation (2.35), it is possible to obtain the following form of the energy equation:
| 2.39 |
with which it is possible to conclude that, when the temperature needs to be coupled to the poroelastic problem, ΔT* = f(t*, γ, Perel, r*, Pogen(r*)).
2.3. Boundary conditions
Two boundary conditions for each equation (strain, equation (2.26), and energy, equation (2.39)) are needed, together with an initial condition. A TBF rapid decay is simulated in the present study by assuming that (pv* − p*) = 0 for t* > 0, which is equivalent to saying that (pv* + GlΔT* − e) = 0. At the same time, heat generation is assumed to occur for t* > 0, thus Pohyp(r*) > 0 for t* > 0. It is worthwhile noticing that in the present work also the different heating times, called theat*, are analysed (theat* ≤ 1).
For r* = 0 there is axial symmetry, thus ∂e/∂r* = 0 and ∂ΔT*/∂r = 0. On the border of the domain, it is assumed that the periphery is sufficiently far away that the heat does not reach it, thus ΔT* = 0 for r* = 1.
The dimensionless temperature boundary condition is equivalent to assuming that the periphery of the tumour is far from the heat source in order to neglect heat propagation on the boundary, or that the periphery heat exchange with the external environment is good enough to make the temperature uniform on the boundary for the whole transient process. For the first assumption, one should recall that the heat source decay along the radius is to the fourth power (equation (2.36)), thus it does not reach the periphery; on the other hand, we can try to perform a rough estimation by assuming that there is heat exchange with the exterior by means of a Robin boundary condition
| 2.40 |
in which the exterior temperature is assumed to be equal to the reference temperature and h is the heat transfer coefficient. The boundary condition dimensionless form is
| 2.41 |
where Nu = hR/keff. For example, if one assumes that h = 200 W m−2 K−1 [27] and the tumour radius is 0.01 m, the boundary temperature variation is of the order of about ΔT* = 0.01, which makes temperature variation on the boundary negligible for the heat source function employed in the present work (equation (2.36)).
For the volumetric strain, it is assumed that the tumour is insulated from the surrounding tissue [5,17]. Based on this assumption, for r* = 1, both the pressure and the solid normal stresses have to be zero since there are no contact forces, thus it is possible to write
| 2.42 |
From equation (2.7), combined with equations (2.9) and (2.10), we can derive normal stress σ under the assumption of a one-dimensional spherical system
| 2.43 |
By recalling the definitions of the dimensionless parameters, it is possible to scale equation (2.43),
| 2.44 |
By combining equation (2.32) with (2.44), one derives
| 2.45 |
If reference is made to r* = 1, the following is obtained:
| 2.46 |
Under the assumption of small deformations, u* approaches zero (see [5,17]); further, if μ is smaller than λ [28,29], one can conclude that the first term on the right-hand side of equation (2.46) approaches 0 for r* = 1. This means that, for an isothermal tumour, e = 0. From the physical point of view, this assumption becomes reliable if the Poisson coefficient is close to 0.50, which is referred to as a virtually incompressible material (using data from Netti et al. [5], values are about 0.48–0.49). After this, it is possible to write that, for r* = 1,
| 2.47 |
which is zero in this case, since it is assumed that there is no temperature variation on the boundary.
In summary, the dimensionless boundary conditions and time constraints are reported in the following:
| 2.48 |
With reference to the hyperthermia condition on Pohyp(r*), which is switched on after the beginning of the transient process, the authors underline that this situation roughly represents the case of thermal ablation, in which heat is used to destroy cancer cells. However, in this paper, more emphasis is placed on the effects of hyperthermia on deformations and consequently on flow and pressure fields, which might be useful for macromolecule drug delivery.
2.3.1. Initial conditions
The initial conditions are obtained by solving the governing equations under steady-state conditions, by assuming that there is no heat generation due to hyperthermia. From the preliminary results, it has been shown that metabolic heat generation with a typical order of magnitude of heat-induced hyperthermia can be neglected for t* = 0 (deviations on dimensionless temperatures are less than about 4–5% for the worst case) since heat transfer is dominated by hyperthermia for t* > 0, thus steady-state heat transfer can be neglected. This means that the entire sphere is at a temperature ΔT* = 0 for t* = 0, and the heat equation could not be solved for t* = 0.
2.4. Numerical modelling
Scaled governing equations ((2.26), (2.29), (2.31), (2.32), (2.39)) are solved with a finite-element scheme by employing the PDE tool of COMSOL Multiphysics. A high-order (quintic) Lagrangian polynominal has been employed in the finite-element scheme. A free variable time stepping between 10−5 and 0.1 has been used. For each time step, the tolerance has been set equal to 10−4. A grid of about 300 elements made up with a symmetric distribution that is concentrated along the boundary with a geometrical series has been used.
2.5. Validation
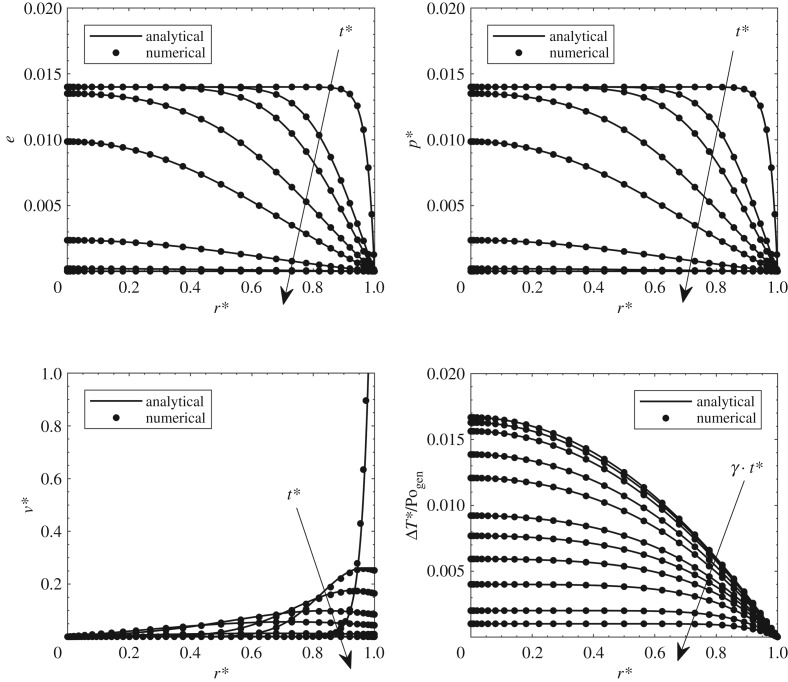
Comparisons with analytical results are presented in figure 2 for velocity, pressure, deformation and temperature fields. For the first three fields, the solution from Netti et al. [5] is employed. It is important to note that these analytical results had been experimentally validated. For the temperature fields, comparisons are carried out with a purely conductive sphere with heat generation from Carlslaw & Jaeger [30]. This validation is good for very low Péclet numbers that make the problem purely diffusive (see Iasiello et al. [10,11]). A discussion on the Péclet numbers reached is reported in the time-scale analysis later. Validation for temperature fields has been developed by assuming that the heat source is uniform through the domain.
Figure 2.
Comparisons between the numerical solution and analytical solutions from the literature.
3. Results and discussion
The scope of this paper is to perform a sensitivity analysis of hyperthermia effects on a typical transient percolation process in a tumour. As an example of a transient process, we analysed how the fluid reaches an equilibrium condition after a perturbation. To do so, the effects of thermal dilation compared with the mechanical ones, and the effects of hyperthermia, are analysed for different Pohyp(r*), assumed to be equal to the whole Pogen(r*) with good approximation, and for different heating times; on the other hand, the effects of filtration are analysed for different β. The ranges in which these variables vary are referred to the typical order of magnitudes of these applications. Typical values are summarized in table 2, together with the source.
Table 2.
Typical values of variables involved in the human tissue thermoporoelastic problem.
| parameter | value | reference | scaled number | expression | value |
|---|---|---|---|---|---|
| ϕ | 0.20 | [31] | β | 41.74 | |
| R | 0.01 (m) | [5] | γ | αdiff/K(2μ + λ) | 48.09 |
| Lp | 2.70 × 10⁻¹¹ (m Pa−1 s−1) | [32] | Gl (Trif = 37°C) | (3λ + 2μ)αTrif/(2μ + λ) | 0.058 |
| S/V | 20 000 (m−1) | [33] | |||
| K | 3.10 × 10⁻¹⁴ (m2 Pa−1 s−1) | [34] | |||
| αdiff | 1.42 × 10⁻⁷ (m2 s−1) | [35] | |||
| μ | 2026.5 (Pa) | [36] | |||
| λ | 91 192 (Pa) | [36] | |||
| α | 6.376 × 10⁻⁵ (K)−1 | [9,37] |
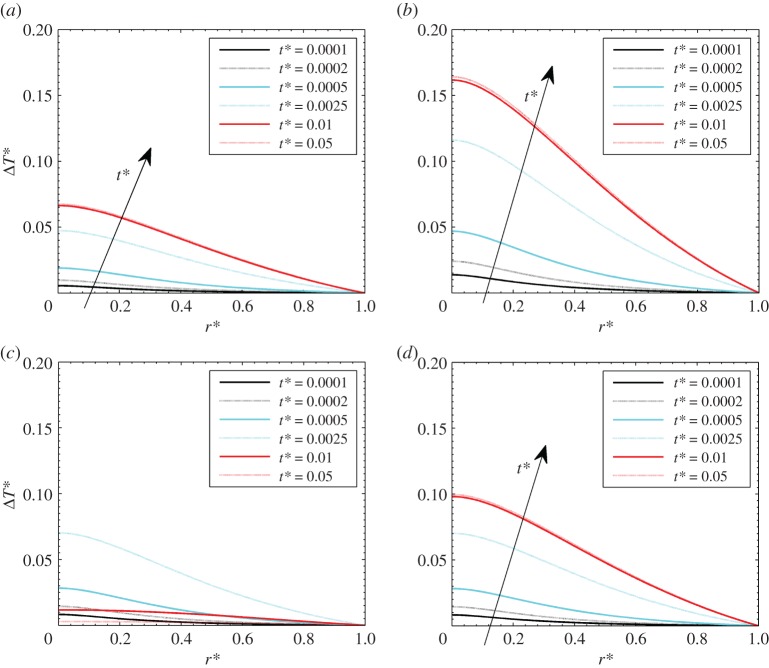
Before performing the sensitivity analysis, temperature profiles are presented in figure 3, for γ = 40 and different hyperthermia conditions, respectively, Pohyp(r* = 0) equal to 2, 5 (with theat* = 1), and Pohyp(r* = 0) equal to 3 with theat* = 0.005 and 0.05. Temperatures are higher for higher heat loads, at equal heating times. With respect to the dimensionless radial coordinate, it is shown that temperature has a maximum on the axis due to symmetry conditions, and it decreases along the radius. The decrease is not as marked as for uniform heat generation, as shown in the validation section, since it is assumed that heat generation is inversely proportional to the fourth power of the dimensionless radius. Further, from the results, it is shown that the slow decay of temperature demonstrates the robustness of the temperature boundary condition on the periphery, which is a consequence of the heat generation radial-decay assumption.
Figure 3.
Dimensionless temperature difference for different hyperthermia conditions: (a) Pohyp(r* = 0) = 2 and theat* = 1, (b) Pohyp(r* = 0) = 5 and theat* = 1, (c) Pohyp(r* = 0) = 3 and theat* = 0.005, (d) Pohyp(r* = 0) = 3 and theat* = 0.05. (Online version in colour.)
In the first part of the transient process, the temperature increases very rapidly with respect to time. Thermal equilibrium is reached at about t* = 0.05, which means that the time scales for heat transfer are lower than those for fluid percolation. With reference to the cases with different heating times (figure 3c,d), this shows that the situation is qualitatively like the cases with theat* = 1 when theat* = 0.05 (figure 3d). This occurs because the steady-state condition is achieved. On the other hand, temperature profiles are not monotonically increased with dimensionless time t* when theat* = 0.005 (figure 3c). This is because the heat generation source is switched off before the end of the heat diffusion processes.
3.1. Effect of β
The dimensionless parameter β represents the ratio between the transvascular and interstitial resistance, or equivalently the ratio of interstitial and transvascular time constants.
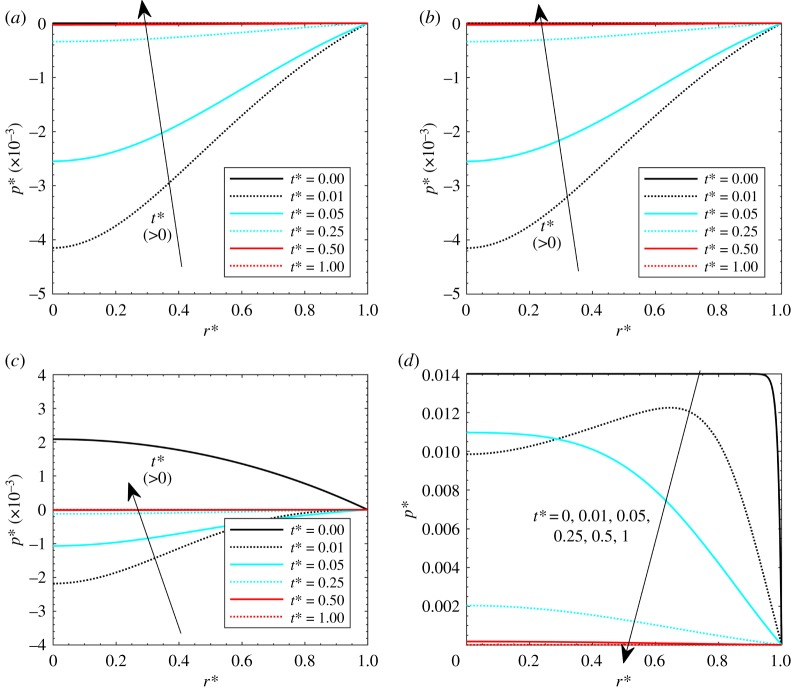
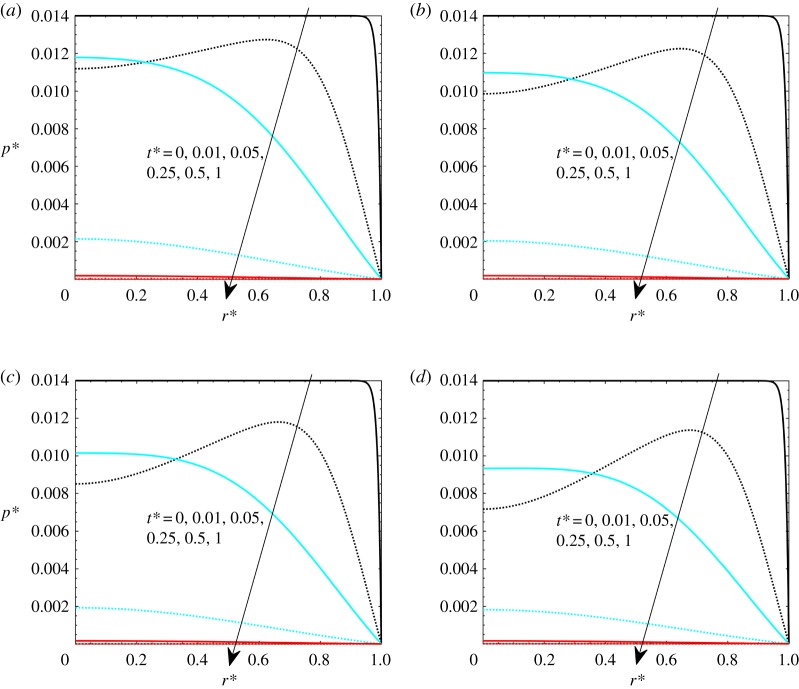
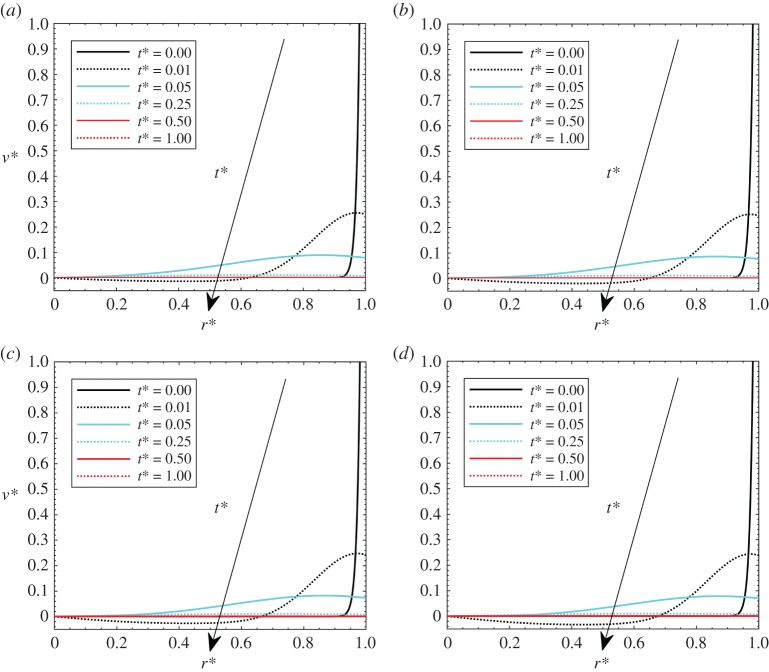
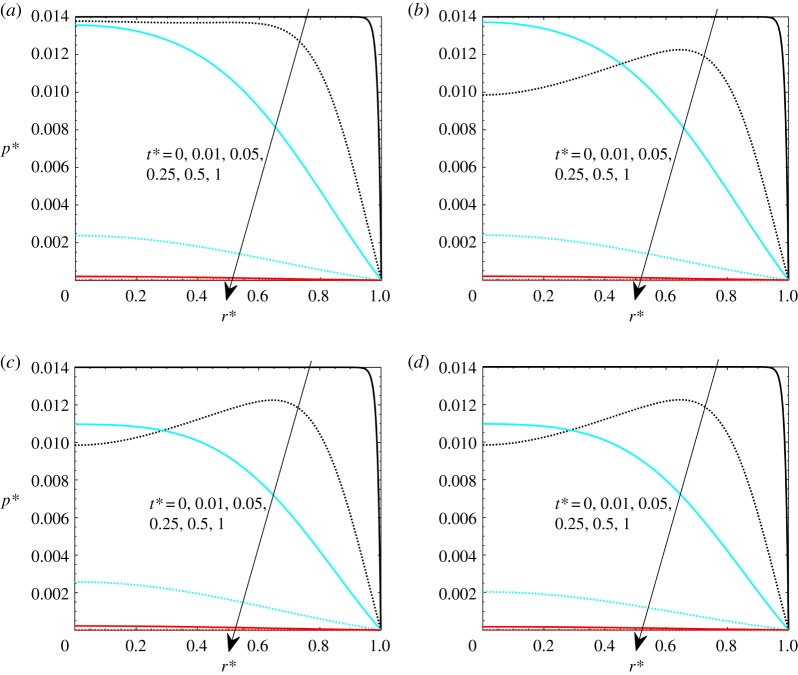
When β increases, the transvascular resistance is higher, thus the tumour tends to reach its new equilibrium configuration through the interstitial space, the pressure becomes higher and the fluid tends to go out of the domain. The effects of β on the pressure and velocity fields are presented in figures 4 and 5. β values of 0.0001, 0.01, 1 and 100 are considered, with Gl = 0.05 and Pohyp(r* = 0) = 3. With reference to the effects of β on pressure analysed in figure 4, it is shown that the values reached are generally lower for low β since there is less flow percolation through the interstitial part of the tumour. It is important to observe that the pressure drops with time since the heat application dominates over the elastic deformation, which is low since β is low. This can cause negative values of the interstitial pressure, which are reliable since the interstitial pressure (relative) can be negative. When the thermal transient process tends to reach the end, elastic effects start to dominate again, and the pressure tends to go again to the zero value. When β is high (β = 100), the interstitial effects dominate, thus the pressure always has higher values since the fluid tends to go out of the porous domain.
Figure 4.
Dimensionless pressure with Gl = 0.05, γ = 40, theat* = 1 and Pohyp(r* = 0) = 3: (a) β = 0.0001, (b) β = 0.01, (c) β = 1 and (d) β = 100. (Online version in colour.)
Figure 5.
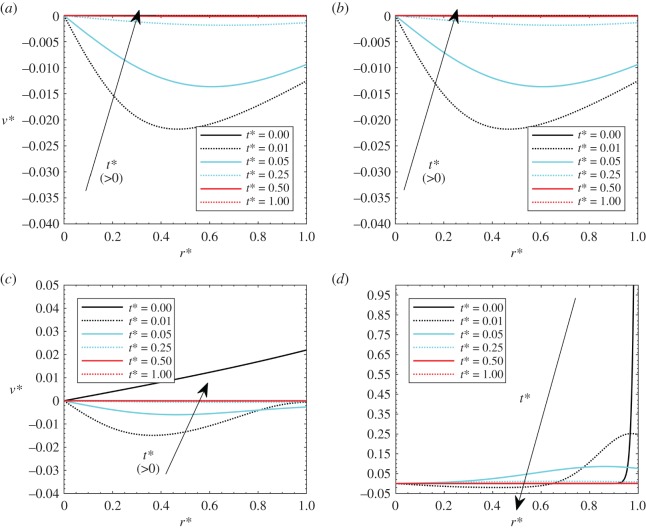
Dimensionless velocities with Gl = 0.05, γ = 40, theat* = 1 and Pohyp(r* = 0) = 3: (a) β = 0.0001, (b) β = 0.01, (c) β = 1 and (d) β = 100. (Online version in colour.)
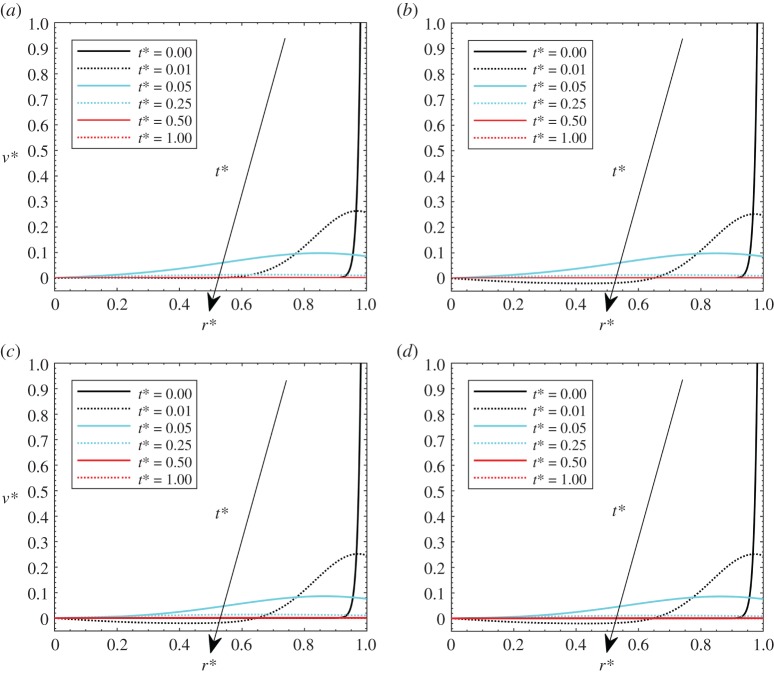
Finally, for the velocity profiles (figure 5), velocity values are generally very low for low βs, since there is no percolation. Negative values can be attained in the early stages of the transient process, since thermal expansion effects are dominating. For these cases, flow stagnation might occur. Velocity slowly goes back to higher values when a steady-state condition is reached for the temperature. At higher βs, velocities are significantly higher, with negative values in the early stages of the heat load period.
3.2. Effect of heat generation
Heat load effects are herein presented by varying Pohyp(r*) values. It should be noted that similar effects can be achieved by varying the Gay–Lussac number, but this heat load effect has been separated from thermoelastic the Gay–Lussac number in order to appreciate separately the matrix property effects and the heat load effects. In figures 6–8, the effects of heat load on the volumetric strain, pressure and velocity are presented. The investigated values are Pohyp(r* = 0) = 2, 3, 4 and 5, with Gl = 0.05 and β = 100.
Figure 6.
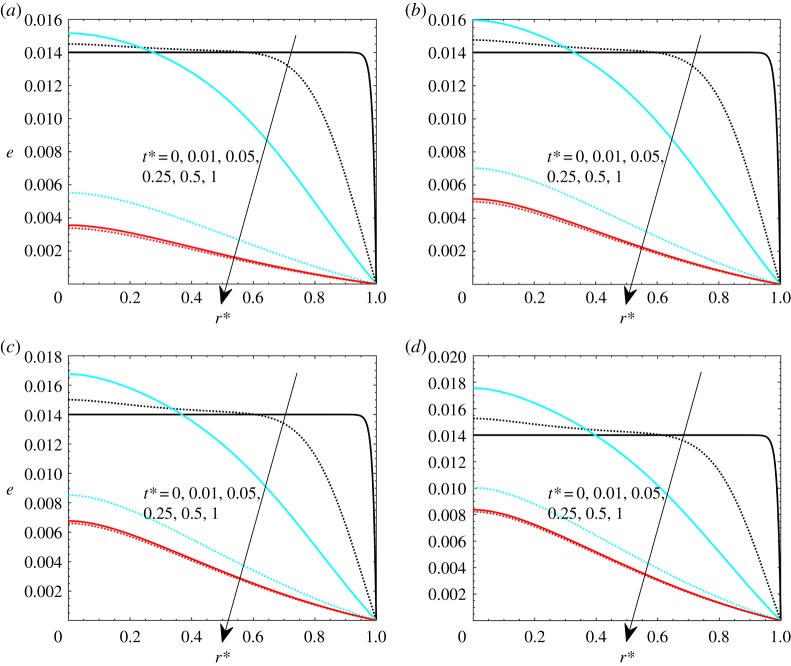
Volumetric strains with Gl = 0.05, γ = 40, theat* = 1 and β = 100: (a) Pohyp(r* = 0) = 2, (b) Pohyp(r* = 0) = 3, (c) Pohyp(r* = 0) = 4 and (d) Pohyp(r* = 0) = 5. (Online version in colour.)
Figure 7.
Dimensionless pressure with Gl = 0.05, γ = 40, theat* = 1 and β = 100: (a) Pohyp(r* = 0) = 2, (b) Pohyp(r* = 0) = 3, (c) Pohyp(r* = 0) = 4 and (d) Pohyp(r* = 0) = 5. (Online version in colour.)
Figure 8.
Dimensionless velocities with Gl = 0.05, γ = 40, theat* = 1 and β = 100: (a) Pohyp(r* = 0) = 2, (b) Pohyp(r* = 0) = 3, (c) Pohyp(r* = 0) = 4 and (d) Pohyp(r* = 0) = 5. (Online version in colour.)
The effect of heat generation on volumetric strain is presented in figure 6. It is shown that the thermal expansion effect dominates over the elastic effect in the early stages of the transient process, while the volumetric strain decreases after a while since the temperature field is close to reaching an equilibrium condition (figure 3 on temperature profiles). For higher heat loads, volumetric strain increases since there is more thermal expansion. Values reached at the end, for t* = 1, are higher for higher heat generation since there are residual strains.
Pressure effects are presented in figure 7. It is shown that, at higher thermal loads, pressure values become generally slightly lower. As for the thermoelastic Gay–Lussac number, it is shown that pressure reaches a maximum value at some points of the domain for low t* since thermal effects are dominating. Velocity profiles are presented in figure 8. Again, velocities are essentially the same, with negative values that are more pronounced for higher thermal loads.
3.3. Effect of heating time
The results for various heating times are presented in figures 9 and 10. The four cases presented are for when theat* = 0.005, 0.01, 0.05 and 1. These values, which are referred to the interstitial time scale, can be converted into the thermal scale; in particular, they respectively correspond to γ·theat* = 0.2, 0.4, 2 and 40. This means that the heating time overcomes the thermal scale of the problem (see the definition of the Fourier number in equation (2.38)).
Figure 9.
Dimensionless pressure with Gl = 0.05, Pohyp(r* = 0) = 3, γ = 40 and β = 100: (a) theat* = 0.005, (b) theat* = 0.01, (c) theat* = 0.05 and (d) theat* = 1. (Online version in colour.)
Figure 10.
Dimensionless velocities with Gl = 0.05, Pohyp(r* = 0) = 3, γ = 40 and β = 100: (a) theat* = 0.005, (b) theat* = 0.01, (c) theat* = 0.05 and (d) theat* = 1. (Online version in colour.)
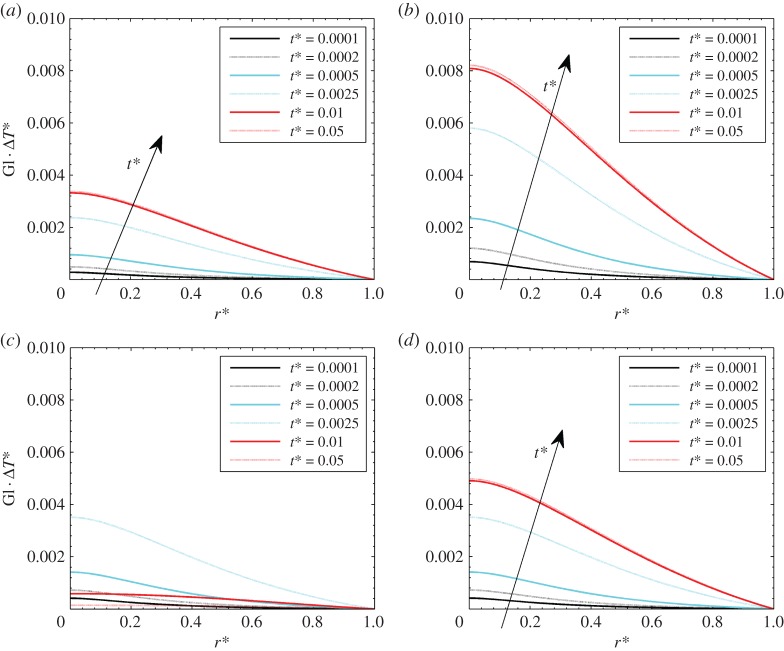
Dimensionless pressure profiles are presented in figure 9. The situation is similar to the volumetric strain; in particular, it has to be observed that the situation does not change a lot after a certain value of theat*. This occurs because the heating time becomes higher than the thermal scale time. Finally, similar conclusions can be made for the dimensionless velocity profiles in figure 10. A comparison between the thermal and elastic effects in terms of GlΔT* is presented in figure 11, for γ = 40 and different hyperthermia conditions, respectively, Pohyp(r* = 0) equal to 2, 5 (with theat* = 1), and Pohyp(r* = 0) equal to 3 with theat* = 0.005 and 0.05.
Figure 11.
GlΔT* for Gl = 0.05: (a) Pohyp(r* = 0) = 2 and theat* = 1, (b) Pohyp(r* = 0) = 5 and theat* = 1, (c) Pohyp(r* = 0) = 3 and theat* = 0.005, (d) Pohyp(r* = 0) = 5 and theat* = 0.05. (Online version in colour.)
It is shown that values are decreasing over the radius, reaching zero in the proximity of the boundary in all the cases. In figure 11a,b, different heat loads are presented, showing that the higher the heat load, the higher the GlΔT* and the importance of the thermal dilation effects. In figure 11c,d, the effects of heating time theat* are presented. It is shown that the thermal effects do not monotonically increase with time for theat* = 0.005 (figure 3c) because the time is shorter than the thermal diffusion time. On the other hand, the situation for theat* = 0.05 is like the other cases with theat* = 1 since the thermal transient process is carried out.
Finally, the authors underline that the present analysis is very useful in order to emphasize the advection contribution of drug delivery, especially for macromolecules that have a very low diffusion coefficient. For this reason, it is very important to determine how to increase advective transport, and heat transfer can be a solution since it affects the velocity field, as previously shown.
A solution can be to model heat generation by employing heat charging/discharging cycles. For this reason, a cosine function is employed to simulate the aforementioned cycles. The heat generation term is multiplied by a cosine function that varies between 0 and 1, and is equal to 0 for t* = 0
| 3.1 |
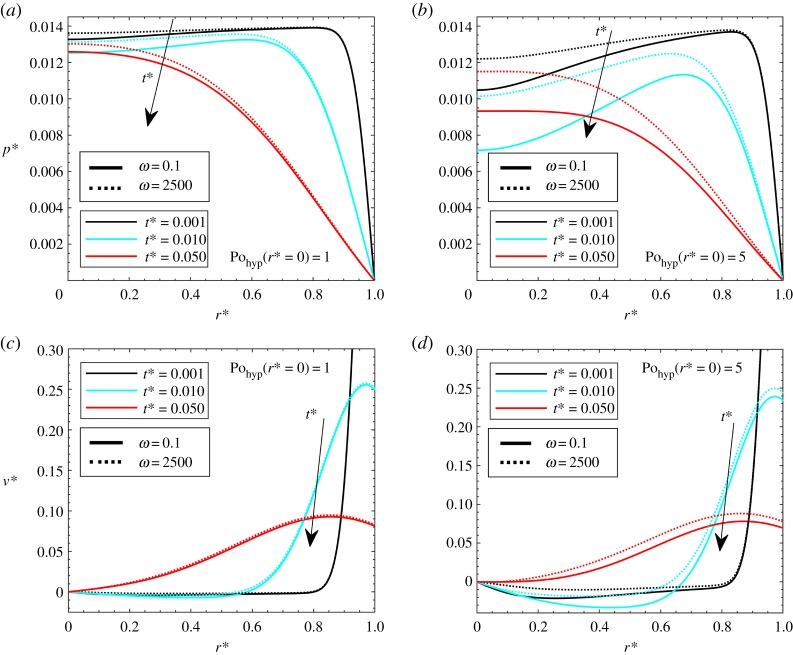
where ω is the dimensionless pulsation. The dimensionless velocity and pressure profiles along the dimensionless radius, for different heat generation Pohyp(r* = 0) and pulsations, are plotted in figure 12. For small values of ω, it can be assumed that the applied heat is stationary. In this paper, a value of ω = 0.1 is assumed to provide a steady-state condition. With reference to the pressure, it is shown that higher heat applied generally means lower pressures. When different pulsations are compared, it is shown that higher pulsations generally refer to higher pressures, and the differences are more marked for higher applied heat (Pohyp(r* = 0) = 5). Similar conclusions can be drawn for velocity, since it is clear that the higher the pulsation, the higher are the velocities. This is very interesting since this solution can be useful in order to enhance advection in macromolecule drug delivery.
Figure 12.
Periodic heating case, with Gl = 0.05, γ = 40, β = 100, theat* = 1, ω = 0.1 and 2500: dimensionless pressure (a) Pohyp(r* = 0) = 1 and (b) Pohyp(r* = 0) = 5; dimensionless velocity (c) Pohyp(r* = 0) = 1 and (d) Pohyp(r* = 0) = 5. (Online version in colour.)
3.4. Time-scale analysis
Understanding the time scale on which these phenomena occur is very important to understanding how much time the tumour needs to reabsorb the excess fluid, or how much time is needed to percolate everything. A comprehensive analysis of time scales is presented in Netti et al. [5,17], with a good agreement with experiments. They reported that the predicted time scale is of the order of approximately 103 s with their thermophysical properties. In Netti et al. [17], it has been reported that
| 3.2 |
| 3.3 |
| 3.4 |
The first time constant is the same as that derived herein during the scaling process. It has been analytically derived [5,17] that the two time constants are equal to
| 3.5 |
and
| 3.6 |
and that these are related by means of
| 3.7 |
In the present case of rapid TBF decay, as reported by Netti et al. [5], the only mechanism to make the fluid reach a new equilibrium condition is via the interstitium since, for t* > 0, there is no longer a Starling term. This means that the typical scale of the phenomena is governed by τi, whatever the β. The target here is to compare the interstitial fluid time constant with a constant for the heat processes. From the scaling of the energy equation (equation (2.38)), it is possible to show that
| 3.8 |
Carlsaw & Jaeger [30] reported the analytical solution for a sphere with internal heat generation. As depicted in the validation section, for a very low Péclet number (such as in our case), it is possible to compare the solution for the temperature field derived herein with the one referred to a sphere with internal generation and equal initial and surface temperature. From their analytical solution, it is possible to derive a time constant as follows:
| 3.9 |
Now, we try to correlate the time scales, as done in the energy equation scaling section. By recalling equation (2.38), it is possible to define the ratio between the percolation and the temperature scale
| 3.10 |
The term γ correlates the energy equation with the thermoporoelastic strain equation. It represents the ratio between the percolation velocity and the heat propagation velocity. When it is ≫1, percolation time scales are much higher than the times required to reach a steady-state temperature. As an example, by employing values for thermal diffusivity taken generally from Iasiello et al. [10] and values for hydraulic conductivity and Lamé parameters taken generally from Netti et al. [5] (all of these are summarized in table 2), it is shown that this ratio is equal to about 40, thus it is reasonable to assume that the order of magnitude is about approximately 101–102. This means that thermal effects stop being important after a short time, after which the phenomena are dominated by percolation. This has also been found in the results, since, after a certain time, the behaviour is purely dominated by percolation.
Finally, for the sake of validation, by employing data from Iasiello et al. [10] and Netti et al. [5] and results from the present work, it can be shown that the maximum Perel is approximately 10−2–10−1, with which it is possible to assume that the heat transfer is mainly diffusive with an acceptable deviation.
4. Conclusion
A thermoporoelastic model for heat transfer and fluid flow through a tumour tissue has been presented. Governing equations were scaled and solved by means of a finite-element scheme for a one-dimensional spherical coordinate system. As an initial condition, it is assumed that there is an interruption of the fluid source while a heating source is applied in the central area of the tumour mass.
Results are compared with analytical solutions available in the literature for displacement, velocity, pressure and temperature profiles, showing excellent agreement. Sensitivity analyses for various scaling parameters have been presented. These parameters are the Gay–Lussac number, which is the ratio between thermal and mechanical stresses, the interstitial to transcapillary resistance number, the Pomerantsev number, the thermal to poroelastic time number and the scaled heating time. Physical features have been discussed in terms of the pressure and velocity fields through the tumour. It has been shown that pressure does not monotonically decrease from the centre to the periphery, but, in some cases, local overshooting can be achieved along the tumour radius. These features are reviewed in terms of their potential effects on macromolecular drug distribution within the tumour mass. For instance, the effects of a periodic heat source on the flow field have been discussed and the results indicate that by cycling heat administration it is potentially possible to augment advection for macromolecule delivery. Currently, we are investigating transient process strategies to improve drug delivery efficacy. Finally, an analysis of the characteristic times has been reported, showing that, generally, the characteristic time for heating is lower than the percolation time but higher than the transcapillary time.
Data accessibility
The programmes and codes used in this research are the commercial software Comsol Multiphisics and Matlab. All data needed are available upon request from the authors.
Authors' contributions
A.A. helped with simulations and general conversations about the research. M.I. conducted the simulations and designed and produced the figures. P.A.N. supervised the research and took part in general conversations about it. All authors conceived the study and wrote the manuscript. All authors gave final approval for publication.
Competing interests
We declare we have no competing interests.
Funding
We received no funding for this study.
References
- 1.Jain RK, Baxter LT. 1988. Mechanisms of heterogeneous distribution of monoclonal antibodies and other macromolecules in tumors: significance of elevated interstitial pressure. Cancer Res. 48, 7022–7032. [PubMed] [Google Scholar]
- 2.Boucher Y, Baxter LT, Jain RK. 1990. Interstitial pressure gradients in tissue-isolated and subcutaneous tumors: implications for therapy. Cancer Res. 50, 4478–4484. [PubMed] [Google Scholar]
- 3.Zlotecki RA, Boucher Y, Lee I, Baxter LT, Jain RK. 1993. Effect of angiotensin II induced hypertension on tumor blood flow and interstitial fluid pressure. Cancer Res. 53, 2466–2468. [PubMed] [Google Scholar]
- 4.Zlotecki RA, Baxter LT, Boucher Y, Jain RK. 1995. Pharmacologic modification of tumor blood flow and interstitial fluid pressure in a human tumor xenograft: network analysis and mechanistic interpretation. Microvasc. Res. 50, 429–443. ( 10.1006/mvre.1995.1069) [DOI] [PubMed] [Google Scholar]
- 5.Netti PA, Baxter LT, Boucher Y, Skalak R, Jain RK. 1995. Time-dependent behavior of interstitial fluid pressure in solid tumors: implications for drug delivery. Cancer Res. 55, 5451–5458. [PubMed] [Google Scholar]
- 6.Biot MA. 1941. General theory of three-dimensional consolidation. J. Appl. Phys. 12, 155–164. ( 10.1063/1.1712886) [DOI] [Google Scholar]
- 7.Biot MA. 1955. Theory of elasticity and consolidation for a porous anisotropic solid. J. Appl. Phys. 26, 182–185. ( 10.1063/1.1721956) [DOI] [Google Scholar]
- 8.Keangin P, Wessapan T, Rattanadecho P. 2011. Analysis of heat transfer in deformed liver cancer modeling treated using a microwave coaxial antenna. Appl. Therm. Eng. 31, 3243–3254. ( 10.1016/j.applthermaleng.2011.06.005) [DOI] [Google Scholar]
- 9.Chung S, Vafai K. 2014. Mechanobiology of low-density lipoprotein transport within an arterial wall—impact of hyperthermia and coupling effects. J. Biomech. 47, 137–147. ( 10.1016/j.jbiomech.2013.09.030) [DOI] [PubMed] [Google Scholar]
- 10.Iasiello M, Vafai K, Andreozzi A, Bianco N, Tavakkoli F. 2015. Effects of external and internal hyperthermia on LDL transport and accumulation within an arterial wall in the presence of a stenosis. Ann. Biomed. Eng. 43, 1585–1599. ( 10.1007/s10439-014-1196-0) [DOI] [PubMed] [Google Scholar]
- 11.Iasiello M, Vafai K, Andreozzi A, Bianco N. 2016. Low-density lipoprotein transport through an arterial wall under hyperthermia and hypertension conditions—an analytical solution. J. Biomech. 49, 193–204. ( 10.1016/j.jbiomech.2015.12.015) [DOI] [PubMed] [Google Scholar]
- 12.AlAmiri A. 2013. Fluid-structure interaction analysis of pulsatile blood flow and heat transfer in living tissues during thermal therapy. J. Fluids Eng. 135, 041103 ( 10.1115/1.4023658) [DOI] [Google Scholar]
- 13.AlAmiri A, Khanafer K, Vafai K. 2014. Fluid-structure interactions in a tissue during hyperthermia. Num. Heat Transfer A Appl. 66, 1–16. ( 10.1080/10407782.2013.869080) [DOI] [Google Scholar]
- 14.Selvadurai AP, Suvorov AP. 2016. Thermo-poroelasticity and geomechanics. Cambridge, UK: Cambridge University Press. [Google Scholar]
- 15.Fung YC. 1990. Biomechanics: motion, flow, stress, and growth. New York, NY: Springer. [Google Scholar]
- 16.Vafai K. 2015. Handbook of porous media. Boca Raton, FL: CRC Press. [Google Scholar]
- 17.Netti PA, Baxter LT, Boucher Y, Skalak R, Jain RK. 1997. Macro-and microscopic fluid transport in living tissues: application to solid tumors. AlChE J. 43, 818–834. ( 10.1002/aic.690430327) [DOI] [Google Scholar]
- 18.Mow VC, Kwan MK, Lai WM, Holmes MH. 1986. A finite deformation theory for nonlinearly permeable soft hydrated biological tissues. In Frontiers in biomechanics (eds Schmid-Schonbein GW, Woo SL-Y, Zweifach BW), pp. 153–179. New York, NY: Springer. [Google Scholar]
- 19.Ateshian GA, Warden WH, Kim JJ, Grelsamer RP, Mow VC. 1997. Finite deformation biphasic material properties of bovine articular cartilage from confined compression experiments. J. Biomech. 30, 1157–1164. ( 10.1016/S0021-9290(97)85606-0) [DOI] [PubMed] [Google Scholar]
- 20.Netti PA, Travascio F, Jain RK. 2003. Coupled macromolecular transport and gel mechanics: poroviscoelastic approach. AlChE J. 49, 1580–1596. ( 10.1002/aic.690490621) [DOI] [Google Scholar]
- 21.Mahjoob S, Vafai K. 2009. Analytical characterization of heat transport through biological media incorporating hyperthermia treatment. Int. J. Heat Mass Transfer 52, 1608–1618. ( 10.1016/j.ijheatmasstransfer.2008.07.038) [DOI] [Google Scholar]
- 22.Mcintosh RL, Anderson V. 2010. A comprehensive tissue properties database provided for the thermal assessment of a human at rest. Biophys. Rev. Lett. 5, 129–151. ( 10.1142/S1793048010001184) [DOI] [Google Scholar]
- 23.Kuneš J. 2012. Dimensionless physical quantities in science and engineering. London, UK: Elsevier. [Google Scholar]
- 24.Chooi KY, Comerford A, Sherwin SJ, Weinberg PD. 2016. Intimal and medial contributions to the hydraulic resistance of the arterial wall at different pressures: a combined computational and experimental study. J. R. Soc. Interface 13, 20160234 ( 10.1098/rsif.2016.0234) [DOI] [PMC free article] [PubMed] [Google Scholar]
- 25.Lai WM, Mow VC. 1980. Drag-induced compression of articular cartilage during a permeation experiment. Biorheology 17, 111–123. ( 10.3233/BIR-1980-171-213) [DOI] [PubMed] [Google Scholar]
- 26.Støverud KH, Darcis M, Helmig R, Hassanizadeh SM. 2012. Modeling concentration distribution and deformation during convection-enhanced drug delivery into brain tissue. Transp. Porous Media 92, 119–143. ( 10.1007/s11242-011-9894-7) [DOI] [Google Scholar]
- 27.Yuan P. 2008. Numerical analysis of temperature and thermal dose response of biological tissues to thermal non-equilibrium during hyperthermia therapy. Med. Eng. Phys. 30, 135–143. ( 10.1016/j.medengphy.2007.03.006) [DOI] [PubMed] [Google Scholar]
- 28.Nagashima T, Tamaki N, Matsumoto S, Horwitz B, Seguchi Y. 1987. Biomechanics of hydrocephalus: a new theoretical model. Neurosurgery 21, 898–904. ( 10.1227/00006123-198712000-00019) [DOI] [PubMed] [Google Scholar]
- 29.Tanaka T, Fillmore DJ. 1979. Kinetics of swelling of gels. J. Chem. Phys. 70, 1214–1218. ( 10.1063/1.437602) [DOI] [Google Scholar]
- 30.Carslaw HS, Jaeger JC. 1959. Conduction of heat in solids. Oxford, UK: Clarendon Press. [Google Scholar]
- 31.Jain RK. 1987. Transport of molecules in the tumor interstitium: a review. Cancer Res. 47, 3039–3051. [PubMed] [Google Scholar]
- 32.Baxter LT, Jain RK. 1989. Transport of fluid and macromolecules in tumors. I. Role of interstitial pressure and convection. Microvasc. Res. 37, 77–104. ( 10.1016/0026-2862(89)90074-5) [DOI] [PubMed] [Google Scholar]
- 33.Hilmas DE, Gillette EL. 1974. Morphometric analyses of the microvasculature of tumors during growth and after x-irradiation. Cancer 33, 103–110. () [DOI] [PubMed] [Google Scholar]
- 34.Swabb EA, Wei J, Gullino PM. 1974. Diffusion and convection in normal and neoplastic tissues. Cancer Res. 34, 2814–2822. [PubMed] [Google Scholar]
- 35.Duck FA. 1990. Physical properties of tissue: a comprehensive reference book. San Diego, CA: Academic. [Google Scholar]
- 36.Nicholson C, Phillips JM. 1981. Ion diffusion modified by tortuosity and volume fraction in the extracellular microenvironment of the rat cerebellum. J. Physiol. 321, 225–257. ( 10.1113/jphysiol.1981.sp013981) [DOI] [PMC free article] [PubMed] [Google Scholar]
- 37.Rabin Y, Plitz J. 2005. Thermal expansion of blood vessels and muscle specimens permeated with DMSO, DP6, and VS55 at cryogenic temperatures. Ann. Biomed. Eng. 33, 1213–1228. ( 10.1007/s10439-005-5364-0) [DOI] [PubMed] [Google Scholar]
Associated Data
This section collects any data citations, data availability statements, or supplementary materials included in this article.
Data Availability Statement
The programmes and codes used in this research are the commercial software Comsol Multiphisics and Matlab. All data needed are available upon request from the authors.


