

ABSTRACT
Background: Obesity is a worldwide epidemic in children and adolescents. Adult cohort studies have reported an association between higher body mass index (BMI) and increased leukemia-related mortality; whether a similar effect exists in childhood leukemia remains controversial.
Objective: We conducted a meta-analysis to determine whether a higher BMI at diagnosis of pediatric acute lymphoblastic leukemia (ALL) or acute myeloid leukemia (AML) is associated with worse event-free survival (EFS), overall survival (OS), and cumulative incidence of relapse (CIR).
Design: We searched 4 electronic databases from inception through March 2015 without language restriction and included studies in pediatric ALL or AML (0–21 y of age) reporting BMI as a predictor of survival or relapse. Higher BMI, defined as obese (≥95%) or overweight/obese (≥85%), was compared with lower BMI [nonoverweight/obese (<85%)]. Summary risk estimates for EFS, OS, and CIR (ALL only) were calculated with random- or fixed-effects models according to tests for between-study heterogeneity.
Results: Of 4690 reports identified, 107 full-text articles were evaluated, with 2 additional articles identified via review of citations; 11 articles were eligible for inclusion in this meta-analysis. In ALL, we observed poorer EFS in children with a higher BMI (RR: 1.35; 95% CI: 1.20, 1.51) than in those at a lower BMI. A higher BMI was associated with significantly increased mortality (RR: 1.31; 95% CI: 1.09, 1.58) and a statistically nonsignificant trend toward greater risk of relapse (RR: 1.17; 95% CI: 0.99, 1.38) compared with a lower BMI. In AML, a higher BMI was significantly associated with poorer EFS and OS (RR: 1.36; 95% CI: 1.16, 1.60 and RR: 1.56; 95% CI: 1.32, 1.86, respectively) than was a lower BMI.
Conclusion: Higher BMI at diagnosis is associated with poorer survival in children with pediatric ALL or AML.
Keywords: obesity, pediatric leukemia, relapse, survival, nutritional status
INTRODUCTION
Leukemia is the most common pediatric malignancy, currently contributing up to one-third of all newly diagnosed childhood cancers each year, with a steadily rising incidence over past decades (1). Acute lymphoblastic leukemia (ALL)12 and acute myeloid leukemia (AML) constitute the 2 most common forms of childhood leukemia; together, they represent >95% of leukemia in children (0–14 y of age) and ∼90% of adolescent (15–19 y of age) leukemia (1). Epidemiologic studies frequently have used BMI to define obesity and explore its association with cancer risk and mortality (2–4). In adults, studies repeatedly have demonstrated that a higher BMI is positively associated with both the incidence of leukemia (4, 5) and leukemia-related mortality (3, 5). In children, controversy remains about whether and how childhood obesity might similarly affect leukemia therapy and survival. In 2005, Lange et al. (6) published the first report detailing the adverse influence of BMI on treatment-related mortality (TRM) during intensive chemotherapy for pediatric AML. Subsequently in 2007, the first report on pediatric ALL described poorer event-free survival (EFS) in a large cohort of obese children compared with those who were nonobese (7). After these 2 landmark studies in pediatric leukemia, multiple analyses from international consortia have since described inconsistent associations between obesity and leukemia survival (8–18), raising uncertainty as to whether such a relation exists and, if so, to what extent.
A recent first attempt to reconcile these differences via meta-analysis (19) further complicated interpretation of the data through inclusion of a wide variety of leukemia types, therapeutic modalities (e.g., stem cell transplant), and differences in baseline survival rates between high- and low-income countries from differential access and standards of care (20, 21). Moreover, older age (defined as ≥10 y old) is not only associated with an increased prevalence of obesity (22), but also with an increased risk of relapse and poorer survival in pediatric ALL (23). The potential interaction of age, obesity, and survival in pediatric leukemia thus remains unaddressed. The current approach focuses on an international but similarly treated population to clearly establish whether an association exists between obesity and leukemia relapse, mortality, and treatment-related toxicity (TRT). With the dissemination of the Western diet and lifestyle leading to a marked increase in the global prevalence of childhood overweight and obesity (22), and the corresponding rise in the incidence of obesity-associated cancers internationally (24), whether overweight or obesity as indicated by higher BMI affects survival in pediatric ALL and AML continues to be a controversial and key question.
METHODS
Literature search
Our methodology followed the guidelines set forth by the Preferred Reporting Items for Systematic reviews and Meta-Analyses (25). The electronic databases of PubMed, Ovid Medline, the Cochrane Library, and Embase were searched from inception through March 2015 with the assistance of a library scientist. Our search strategy included MeSH terms and text related to obesity and body composition, ALL or AML, and treatment outcomes (survival, relapse, toxicity). The search strategy for MEDLINE, Embase, and Ovid MEDLINE are included in the Supplement (Supplemental Table 1). Our search was limited to studies of human subjects without any language restriction. All references were compiled into an EndNote (X7) library for review of titles and abstracts by 2 independent authors (EJL and DA). Subsequent manual review of citations was performed with the inclusion of additional manuscripts that met the eligibility criteria below. Any disagreement was resolved by a final consensus (EO, EJL, and JMG).
Eligibility criteria
Our search strategy retained studies that reported on children and adolescents from birth to 21 y of age (inclusive) diagnosed with ALL or AML who were treated with pediatric regimens that reported the effect of weight on treatment outcomes, specifically EFS, mortality and overall survival (OS), cumulative incidence of relapse (CIR), and TRT. Acute promyelocytic leukemia was excluded from the analysis because of its discrete biology and treatment (26). As per above, the analysis was limited to reports from high-income countries [as classified by the World Bank 2014 (27)] because of the fact that variable access to recommended medical and nutritional supportive oncology care affects survival in low- and middle-income countries (20, 21). Case reports, reviews, and reports that focused on obesity in cancer survivors or solely in adults were excluded. There was no exclusion by study date or date of publication. The results of the search strategy are presented in Figure 1.
FIGURE 1.

Results of search strategy. ALL, acute lymphoblastic leukemia; AML, acute myeloid leukemia.
Data extraction
Extracted data of interest included country of publication, year, demographic data (sex, age, and ethnicity), leukemia phenotype and treatment regimen, weight category (underweight, normal, overweight, or obese) with associated study-specific definitions of categories, TRT (chemotherapy-associated targeted toxicity or protocol-specific grade 3 or 4 toxicity), TRM, 1-y and 5-y EFS (time from study enrollment to induction failure, withdrawal, relapse, secondary malignancy, or death), OS (time from enrollment to death from any cause), CIR (time to postremission relapse), remission rate, and rate of induction failure. Statistical information extracted consisted of the incidence of each weight category, as well as the measure of association (i.e., OR and RR), P values, and adjustment variables included in the multivariable analyses for each outcome. Data were extracted by one author (DA) and independently verified by a second author (EJL).
Statistical analysis
Outcomes of interest were studied within each leukemia phenotype. Studies used BMI to define weight categories according to age- and sex-specific population norms (2); for children <2 y of age in whom normative values for BMI were not available, weight-for-length was reported (Table 1). For analyses of ALL, outcomes were consistently compared between children obese at diagnosis (≥95th percentile) and those who were nonobese (<95th percentile), or, alternatively, between children who were of a BMI greater than or equal to overweight (≥85th percentile) and those who were not overweight or obese (<85th percentile). Analysis of differences between the 4 wt groups (underweight, normal, overweight, and obese) for outcomes of interest was not possible, because the identified studies did not consistently delineate the 4 groups. In children with ALL, only 2 studies reported the contribution of underweight to outcomes; the remainder reported on either overweight/obese or obese compared with normal, thus precluding an estimate of a dose-effect of obesity on outcome (i.e., obese compared with normal, or overweight compared with normal). Therefore, we compared the effect of a higher BMI with lower BMI on outcomes of interest. Higher BMI was defined as a single category of studies reporting obese or overweight/obese, whereas lower BMI was defined as those not overweight or obese. Summary measures of association (i.e., RRs) were estimated by comparing higher and lower BMI within ALL for EFS, OS, CIR, and TRT, and within AML for EFS and OS. When measures of association were not presented in the manuscript, study-specific RRs and 95% CIs were calculated with the use of reported crude frequencies, comparing the highest with the lowest category of each obesity measure for the intended outcome (i.e., EFS, OS, and CIR). Summary estimates were calculated with the use of a fixed-effects model, in which study-specific estimates were weighted by the study-specific variances, and differences between models are noted when indicated. RRs, weighted by the inverse of the sum of their variance and the estimated between-study variance component, were also pooled with the use of a random-effects model (28). The Q statistic was calculated to test for between-study heterogeneity, with the I2 statistic calculating the proportion of variation between studies due to heterogeneity (29). Analyses in ALL were stratified by age; preadolescent and adolescent patients (≥10 y of age) were evaluated for risk differences for older compared with younger populations. To evaluate whether age affected the association between obesity and survival, we performed a meta-regression analysis (30). A quality score was computed for included studies with the use of the NIH Quality Assessment Tool for Observational Cohort and Cross-Sectional Studies (31). Potential publication bias was evaluated via inspection of funnel plots (32) and an Egger’s test for small-study effects. Because statistical power is low for funnel plots, especially when <10 studies are included in the analysis (28), we also applied the meta-regression approximation by Stanley and Doucouliagos (33), the precision effect estimate with SE (PEESE), to reduce the publication bias of our summary estimates. Sensitivity analyses of the results of each meta-analysis were performed when ≥2 studies were available (i.e., an influence analysis). All statistical analyses were performed with the use of STATA version 12.0.
TABLE 1.
Characteristics of studies included in the meta-analysis1
| Study (reference), country | Consortium | Treatment regimens | Study dates | Type of ALL (participants, n) | Age at diagnosis, y | Anthropometric data collection2 | Definition of weight category |
| ALL (n = 7) | |||||||
| Aldhafiri (10), United Kingdom | MRC | UKALL-X | 1985–1990 | “Standard Risk” ALL (1033) | 2.0–14.9 | Prospectively on clinical trial | BMI (international norms)3 |
| Baillargeon (11), United States | POG | “HR and SR regimens” | 1990–2002 | SR and HR BP-ALL (322) | 2–18 | Retrospective review of medical records | BMI (CDC) |
| Butturini (7),4 United States | CCG/COG | CCG1881, CCG1992, CCG1891, CCG1882, CCG1901 | 1988–1995 | SR and HR BP-ALL, T-ALL (4260) | 2.00–19.99 | Prospectively on clinical trial | BMI (CDC) |
| Ethier (12), Canada | POG/COG | AALL0232, AALL0331, POG9904, POG9905, A5971 | 2001–2006 | SR and HR BP-ALL, T-ALL (238) | 2.1–17.8 | Retrospective review of medical records | BMI (CDC) |
| Hijiya (9), United States | SJRC | Total XII, XIIIA, XIIIB, XIV | 1988–2000 | SR and HR BP-ALL, T-ALL (621) | 1.01–18.80 | Prospectively on clinical trial | Age <2y: WFL (CDC) Age ≥2y: BMI (CDC) |
| Orgel (13), United States | CCG/COG | CCG1961 | 1996–2002 | HR BP-ALL (2008) | 1–20 | Prospectively on clinical trial | Age <2y: WFL (CDC) Age ≥2y: BMI (CDC) |
| Orgel (14), United States | CCG/COG | CCG1991, CCG1961, AALL0331, AALL0932, AALL08P1, AALL0232, AALL1131 | 2008–2013 | SR and HR BP-ALL (198) | 1–21 | Retrospective review of medical records | Age <2y: WFL (CDC) Age ≥2y: BMI (CDC) |
| Niinimaki (15), Finland | NSPHO | ALL-NSPHO 86, 92, 2000 | 1992–2005 | NSPHO-defined risk category (97) | 1–15 | Cross-sectional analysis of survivors | BMI (Finnish norms) |
| AML (n = 3) | |||||||
| Canner (16), United States | CCG/COG | CCG2891, CCG2941, CCG2961, AAML03P1 | 1989–2006 | de novo AML (1840) | 0.01–20.9 | Prospectively on clinical trial | Age <2y: WFL (CDC) Age ≥2y: BMI (CDC) |
| Inaba (17), United States | SJRC | AML87, AML91, AML9, AML02 | 1987–2008 | de novo AML (314) | 2.0–19.9 | Prospectively on clinical trial | BMI (CDC) |
| Lange (18), United States | CCG/COG | CCG2961 | 1996–2002 | de novo AML (768) | 0.01–20.9 | Prospectively on clinical trial | BMI (CDC) |
ALL, acute lymphoblastic leukemia; AML, acute myeloid leukemia; BP-ALL, B-precursor acute lymphoblastic leukemia; CCG, Children’s Cancer Group; COG, Children’s Oncology Group; HR, National Cancer Institute/Rome high risk; MRC, Medical Research Council; NSPHO, Nordic Society of Pediatric Haematology and Oncology; POG, Pediatric Oncology Group; SJRC, St. Jude Research Consortium; SR, National Cancer Institute/Rome standard risk; T-ALL, T cell acute lymphoblastic leukemia; WFL, weight-for-length.
All heights and weights were obtained by clinical measurement.
Thresholds for underweight, normal, overweight, and obesity as used in this study were drawn from a previously reported 6-country international survey.
Excludes the verification cohort of CCG-1961 included separately.
RESULTS
Search results and study descriptions
In total, 4690 manuscripts fulfilled the initial search criteria and an additional 2 were identified by review of citations. After removing duplicates, the titles and abstracts were reviewed by 2 authors (DA and EJL). Of the 107 articles selected for full-text review and an additional 2 reports identified through review of the cited references, 10 reporting on leukemia survival met the eligibility criteria and were included in the synthesis (ALL, n = 7; AML, n = 3), and 1 additional report met eligibility criteria and was included only in analysis of BMI-associated TRT (Figure 1). Assessment of the NIH quality score for the included studies revealed all reports to be of fair to good quality (scoring ≥9/14) in design and reporting (Supplemental Table 2). These studies included a total of 8680 children and adolescents with ALL and 2922 children and adolescents with AML who received treatment during the years 1985–2008 (Table 1).
BMI and ALL outcomes
Six studies were included in the summary estimate of EFS (Table 2, Figure 2).A statistically significant positive association was found between poorer EFS and higher BMI (fixed-effects RR: 1.35; 95% CI: 1.20, 1.51) compared with those with a lower BMI. A slight publication bias was observed based on the funnel plot, but not based on Egger’s test for small-study effects (P = 0.116; Supplemental Figure 1A and B). However, when we applied the PEESE method to correct for publication bias, we observed a similar association with a 28% (95% CI: 1.16%, 1.41%) increased risk. No significant between-study heterogeneity was found (I2: 34.0%; test for between-study heterogeneity, P = 0.18). When the analysis was stratified by age (Figure 3), there was no statistically significant interaction present (P-interaction = 0.45); however, the risk of an event appeared slightly stronger in older preadolescents/adolescents (≥10 y of age; fixed-effects RR: 1.54; 95% CI: 1.14, 2.08; Figure 3) than in younger children (fixed-effects RR: 1.24; 95% CI: 0.88, 1.73; Supplemental Figure 2). No differences in the results were found when analyzed with the use of a random-effects model [EFS—random-effects RR: 1.37; 95% CI: 1.16, 1.62; older adolescents (≥10 y of age)—random-effects RR: 1.54; 95% CI: 1.14, 2.08 compared with younger children (<10 y of age)—random-effects RR: 1.24; 95% CI: 0.88, 1.73].
TABLE 2.
Outcomes and methodology of studies included in the meta-analysis1
| Study (reference), country | Outcomes of interest | Statistical methodology | Adjustment variables2 | Duration or time points of follow-up |
| ALL (n = 7) | ||||
| Aldhafiri (10), United Kingdom | CIR of obese and overweight vs. healthy vs. underweight | Frequencies and P values reported3 | None | Censored at 7.2 y from study closure |
| Baillargeon (11), United States | EFS and OS of obese (≥95%) vs. nonobese (<95%) | Cox proportional hazards multivariate regression model of predictors and survival time; analyses further stratified by older vs. younger age (2–9 vs. 10–18 y) | Age (for overall cohort), sex, WBC, and ethnicity | 1- and 5-y survival analyses |
| Butturini (7), United States | EFS, OS, and CIR of obese (≥95%) vs. nonobese (<95%) | Cox proportional hazards multivariate regression model of predictors and survival/relapse time; subset analyses were performed in an older age strata (≥10 y) | Age, sex, race-ethnicity, WBC, and early bone marrow response | Median 7.8 y (range 0.1–13.3 y) |
| Ethier (12), Canada | EFS and OS of obese (≥95%) vs. nonobese (<95%) | Cox proportional hazards multivariate regression model of predictors and survival time; analyses additionally stratified into low-, standard-, or high-risk groups based on combination of prognostic predictors; secondary subset analyses performed by leukemia phenotype | Age, WBC, and cytogenetic risk group | 5-y survival analyses |
| Hijiya (9), United States | EFS, OS, CIR, and TRT comparing obese (≥95%), overweight (85–94%), normal (5–84%), and underweight (<5%) | Frequencies and P values reported3 | None | Median 10.5 y (range 2.4–16.9 y) |
| Orgel (13), United States | EFS and TRT of obese (≥95%) vs. normal/overweight (5–94%) vs. underweight (<5%) | Cox proportional hazards multivariate regression model of predictors and survival time, stratified by treatment regimen; logistic regression model of predictors and weight status at start of treatment phase | Sex, and CNS disease after stepwise selection of predictors (nonsignificant: age, race-ethnicity, WBC, phenotype, and disease response) | Median 8.5 y |
| Orgel (14), United States | EFS comparing lean (<85%), overweight (≥85%), and obese (≥95%) | Cox proportional hazards multivariate regression model of predictors and survival time, stratified by treatment regimen | NCI risk group and end-induction minimal residual disease after stepwise selection of predictors (nonsignificant: age, sex, ethnicity, trisomy 21, WBC, and cytogenetic risk group) | Median 1.9 y (maximum 5.4 y) |
| Niinimaki (15), Finland | TRT (osteonecrosis) comparing obese (≥95%), overweight (85–94%), normal (5–84%), and underweight (<5%) at diagnosis | Logistic regression model of BMI as a predictor | Age, sex, and dexamethasone | Post-therapy (NR) |
| AML (n = 3) | ||||
| Canner (16), United States | EFS and OS of overweight or obese (≥85%) vs. normal (5–84%) vs. underweight (<5%) | Cox proportional hazards multivariate regression model of predictors and survival time; analyses further stratified by age (<16 y vs. 16–20 y) | Race-ethnicity, WBC, and cytogenetic risk group | 5-y survival analyses |
| Inaba (17), United States | EFS and OS of overweight or obese (≥85%) vs. normal (5–84%) vs. underweight (<5%) | Cox proportional hazards multivariate regression model of predictors and survival time, stratified by treatment regimen | Age, WBC, and FAB | 5-y survival analyses |
| Lange (18), United States | EFS and OS comparing obese (≥95%), middle weight (10–94%), and underweight (<10%) | Univariate analysis of BMI on outcomes only | None | Median 4.2 y |
ALL, acute lymphoblastic leukemia; AML, acute myeloid leukemia; CIR, cumulative incidence of relapse; CNS, central nervous system; EFS, event-free survival; FAB, French–American–British classification of acute myeloid leukemia by morphology; NCI, National Cancer Institute; NR, not reported; OS, overall survival; TRT, treatment-related toxicity; WBC, white blood cell count.
With the use of ALL- or AML-specific cytogenetic risk groups from historical/validated favorable or poor prognostic mutations (fusions, deletions, or chromosome number).
Statistical methodology refers to estimates for BMI exposure; however, HRs and 95% CIs were not reported.
FIGURE 2.

Meta-analyses of event-free survival and overall survival according to BMI in childhood acute lymphoblastic leukemia are depicted. The studies are ordered according to year of study publication, with the black-filled diamonds representing the study-specific RRs and the horizontal line representing the 95% CI with the use of fixed-effects models. The open diamonds correspond to summary RRs.
FIGURE 3.
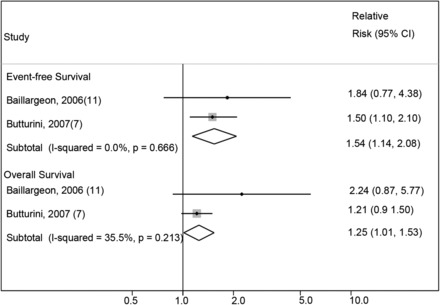
Meta-analyses of event-free survival and overall survival according to BMI in childhood acute lymphoblastic leukemia for those ≥10 y of age. The studies are ordered according to year of study publication, with the black-filled diamonds representing the study-specific RRs and the horizontal line representing the 95% CI with the use of fixed-effects models. The open diamonds correspond to summary RRs.
Similar results were found in analyses of the studies reporting OS (n = 4) and CIR (n = 3), with a positive association of increased risk of mortality (OS—fixed-effects RR: 1.31; 95% CI: 1.09, 1.58; Figure 2) and for relapse (CIR—fixed-effects RR: 1.17; 95% CI: 0.99, 1.38) in those at a higher BMI compared with those at a lower BMI. A similar observation was found with the random-effects model (OS—random-effects RR: 1.52; 95% CI: 1.04, 2.22; CIR—random-effects RR: 1.13; 95% CI 0.99, 1.28). No significant between-study heterogeneity was present for either analysis (OS—I2: 48.8%; test for between-study heterogeneity, P = 0.12; and CIR—I2: 1.8%; test for between-study heterogeneity, P = 0.36, respectively). A slight publication bias was present based on the funnel plots (Supplemental Figure 3A); however, the Egger’s test for small-study effects revealed no evidence of publication bias (P = 0.145; Supplemental Figure 3B). To account for this, we applied the PEESE method; results for OS were attenuated and not statistically significant (OS—RR: 1.14; 95% CI: 0.98, 1.33). In a restriction of analysis of OS only to children ≥10 y of age (Figure 3) was consistent with the remainder of the analysis and showed a significantly increased risk of mortality associated with a higher BMI (≥10 y of age; fixed-effects RR: 1.25; 95% CI: 1.01, 1.53; I2: 35.5%; test for between-study heterogeneity, P = 0.21). Random-effects models, however, revealed a similar trend but did not reach the level of significance (random-effects RR: 1.38; 95% CI: 0.84, 2.25; I2: 35.5%; test for between-study heterogeneity, P = 0.21). A test for interaction was not feasible because of a single study reporting the association of lower weight and OS in children with ALL.
BMI and AML outcomes
Three studies reported on survival estimates for BMI in children and adolescents treated with pediatric AML regimens (Table 2, Figure 4). A statistically significant association was found between children and adolescents with higher BMI at diagnosis and poorer EFS (fixed-effects RR: 1.36; 95% CI: 1.16, 1.60); results were similar when the PEESE method was applied (EFS—RR: 1.33; 95% CI: 1.29, 1.36). Minimal between-study heterogeneity was present (I2: 0.0%; test for between-study heterogeneity, P = 0.99). Higher BMI was also associated with increased risk of mortality (OS—fixed-effects RR: 1.56; 95% CI: 1.32, 1.86). The results were attenuated but still statistically significant when the PEESE method was applied (OS—RR: 1.32; 95% CI: 1.10, 1.60). No significant between-study heterogeneity was found (I2: 0.0%; test for between-study heterogeneity, P = 0.66). Similar findings were observed with the random-effects model (EFS—random-effects RR: 1.36; 95% CI: 1.16, 1.60; OS—random-effects RR: 1.56; 95% CI: 1.32, 1.86). CIR and age-specific outcomes were not consistently reported across the included studies of AML; thus, no summary estimates were calculated. Visual examination of funnel plots and an Egger’s test for small-study effects also revealed no evidence of publication bias (EFS: P = 0.273; OS: P = 0.299; Supplemental Figure 4A and D).
FIGURE 4.
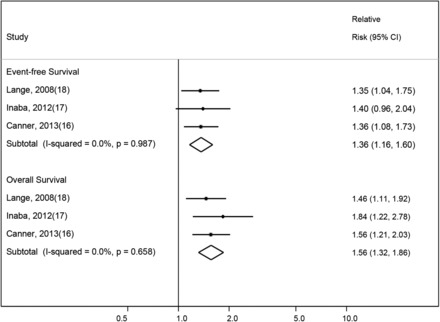
Meta-analyses of event-free survival and overall survival according to BMI in childhood acute myeloid leukemia are depicted. The studies are ordered according to year of study publication, with the black-filled diamonds representing the study-specific RRs and the horizontal line representing the 95% CI with the use of fixed-effects models. The open diamonds correspond to summary RRs.
BMI and TRT in leukemia therapy
For pediatric ALL therapy, 3 studies reported on TRT. No significant association with BMI was found for overall grade 3 or 4 nonhematologic toxicities (TRT—random-effects RR: 1.16; 95% CI: 0.89, 1.52). Significant study heterogeneity was present (I2: 83%; test for between-study heterogeneity, P < 0.01); the analysis was further complicated by the lack of uniform grading and reporting between regimens. However, an Egger’s test did not provide evidence of small-study effects (P = 0.523). Review of the toxicities reported in individual studies revealed obesity to be associated with an increased risk of pancreatic and hepatic toxicity on some ALL regimens (13), but no increase in severe toxicity or TRM on others (7, 9). A single study reporting on osteonecrosis as a targeted toxicity also reported the greatest risk to be present in the obese, particularly in female patients (15). No study reported a significant association of higher BMI with the incidence of infectious complications, supportive care requirements, or risk of TRM during ALL therapy (7, 9, 13). In contrast, a significantly greater risk of TRM was reported in overweight/obese children and adolescents on pediatric AML regimens compared with those of normal weight, primarily because of infection (16, 17). Comparisons of organ toxicity because of chemotherapy between obese populations in ALL and AML were not possible, because AML studies reported only TRM. Of note, an interim analysis for one included AML study (6) reported nonfatal toxicity as well, and did not find an increased incidence of hepatotoxicity.
DISCUSSION
This meta-analysis supports the existence of an adverse association between overweight and obesity (as characterized by higher BMI), with poorer survival in pediatric ALL and AML. The effect was present across all ages and in both leukemia phenotypes. In ALL, the association appeared to be greater in preadolescent and adolescent patients than in younger patients, although the formal test of interaction did not reach statistical significance; thus, the biological effects of obesity may occur irrespective of age, but additional research focused specifically on potential variability of this effect by age is required. The decreased OS associated with higher BMI for children diagnosed with ALL is consistent with the marked increased risk of relapse in the group, because relapse of disease remains the no. 1 cause of death in pediatric ALL (34). In AML, a higher BMI was associated with a risk of both poorer EFS and OS, although a specific assessment of relapse risk was not available. In contrast with the previous review (19), this analysis included a relatively uniform population for study from high-income countries. Importantly, variables that have a direct effect on outcome analyses, such as access to medical care and food security, are not likely to differ widely in the studied population. The overall strength of these findings is supported by the minimal between-study heterogeneity in the analyses. Moreover, the majority of the included population was drawn from randomized clinical trials with clear protocol-defined survival endpoints. The significant association between BMI and survival of pediatric leukemia was thus clearly evident despite a small number of studies.
Although significant, the specific nature of the association between BMI and leukemia outcomes remains to be elucidated. In ALL, the association with risk of relapse suggests that an effect of obesity on disease response is contributing to the association with poorer survival. In AML, the included studies reflect that the association with survival from AML instead may be due to greater TRM in overweight and obese children rather than diminished therapeutic efficacy and relapse (16–18). In the era of modern supportive care, however, it is unclear whether decreased rates of TRM and/or increased sensitivity of measuring disease response by immunophenotyping with flow cytometry (35) may yet reveal an association with risk of relapse in future studies as well.
Several hypotheses for a biological mechanism of the effect of obesity on leukemia therapy have been reported. Data from preclinical (36) and limited clinical settings (37, 38) suggest pharmacokinetic variation in the metabolism of common chemotherapy agents in the obese, yet prospective trials have found no such differences by BMI (9) or in those dosed with actual compared with ideal body weight (39–41). Other hypotheses focus on the effects of obesity on both the leukemia microenvironment and the host. Obesity is associated with overexpression of the insulin/insulin-like growth factor I and II axis (42), which may influence both leukemia initiation events and disease progression (43). Epidemiologic studies lend support to this hypothesis, with increased incidence of leukemia and cancers in diabetic populations (44) and in children of high birth weight (45), both of which have a high expression of this axis. Alternatively, the obesity microenvironment and adipokine receptors on blasts may contribute to leukemia resistance (46–48) or even directly activate multiple leukemogenic pathways (49). The pathophysiology of obesity’s influence on leukemia is most likely multifactorial, combining elements from all of these various implicated pathways.
Although this meta-analysis presents evidence of the presence of an adverse association of obesity with poorer outcomes from pediatric leukemias, the analysis was complicated by inherent limitations within the published literature. Despite the large number of publications found on obesity, few focused on the outcome of interest, and the risk of publication bias cannot be excluded. Our search term strategy was restricted to AML or ALL specifically; thus, we may have missed studies having a more general title of “cancer” during title review. However, we reviewed all references of included articles to reduce the likelihood of missing relevant studies. The review criteria resulted in the exclusion of articles that were conducted in middle- and low-income countries. We believe this criterion is important to reduce heterogeneity in baseline treatment outcomes and nutritional status across countries. In addition, a formal evaluation for publication bias based on funnel plots, Egger’s tests, and PEESE did not reveal any convincing evidence that our summary estimates were greatly affected by publication bias except for the association between obesity and ALL OS. When applying the PEESE method, the association was suggestive of a positive association but it was not statistically significant. We also acknowledge that, although included survival estimates were primarily the products of multivariable analyses already incorporating the most influential host and leukemia biology variables (Table 2), not all studies adjusted for all potential confounders (and for 3 studies in the meta-analysis, manually calculated estimates were used). Thus, we cannot rule out uncontrolled confounding by an unknown or unmeasured factor (e.g., socioeconomic status or ethnicity) or residual confounding from measurement error in the included covariates. Variables such as ethnicity and socioeconomic status have been associated with clinical outcomes in pediatric leukemia, and their absence in studies to date is noteworthy in itself; these variables should be considered in future studies evaluating BMI on clinical outcomes. We would also note that, although the majority of the data were extracted from children accrued to prospective trials (94%), the meta-analysis included 3 retrospective studies as well. Nonetheless, the strengths of our overall findings are supported by the consistency of the estimates across studies conducted at different international centers and populations and applying different modeling strategies. Studies of the influence of BMI on survival were also conducted as secondary analyses and thus introduced the potential for missing data. We would contend it to be extremely unlikely, however, that the probability of missing data depended on the missing data itself (i.e., nonignorable missingness). In the majority of studies, exclusion from the analyses primarily was due to a clinical circumstance [≤6% in only 1 study (16)] with only a small number of participants ineligible because of missing/irreconcilable height and weight data (<3% within the individual prospective trials). The risk of directed bias skewing the findings of this meta-analysis is thus minimal. We did not observe any statistically significant heterogeneity in our main findings, but because studies did not consistently examine the effect of BMI-defined weight groups (e.g., obese compared with normal, or overweight/obese compared with normal/underweight), we cannot exclude some hidden heterogeneity from the necessary use of combined risk estimates; this also precluded examination for a possible dose–response relation between levels of underweight, overweight, and obesity and survival outcomes. Finally, we cannot rule out index event bias, in which paradoxical observations of risk factors (e.g., obesity) are observed for incidence and for recurrence, thus biasing the analyses toward finding an absence of association (50). If such an index event bias were present, however, this would suggest that the true risk of obesity on survival may even be stronger that reported here (51).
Obesity rates are both prevalent and stable worldwide (22). The pervasive influence of obesity in society and on cancer clinical trials has transformed it to an area of priority research for the National Cancer Institute and American Society of Clinical Oncology (52). This meta-analysis supports a significant adverse association of overweight and obesity on survival of pediatric leukemia. Prospective investigation is necessary to gain additional insight into the mechanism of obesity’s influence on ALL and AML therapy, shared or otherwise, with the overarching goal of providing a rational intervention to improve outcomes in this at-risk population.
Supplementary Material
Acknowledgments
We thank Anca Meret for her expertise in guiding and performing the search strategy.
The authors’ responsibilities were as follows—EO, JMG, and EJL: designed the research; EO, DA, and EJL: conducted the research; JMG: analyzed the data; EO, JMG, LS, MN, and EJL: interpreted the data and wrote the manuscript; and EJL: had primary responsibility. None of the authors reported a conflict of interest related to the study.
ABBREVIATIONS
- ALL
acute lymphoblastic leukemia
- AML
acute myeloid leukemia
- CIR
cumulative incidence of relapse
- EFS
event-free survival
- OS
overall survival
- PEESE
precision effect estimate with standard error
- TRM
treatment-related mortality
- TRT
treatment-related toxicity
FOOTNOTES
Supported by the Tamarind Foundation (EJL) and by the Mentored Research Scholar Grant (no. 127000-MRSG-14-157-01-CCE), American Cancer Society (EJL).
REFERENCES
- 1. Ward E, DeSantis C, Robbins A, Kohler B, Jemal A.. Childhood and adolescent cancer statistics, 2014. CA Cancer J Clin 2014;64:83–103. [DOI] [PubMed] [Google Scholar]
- 2. Kuczmarski R, Ogden C, Grummer-Strawn L, Flegal K, Guo S, Wei R, Mei Z, Curtin L, Roche A, Johnson C.. CDC growth charts: United States. Advance data from vital and health statistics. Hyattsville (MD): National Center for Health Statistics; 2000. [PubMed] [Google Scholar]
- 3. Calle EE, Rodriguez C, Walker-Thurmond K, Thun MJ.. Overweight, obesity, and mortality from cancer in a prospectively studied cohort of U.S. adults. N Engl J Med 2003;348:1625–38. [DOI] [PubMed] [Google Scholar]
- 4. Larsson SC, Wolk A.. Overweight and obesity and incidence of leukemia: a meta-analysis of cohort studies. Int J Cancer 2008;122:1418–21. [DOI] [PubMed] [Google Scholar]
- 5. Castillo JJ, Reagan JL, Ingham RR, Furman M, Dalia S, Merhi B, Nemr S, Zarrabi A, Mitri J.. Obesity but not overweight increases the incidence and mortality of leukemia in adults: a meta-analysis of prospective cohort studies. Leuk Res 2012;36:868–75. [DOI] [PubMed] [Google Scholar]
- 6. Lange BJ, Gerbing RB, Feusner J, Skolnik J, Sacks N, Smith FO, Alonzo TA.. Mortality in overweight and underweight children with acute myeloid leukemia. JAMA 2005;293:203–11. [DOI] [PubMed] [Google Scholar]
- 7. Butturini AM, Dorey FJ, Lange BJ, Henry DW, Gaynon PS, Fu C, Franklin J, Siegel SE, Seibel NL, Rogers PC, et al. Obesity and outcome in pediatric acute lymphoblastic leukemia. J Clin Oncol 2007;25:2063–9. [DOI] [PubMed] [Google Scholar]
- 8. Gelelete CB, Pereira SH, Azevedo AM, Thiago LS, Mundim M, Land MG, Costa ES.. Overweight as a prognostic factor in children with acute lymphoblastic leukemia. Obesity 2011;19:1908–11. [DOI] [PubMed] [Google Scholar]
- 9. Hijiya N, Panetta JC, Zhou Y, Kyzer EP, Howard SC, Jeha S, Razzouk BI, Ribeiro RC, Rubnitz JE, Hudson MM, et al. Body mass index does not influence pharmacokinetics or outcome of treatment in children with acute lymphoblastic leukemia. Blood 2006;108:3997. [DOI] [PMC free article] [PubMed] [Google Scholar]
- 10. Aldhafiri FK, McColl JH, Reilly JJ.. Prognostic significance of being overweight and obese at diagnosis in children with acute lymphoblastic leukemia. J Pediatr Hematol Oncol 2014;36:234–6. [DOI] [PubMed] [Google Scholar]
- 11. Baillargeon J, Langevin AM, Lewis M, Estrada J, Mullins J, Pitney A, Ma JZ, Chisholm GB, Pollock BH.. Obesity and survival in a cohort of predominantly Hispanic children with acute lymphoblastic leukemia. J Pediatr Hematol Oncol 2006;28:575–8. [DOI] [PubMed] [Google Scholar]
- 12. Ethier MC, Alexander S, Abla O, Green G, Lam R, Sung L.. Association between obesity at diagnosis and weight change during induction and survival in pediatric acute lymphoblastic leukemia. Leuk Lymphoma 2012;53:1677–81. [DOI] [PubMed] [Google Scholar]
- 13. Orgel E, Sposto R, Malvar J, Seibel NL, Ladas E, Gaynon PS, Freyer DR.. Impact on survival and toxicity by duration of weight extremes during treatment for pediatric acute lymphoblastic leukemia: a report from the Children’s Oncology Group. J Clin Oncol 2014;32:1331–7. [DOI] [PMC free article] [PubMed] [Google Scholar]
- 14. Orgel E, Tucci J, Alhushki W, Malvar J, Sposto R, Fu CH, Freyer DR, Abdel-Azim H, Mittelman SD.. Obesity is associated with residual leukemia following induction therapy for childhood B-precursor acute lymphoblastic leukemia. Blood 2014;124:3932–8. [DOI] [PubMed] [Google Scholar]
- 15. Niinimäki RA, Harila-Saari AH, Jartti AE, Seuri RM, Riikonen PV, Pääkkö EL, Möttönen MI, Lanning M.. High body mass index increases the risk for osteonecrosis in children with acute lymphoblastic leukemia. J Clin Oncol 2007;25:1498–504. [DOI] [PubMed] [Google Scholar]
- 16. Canner J, Alonzo TA, Franklin J, Freyer DR, Gamis A, Gerbing RB, Lange BJ, Meshinchi S, Woods WG, Perentesis J, et al. Differences in outcomes of newly diagnosed acute myeloid leukemia for adolescent/young adult and younger patients: a report from the Children’s Oncology Group. Cancer 2013;119:4162–9. [DOI] [PMC free article] [PubMed] [Google Scholar]
- 17. Inaba H, Surprise HC, Pounds S, Cao X, Howard SC, Ringwald-Smith K, Buaboonnam J, Dahl G, Bowman WP, Taub JW, et al. Effect of body mass index on the outcome of children with acute myeloid leukemia. Cancer 2012;118:5989–96. [DOI] [PMC free article] [PubMed] [Google Scholar]
- 18. Lange BJ, Smith FO, Feusner J, Barnard DR, Dinndorf P, Feig S, Heerema NA, Arndt C, Arceci RJ, Seibel N, et al. Outcomes in CCG-2961, a children’s oncology group phase 3 trial for untreated pediatric acute myeloid leukemia: a report from the children’s oncology group. Blood 2008;111:1044–53. [DOI] [PMC free article] [PubMed] [Google Scholar]
- 19. Amankwah EK, Saenz AM, Hale GA, Brown PA.. Association between body mass index at diagnosis and pediatric leukemia mortality and relapse: a systematic review and meta-analysis. Leuk Lymphoma 2015;(Epub ahead of print; DOI:10.3109/10428194.2015.1076815). [DOI] [PubMed] [Google Scholar]
- 20. Hunger SP, Sung L, Howard SC.. Treatment strategies and regimens of graduated intensity for childhood acute lymphoblastic leukemia in low-income countries: a proposal. Pediatr Blood Cancer 2009;52:559–65. [DOI] [PubMed] [Google Scholar]
- 21. Murphy AJ, Mosby TT, Rogers PC, Cohen J, Ladas EJ.. An international survey of nutritional practices in low- and middle-income countries: a report from the International Society of Pediatric Oncology (SIOP) PODC Nutrition Working Group. Eur J Clin Nutr 2014;68:1341–5. [DOI] [PubMed] [Google Scholar]
- 22. Ng M, Fleming T, Robinson M, Thomson B, Graetz N, Margono C, Mullany EC, Biryukov S, Abbafati C, Abera SF, et al. Global, regional, and national prevalence of overweight and obesity in children and adults during 1980-2013: a systematic analysis for the Global Burden of Disease Study 2013. Lancet 2014;384:766–81. [DOI] [PMC free article] [PubMed] [Google Scholar]
- 23. Smith M, Arthur D, Camitta B, Carroll AJ, Crist W, Gaynon P, Gelber R, Heerema N, Korn EL, Link M, et al. Uniform approach to risk classification and treatment assignment for children with acute lymphoblastic leukemia. J Clin Oncol 1996;14:18–24. [DOI] [PubMed] [Google Scholar]
- 24. Jemal A, Center MM, DeSantis C, Ward EM.. Global patterns of cancer incidence and mortality rates and trends. Cancer Epidemiol Biomarkers Prev 2010;19:1893–907. [DOI] [PubMed] [Google Scholar]
- 25. Moher D, Shamseer L, Clarke M, Ghersi D, Liberati A, Petticrew M, Shekelle P, Stewart LA.. Group P-P. Preferred reporting items for systematic review and meta-analysis protocols (PRISMA-P) 2015 statement. Syst Rev 2015;4:1. [DOI] [PMC free article] [PubMed] [Google Scholar]
- 26. Freireich EJ, Wiernik PH, Steensma DP.. The leukemias: a half-century of discovery. J Clin Oncol 2014;32:3463–9. [DOI] [PubMed] [Google Scholar]
- 27. The World Bank. The World Bank report on high income countries [Internet]. [cited 2015 Feb 19]. Available from: http://data.worldbank.org/income-level/HIC.
- 28. Higgins JPT, Green S, editors. Cochrane handbook for systematic reviews of interventions. Version 5.1.0 [updated March 2011]. The Cochrane Collaboration; 2011. Available from: www.cochrane-handbook.org.
- 29. Higgins JP, Thompson SG, Deeks JJ, Altman DG.. Measuring inconsistency in meta-analyses. BMJ 2003;327:557–60. [DOI] [PMC free article] [PubMed] [Google Scholar]
- 30. Stram DO.. Meta-analysis of published data using a linear mixed-effects model. Biometrics 1996;52:536–44. [PubMed] [Google Scholar]
- 31. National Heart, Lung, and Blood Institute of the National Institutes of Health. Quality assessment tool for observational cohort and cross-sectional studies [Internet]. [cited 2015. May 27.] Available from: (https://www.nhlbi.nih.gov/health-pro/guidelines/in-develop/cardiovascular-risk-reduction/tools/cohort.
- 32. Sterne JA, Egger M.. Funnel plots for detecting bias in meta-analysis: guidelines on choice of axis. J Clin Epidemiol 2001;54:1046–55. [DOI] [PubMed] [Google Scholar]
- 33. Stanley TD, Doucouliagos H.. Meta-regression approximations to reduce publication selection bias. Res Synth Methods 2014;5:60–78. [DOI] [PubMed] [Google Scholar]
- 34. Hunger SP, Loh ML, Whitlock JA, Winick NJ, Carroll WL, Devidas M, Raetz EA, Committee COGALL.. Children’s Oncology Group’s 2013 blueprint for research: acute lymphoblastic leukemia. Pediatr Blood Cancer 2013;60:957–63. [DOI] [PMC free article] [PubMed] [Google Scholar]
- 35. Loken MR, Alonzo TA, Pardo L, Gerbing RB, Raimondi SC, Hirsch BA, Ho PA, Franklin J, Cooper TM, Gamis AS, et al. Residual disease detected by multidimensional flow cytometry signifies high relapse risk in patients with de novo acute myeloid leukemia: a report from Children’s Oncology Group. Blood 2012;120:1581–8. [DOI] [PMC free article] [PubMed] [Google Scholar]
- 36. Behan JW, Avramis VI, Yun JP, Louie SG, Mittelman SD.. Diet-induced obesity alters vincristine pharmacokinetics in blood and tissues of mice. Pharmacol Res 2010;61:385–90. [DOI] [PMC free article] [PubMed] [Google Scholar]
- 37. Thompson PA, Rosner GL, Matthay KK, Moore TB, Bomgaars LR, Ellis KJ, Renbarger J, Berg SL.. Impact of body composition on pharmacokinetics of doxorubicin in children: a Glaser Pediatric Research Network study. Cancer Chemother Pharmacol 2009;64:243–51. [DOI] [PubMed] [Google Scholar]
- 38. Zuccaro P, Guandalini S, Pacifici R, Pichini S, Di Martino L, Guiducci M, Giuliano M, Di Tullio MT, Pettoello Mantovani M.. Fat body mass and pharmacokinetics of oral 6-mercaptopurine in children with acute lymphoblastic leukemia. Ther Drug Monit 1991;13:37–41. [DOI] [PubMed] [Google Scholar]
- 39. Lin A, Othus M, McQuary A, Chi M, Estey E.. Influence of obesity on efficacy and toxicity of induction chemotherapy in patients with newly diagnosed acute myeloid leukemia. Leuk Lymphoma 2013;54:541–6. [DOI] [PMC free article] [PubMed] [Google Scholar]
- 40. Wenzell CM, Gallagher EM, Earl M, Yeh JY, Kusick KN, Advani AS, Kalaycio ME, Mukherjee S, Tiu RV, Maciejewski JP, et al. Outcomes in obese and overweight acute myeloid leukemia patients receiving chemotherapy dosed according to actual body weight. Am J Hematol 2013;88:906–9. [DOI] [PubMed] [Google Scholar]
- 41. Medeiros BC, Othus M, Estey EH, Fang M, Appelbaum FR.. Impact of body-mass index on the outcome of adult patients with acute myeloid leukemia. Haematologica 2012;97:1401–4. [DOI] [PMC free article] [PubMed] [Google Scholar]
- 42. Westley RL, May FE.. A twenty-first century cancer epidemic caused by obesity: the involvement of insulin, diabetes, and insulin-like growth factors.Int J Endocrinol 2013;2013:632461. [DOI] [PMC free article] [PubMed] [Google Scholar]
- 43. Hursting SD, Nunez NP, Varticovski L, Vinson C.. The obesity-cancer link: lessons learned from a fatless mouse. Cancer Res 2007;67:2391–3. [DOI] [PubMed] [Google Scholar]
- 44. Castillo JJ, Mull N, Reagan JL, Nemr S, Mitri J.. Increased incidence of non-Hodgkin lymphoma, leukemia, and myeloma in patients with diabetes mellitus type 2: a meta-analysis of observational studies. Blood 2012;119:4845–50. [DOI] [PMC free article] [PubMed] [Google Scholar]
- 45. Caughey RW, Michels KB.. Birth weight and childhood leukemia: a meta-analysis and review of the current evidence. Int J Cancer 2009;124:2658–70. [DOI] [PubMed] [Google Scholar]
- 46. Behan JW, Yun JP, Proektor MP, Ehsanipour EA, Arutyunyan A, Moses AS, Avramis VI, Louie SG, Butturini A, Heisterkamp N, et al. Adipocytes impair leukemia treatment in mice. Cancer Res 2009;69:7867–74. [DOI] [PMC free article] [PubMed] [Google Scholar]
- 47. Ehsanipour EA, Sheng X, Behan JW, Wang X, Butturini A, Avramis VI, Mittelman SD.. Adipocytes cause leukemia cell resistance to L-asparaginase via release of glutamine. Cancer Res 2013;73:2998–3006. [DOI] [PMC free article] [PubMed] [Google Scholar]
- 48. Bruserud Ø, Huang TS, Glenjen N, Gjertsen BT, Foss B.. Leptin in human acute myelogenous leukemia: studies of in vivo levels and in vitro effects on native functional leukemia blasts. Haematologica 2002;87:584–95. [PubMed] [Google Scholar]
- 49. Makki K, Froguel P, Wolowczuk I.. Adipose tissue in obesity-related inflammation and insulin resistance: cells, cytokines, and chemokines. ISRN inflamm 2013;2013:139239. [DOI] [PMC free article] [PubMed] [Google Scholar]
- 50. Dahabreh IJ, Kent DM.. Index event bias as an explanation for the paradoxes of recurrence risk research. JAMA 2011;305:822–3. [DOI] [PMC free article] [PubMed] [Google Scholar]
- 51. Smits LJ, van Kuijk SM, Leffers P, Peeters LL, Prins MH, Sep SJ.. Index event bias-a numerical example. J Clin Epidemiol 2013;66:192–6. [DOI] [PubMed] [Google Scholar]
- 52. Ligibel JA, Alfano CM, Courneya KS, Demark-Wahnefried W, Burger RA, Chlebowski RT, Fabian CJ, Gucalp A, Hershman DL, Hudson MM, et al. American society of clinical oncology position statement on obesity and cancer. J Clin Oncol 2014;32:3568–74. [DOI] [PMC free article] [PubMed] [Google Scholar]
Associated Data
This section collects any data citations, data availability statements, or supplementary materials included in this article.