Abstract
Background.
Urine (u) calcium (Ca) excretion is directly dependent on dietary sodium (Na) intake leading to the recommendation for Na restriction in hypercalciuric kidney stone formers. However, there is no direct evidence that limiting Na intake will reduce recurrent stone formation.
Materials and Methods.
We used genetic hypercalciuric stone-forming (GHS) rats, which universally form Ca phosphate (P) kidney stones, fed either a low (LNa, 0.05%) or normal (NNa, 0.4%) Na diet (D) for 18 wks. Urine was collected at 6 wk intervals. Radiographic analysis for stone formation and bone analyses were done at the conclusion of the study.
Results.
Mean uCa was lower with LNaD than NNaD as was uP and LNaD decreased mean uNa and uChloride. There were no differences in urine supersaturation with respect to CaP or CaOxalate. However, stone formation was markedly decreased with LNaD by radiographic analysis. The LNaD group had significantly lower femoral anterior-posterior diameter and volumetric bone mineral density (vBMD), but no change in vertebral trabecular vBMD. There were no differences in bone formation rate or osteoclastic bone resorption between groups. The LNaD group had significantly lower femoral stiffness; however, the ultimate load and energy to fail was not different.
Conclusion.
Thus a low Na diet reduced uCa and stone formation in GHS rats, even though supersaturation with respect to CaP and CaOx was unchanged and effects on bone were modest. These data, if confirmed in humans, support dietary Na restriction to prevent recurrent Ca nephrolithiasis.
Keywords: nephrolithiasis, sodium, mineral metabolism
INTRODUCTION
Hypercalciuria is the most common metabolic abnormality observed in patients with calcium-based kidney stones, the most prevalent stones formed by patients in the US[1,2]. Increased levels of urine (u) calcium (Ca) increase the probability of growth of Ca oxalate (CaOx) and/or Ca hydrogen phosphate (CaHPO4, brushite) crystals into clinically significant stones[1]. Patients with idiopathic hypercalciuria (IH), defined as excessive uCa without a demonstrable metabolic cause, generally have normal serum (s) Ca, normal or elevated serum 1,25(OH)2D3 (s1,25D), normal or elevated serum parathyroid hormone (sPTH), normal or low serum phosphate (sP), and low bone mass[1,3,4]. IH exhibits a polygenic mode of inheritance[3,5].
The annual incidence of kidney stones in industrialized nations exceeds 1 per 1000 persons, with a lifetime risk of ~7% in women and ~11% in men[6]. After an initial episode of nephrolithiasis 60–80% of patients form at least one recurrent stone. Several strategies to decrease stone recurrence have been devised, including potassium citrate[7–9], thiazide diuretics[10] and reduction of dietary sodium (Na)[11–16].
The rationale for preventing stone recurrence by limiting dietary Na relies on both Ca transport physiology and clinical studies. Renal Ca transport is Na dependent[17–19]. Clinically, there is an increased risk for kidney stones in women in the highest quintile of Na intake compared to the lowest quintile[20]. Comparison of a low-Ca diet with a low-Na, low protein, normal-Ca diet over a 5 year period demonstrated that the latter diet was more effective in reducing stone recurrence although the individual contribution of the reduction in dietary Na could not be determined[21]. In Ca stone-forming patients, the highest Na intake correlated with the lowest bone mineral density (BMD)[22]. Urinary Na has been shown to correlate with urinary Ca, suggesting that Na intake influences hypercalciuria and stone formation[23].
To examine the effect of a low Na diet on urine supersaturation, stone formation and bone quality, we utilized a model of human idiopathic hypercalciuria (IH), the genetic hypercalciuric stone-forming (GHS) rat[24]. GHS rats were generated by selectively inbreeding Sprague-Dawley (SD) rats for increased uCa excretion[24]. When fed a standard, ample Ca diet, each GHS rat now consistently excretes over 10 fold more uCa than SD controls[24]. The degree of hypercalciuria has continued to increase with successive generations, although at a much slower rate than with earlier generations. Like patients with IH, GHS rats have normal serum Ca[25], increased intestinal Ca absorption[26] and enhanced bone resorption[27], decreased renal tubule Ca reabsorption[28], and normal s1,25D levels[26,29,30] in addition to decreased bone mineral density[31,32]. Hypercalciuria is also a polygenic trait in GHS rats[33]. When fed a standard Ca diet all GHS rats develop kidney stones[34,35] composed of CaP[34,36–38]. Addition of hydroxyproline to the diet of GHS rats results in CaOx stone formation[39–41]. In this study, GHS rats were fed either a normal Na diet (NNaD, 0.4%) or a low Na diet (LNaD, 0.05%). At end of 18 weeks, urine and blood chemistry, urine supersaturation, stone formation and bone quality were evaluated.
MATERIALS and METHODS
Study Protocol
Tthree month old GHS rats from the 98th generation were divided into two groups (each n=12). Both were fed a normal Ca diet (1.2% Ca) with either normal sodium (0.40%, NNaD) or low sodium (0.05%, LNaD). Sodium content of the LNaD diet was adjusted with NaCl to produce NNaD. At weeks 6, 12 and 18, each rat was weighed and 24h urine collected over 4 days. For two collections, urine was acidified with HCl; for another two collections urine was collected in thymol. Collections in thymol were used for pH, uric acid and chloride and collections in HCl were used for all other measurements. Each rat received an intraperitoneal injection of 1% calcein green at ten and two days prior to sacrifice for dynamic histomorphometry. At 18 weeks, rats were euthanized and blood was collected via cardiac puncture. Kidneys, ureters and bladders were removed for X-ray imaging in a faxitron while bones were obtained for histological studies and mechanical testing. Femurs, humeri and vertebral columns were harvested and frozen at −20 C, while the right tibiae were placed in 70% ethanol and the left tibiae fixed in 10% neutral buffered formalin for 48h and then decalcified in 10% EDTA. One rat from each group died during the study and therefore was not included (final n=11). The University of Rochester Committee for Animal Resources approved all procedures.
Urine and Serum Chemistries
Urine calcium, magnesium, phosphate, ammonium and creatinine were measured spectrophotometrically using a Beckman CX5 Pro autoanalyzer (Beckman Coulter, Brea, CA). Urine potassium, chloride and sodium were measured by ion-specific electrodes on the Beckman CX5 and urine pH using a glass electrode. Urine citrate, oxalate and sulfate were measured by ion chromatography using a Dionex ICS 2000 system (Dionex Corp, Sunnyvale, CA). All urine solutes were measured at 6, 12 and 18 weeks and a mean value for each time period as well as overall mean value was calculated. Serum calcium and phosphate were determined colorimetrically (BioVision, Milpitas, CA). Serum PTH, FGF23, osteocalcin (OC) and P1NP were determined by enzyme immunoassay: intact PTH and FGF23 (Immutopics, San Clemente, CA), OC (Alfa Aesar, Tewksbury, MA) and P1NP (Fisher Scientific). All of these methods have been used previously[31,36,42–44]
Urine Supersaturation.
With the measured solute excretion, the urinary supersaturation with respect to CaOx, CaP and uric acid solid phases were calculated using the computer program EQUIL2[45] as we have done previously[37,39,44,46,47]. Ratios of 1 denote a urine at equilibrium, those >1 denote supersaturation and those <1 denote undersaturation. There is excellent correspondence between calculated and experimentally measured saturation in urine and blood.
Kidney Stone Formation
The kidneys, ureters, and bladder were removed from each rat en bloc, frozen and imaged in a Faxitron radiography device (Tucson, AZ) to determine extent of kidney stone formation. Three observers blinded to treatment scored all radiographs on a qualitative scale ranging from 0 (no stones) to 4 (extensive stones).
Bone Mineral Density: Dual Energy X-ray Absorptiometry
Dual energy X-ray absorptiometry (DEXA) with a Lunar PIXImus Bone Densitometer (Lunar GE, Mississauga, Canada) was used to determine tissue density and mineral content of the right femora and L6 vertebrae. The areal bone mineral density (aBMD), bone mineral content (BMC) and bone area (BArea) were measured.
Bone Mineral Density: Micro-Computed Tomography
Micro-computed tomography (microCT) with an 1174 compact Micro-CT (Skyscan, Kontich, Belgium) was used to measure volumetric bone mineral density (vBMD) and microarchitecture of the mid-diaphysis of right femurs (cortical bone) and L6 vertebrae (trabecular bone). For vertebrae, density measured was the area between the growth plates, and for femurs, density measured at one millimeter above and below the mid shaft of the bone. Measured parameters include volumetric bone mineral density (Femoral vBMD), anterior-posterior diameter (AP), trabecular volumetric bone mineral density (Trabecular vBMD), bone volume (BV/TV), trabecular number (Tb.N), trabecular thickness (Tb.Th), and trabecular separation (Tb.Sp).
Tissue Level Remodeling
Tissue-level remodeling was assessed via histomorphometry on both mineralized (undecalcified) and unmineralized (decalcified) bone thin sections. Stained sections are viewed at a high magnification and results quantified using computer software.
Undecalcified Histomorphometry
Undecalcified histomorphometry differentiates between mineralized and demineralized tissue in bone fixed in 70% ethanol. Right tibiae sections were used for static and dynamic histomorphometric analysis. Cross-sections of the left distal tibiae were used for back-scattered electron microscopy.
Static Histomorphometry
Sections (5μm) of undecalcified right tibiae were stained with Goldner’s Trichrome and quantified using the Bioquant Osteo 11.2.6 MIR software (Bioquant Image Analysis, Nashville, TN). Trabecular bone was analyzed in the proximal tibia metaphysis. Parameters measured include percent bone volume (BV/TV), percent bone surface (BS/BV), trabecular number (Tb.N), trabecular separation (Tb.Sp), trabecular thickness (Tb.Th), osteoid volume (OV), percent osteoid volume per bone volume (OV/BV), osteoid surface (OS), percent osteoid surface per bone surface (OS/BS), and osteoid width (O.Wi).
Dynamic Histomorphometry
Sections of calcein labeled undecalcified right tibiae were used for dynamic histomorphometry and quantified using Bioquant Osteo 11.2.6 MIR software (Bioquant Image Analysis). Parameters measured include percent mineralized surface per bone surface (MS/BS), mineral apposition rate (MAR), bone formation rate normalized over bone surface (BFR/BS), and bone formation rate normalized over bone volume (BFR/BV).
Decalcified Histology
Sections (5 μm) of decalcified left tibiae were stained for tartrate-resistant acid phosphatase (TRAP) to measure osteoclasts to assess bone resorption and counterstained with acid hematoxylin. Results were quantified using Bioquant Osteo 11.2.6 software. Trabecular bone of proximal tibial metaphysis was analyzed for osteoclast surface (Oc.S), percent osteoclast surface (%Oc.S), number of osteoclasts (N.Oc), and number of osteoclasts per mm osteoclast surface (N.Oc/Oc.S).
Biomechanical Properties
Biomechanics of femurs were assessed using an Instron 4465 mechanical testing instrument (Instron, Burlington, Canada) and Labview 5.0 data acquisition software (National Instruments, Austin, TX, USA) to define a load-displacement curve. Ultimate load, stiffness, ultimate displacement, and energy to break were calculated from the load-displacement curve. Data were normalized for specimen geometry to create a stress-strain curve to derive ultimate stress, failure strain, toughness, and Young’s modulus.
Three-Point Bending.
Three-point bending was performed on the right femurs to test the strength of the cortical bone.
Vertebral Compression.
Vertebral compression was measured on excised L6 vertebrae. Vertebral compression does not result in complete fracture, the failure point was determined by an 8–10% reduction in load.
Femoral Neck Fracture.
The proximal end of the femurs was subjected to femoral neck fracture using an Instron 4465 to test mechanical properties of cortical and trabecular bone combined.
Degree of Mineralization
Back-scattered electron microscopy (BSE) on both undecalcified right tibiae and left distal tibiae cross-section samples was done with a scanning electron microscope (Philips, XL300ESEM, Best, The Netherlands). Images were taken using a solid state BSE detector (FEI Company, Hillsboro, Oregon, USA).
Statistical Analysis.
Urine analytes, serum values and stone formation were compared by ANOVA with a conventional computer program (Statistica, StatSoft, Tulsa, OK) and expressed as mean ± SE. Bone parameters were analyzed using the SPSS Statistics 20 program (SPSS, Chicago, IL) to perform independent-sample T-tests and are expressed as mean ± SD. Significance for all determinations was considered at p<0.05.
RESULTS
Urine Chemistry
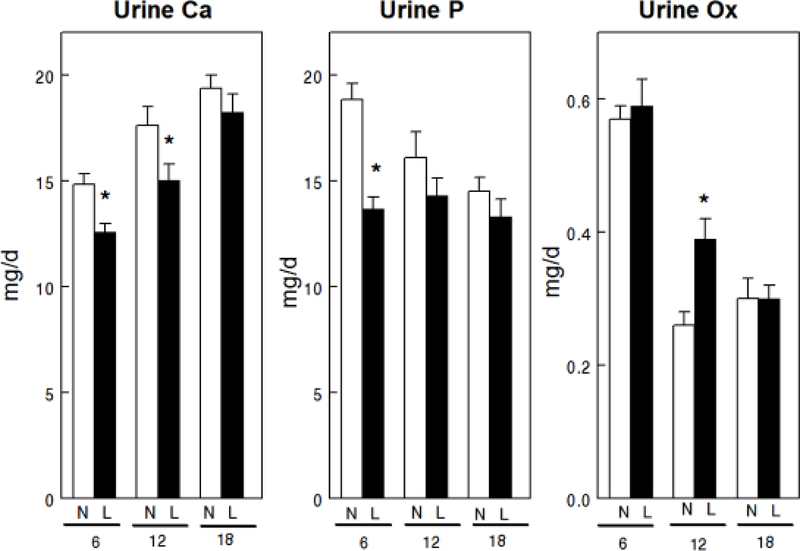
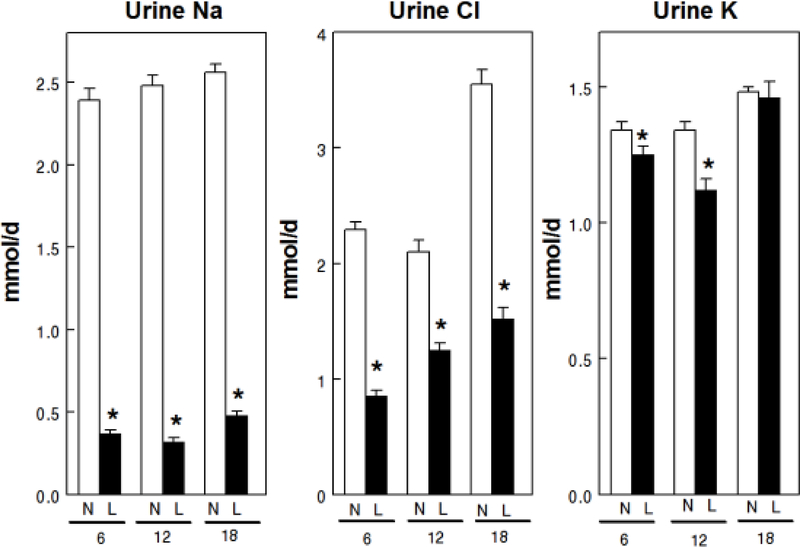
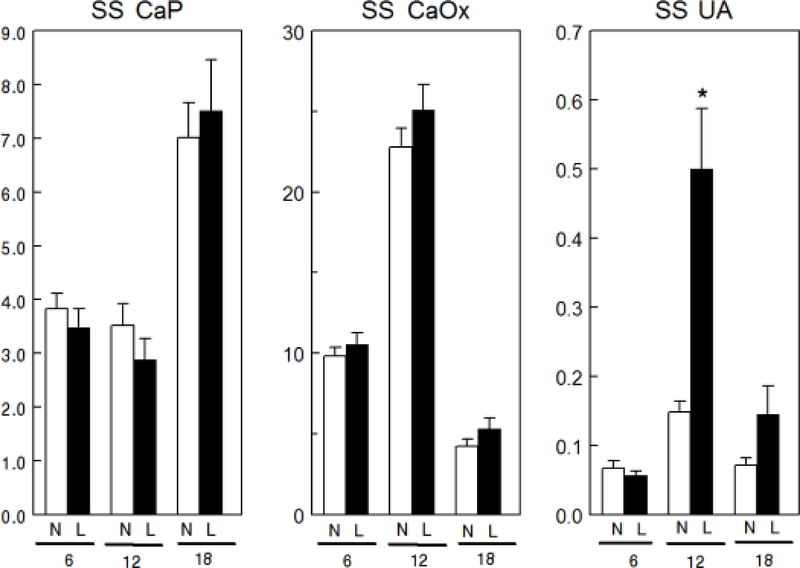
Overall mean uCa was lower with LNaD than NNaD (Table 1) and uCa was reduced in the first two 6 week time periods but not in the third (Fig. 1). Overall mean uP was lower with LNaD than NNaD and uP was reduced in the first 6 weeks, but not in the later time periods. Overall mean u oxalate (Ox) was not different between the two groups though it was increased during the second time period with LNaD. Overall mean uNa and uCl were significantly lower in GHS fed LNaD compared to NNaD (Table 1) and both were lower during each time period (Fig. 2). Overall mean uK was lower with LNaD than NNaD and uK was reduced in the first two 6 week time periods but not in the third. Creatinine, pH, NH4+, citrate and volume did not differ with diet Na (Table 1). There were no significant differences in u supersaturation with respect to the solid phases of CaP or CaOx (Figure 3). Overall mean urine supersaturation with respect to the solid phase of uric acid was not different between the groups and far less than one at all times; however, it was increased during the second time period with LNaD.
Table 1.
Overall mean urine parameters
| solute | Normal Na Diet | Low Na Diet |
|---|---|---|
| Calcium (mg/d) | 17.3 ± 0.5 | 15.2 ± 0.55* |
| Phosphate (mg/d) | 16.5 ± 0.6 | 13.8 ± 0.4* |
| Oxalate (mg/d) | 0.38 ± 0.03 | 0.43 ± 0.02 |
| Sodium (mmol/d) | 2.48 ± 0.04 | 0.39 ± 0.02* |
| Chloride (mmol/d) | 2.65 ± 0.13 | 1.20 ± 0.06* |
| Potassium (mmol/d) | 1.39 ± 0.02 | 1.27 ± 0.03* |
| Citrate (mg/d) | 60.24 ± 1.6 | 57.24 ± 1.6 |
| Ammonium (mmol/d) | 1.07 ± 0.07 | 0.96 ± 0.03 |
| Magnesium (mg/d) | 15.0 ± 0.3 | 14.1 ± 0.3 |
| Creatinine (mg/d) | 11.65 ± 0.19 | 11.31 ± 0.26 |
| pH | 6.24 ± 0.07 | 6.17 ± 0.08 |
| Volume (ml) | 29.6 ± 1.1 | 27.8 ± 1.5 |
| Uric Acid (mg/d) | 1.35 ± 0.07 | 1.44 ± 0.10 |
| Sulfate (meq/d) | 1.28 ± 0.06 | 1.22 ± 0.05 |
| SS Uric acid | 0.09 ± 0.01 | 0.18 ± 0.03* |
| SS CaP | 4.8 ± 0.4 | 4.6 ± 0.5 |
| SS CaOx | 3.2 ± 0.2 | 4.0 ± 0.4 |
| Weight (g) | 298.0 ± 2.5 | 290.3 ± 2.7* |
p<0.05 compared to the Normal Na Diet
Figure 1.
Urine calcium (Ca), phosphorus (P) and oxalate (Ox) excretion for GHS rats fed a normal (N) or low (L) sodium (Na) diet. Urine was collected for four 24h periods at 6, 12 and 18 weeks from GHS rats to determine solute levels as described in the Concise Methods. Values are mean ± SE for 11 rats in each group. *p<0.05 for L compared to N at the same time period.
Figure 2.
Urine sodium (Na), chloride (Cl) and potassium (K) excretion for GHS rats fed a normal (N) or low (L) sodium (Na) diet. Urine was collected for four 24h periods at 6, 12 and 18 weeks from GHS rats to determine solute levels as described in the Concise Methods. Values are mean ± SE for 11 rats in each group. *p<0.05 for L compared to N at the same time period.
Figure 3.
Urine supersaturation (SS) for calcium phosphate (CaP), calcium oxalate (CaOx) and uric acid (UA) for GHS rats fed a normal (N) or low (L) sodium (Na) diet. Urine was collected for four 24h periods at 6, 12 and 18 weeks to determine solute levels that were used to calculate relative supersaturation as described in the Concise Methods. Values for relative supersaturation are mean ± SE (n=11) and are unitless. *p<0.05 for L compared to N at the same time period.
Stone Formation
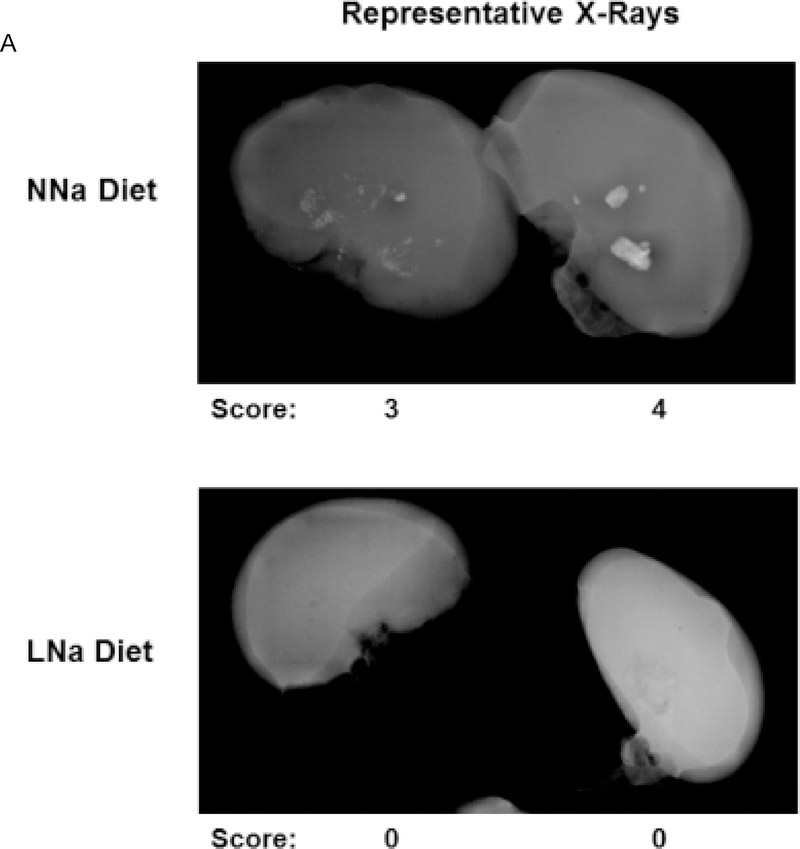
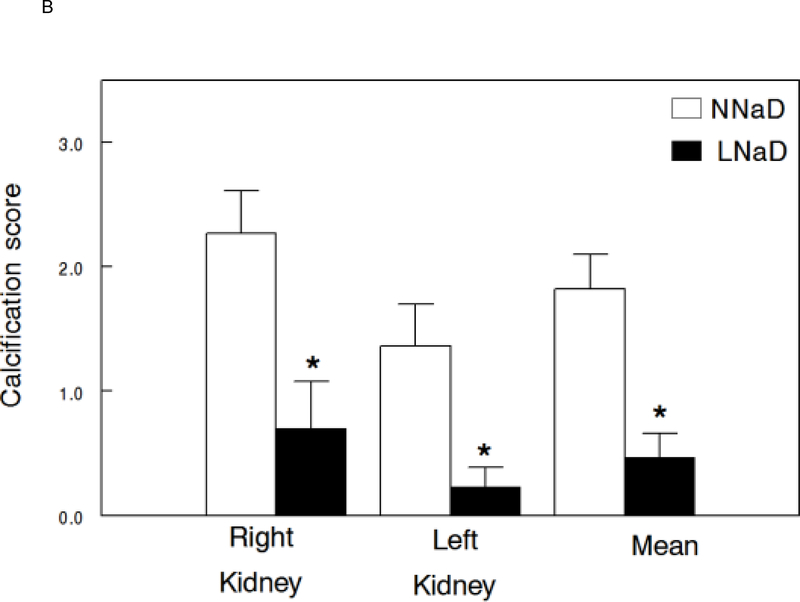
X-rays of excised kidneys and ureters were examined radiographically (representative X-rays, Figure 4A) and an overall stone formation score determined as we have done previously[44]. Radiographic analysis of kidneys demonstrated a significant decrease in stone formation in both the right and left kidneys with LNaD (scores: range of 0 (absence of calcification) to 4 (significant calcification), Figure 4B).
Figure 4.
Kidney stone formation at the conclusion of the 18 week study. At the end of the 18 week study, the extent of kidney stone formation was determined by blinded three observers as described in the Concise Methods. A) Representative radiographs of kidneys on a normal Na diet (NNaD) or a low Na diet (LNaD). Calcification scores are provided as a reference. B) Quantitation of stone formation and calcification in all GHS rats fed a NNaD or a LNaD. Values are mean ± SEM (n=11). *p<0.05 for LNaD compared to NNaD.
Serum Chemistry
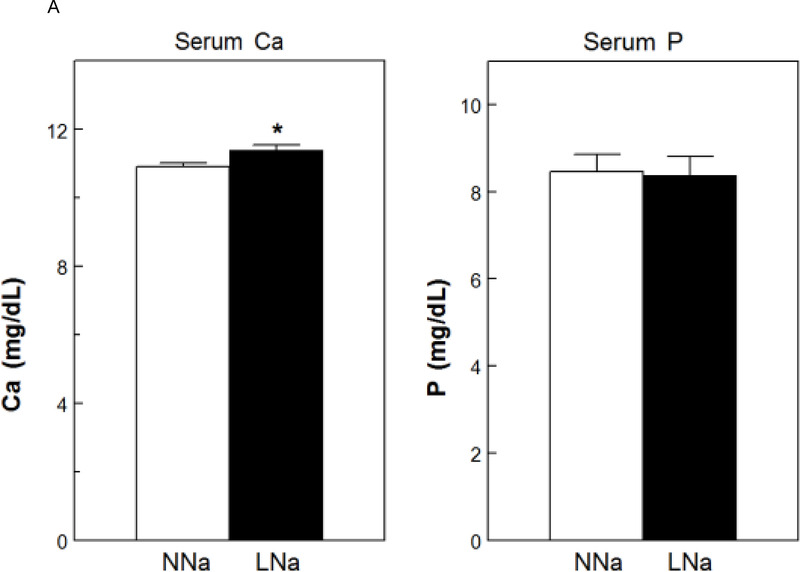
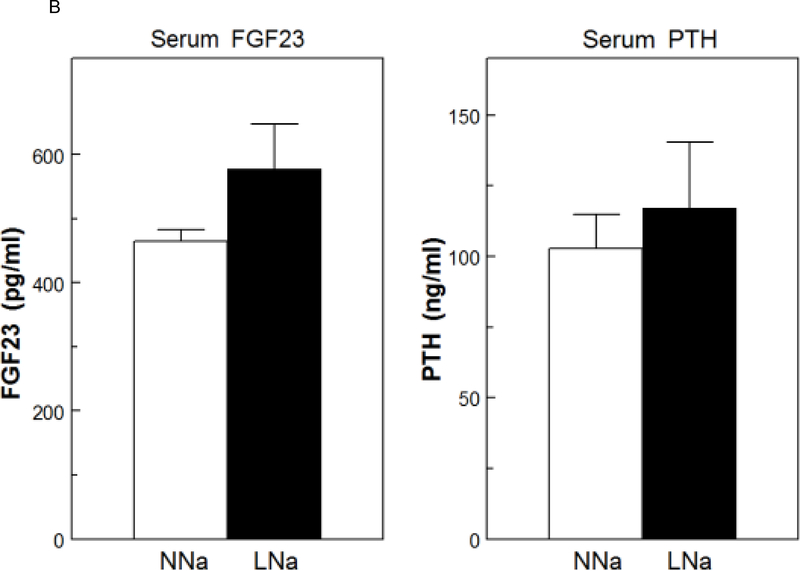
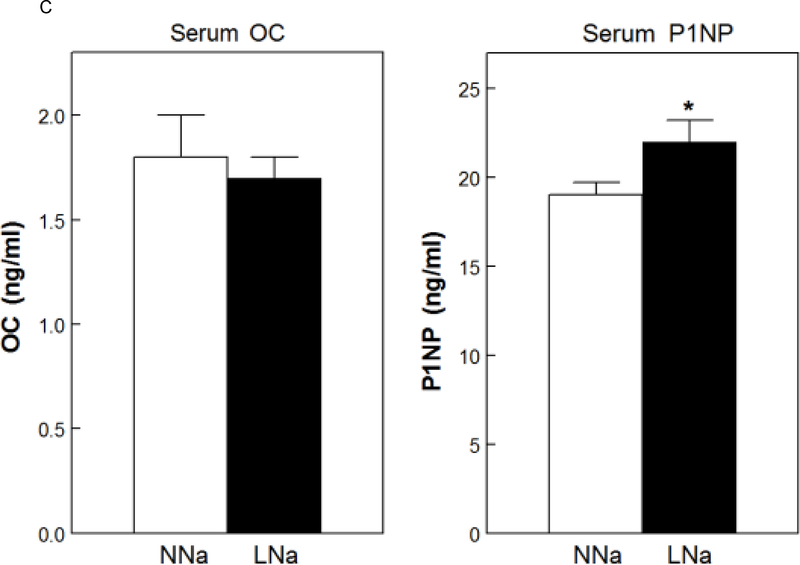
Serum Ca was slightly, but significantly, increased with LNaD (Figure 5A). There were no differences in serum P (Fig. 5A), PTH or FGF23 (Fig. 5B). To assess osteoblast activity and, indirectly, bone formation, serum levels of osteocalcin (OC) and the amino terminal propeptide of type 1 collagen (P1NP) were measured. P1NP levels were elevated with LNaD as compared to NNaD; however, there was no difference in the level of in OC (Fig. 5C).
Figure 5.
Serum calcium (Ca), phosphorus (P), fibroblast growth factor 23 (FGF23), parathyroid hormone (PTH), osteocalcin (OC) and amino terminal propeptide of type 1 collagen (P1NP) at the conclusion of the 18 week study. Serum levels were determined as described in the Concise Methods. A) Serum Ca and P on normal Na diet (NNaD) compared to low Na diet (LNaD); B) Serum FGF23 and PTH on NNaD compared to LNaD; C) Serum OC and P1NP on NNaD compared to LNaD. Values are mean ± SEM (n=11). *p<0.05 for LNaD compared to NNaD.
Bone Mineral Density
MicroCT revealed that the LNaD had significantly lower femoral cortical volumetric bone mineral density (vBMD), but no change in vertebral trabecular vBMD (Table 2). However, DEXA did not demonstrate a difference in either the femurs or vertebrae for aBMD, BMC or BArea between the NNaD and LNaD (data not shown).
Table 2.
Bone Parameters
| NNaD | LNaD | |
|---|---|---|
| Bone Mineral Density | ||
| Femoral cortical vBMD (g/cm3) | 1.266 ± 0.067 | 1.206 ± 0.058* |
| Vertebral Trabecular vBMD (g/cm3) | 0.704 ± 0.077 | 0.712 ± 0.112 |
| Bone Microachitecture | ||
| Cortical Thickness (mm) | 0.69 ± 0.04 | 0.69 ± 0.02 |
| Anterior-Posterior diameter (mm) | 3.60 ± 0.12 | 3.49 ± 0.11* |
| Cortical Mechanical Properties | ||
| Stiffness (N/mm) | 417.91 ± 27.82 | 377.58 ± 45.27* |
| Ultimate Load (N) | 151.86 ± 10.52 | 146.55 ± 10.79 |
| Energy to Fail (MPa) | 22.45 ± 4.80 | 21.02 ± 5.04 |
| Young’s Modulus (GPa) | 1.16 ± 0.05 | 1.12 ± 0.15 |
| Vertebral Compression | ||
| Stiffness (N/mm) | 719.07 ± 201.13 | 583.67 ± 80.20 |
| Failure Stress (MPa) | 40.58 ± 6.30 | 36.23 ± 5.23 |
| Energy to Fail (MPa) | 2.76 ± 0.95 | 2.69 ± 1.06 |
| Young’s Modulus | 740.22 ± 225.56 | 646.15 ± 199.98 |
| Static Histomorphometry | ||
| % Bone Surface (BS/BV) | 32.31 ± 2.54 | 36.59 ± 6.92 |
| Trabecular Separation (μm) | 0.29 ± 0.05 | 0.23 ± 0.05* |
| Trabecular Number | 2.47 ± 0.28 | 2.67 ± 0.40 |
| Dynamic Histomorphometry | ||
| MS/BS (%) | 23.31 ± 6.06 | 19.91 ± 6.18 |
| Mineral Apposition Rate (μm/day) | 1.96 ± 0.31 | 1.89 ± 0.23 |
| BFR/BS (μm/day/mm) | 0.02 ± 0.01 | 0.01 ± 0.01 |
| BFR/BV (μm/day/mm2) | 0.61 ± 0.30 | 0.43 ± 0.18 |
| Decalcified Histology | ||
| Osteoclasts/OC. Surface (1/mm) | 19.10 ± 4.35 | 12.58 ± 10.64 |
| Bone Mineralization | ||
| Peak Grey Level | 169.30 ± 8.78 | 177.25 ± 8.78 |
p<0.05 compared to the normal Na Diet.
Bone Microarchitecture
While there was no difference in cortical thickness, the femurs from rats fed the LNaD had significantly lower anterior-posterior (AP) diameter when compared to NNaD (Table 2). MicroCT showed no significant differences between the two groups in the moment of inertia, porosity or thickness of the cortical bone (data not shown). In the trabecular bone, microCT showed no significant differences in trabecular structural parameters, including percent bone volume, trabecular number, trabecular thickness and trabecular separation (data not shown).
Mechanical Properties
There was significantly lower femoral stiffness in rats fed the LNaD; however, there was no difference in ultimate load, energy to fail or Young’s modulus (Table 2). Vertebral compression showed a trend towards lower yield displacement (p=0.083) and lower stiffness (0.075) with LNaD compared to NNaD (Table 2). There was also a trend towards lower yield strain (p=0.079) and lower fail stress (p=0.093) with LNaD. Femoral-neck fracture showed no significant differences between LNaD and NNaD (data not shown).
Undecalcified Histomorphometry
Static Histomorphometry.
Rats fed LNaD had significantly lower trabecular separation compared to NNaD (Table 2). There was also a trend towards lower trabecular thickness (Tb.Th, p=0.079) with LNaD, as well as a trend towards a higher percent bone surface (BS/BV, p=0.069) compared to NNaD.
Dynamic Histomorphometry.
There were no significant differences in percent mineralized bone surface or bone formation rate between NNaD and LNaD (Table 2).
Decalcified Histology
Based on TRAP staining there were no significant differences in bone resorption between NNaD and LNaD. However, there was a trend towards a lower number of osteoclasts per osteoclast surface (N.Oc/Oc.S, p=0.077) with LNaD compared to NNaD (Table 2).
Bone Mineralization
Back-scattered electron (BSE) microscopy showed no significant differences in the mineralization of the bone between the two groups, however there was a trend towards a higher peak grey level (p= 0.074) with LNaD compared to NNaD (Table 2).
DISCUSSION
GHS rats have alterations in Ca homeostasis including increased intestinal absorption, reduced renal tubular reabsorption and increased bone resorption, similar to those of many patients with idiopathic hypercalciuria [24]. Hypercalciuria in the GHS rats leads directly to stone formation, as it does in humans [1,37,39]. GHS rats also have reduced bone mineral density (BMD), as do humans with nephrolithiasis, as well as lower trabecular volume and thickness compared to control Sprague-Dawley rats [32,39]. Previous studies on the effect of dietary Na intake, performed on humans with hypercalciuria, as well as normal rats [48,49], demonstrate that increased dietary Na leads to increased hypercalciuria, as well as an increase in osteoporotic risk factors such as increased bone resorption and decreased BMD [48,49]. In this study we utilized GHS rats to determine the effect of a low Na diet, generally prescribed to help prevent recurrent stone formation [11–16,50,51], on urine supersaturation, stone formation and bone quality.
Feeding the hypercalciuric GHS rats a low Na diet effectively reduced uCa excretion. However, in spite of an 8-fold reduction in dietary Na intake and a fall in uNa of 2.09 mmoles, uCa fell by only 0.05 mmoles. A similar decrease in uCa excretion was found in a previous study examining the effect of potassium citrate in GHS rats [44], while thiazides caused an even greater decrease in uCa [41] as well as improved bone mineral density (20) compared to our findings in the current study [31]. The low Na diet also induced a reduction of uP, uCl and uK but no differences in urine oxalate, citrate, ammonium, magnesium, pH or volume. The low Na diet-induced reductions in urine Ca and P excretion were insufficient to alter supersaturation with respect to CaP or CaOx, possibly due to the lower ionic strength of the urine leading to greater activity coefficients and therefore chemical activity of the critical ions. However, the GHS rats fed the low Na diet had a marked and unequivocal reduction in kidney stone formation. Why stone formation fell with no change in supersaturation is not clear from this study. The urine supersaturation with respect to the CaP solid phase, the type of stones formed by the GHS rats on this diet [36], exceeded 4.5 in both groups indicating that there was a marked driving force for CaP stone formation. It may be that alterations in dietary Na intake influence inhibitors and/or promoters of stone formation or crystal-urothelial interactions. Further studies will be necessary to address this possibility. It has been suggested that, at least in humans, supersaturation may not always be predictive of subsequent stone formation[52]; however, supersaturation appears to be the best measure, available clinically, to predict stone recurrence[1]. It is possible that using a different program to estimate urine supersaturation such as JESS[53] or LithoRisk[54] might bring better agreement between urine supersaturation and stone formation. However, we have shown that EQUIL2 is an excellent predictor of calcium phosphate stone formation in GHS rats[37] and a recent publication demonstrated that a fall in supersaturation calculated only by EQUIL2, and not JESS or LithoRisk, was significantly associated with a lower risk of stone recurrence in humans[55].
The GHS rats fed a low Na diet had a small, but significant, increase in serum Ca, perhaps due to increasing passive proximal tubule Ca reabsorption which follows Na and water reabsorption in this segment[18,19]. Additionally in the thick ascending limb of Henles’ loop, increased Na reabsorption through the Na/K/2Cl transporter leads to increased K back diffusion into the lumen leading to an increased luminal positive charge which drives Ca reabsorption through paracellular pathways[18]. In spite of the increase in serum Ca there were no changes in serum PTH or FGF23. Two markers of bone formation were studied, serum OC and P1NP. While there was no change in OC with low Na diet, P1NP increased, perhaps indicating increased bone formation in this group.
There were small but significant changes in bone quality in rats fed a low Na diet, including a significant reduction in femoral cortical vBMD and a reduction in anterior-posterior diameter in the low, compared to the normal Na, diet. GHS rats fed a low Na diet had a reduction in cortical stiffness which indicates that their bone is more ductile and resistant to fracture. However there was no difference in ultimate load, energy to fail or Young’s modulus. As opposed to these changes in cortical mechanical properties, there were no significant differences in these parameters in the L6 vertebrae. Static and dynamic histomorphometry of tibiae of the GHS rats fed a low Na diet demonstrated decreased trabecular separation as well as a trend toward increased percent bone surface. There was no difference between the two groups for osteoid or bone formation rate; however, there was a trend towards a lower percentage of osteoclasts per osteoclast surface in the rats fed a low Na diet which would result in decreased bone resorption.
Bone is a large reservoir for body Na [56]. Our results indicate that reducing dietary Na results in more ductile bone with lower cortical vBMD and decreased trabecular separation. However the changes in the bone parameters were modest and suggest that while the low Na diet reduces urine Ca excretion, which may improve bone quality and quantity, the reduction in dietary Na may have negative effects on bone density and quality that offset positive effects of this diet in reducing urine Ca excretion. However, the low Na diet did not appear to be detrimental to bone. As there were several trends toward improved trabecular bone with a low Na diet, it is possible that analysis of larger sample size over a longer time will help define more accurate comparisons.
In summary, using the GHS rats we found that a decrease in dietary Na resulted in a significant decrease in urine Ca excretion with no change in urine supersaturation with respect to the Ca containing solid phases of kidney stones. Even so, there was a marked reduction in kidney stone formation in the GHS rats fed the low Na diet. This low Na diet did not appear to adversely alter the bone and may improve it. If these results obtained in a model of hypercalciuric nephrolithiasis can be replicated in humans, it suggests that a low Na diet may be beneficial in preventing recurrent stone formation even if urine supersaturation is not altered.
Acknowledgments
FUNDING SOURCE
This work was supported by Grant RO1 DK075462 from the National Institutes of Health.
Footnotes
DISCLOSURE STATEMENT
The authors have no competing financial interests and nothing to disclose.
STATEMENT OF ETHICS
All animal experiments conform to internationally accepted standards and have been approved by the appropriate institutional review body at the University of Rochester.
REFERENCES
- 1.Bushinsky DA, Coe FL, Moe OW: Nephrolithiasis; in Brenner BM (ed): The Kidney. Philadelphia, W.B. Saunders, 2012, vol 2, pp 1455–1507. [Google Scholar]
- 2.Bose A, Monk RD, Bushinsky DA: Kidney stones; in Melmed S, Polonsky KS, Larsen PR, Kronenberg HM (eds): Williams Textbook of Endocrinology. Philadelphia, Elsevier, 2016, pp 1365–1384. [Google Scholar]
- 3.Stechman MJ, Loh NY, Thakker RV: Genetics of hypercalciuric nephrolithiasis: renal stone disease. Ann NY Acad Sci 2007;1116:461–484. [DOI] [PubMed] [Google Scholar]
- 4.Moe OW, Bushinsky DA: Genetic Hypercalciuria: A Major Risk Factor in Kidney Stones; in Thakker RV, Whyte MP, Eisman JA, Igarashi T (eds): Genetics of Bone Biology and Skeletal Disease. London, UK, Elsevier, 2013, pp 585–604. [Google Scholar]
- 5.Monico CG, Milliner DS: Genetic determinants of urolithiasis. Nat Rev Nephrol 2012;8:151–162. [DOI] [PMC free article] [PubMed] [Google Scholar]
- 6.Pearle MS, Calhoun EA, Curhan GC: Urologic diseases in America Project: Urolithiasis. J Urol 2005;173:848–857. [DOI] [PubMed] [Google Scholar]
- 7.Moe OW, Pearle MS, Sakhaee K: Pharmacotherapy of urolithiasis: evidence from clinical trials. Kidney Intl 2011;79:385–392. [DOI] [PMC free article] [PubMed] [Google Scholar]
- 8.Park S, Pearle MS: Pathophysiology and management of calcium stones. Urol Clin North Am 2007;34:323–334. [DOI] [PubMed] [Google Scholar]
- 9.Sakhaee K, Nicar M, Hill K, Pak CY: Contrasting effects of potassium citrate and sodium citrate therapies on urinary chemistries and crystallization of stone-forming salts. Kidney Intl 1983;24:348–352. [DOI] [PubMed] [Google Scholar]
- 10.Pearle MS, Goldfarb DS, Assimos DG, Curhan G, Denu-Ciocca CJ, Matlaga BR, Monga M, Penniston KL, Preminger GM, Turk TMT, White JR: Medical management of kidney stones: AUA guideline. J Urol 2014;192(2)::316–324. [DOI] [PubMed] [Google Scholar]
- 11.Pak CYC: Medical Management of Urinary Stone Disease. Nephron Clinical Practice 2004;98:c49–c53. [DOI] [PubMed] [Google Scholar]
- 12.Taylor EN, Fung TT, Curhan GC: DASH-style diet associates with reduced risk for kidney stones. J Amer Soc Neph 2009;20:2253–2259. [DOI] [PMC free article] [PubMed] [Google Scholar]
- 13.Yun SJ, Ha Y-S, Kim WT, Kim Y-J, Lee S-C, Kim W-J: Sodium restriction as initial conservative treatment for urinary stone disease. Jour Urol 2010;184:1372–1376. [DOI] [PubMed] [Google Scholar]
- 14.Coe FL, Evan A, Worcester E: Pathophysiology-based treatment of idiopathic calcium kidney stones. Clin J Amer Soc Neph 2011;6:2083–2092. [DOI] [PMC free article] [PubMed] [Google Scholar]
- 15.Escribano J, Balaguer A, Roqué i Figuls M, Feliu A, N F: Dietary interventions for preventing complications in idiopathic hypercalciuria. Cochrane Database Syst Rev 2014;DOI: 10.1002/14651858.CD006022.pub4 [DOI] [PMC free article] [PubMed] [Google Scholar]
- 16.Vezzoli G, Dogliotti E, Terranegra A, Arcidiacono T, Macrina L, Tavecchia M, Pivari F, Mingione A, Brasacchio C, Nouvenne A, Meschi T, Cusi D, Spotti D, Montanari E, Soldati L: Dietary style and acid load in an Italian population of calcium kidney stone formers. Nutr Metab Cardio Dis 2015;25:588–593. [DOI] [PubMed] [Google Scholar]
- 17.Walser M: Calcium clearance as a function of sodium clearance in the dog. Am J Physiol 1961;200:1099–1104. [DOI] [PubMed] [Google Scholar]
- 18.Friedman PA: Codependence of renal calcium and sodium transport. Annu Rev Physiol 1998;60:179–197. [DOI] [PubMed] [Google Scholar]
- 19.Bindels RJ, Hoenderop JG, Biber J: Transport of calcium, magnesium, and phosphate; in Taal MW, Chertow GM, Marsden PA, Skorecki K, Yu ASL, Brenner BM (eds): The Kidney. Philadelphia, Elsevier, 2012, vol 1, pp 226–251. [Google Scholar]
- 20.Curhan GC, Willett WC, Speizer FE, Spiegelman D, Stampfer MJ: Comparison of dietary calcium with supplemental calcium and other nutrients as factors affecting the risk for kidney stones in women. Ann Int Med 1997;126:497–504. [DOI] [PubMed] [Google Scholar]
- 21.Borghi L, Schianchi T, Meschi T, Guerra A, Allegri F, Maggiore U, Novarini A: Comparison of two diets for the prevention of recurrent stones in idiopathic hypercalciuria. N Eng J Med 2002;346:77–84. [DOI] [PubMed] [Google Scholar]
- 22.Martini LA, Cuppari L, Colugnati F, Sigulem D, Szejnfeld V, Schor N, Heilberg I: High sodium chloride intake is associated with low bone density in calcium stone-forming patients. Clin Neph 2000;54:85–93. [PubMed] [Google Scholar]
- 23.Ticinesi A, Nouvenne A, Maalouf NM, Borghi L, Meschi T: Salt and nephrolithiasis. Neph Dial Transpl 2016;31:39–45. [DOI] [PubMed] [Google Scholar]
- 24.Frick KK, Krieger NS, Bushinsky DA: Modeling hypercalciuria in the genetic hypercalciuric stone-forming rat. Curr Opin Neph Hyperten 2015;24:336–344. [DOI] [PMC free article] [PubMed] [Google Scholar]
- 25.Bushinsky DA, Favus MJ: Mechanism of hypercalciuria in genetic hypercalciuric rats: inherited defect in intestinal calcium transport. J Clin Invest 1988;82:1585–1591. [DOI] [PMC free article] [PubMed] [Google Scholar]
- 26.Li XQ, Tembe V, Horwitz GM, Bushinsky DA, Favus MJ: Increased intestinal vitamin D receptor in genetic hypercalciuric rats. A cause of intestinal calcium hyperabsorption. J Clin Invest 1993;91:661–667. [DOI] [PMC free article] [PubMed] [Google Scholar]
- 27.Krieger NS, Stathopoulos VM, Bushinsky DA: Increased sensitivity to 1,25(OH)2D3 in bone from genetic hypercalciuric rats. Am J Physiol (Cell Physiol) 1996;271:C130–C135. [DOI] [PubMed] [Google Scholar]
- 28.Tsuruoka S, Bushinsky DA, Schwartz GJ: Defective renal calcium reabsorption in genetic hypercalciuric rats. Kidney Intl 1997;51:1540–1547. [DOI] [PubMed] [Google Scholar]
- 29.Kim M, Sessler NE, Tembe V, Favus MJ, Bushinsky DA: Response of genetic hypercalciuric rats to a low calcium diet. Kidney Intl 1993;43:189–196. [DOI] [PubMed] [Google Scholar]
- 30.Yao J, Kathpalia P, Bushinsky DA, Favus MJ: Hyperresponsiveness of vitamin D receptor gene expression to 1,25-dihydroxyvitamin D3: A new characteristic of genetic hypercalciuric stone-forming rats. J Clin Invest 1998;101:2223–2232. [DOI] [PMC free article] [PubMed] [Google Scholar]
- 31.Bushinsky DA, Willett T, Asplin JR, Culbertson C, Che SPY, Grynpas M: Chlorthalidone improves vertebral bone quality in genetic hypercalciuric stone-forming rats. J Bone Min Res 2011;26:1904–1912. [DOI] [PMC free article] [PubMed] [Google Scholar]
- 32.Grynpas M, Waldman S, Holmyard D, Bushinsky DA: Genetic hypercalciuric stone-forming rats have a primary decrease in BMD and strength. J Bone Min Res 2009;24:1420–1426. [DOI] [PMC free article] [PubMed] [Google Scholar]
- 33.Hoopes RR Jr., Middleton FA, Sen S, Hueber PA, Reid R, Bushinsky DA, Scheinman SJ: Isolation and confirmation of a calcium excretion quantitative trait locus on chromosome 1 in genetic hypercalciuric stone-forming congenic rats. J Amer Soc Neph 2006;17:1292–1304. [DOI] [PubMed] [Google Scholar]
- 34.Bushinsky DA, Grynpas MD, Nilsson EL, Nakagawa Y, Coe FL: Stone formation in genetic hypercalciuric rats. Kidney Intl 1995;48:1705–1713. [DOI] [PubMed] [Google Scholar]
- 35.Bushinsky DA, Kim M, Sessler NE, Nakagawa Y, Coe FL: Increased urinary saturation and kidney calcium content in genetic hypercalciuric rats. Kidney Intl 1994;45:58–65. [DOI] [PubMed] [Google Scholar]
- 36.Asplin JR, Bushinsky DA, Singharetnam W, Riordon D, Parks JH, Coe FL: Relationship between supersaturation and crystal inhibition in hypercalciuric rats. Kidney Intl 1997;51:640–645. [DOI] [PubMed] [Google Scholar]
- 37.Bushinsky DA, Parker WR, Asplin JR: Calcium phosphate supersaturation regulates stone formation in genetic hypercalciuric stone-forming rats. Kidney Intl 2000;57:550–560. [DOI] [PubMed] [Google Scholar]
- 38.Bushinsky DA, Grynpas MD, Asplin JR: Effect of acidosis on urine supersaturation and stone formation in genetic hypercalciuric stone forming rats. Kidney Intl 2001;59:1415–1423. [DOI] [PubMed] [Google Scholar]
- 39.Bushinsky DA, Asplin JR, Grynpas MD, Evan AP, Parker WR, Alexander KM, Coe FL: Calcium oxalate stone formation in genetic hypercalciuric stone-forming rats. Kidney Intl 2002;61:975–987. [DOI] [PubMed] [Google Scholar]
- 40.Evan AP, Bledsoe SB, Smith SB, Bushinsky DA: Calcium oxalate crystal localization and osteopontin immunostaining in genetic hypercalciuric stone-forming rats. Kidney Intl 2004;65:154–161. [DOI] [PubMed] [Google Scholar]
- 41.Bushinsky DA, Asplin JR: Thiazides reduce brushite, but not calcium oxalate, supersaturation and stone formation in genetic hypercalciuric stone-forming rats. J Amer Soc Neph 2005;16:417–424. [DOI] [PubMed] [Google Scholar]
- 42.Asplin JR, Donahue SE, Lindeman C, Michalenka A, Strutz KL, Bushinsky DA: Thiosulfate reduces calcium phosphate nephrolithiasis. J Amer Soc Neph 2009;20:1246–1253. [DOI] [PMC free article] [PubMed] [Google Scholar]
- 43.Frick KK, Asplin JR, Favus MJ, Culbertson C, Krieger NS, Bushinsky DA: Increased biological response to 1,25(OH)2D3 in genetic hypercalciuric stone-forming rats. Am J Physiol (Renal Physiol) 2013;304:F718–726. [DOI] [PMC free article] [PubMed] [Google Scholar]
- 44.Krieger NS, Asplin JR, Frick KK, Granja I, Culbertson CD, Ng A, Grynpas MD, Bushinsky DA: Effect of potassium citrate on calcium phosphate stones in a model of hypercalciuria. J Amer Soc Neph 2015;26:3001–3008. [DOI] [PMC free article] [PubMed] [Google Scholar]
- 45.Werness PG, Brown CM, Smith LH, Finlayson B: Equil2: A BASIC computer program for the calculation of urinary saturation. J Urol 1985;134:1242–1244. [DOI] [PubMed] [Google Scholar]
- 46.Bushinsky DA, Bashir MA, Riordon DR, Nakagawa Y, Coe FL, Grynpas MD: Increased dietary oxalate does not increase urinary calcium oxalate saturation in hypercalciuric rats. Kidney Intl 1999;55:602–612. [DOI] [PubMed] [Google Scholar]
- 47.Bushinsky DA, Neumann KJ, Asplin J, Krieger NS: Alendronate decreases urine calcium and supersaturation in genetic hypercalciuric rats. Kidney Intl 1999;55:234–243. [DOI] [PubMed] [Google Scholar]
- 48.Ryan L, Ing S: Idiopathic Hypercalciuria and Bone Health. Curr Osteoporos Rep 2012;10:286–295. [DOI] [PubMed] [Google Scholar]
- 49.Chan AY, Poon P, Chan EL, Fung SL, Swaminathan R: The effect of high sodium intake on bone mineral content in rats fed a normal calcium or a low calcium diet. Osteoporosis Intl : 1993;3:341–344. [DOI] [PubMed] [Google Scholar]
- 50.He FJ, MacGregor GA: A comprehensive review on salt and health and current experience of worldwide salt reduction programmes. J Hum Hypertens 2008;23:363–384. [DOI] [PubMed] [Google Scholar]
- 51.Heilberg IP, Goldfarb DS: Optimum nutrition for kidney stone disease. Adv chron kid dis 2013;20:165–174. [DOI] [PubMed] [Google Scholar]
- 52.Rodgers AL: Urinary saturation: casual or causal risk factor in urolithiasis? BJU Intl 2014;114:104–110. [DOI] [PubMed] [Google Scholar]
- 53.Rodgers A, Allie-Hamdulay S, Jackson G: Therapeutic action of citrate in urolithiasis explained by chemical speciation: increase in pH is the determinant factor. Neph Dial Transpl 2006;21:361–369. [DOI] [PubMed] [Google Scholar]
- 54.Marangella M, Petrarulo M, Daniele PG, Sammartano S: LithoRisk: a software for calculating and visualising nephrolithiasis risk profiles. G Ital Nefrol 2002;19:693–698. [PubMed] [Google Scholar]
- 55.Ferraro PM, Ticinesi A, Meschi T, Rodgers A, Di Maio F, Fulignati P, Borghi L, Gambaro G: Short-term changes in urinary relative supersaturation predict recurrence of kidney stones: A tool to guide preventive measures in urolithiasis. J Urol 2018;200:1082–1087. [DOI] [PubMed] [Google Scholar]
- 56.Bushinsky DA, Chabala JM, Gavrilov KL, Levi-Setti R: Effects of in vivo metabolic acidosis on midcortical bone ion composition. Am J Physiol(Renal Physiol46) 1999;277:F813–F819. [DOI] [PubMed] [Google Scholar]


