Abstract
Intracellular tau accumulation forming neurofibrillary tangles is hallmark pathology of Alzheimer's disease (AD), but how tau accumulation induces synapse impairment is elusive. By overexpressing human full‐length wild‐type tau (termed hTau) to mimic tau abnormality as seen in the brain of sporadic AD patients, we find that hTau accumulation activates JAK2 to phosphorylate STAT1 (signal transducer and activator of transcription 1) at Tyr701 leading to STAT1 dimerization, nuclear translocation, and its activation. STAT1 activation suppresses expression of N‐methyl‐D‐aspartate receptors (NMDARs) through direct binding to the specific GAS element of GluN1, GluN2A, and GluN2B promoters, while knockdown of STAT1 by AAV‐Cre in STAT1flox/flox mice or expressing dominant negative Y701F‐STAT1 efficiently rescues hTau‐induced suppression of NMDAR expression with amelioration of synaptic functions and memory performance. These findings indicate that hTau accumulation impairs synaptic plasticity through JAK2/STAT1‐induced suppression of NMDAR expression, revealing a novel mechanism for hTau‐associated synapse and memory deficits.
Keywords: memory, N‐methyl‐D‐aspartate receptors, STAT1, synapse, Tau
Subject Categories: Neuroscience; Post-translational Modifications, Proteolysis & Proteomics; Signal Transduction
Introduction
Intracellular accumulation of tau forming neurofibrillary tangles is one of the two hallmarks in Alzheimer's disease (AD), the most common neurodegenerative disorder in the elderly 1, 2. Abnormal tau accumulation is positively correlated with neurodegeneration and memory deterioration 3, 4, and the total tau level in cerebrospinal fluids has an inverse correlation with memory score in AD patients 5, 6. The axonal tau pathology in hippocampus is critical for the clinical presentation of dementia and may constitute an anatomical substrate of clinically verifiable memory dysfunctions 3. The human tau transgenic mice recapitulate features of human tauopathies and cognitive deficits 7, 8. Tau is essential for β‐amyloid‐induced synaptic toxicity 9, while tau knockout attenuates neuronal dysfunction and prevents behavioral deficits in transgenic mice expressing human amyloid precursor protein (APP) without altering high Aβ level in the brain 10, 11. These clinical evidence and laboratory evidence strongly suggest that tau abnormality plays a pivotal role in AD‐like synapse and memory impairments.
As a cytoskeleton protein, the originally characterized function of tau is to promote microtubule assembly and maintain the stability of microtubules, which is essential for axonal transport 12, 13. Tau hyperphosphorylation dissociates microtubules and thus disrupts axonal transport 14, 15, 16, 17, 18. Recent studies suggest that tau phosphorylation is actively involved in regulating cell viability 19, 20, 21. Tau proteins are largely located in the neuronal axons in physiological conditions 22; it is also reported that the postsynaptic location of Fyn is tau‐dependent, suggesting the dendritic distribution of tau 23. Upon hyperphosphorylation or cleavage, tau accumulated in dendritic spines where it interacts with the postsynaptic proteins and thus induces synaptic dysfunction 24, 25. Intracellular accumulation of tau causes mitochondrial dysfunction and mitophagy deficits by increasing mitochondrial membrane potential 26, 27. Tau accumulation also disrupts intracellular calcium signaling leading to activation of calcineurin and CREB dephosphorylation in primary neuron cultures 4. These hypothesis‐driven studies partially disclose the mechanisms underlying the toxic effects of tau. However, the molecular mechanism underlying hTau‐induced synapse impairment is not fully understood.
In the present study, we employed a large‐scale screening approach to explore novel molecular mechanisms underlying tau toxicities. By using whole‐genome mRNA chip and the transcription factor activation profiling array, we found that overexpressing hTau upregulated JAK2/STAT1 signaling, and simultaneous downregulating STAT1 by hippocampal infusion of AAV‐Cre in STAT1flox/flox mice or by overexpressing dominant negative STAT1 mutant mitigates the hTau‐induced synaptic and memory deficits. We also found that STAT1 can directly bind to the specific GAS elements in GluN1, GluN2A, or GluN2B promoter and thus suppress expression of the NMDARs, which reveals a novel mechanism underlying hTau‐induced synapse impairment and memory deficit.
Results
Intracellular hTau accumulation induces activation of STAT1
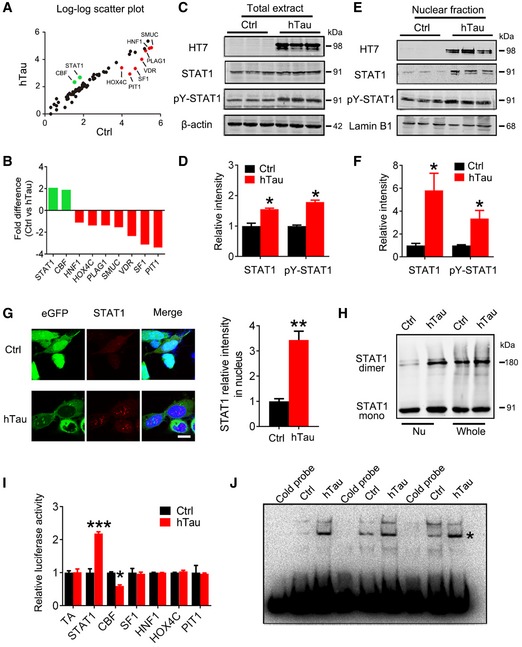
During our studies on tau, we often observe that overexpressing hTau proteins result in changes in other proteins. We thus speculate that hTau accumulation may influence gene expression. To test this, we first conducted a whole‐genome mRNA chip screening in hTau‐overexpressed HEK293 cells. Indeed, we detected significant alterations in the level of 520 mRNA molecules (235 increased and 285 decreased) in hTau‐expressing cells compared with those expressing the empty vector (Appendix Fig S1), suggesting that intracellular hTau accumulation indeed influences gene transcription. To confirm this point, we measured activity of the transcription factors in nuclear fraction by transcription factor activation profiling array (Appendix Tables S1 and S2), in which the activity of 96 transcription factors was monitored using a collection of biotin‐labeled DNA probes based on the consensus sequences of individual transcription factor DNA‐binding sites (Signosis). The results showed that the activity of STAT1 and CBF was significantly increased, while the activity of HNF1, HOX4C, PLAG1, SMUC, VDR, SF‐1, and PIT1 decreased remarkably in cells overexpressing hTau (Fig 1A and B). In protein level measured by Western blotting, only elevation of STAT1 but not CBF was shown in total extracts and the nuclear fraction (Appendix Fig S2).
Figure 1. Overexpression of hTau activates STAT1 with an increased nuclear translocation in vitro .
-
A, BOverexpression of wild‐type full‐length human tau (hTau, also termed tau441 or tau40 or tau2N4R) induced significant alterations of nine transcription factors screened by using Transcription Factor Activation Profiling Plate Array II, in which 96 transcription factors (Appendix Tables S1 and S2) were monitored. The empty vector was transfected as a control (Ctrl).
-
C–FExpression of hTau (probed by HT7) increased total and the phosphorylated STAT1 at Tyr701 (pY‐STAT1) in whole‐cell extracts (C, D) and the nuclear fraction (E, F) measured by Western blotting (n = 4).
-
GThe representative immunofluorescent images and quantitative analysis show significantly increased STAT1 signal in the nuclear fraction of HEK293 cells with overexpression of hTau compared with the empty vector control (eGFP) (n = 5). Scale bar, 10 μm.
-
HOverexpression of hTau most significantly increased STAT1 monomer and dimer formation in nuclear fraction (Nu) measured by Western blotting.
-
IOverexpression of hTau increased STAT1 activity in HEK293 cells detected by luciferase assay (n = 4).
-
JOverexpression of hTau increased STAT1‐DNA‐binding activity in HEK293 cells measured by electrophoretic mobility shift assay (EMSA). * indicates STAT1/DNA complex.
Herein, we focused on STAT1 which has been implicated in cognitive functions 28, 29. We demonstrated that overexpressing hTau remarkably increased the activation‐dependent phosphorylation of STAT1 at Tyr701 (pY‐STAT1) in both cell lysates (Fig 1C and D) and the nuclear fraction (Fig 1E and F) with an enhanced nuclear translocation (Fig 1G) and dimerization (Fig 1H) of STAT1 measured by Western blotting and immunofluorescence imaging. Activation of STAT1 by overexpressing hTau was also detected by TF luciferase assay (Fig 1I). By EMSA using an oligonucleotide probe containing STAT1 binding site, we also found that hTau accumulation increased binding of STAT1 to DNA and this association was disrupted by using cold probe (Fig 1J).
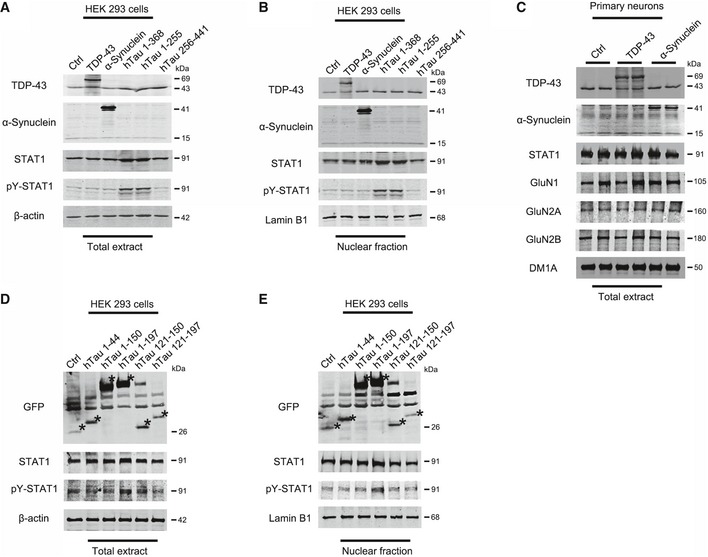
To verify the specificity of STAT1 activation, we studied the effects of TDP‐43 and α‐synuclein on STAT1 in HEK293 cells. The results showed that overexpression of TDP‐43 or α‐synuclein did not significantly alter the levels of STAT1 and p‐STAT1 (Fig EV1A and B), indicating that STAT1 activation may be specific to tau. To further identify the minimal fragments of hTau on STAT1 activation, we constructed truncated tau plasmids covering different length of N‐terminal and C‐terminal tau fragments. After expressed these tau fragments in HEK293 cells, we observed that the N‐terminal (tau1‐368, tau1‐255, tau1‐197) but not C‐terminal (tau256‐441) tau could upregulate STAT1; and the currently identified minimal fragment able to induce STAT1 activation was tau1‐197 while the shorter tau fragments including tau1‐44, tau1‐150, tau121‐150, and tau121‐197 had no stimulating effect on STAT1 (Fig EV1A, B, D and E). These data suggest that both full‐length and the N‐terminal tau fragments can active STAT1.
Figure EV1. Overexpressing N‐terminal tau fragments not TDP‐43 or α‐synuclein activate STAT1.
-
A, BPlasmids of TDP‐43, α‐synuclein, or hTau fragments or the vector control were transfected into HEK293 cells for 48 h, and then, the protein levels of STAT1 and pY‐STAT1 were detected by Western blotting in the total extracts (A) and the nuclear fraction (B).
-
CAdeno‐associated virus (AAV)‐eGFP‐TDP43 or AAV‐eGFP‐α‐synuclein or the vector control was transfected into the primary hippocampal neurons (6 div) and the neurons were cultured for another 48 h, and then, the protein levels of NMDARs were detected by Western blotting.
-
D, EThe subdivided hTau fragments were transfected into the HEK293 cells for 48 h, and then, the protein levels of STAT1 and pY‐STAT1 were detected by Western blotting in total extracts (D) and the nuclear fraction (E). Asterisks indicated the bands which matched with fragments’ predicted molecular weight.
Source data are available online for this figure.
These in vitro data indicate that intracellular hTau accumulation induces STAT1 activation.
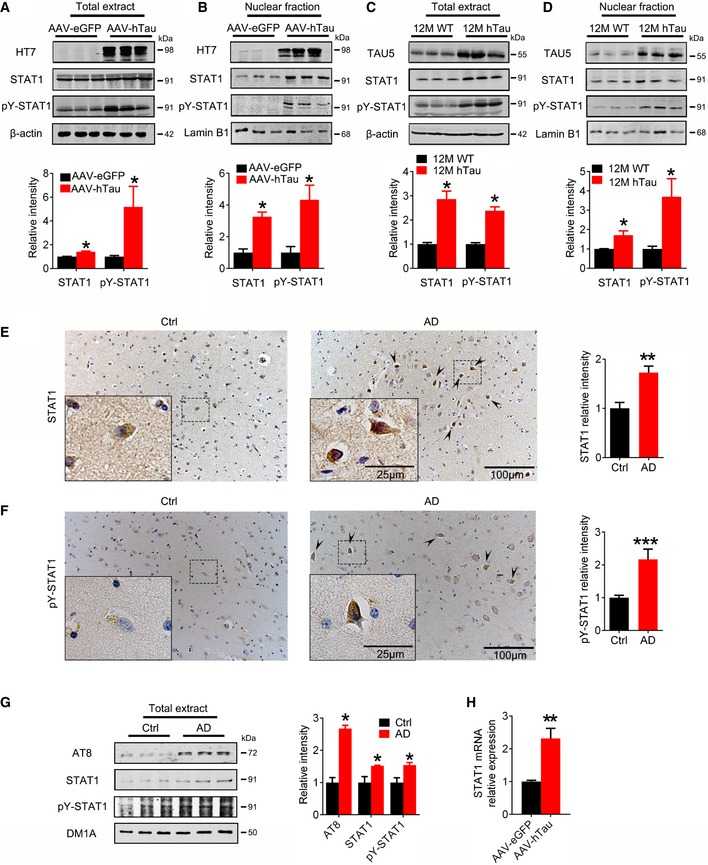
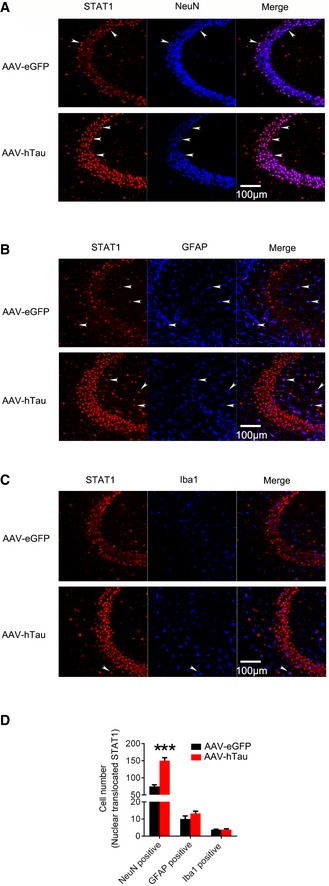
To test the in vivo effects of hTau accumulation on STAT1, we first injected stereotaxically AAV‐hTau into the mouse hippocampi and measured the alterations of STAT1 and pY‐STAT1 after 1 month. Expression of hTau was confirmed by Western blotting (Fig 2A), and fluorescent imaging and immunohistochemistry (Fig EV2A). Accumulation of misfolded tau was shown by Thioflavin‐S and Bielschowsky silver staining (Fig EV2B). Overexpression of hTau significantly increased total STAT1 and pY‐STAT1 in hippocampal extracts and the nuclear fraction (Fig 2A and B) without changing VDR, PLAG1, and SMUC (Fig EV2C), suggesting a relatively specific effect of hTau on STAT1. Infection of control AAV‐eGFP did not activate STAT1 (Fig EV2D). By co‐staining of nuclear translocation of STAT1 with NeuN, IBA1, and GFAP, we found that the neuronal staining of STAT1 was most significant (Fig EV3). Elevation of STAT1 and pY‐STAT1 was also detected in the hippocampi of 9‐month‐ and 12‐month‐old hTau transgenic mice (Fig 2C and D and Appendix Fig S3A). By transfecting Syn‐hTau‐AAV into the hippocampus, we found that the neuron‐specific overexpression of hTau also significantly increased total STAT1 and pY‐STAT1 in hippocampal extracts and the nuclear fraction (Appendix Fig S4A and B). In the cortex of AD patients, both total and pY‐STAT1 were also significantly increased (Fig 2E–G). Further, STAT1 mRNA also increased significantly in hTau‐expressed tissues (Fig 2H). These data provide the in vivo and human evidence for the role of tau accumulation in activating STAT1.
Figure 2. Overexpression of hTau upregulates phosphorylated STAT1 in vivo .
-
A, BAAV‐hTau‐eGFP (AAV‐hTau) or the empty vector AAV‐eGFP (1.13 × 10¹³ v.g./ml) was stereotaxically injected into hippocampal CA3 of 3‐month‐old C57 mice. After 1 month, the increased levels of STAT1 and pY‐STAT1 in hippocampal total extracts and the nuclear fraction were detected in hTau group by Western blotting (n = 6, Mann–Whitney test).
-
C, DThe increased STAT1 and pY‐STAT1 in hippocampal total extracts and the nuclear fraction of 12‐month‐old hTau transgenic mice were measured by Western blotting (n = 4, Mann–Whitney test).
-
E, FThe representative images of STAT1 and pY‐STAT1 in the brain of AD patients probed by co‐immunohistochemical staining and quantitative analysis (hematoxylin stains nuclei, purple; DAB stains the target proteins, brown; n = 5–6 slices). Arrowheads indicated typical nuclear staining of STAT1/pY‐STAT1.
-
GThe increased AT8 (pS202/pT205), STAT1, and pY‐STAT1 in cortex total extracts of AD patients were measured by Western blotting (n = 3, Student's t‐test).
-
HSTAT1 mRNA was analyzed by qRT‐PCR in AAV‐hTau‐ or AAV‐eGFP infected hippocampal tissues (n = 6, Mann–Whitney test).
Figure EV2. Overexpressing hTau induces tau aggregation and does not affect protein level of VDR, PLAG1, and SMUC.
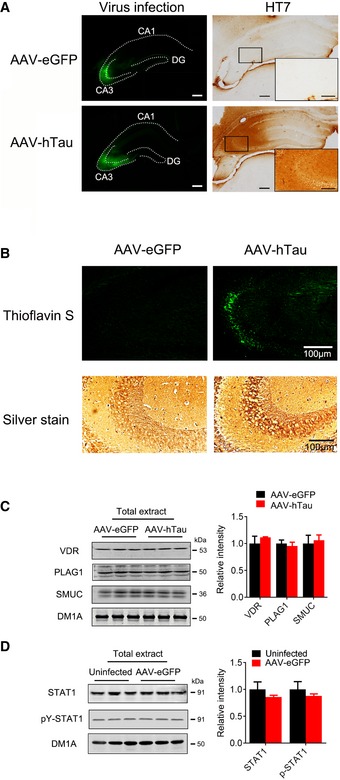
- Adeno‐associated virus (AAV)‐eGFP expressing wild‐type full‐length human tau (hTau) or the empty AAV vector (eGFP) (1.13 × 10¹³ v.g./ml) was stereotaxically injected into the hippocampal CA3 of 3‐month‐old C57 mice. One month later, the infected virus was shown by direct fluorescence (left panels) and immunohistochemical staining of HT7 (specifically reacts with human tau, right panel), respectively. Scale bar, 200 μm; 100 μm (enlarged picture).
- The representative images of Thioflavin S and Bielschowsky silver staining showed tau aggregation in the hippocampus of the virus‐injected mice.
- AAV‐hTau or the empty vector (eGFP) (1.13 × 10¹³ v.g./ml) was stereotaxically injected into the hippocampal CA3 of 3‐month‐old C57 mice. One month later, the protein levels of VDR (vitamin D receptor), PLAG1 (pleiomorphic adenoma gene 1), and SMUC (snail‐related transcription factor) were detected by Western blotting (n = 4).
- AAV‐eGFP (1.13 × 10¹³ v.g./ml) or PBS was stereotaxically injected into the hippocampal CA3 of 3‐month‐old C57 mice. PBS‐injected tissue was used as uninfected control. One month later, the protein levels of STAT1 and pY‐STAT1 were detected by Western blotting (n = 4).
Figure EV3. STAT1 is predominantly expressed in neurons and elevation of STAT1 by overexpressing hTau is mostly significant in neurons.
-
A–DAAV‐hTau‐eGFP (tau) or the empty vector AAV‐eGFP (eGFP) (1.13 × 10¹³ v.g./ml) was stereotaxically injected into hippocampal CA3 of 3‐month‐old C57 mice. After 1 month, the cell type of STAT1 staining was detected by co‐staining of STAT1 with NeuN (A), GFAP (B), or IBA1 (C) and cell number quantitative analysis (D). Arrowheads indicated typical co‐localization of nuclear‐translocated STAT1 with NeuN (A), GFAP (B) or IBA1 (C). ***P < 0.001 vs. eGFP. N = 4–5 each group.
Downregulating STAT1 rescues hTau‐induced memory and synaptic deficits
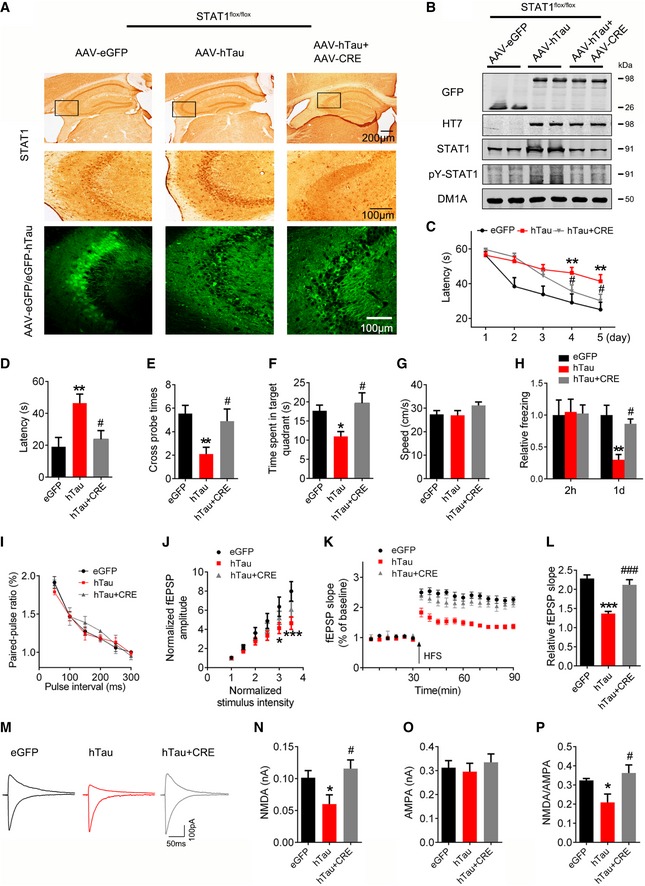
Previous studies show that accumulation of tau in hippocampal CA3 induces spatial learning and memory deficits in mice 3, 4. To investigate the role of STAT1 in hTau‐induced memory deficits, we co‐injected bilaterally AAV‐hTau and AAV‐Cre into the hippocampal CA3 of STAT1flox/flox mice. The efficiency of AAV‐Cre in downregulating STAT1 was confirmed by immunohistochemistry, immunofluorescence, and Western blotting (Fig 3A and B, Appendix Fig S5A). No significant difference in STAT1 was found between wild‐type and naïve STAT1flox/flox mice by expressing AAV‐eGFP, and infection of AAV‐CRE alone did not change the STAT1 and pY‐STAT1 levels in wild‐type mice (Appendix Fig S5B). By MWM test, we observed that STAT1 knockdown could efficiently rescue the hTau‐induced spatial learning impairments shown by the decreased escape latency at days 4 and 5 during the 5‐day training (Fig 3C). In memory test measured at day 6 by removing the escape platform, the mice with STAT1 knockdown showed less average latency to reach the previous target quadrant (Fig 3D), more frequent crosses in the platform area (Fig 3E) and more time stayed in the platform quadrant (Fig 3F) than the control mice. No significant difference in swimming speed was seen among the three groups (Fig 3G), which excluded motor deficits. By contextual fear conditioning test, we also observed that STAT1 knockdown improved long‐term memory shown by an increased freezing time during memory test in human hTau‐expressing mice (Fig 3H). These data demonstrate that downregulating STAT1 in hippocampus can efficiently rescue hTau‐induced learning and memory impairments.
Figure 3. Downregulating STAT1 ameliorates hTau‐induced cognitive and synaptic impairments.
-
A, BAAV‐Cre (5 × 10¹² v.g./ml) mixed with AAV‐hTau or AAV‐eGFP (1.13 × 10¹³ v.g./ml) was stereotaxically injected into the hippocampal CA3 of 3‐month‐old STAT1flox/flox mice. One month later, downregulation of STAT1 was confirmed by Western blotting and immunohistochemical staining.
-
CDownregulation of STAT1 ameliorated hTau‐induced spatial learning deficit shown by the decreased escape latency during 5 consecutive days training in Morris water maze (MWM) test (n = 9–11 for each group).
-
D–GDownregulation of STAT1 ameliorated hTau‐induced spatial memory deficit shown by the decreased latency to reach the platform quadrant (D), the increased crossing time in the platform site (E), and time spent in the target quadrant (F) measured at day 6 by removing the platform in MWM test; no motor dysfunction was seen (G) (n = 9–11 for each group).
-
HDownregulation of STAT1 ameliorated hTau‐induced contextual memory deficits measured at 24 h during contextual fear conditioning test (n = 8 each group).
-
I–LOne month after the virus infection, paired‐pulse ratio (PPR) was recorded in hippocampal CA3 of hTau or STAT1 knockdown mice (I). The I/O curve of fEPSP recorded on acute hippocampal slices (J). The slope of fEPSP after HFS recorded on hippocampal slices of hTau or STAT1 knockdown mice (K). LTP magnitude was calculated as the average (normalized to baseline) of the responses recorded 40–60 min after conditioning stimulation (L).
-
M–POne month after the virus infection, whole‐cell patch clamp was used to measure the function of NMDA (at +40 mV) and AMPA (at −70 mV) receptors on acute brain slices (400 μm). The insets show representative sample traces of EPSCs in virus‐infected neurons (M). The reduced NMDA and unchanged AMPA currents with a reduced NMDA/AMPA ratio were seen in hTau‐infected neurons, while knockdown of STAT1 restored the hTau‐induced NMDA currents (N–P). (n = 12 neurons from four animals for eGFP group; n = 11 neurons from four animals for hTau group; n = 13 neurons from four animals for hTau+CRE group).
Synaptic plasticity is the precondition of learning and memory; therefore, we studied how hTau accumulation or with simultaneous STAT1 knockdown affects synaptic functions on the acute brain slices. Using a paired‐pulse protocol to determine the paired‐pulse ratios (PPR) of the fEPSP at mossy fiber‐CA3 circuit, we did not find significant difference between AAV‐hTau‐ and AAV‐GFP‐injected mice (Fig 3I), indicating no significant presynaptic dysfunction. On the other hand, hTau but not STAT1 knockdown suppressed basal synaptic transmission as shown by input/output (I/O) curve (Fig 3J). The fEPSP slope was reduced in hTau‐expression slices compared with AAV‐GFP controls, and downregulating STAT1 substantially attenuated the hTau‐induced suppression of LTP (Fig 3K and L). These data indicate that hTau suppresses LTP by preferentially affecting postsynaptic machineries and knockdown of STAT1 can rescue the hTau‐induced suppression of synaptic transmission.
Using whole‐cell patch clamp recording, we measured NMDA and AMPA receptor‐mediated synaptic responses at DG‐CA3 synapses on acute hippocampal slices. AMPA receptor‐mediated responses had no change, while the NMDAR‐mediated responses were significantly decreased with a decreased ratio of NMDA/AMPA in hTau‐overexpressing mice, and downregulating STAT1 substantially attenuated the hTau‐induced suppression of NMDAR currents (Fig 3M–P). These data provide functional evidence supporting NMDAR impairment by hTau accumulation in CA3 neurons.
STAT1 suppresses NMDAR expression via binding to the specific domain of the promoter
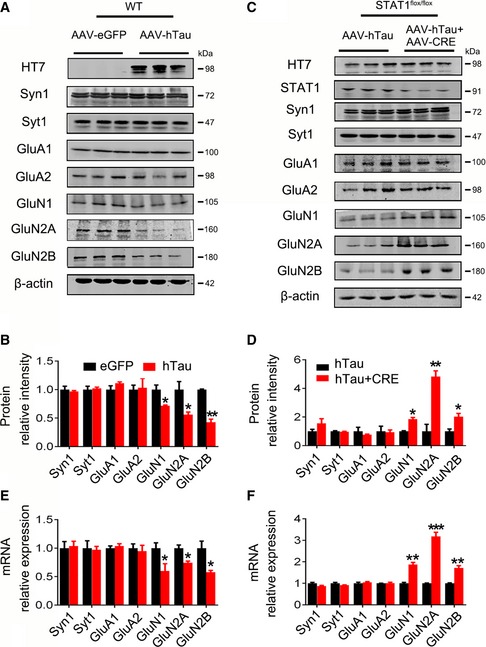
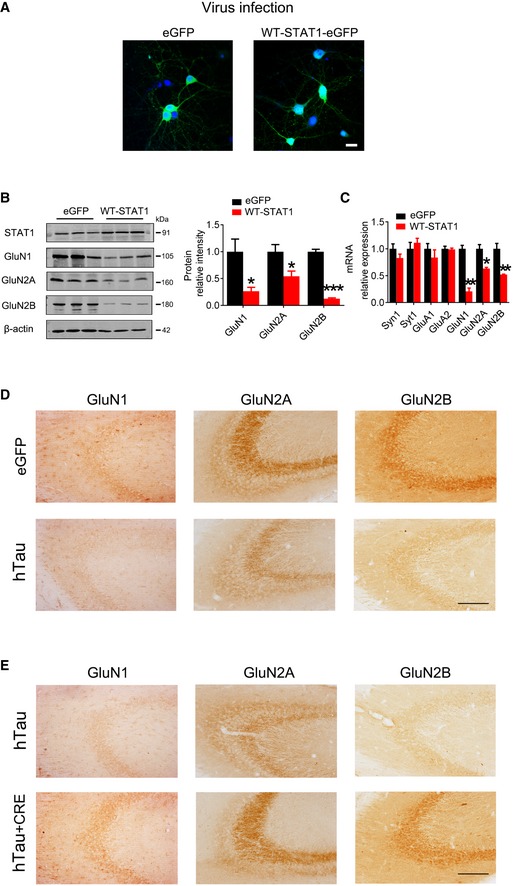
To explore how hTau‐induced STAT1 elevation affects synaptic function, we measured the level of synapse‐related proteins. The results showed that hTau accumulation in mice or overexpression of WT‐STAT1 in primary hippocampal neurons decreased the protein and mRNA levels of postsynaptic proteins N‐methyl‐D‐aspartate receptors (NMDARs) type 1 (GluN1), GluN2A, and GluN2B, while knockdown of STAT1 by AAV‐Cre substantially restored the protein and mRNA levels of the NMDARs measured, respectively, by Western blotting (Figs 4A–D and EV4A, B), RT–PCR (Figs 4E and F, and EV4C) and immunohistochemical staining (Fig EV4D and E). Quantitative analysis showed that simultaneous knockdown of STAT1 by AAV‐Cre restored GluN1 to 91%, GluN2A to 87%, and GluN2B to 73% when compared to the AAV‐eGFP control in hTau‐expressing mice (Appendix Fig S5D). Furthermore, overexpressing TDP‐43 and α‐synuclein, the widely recognized misfolding‐apt proteins, had no significant effect on NMDAR levels in primary neurons (Fig EV1C). On the other hand, overexpressing hTau with or without STAT1 knockdown did not significantly affect the protein levels of presynaptic proteins synapsin1 (Syn1) and synaptotagmin1 (Syt1), or postsynaptic proteins AMPA receptor subunits GluA1 and GluA2 (Fig 4A–F). These data suggest that STAT1 elevation mediates the hTau‐induced suppression of NMDAR expression. We also found that NMDAR protein levels decreased in the 9‐month‐ and 12‐month‐old hTau transgenic mice compared with the wild‐type littermates (Appendix Fig S3B). By transfecting Syn‐hTau‐AAV into the hippocampus, we found that the Syn‐specific neuronal overexpression of hTau also decreased NMDAR levels (Appendix Fig S4C), as seen in the pan‐neuronal overexpression of hTau (Fig 4A and B). Furthermore, knockdown of STAT1 by expressing AAV‐Cre in STAT1flox/flox mice without overexpressing hTau increased the protein levels of GluN1 to 149%, of GluN2A to 201%, and of GluN2B to 150% when compared with AAV‐eGFP controls (Appendix Fig S5C and D).
Figure 4. Overexpressing hTau suppresses expression of NMDARs by upregulating STAT1 in mice.
-
A, BOverexpression of AAV‐hTau decreased the protein levels of GluN1, GluN2A, and GluN2B detected by Western blotting in the hippocampal CA3 of C57 mice, compared with the AAV‐eGFP vector control.
-
C, DSimultaneous downregulation of STAT1 by infusing AAV‐Cre in hippocampal CA3 of STAT1flox/flox mice abolished the hTau‐induced inhibition in expression of NMDAR protein.
-
E, FOverexpression of AAV‐hTau or simultaneous downregulation of STAT1 changed the mRNA levels of GluN1, GluN2A, and GluN2B detected by qRT–PCR in the hippocampal CA3.
Figure EV4. STAT1 regulates the expression of NMDARs.
-
AAAV‐STAT1‐eGFP (WT‐STAT1) or the empty vector (AAV‐eGFP) (1 × 10¹² v.g./ml) was transfected into the primary hippocampal neurons (6 div) for 6 days, and expression of the virus was shown by direct fluorescence. Scale bar, 20 μm.
-
B, COverexpression of WT‐STAT1 selectively decreased protein and mRNA levels of GluN1, GluN2A, and GluN2B detected by Western blotting and qRT–PCR. *P < 0.05; **P < 0.01; ***P < 0.001 vs eGFP. Data were presented as mean ± SD (n = 4 from four independent experiments. Mann–Whitney test).
-
DAAV‐hTau‐eGFP (tau) or the empty vector AAV‐eGFP (eGFP) (1.13 × 10¹³ v.g./ml) was stereotaxically injected into hippocampal CA3 of 3‐month‐old C57 mice. After 1 month, the decreased GluN1, GluN2A, and GluN2B expression was detected by immunohistochemical staining. Scale bar, 100 μm.
-
EThe mixture of AAV‐hTau (1.13 × 10¹³ v.g./ml) and AAV‐Cre (5 × 10¹² v.g./ml) (1 μl AAV‐hTau plus 2 μl AAV‐Cre) was stereotaxically infused into the hippocampal CA3 of 3‐month‐old STAT1flox/flox mice. One month later, the restored GluN1, GluN2A, and GluN2B expression was detected by immunohistochemical staining. Scale bar, 100 μm.
Source data are available online for this figure.
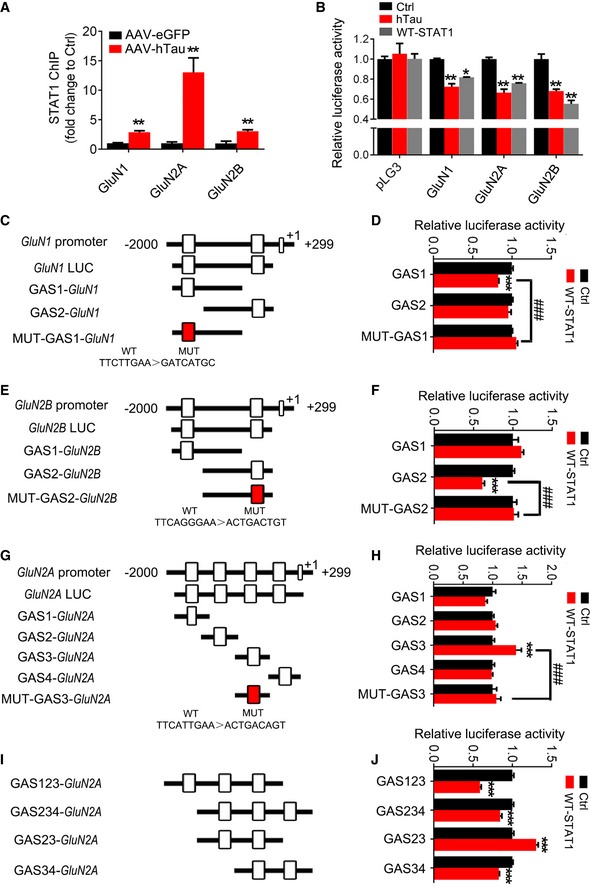
To explore how STAT1 suppresses the expression of NMDARs, we screened potential binding sites of STAT1 in the promoter regions of GluN1, GluN2A, and GluN2B in a transcription factor database 30. We found two conserved GAS promoter elements for STAT1 binding in the promoter regions of GluN1 and GluN2B, and four GAS promoter elements in GluN2A (Fig 5C, E and G). Further studies by chromatin immunoprecipitation (ChIP) assay demonstrated that overexpression of hTau in hippocampus remarkably increased binding of STAT1 to the promoters of GluN1, GluN2A, and GluN2B genes (Fig 5A), and upregulating wild‐type STAT1 inhibited transcription activity of the NMDARs (Fig 5B). These data together demonstrate that STAT1 activation can suppress NMDAR expression by direct binding to the promoter.
Figure 5. Overexpressing hTau increases binding of STAT1 to NMDAR promoters and inhibits the expression of NMDARs.
-
AOverexpression of AAV‐hTau increased binding of STAT1 to the promoter regions of GluN1, GluN2A, and GluN2B gene in hippocampal CA3 extracts measured by chromatin immunoprecipitation assay (ChIP) (n = 3 from three independent experiments).
-
BOverexpression of hTau or wild‐type STAT1 (WT‐STAT1) inhibits the transcription activity of NMDARs compared with the empty vector control (Ctrl) measured by luciferase activity assay in HEK293 cells (n = 3 from three independent experiments).
-
C–JDiagrams show the predicted GAS promoter elements (GASs) for STAT1 in the promoter (−2,000 to +299 bp) of GluN1 (C), GluN2B (E), and GluN2A (G, I). The GASs or the mutant (MUT) plasmids were co‐transfected, respectively, with WT‐STAT1 or its empty vector (Ctrl) into HEK293 cells for 24 h, and then, the luciferase activity was measured (right panels). N = 4 for each group.
To clarify the specific GAS promoter element of GluN1, GluN2A, or GluN2B genes for STAT1, we constructed luciferase reporters containing various GAS elements on the NMDAR promoters (Fig 5C–H). After co‐transfection of specific GAS element reporters with STAT1 into HEK293 cells, we found that co‐expression of STAT1 with GAS1 on GluN1 (Fig 5C and D) or GAS2 on GluN2B (Fig 5E and F) induced inhibition of luciferase activity, while the luciferase activity of GAS2 on GluN1 and GAS1 on GluN2B was not changed by STAT1 (Fig 5D and F). Furthermore, expression of mutant GAS1 on GluN1 or GAS2 on GluN2B abolished STAT1‐induced inhibition of luciferase activity (Fig 5D and F). These data suggest that STAT1 inhibits GluN1 and GluN2B expression by binding to GAS1 (GluN1) and GAS2 (GluN2B) elements, respectively.
In case of GluN2A that has four GAS elements, we found that co‐expression of STAT1 with GAS1, GAS2, or GAS4 elements did not change luciferase activity (Fig 5G and H); but co‐expression of STAT1 with GAS3 element induced transcriptional activation and that was abolished by GAS3 mutant (Fig 5H). To clarify these conflict results, we did a random assortment study of the reporters. The results showed that co‐expression of GAS1‐3, GAS2‐4, and GAS3‐4 elements with STAT1 induced inhibition of luciferase activity, while co‐expression of GAS2‐3 elements increased the luciferase activity (Fig 5I and J). These data suggest that a multi‐GASs‐dependent binding of STAT1 may be involved on GluN2A subunit.
We also measured laminin β1 (LB1) that is involved in Aβ‐induced suppression of NMDAR expression 28. No significant change was detected after overexpressing hTau (Appendix Fig S6), suggesting that hTau induces synapse impairment with distinct mechanisms from Aβ.
JAK2 activation mediates hTau‐induced STAT1 upregulation
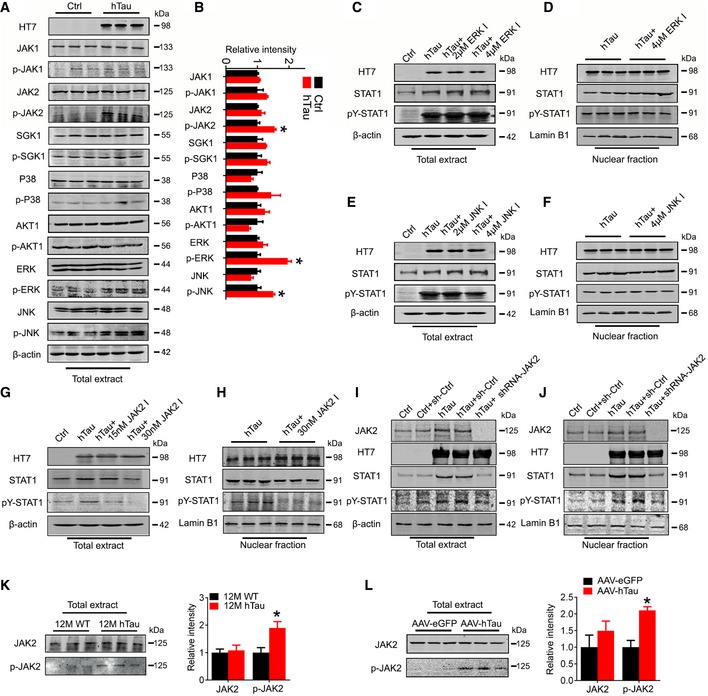
Phosphorylation of STAT1 is critical for its nuclear translocation and the activation 31. To further explore the upstream factors mediating hTau‐induced STAT1 activation, we screened protein kinases that can phosphorylate STAT1 32, 33. Among various kinases, JAK2, JNK, and ERK were activated by overexpressing hTau (Fig 6A and B), while only simultaneous inhibition of JAK2 by JAK2 inhibitor TG‐101348 (JAK2I) or JAK2 siRNA but not JNK or ERK abolished hTau‐induced STAT1 hyperphosphorylation at pY701 in both total cell extracts and the nuclear fraction (Fig 6C–J, Appendix Fig S7). JAK2 activation was also detected in hippocampus of 12‐month‐old hTau transgenic mice and CMV‐hTau‐AAV‐ or Syn‐hTau‐AAV‐infused C57 mice (Fig 6K and L and Appendix Fig S4A). These data demonstrate that hTau accumulation upregulates STAT1 activity by activating JAK2.
Figure 6. JAK2 activation mediates hTau‐induced STAT1 activation.
-
A, BOverexpression of hTau in HEK293 cells for 48 h increased the activity‐dependent phosphorylation of JAK2, JNK1, and ERK1 compared with the empty vector control (Ctrl) measured by Western blotting (n = 3, Student's t‐test).
-
C–FPharmacological inhibition of ERK1 (C, D) or JNK1 (E, F) for 24 h did not significantly affect the hTau‐induced STAT1 phosphorylation at pY‐STAT1 (Tyr701) in total extracts (C, E) and the nuclear fraction (D, F) measured by Western blotting (n = 3). The alteration of pS‐STAT1 (Ser727) confirms the efficacy of JNK1 inhibitors.
-
G–JPharmacological inhibition of JAK2 (G, H) or knockdown of JAK2 by siRNA (I, J) abolished hTau‐induced STAT1 phosphorylation at Tyr701 in total extracts (G, I) and the nuclear fraction (H, J) (n = 3).
-
K, LThe phosphorylated JAK2 level increased in the hippocampus of 12‐month‐old hTau transgenic mice (K) and the hippocampus of C57 mice infected with AAV‐hTau (1.13 × 10¹³ v.g./ml) (L) (n = 4, Mann–Whitney test).
Blocking STAT1 activation rescues hTau‐induced synapse and memory impairments
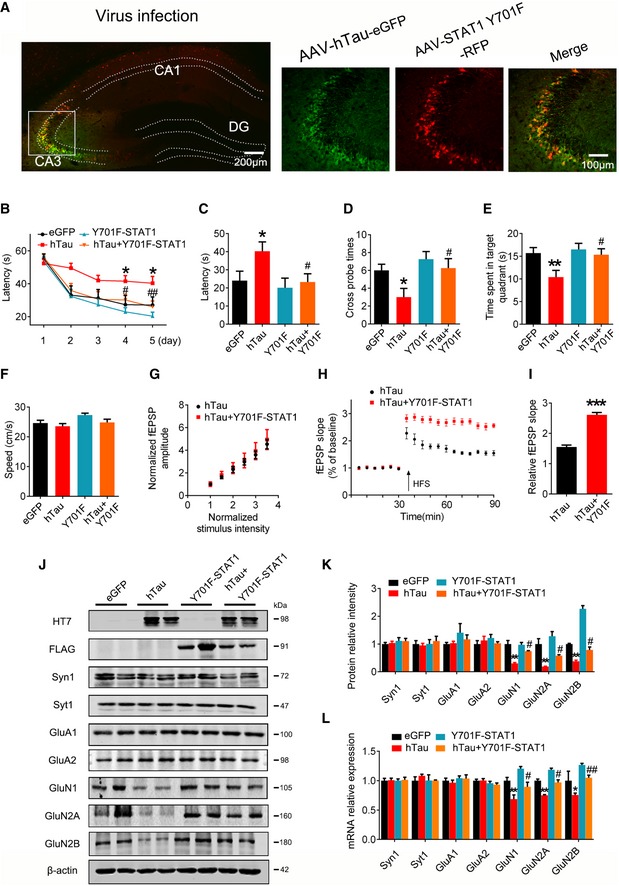
To verify the role of STAT1 phosphorylation in regulating expression of NMDARs and the cognitive ability, we constructed non‐phosphorylation of STAT1 dominant negative mutant (Y701F‐STAT1) AAV virus and co‐infused the mutant virus with AAV‐hTau into the hippocampal CA3 of 3‐month‐old C57 mice for 1 month (Fig 7A). We found that co‐expression of dominant negative Y701F‐STAT1 attenuated hTau‐induced learning and memory deficits (Fig 7B–F) with attenuation of LTP suppression (Fig 7G–I) and restoration of GluN1, GluN2A, and GluN2B protein and mRNA levels (Fig 7J–L). These data reveal that phosphorylation of STAT1 at Tyr701 indeed plays a critical role in hTau‐induced synapse and memory impairments.
Figure 7. Blocking STAT1 activation rescues hTau‐induced synapse and memory impairments.
-
A–FAAV‐eGFP (eGFP) or AAV‐hTau‐eGFP (hTau) (1.13 × 10¹³ v.g./ml) or AAV‐Y701F‐STAT1 (5 × 10¹² v.g./ml) or AAV‐Y701F‐STAT1 (5 × 10¹² v.g./ml) plus hTau was stereotaxically injected into hippocampal CA3 of 3‐month‐old C57 mice. After 1 month, learning and memory were detected by MWM test. (A) The representative fluorescence image confirms expression of AAV‐hTau and AAV‐Y701F‐STAT1. Scale bar, 200 μm or 100 μm for the enlarged. (B) Overexpression of Y701F‐STAT1 mitigated hTau‐induced spatial learning deficits shown by the decreased escape latency during water maze training (n = 7–10 each group). (C‐E) Overexpression of Y701F‐STAT1 mitigated hTau‐induced spatial memory impairment shown by the decreased latency to reach the platform (C), the increased crossing time in the platform site (D), and time spent in the target quadrant (E) measured at day 6 by removing the platform (n = 7–10 each group). (F) Expression of Y701F‐STAT1 did not change the swimming speed of the mice in water maze task (n = 7–10 each group).
-
G–ISimultaneous expression of Y701F‐STAT1 did not induce any further change on basal synaptic transmission (I/O curve) compared with expression of hTau alone, recorded in hippocampal CA3 (G). LTP magnitude was calculated as the average (normalized to baseline) of the responses recorded 40–60 min after conditioning stimulation (I) (n = 5 slices from 4 mice for each group).
-
J–LSimultaneous expression of Y701F‐STAT1 rescued the hTau‐induced suppression of NMDARs protein (J, K) and mRNA (L) expression measured by Western blotting and qRT–PCR in hippocampal CA3 of C57 mice (n = 4).
To explore whether STAT1 knockdown affects tau phosphorylation and aggregation, we co‐infused STAT1 dominant negative mutant (AAV‐Y701F‐STAT1) with AAV‐hTau into the hippocampal CA3 of 3‐month‐old C57 mice. After 1 month, the hTau level in soluble and insoluble fractions of hippocampal CA3 was measured. Reduction in human tau proteins phosphorylated at pS214, pT231, and pS404 was shown in soluble and insoluble fractions by inactivating STAT1 with no significant change in the endogenous mouse tau (Appendix Fig S8). These data suggest that downregulating STAT1 could attenuate hTau toxicities by reducing tau hyperphosphorylation and the pathological aggregation.
Discussion
Tau accumulation forming neurofibrillary tangles is hallmark of AD pathologies, but how tau accumulation induces synapse and memory impairment is elusive. By overexpressing hTau to mimic intraneuronal tau accumulation as seen in the sporadic AD cases, we show that hTau accumulation activates JAK2 to phosphorylate and activate STAT1. Upregulation of STAT1 subsequently inhibits expression of GluN1, GluN2A, and GluN2B by binding to their specific promoter elements, which results in synaptic dysfunction and memory deficit. We also demonstrate that knockdown of STAT1 by AAV‐Cre in STAT1flox/flox mice or by overexpressing dominant negative AAV‐Y701F‐STAT1 efficiently rescues hTau‐induced suppression of NMDAR expression with attenuation of synaptic functions and memory performance. These findings reveal that intracellular accumulation of hTau causes memory deterioration through JAK2/STAT1‐induced suppression of NMDARs expression, which discloses a novel mechanism for tau‐related synapse and memory impairments (Fig EV5).
Figure EV5. The proposed working model by which STAT1 mediates hTau‐induced toxicities.
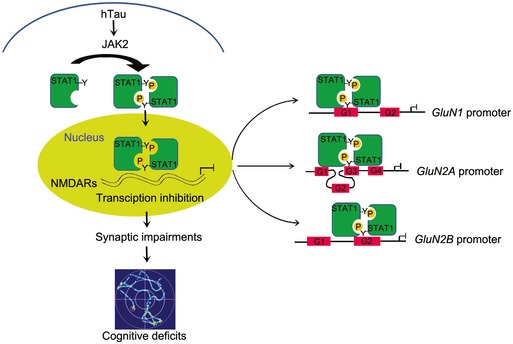
Intracellular accumulation of human tau (hTau) activates JAK2 to phosphorylate STAT1 at Tyr701 leading to STAT1 dimerization and its transcriptional activation in the nuclei. The hTau‐induced STAT1 activation inhibits expression of GluN1, GluN2A, and GluN2B by binding to the specific domain of the promoters, i.e., the GAS1 of GluN1 promoter, GAS2 of GluN2B promoter, or GAS3 combined with GAS1 or GAS4 of GluN2A promoter, which consequently leads to synaptic dysfunctions and memory deficits. “G” means GAS promoter element (GAS).
The mammalian STAT family consisted of seven members, i.e., STAT1, STAT2, STAT3, STAT4, STAT5a, STAT5b, and STAT6 34; among them, STAT1, STAT3, STAT5, and STAT6 are differentially expressed in the brain 35. Serve as transcription factors, the activity of STATs is regulated by phosphorylation 36, 37, and phosphorylation of STAT1 at Tyr701 stimulates its dimerization, nuclear translocation, DNA binding, and activation 31. By using multiple measures including phosphorylation, dimerization, EMSA, and luciferase activity assay, we provide strong evidence showing that hTau accumulation can activate STAT1. In addition to the increased phosphorylation, significantly increased STAT1 protein and mRNA levels were also detected in hTau‐expressed tissues. A previous study demonstrated that overexpressing hTau induced histone acetylation 38; therefore, the upregulated STAT1 expression may involve in epigenetic mechanism. Furthermore, expression of un‐phosphorylable dominant negative Y701F‐STAT1 attenuates hTau‐induced suppression of synaptic plasticity, which confirms a critical role of Tyr701 phosphorylation in regulating STAT1 activity. In addition to STAT1, we also detected upregulation of CBF and downregulation of seven Tfs in HEK293 cells after overexpressing hTau by transcription factor activating profiling assay. In the following studies on HEK293 and mouse brain with overexpression of hTau, some of the results were not recapitulated by Western blotting. This discrepancy can be caused by different measures (activity versus protein level), the experimental methods, and the materials used. By website prediction of the transcription factor binding sites (http://generegulation.com/pub/programs/alibaba2/index.html), we also found that in addition to STAT1, the other Tfs, such as HNF1, HOX4C, and PIT1, also have potential NMDAR binding element. Therefore, we measured whether overexpressing hTau affects the activity of HNF1, HOX4C, and PIT1, but no significant change was shown. These data suggest a relatively specific and significant effect of hTau on STAT1 and consequently the role of STAT1 on NMDARs.
Several tyrosine kinases, such as ERK1, JNK1, p38 kinase, MEK1, MSK1, and the JAK kinases, are involved in STAT1 phosphorylation 32, 33. Among them, we observed that JAK2, JNK, and ERK were activated upon intracellular hTau accumulation. However, only simultaneous inhibition of JAK2 but not JNK and ERK abolished the hTau‐induced STAT1 phosphorylation, which suggests a critical role of JAK2 activation in hTau‐induced STAT1 activation. The JAK/STAT pathway is involved in many pathophysiological processes including cell survival, proliferation, differentiation, development, and inflammation. Recent studies show that overexpression of STAT1 impairs water maze performance in mice 28, 29. STAT1 can bind to the promoter of extracellular matrix protein laminin β1 (LB1), by which it downregulates the expression of GluN1 and GluN2B in Aβ treatment 28. These data suggest an indirect role of STAT1 in regulating NMDARs via LB1. In the present study, we find that STAT1 can directly bind to the special GAS elements on NMDAR promoters and thus directly blocks the expression of NMDAR subunits. These data not only reveal novel mechanism underlying the STAT1 regulation on synaptic function, but also provide potential strategy for intervention. Besides tau proteins, TDP‐43 and α‐synuclein are also the widely recognized misfolding‐apt proteins which are more related to frontotemporal lobar degeneration (FTLD), amyotrophic lateral sclerosis (ALS) and Parkinson's disease (PD). The α‐synuclein was reported to modulate expression of GluN2D with no effects on the levels of GluN2A and GluN2B in striatal cholinergic interneurons 39, which is in agreement with the observations in our present study. In vitro, α‐synuclein was also reported to activate JAK/STAT pathway in microglia and macrophages 40, however, we did not see in the present study significant change in STAT1 level by overexpressing α‐synuclein in primary hippocampal neurons or HEK293 cells. The different cell models may partially explain the discrepancy.
To identify the exact binding element(s) of STAT1 on NMDAR promoters, we constructed GAS promoter elements (GASs) in NMDAR promoter regions for luciferase activity assay. We observed that GAS1 in GluN1 promoter and GAS2 in GluN2B promoter were required for STAT1‐negative regulation of the genes expression. However, STAT1 increased luciferase activity of GAS3‐containing constructs in GluN2A promoter, which is inconsistent with the reduced mRNA and protein levels of GluN2A by STAT1. Our further studies reveal that STAT1‐negative regulation of GluN2A promoter needs concomitant effect of GAS3 with GAS1 or GAS4, suggesting that STAT1‐dependent suppression of GluN2A requires a distal promoter region containing multiple GAS elements. This phenomenon was also seen in IFN‐γ‐mediated transcriptional suppression of the perlecan gene 41. It is well known that STAT1 plays an important role in immune response 42, and inhibition of neuroinflammation ameliorates learning and memory deficits in AD animal models 43, 44, 45.
Taken together, we find here that intracellular accumulation of hTau suppresses NMDAR expression by activating JAK2/STAT1 signaling pathway and thus contributes to synaptic and memory impairments. Downregulating STAT1 or blocking STAT1 activation efficiently rescues the hTau‐induced synaptic dysfunction and memory impairment in mice.
Materials and Methods
Antibodies and reagents
The antibodies used in the present study are listed in Appendix Table S3. Itacitinib (JAK1 inhibitor, from MCE), TG‐101348 (special JAK2 inhibitor, from MCE), JAK2 siRNA (sc‐39099, from Santa Cruz), AG490 (JAK2 inhibitor, from Santa Cruz), SP600125 (the inhibitor of JNK1, from Santa Cruz), and FR180204 (the inhibitor of ERK1, from Santa Cruz) were purchased. EGFP‐N1 vector‐coded full‐length human tau (hTau, also termed tau441 or tau40 or 2N4R) plasmid was a gift of Dr. Khalid Iqbal (New York State Institute for Basic Research in Developmental Disabilities, Staten Island, NY). PcDNA3.0 vector‐coded WT‐STAT1 and Y701F‐STAT1 plasmids were gifts of Dr. Xiao‐Yuan Li (Institute of Biomedical Sciences, Academia Sinica, Taiwan).
Animals
Male C57 mice were purchased from the animal center of Tongji Medical College, Huazhong University of Science and Technology. STAT1flox/flox (signal transducer and activator of transcription 1) mutant mice (B6; 129S‐STAT1tm1Mam/Mmjax) and hTau transgenic mice (STOCK Mapttm1(EGFP) Klt Tg(MAPT)8cPdav/J) were purchased from Jackson Laboratory. All mice were kept at 24 ± 2°C on daily 12‐h light–dark cycles with ad libitum access to food and water. All animal experiments were performed according to the “Policies on the Use of Animals and Humans in Neuroscience Research” revised and approved by the Society for Neuroscience in 1995, and the Guidelines for the Care and Use of Laboratory Animals of the Ministry of Science and Technology of the People's Republic of China, and the Institutional Animal Care and Use Committee at Tongji Medical College, Huazhong University of Science and Technology approved the study protocol.
Stereotaxic brain injection
Adeno‐associated virus coded for human full‐length tau (AAV‐hTau, also termed tau441 or tau40 or tau2N4R) with the N‐terminal fused with enhanced green fluorescent protein (eGFP) or the control AAV‐eGFP, AAV‐Cre, and AAV‐Y701F‐STAT1 virus was purchased from OBio Biologic Technology Co., Ltd. The titer of AAV‐hTau or the control virus was 1.13 × 10¹³ v.g./ml, and that for AAV‐Cre or AAV‐Y701F‐STAT1 was 5 × 10¹² v.g./ml which were driven by CMV promoter. The titer for Syn‐hTau‐AAV was 1.99 × 10¹³ v.g./ml with neuronal‐specific synapsin1 promoter. The in vivo overexpression efficiency was measured by immunohistochemical staining and Western blotting after injection of the virus into the hippocampal CA3 of mice brains for 1 month. For brain injections, ~3‐month‐old C57 or STAT1flox/flox mice were positioned, respectively, in a stereotaxic instrument, and then, the virus was bilaterally injected into the hippocampal CA3 region (AP ± 2.0, ML −1.5, DV −2.0) at a rate of 0.10 μl/min. The needle syringe was left in place for ~3 min before being withdrawn. The injection did not significantly increase the death rate or change the normal activity of the mice compared with the non‐injected controls. The hippocampal CA3 region which infected with the virus was used for the biochemical measurements.
Behavioral tests
Four weeks after brain infusion of the viral vectors, the spatial learning and memory were assessed by Morris water maze (MWM) test 46. For spatial learning, mice were trained in water maze to find a hidden platform for 5 consecutive days, four trials per day with a 30‐s interval from 14:00 to 20:00 pm. On each trial, the mice started from one of the four quadrants facing the wall of the pool and ended when the animal climbed on the platform. If the mice did not locate the platform within 60 s, they were guided to the platform. The swimming path and the time used to find the platform (latency) or pass through the previous platform quadrant were recorded each day by a video camera fixed to the ceiling, 1.5 m from the water surface. The camera was connected to a digital‐tracking device attached to an IBM computer. The spatial memory was tested 1 day after the last training. The longer a mouse stayed in the previous platform‐located quadrant, the better it scored the spatial memory.
The contextual fear conditioning test was performed as the procedures established in our laboratory 47. Briefly, the mouse was kept in the cage for 3 min to adapt to the environment before experiments, and then, the mice received training by subjecting to 3 min of unsignaled foot shocks (one shock at the first min, three shocks at the second min, and eight shocks at the third min; 0.5 mA, 2‐s duration, and 1 min apart). The short‐term memory (STM) and long‐term memory (LTM) were tested, respectively, in 2 and 24 h after the training by subjecting back into the conditioning chamber for 3 min and measuring the freezing time.
Electrophysiological analysis
Horizontal brain slices (400 μm) containing the dorsal hippocampus were cut at 4–5°C in artificial cerebrospinal fluid (aCSF) consisting of (in mM) 126 NaCl, 3 KCl, 1.25 NaH2PO4, 24 NaHCO3, 2 MgSO4, 2 CaCl2, and 10 glucose (pH 7.4; 305 mOsm), and saturated with carbogen (95% O2 and 5% CO2), using a Leica VT1000S Vibratome (Milton Keynes, UK). Immediately after slicing, sections were transferred and maintained in an interface chamber continuously perfused with aCSF. The slices were allowed to equilibrate at least for 30 min prior to recording at room temperature.
For extracellular recordings, slices were placed in the interface recording chamber at 32°C and the perfusion rate was normally 3 ml/min, while maintaining a thin film of aCSF covering the slice to make sure applied substances could diffuse into the area recorded. Field potentials were amplified with Neurolog AC‐coupled NL 104 preamplifiers (Digitimer Ltd, Welwyn, UK). The excitatory postsynaptic potential (fEPSP) was recorded by a 0.1‐MΩ tungsten monopolar electrode from the dendritic layer of the stratum radiatum of the CA3 field following electrical stimulation of the mossy fiber pathway. The electrical pulses were delivered using a bipolar platinum/iridium electrode (25 μm wire diameter, at an inter‐wire distance of 100 μm, World Precision Instruments, USA). The fEPSP was quantified by 30% of the maximum slope of its rising phase. Input/output (I/O) curves were constructed by measuring fEPSP slopes responding to the stimulus intensity increasing from 1 to 10 V, with a 0.5‐V increment in each slice. Paired‐pulse facilitation (PPF) was examined by applying pairs of pulses, which were separated by 20‐ to 500‐ms intervals.
For induction of long‐term potentiation (LTP), we used high‐frequency stimulation (HFS; 100 Hz, 1‐s duration). The magnitudes of LTP are expressed as the mean percentage of baseline fEPSP initial slope.
NMDA/AMPA receptor EPSC analysis was performed by patch clamp in the presence of 50 mM picrotoxin. The evoked EPSCs were collected at two holding potentials. At −70 mV, responses were collected and the peak amplitude identified as the AMPA receptor‐mediated response. Cells were then voltage‐clamped at +40 mV, and the amplitude of the evoked EPSC 50 ms poststimulus was identified as the NMDAR‐mediated response. Six to eight traces were collected at 0.1 Hz for each membrane potential 48, 49.
Cell culture
The human embryonic kidney293 (HEK293) were grown in Dulbecco's modified Eagle's medium (DMEM), supplemented with 10% (v/v) fetal bovine serum and 1% penicillin/streptomycin, in a humidified atmosphere containing 5% CO2 incubator at 37°C. After growing 24 h in plates or flasks, the cells were transfected with the indicated plasmid(s) using Lipofectamine 2000 according to the manufacturer's instructions.
For primary neuron cultures, 18 days of embryonic (E18) rat hippocampus were seeded at 30,000–40,000 cells per well on 6‐well plates coated with Poly‐d‐Lysine/Laminin (Bioscience) in neurobasal medium (Invitrogen) supplemented with 2% B27/0.5 mM glutamine/25 mM glutamate. Half the culture medium was changed every 3 days with neurobasal medium supplemented with 2% B27 and 0.5 mM glutamine. All cultures were kept at 37°C in a humidified 5% CO2‐containing atmosphere. More than 90% of the cells were neurons after they were cultured for 7–17 div; this was verified by positive staining for the neuronal‐specific markers microtubule‐associated protein‐2 (MAP2, dendritic marker, Millipore).
Preparation of nuclear fractionation
The nuclear extracts were prepared using the nuclear extraction kit according to the manufacturer's instructions (Signosis, Inc., Sunnyvale, CA). Briefly, culture dish was added with Buffer I working reagent and rocked at 200 rpm for 10 min on a shaking platform at 4°C. The HEK293 cells were collected and centrifuged at 14,000 g for 5 min at 4°C. The supernatant was discarded, and the pellets were re‐suspended by adding Buffer II working reagents. For tissues, the hippocampal CA3 areas (where virus infected) were rapidly cut into small pieces, added Buffer I working reagent, and homogenized on ice until a single cell suspension observed (by microscope). After spun at 500 g for 5 min at 4°C, the supernatant was removed, and the cell pellets re‐suspended with Buffer I working reagent and rocked at 200 rpm for 10 min on a shaking platform at 4°C. Then, the cells centrifuged at 10,000 g for 5 min at 4°C, and the pellets were re‐suspended by adding Buffer II working reagents. Lastly, the cell lysis was shaken at 200 rpm on a platform for 2 h at 4°C. After centrifuged at 14,000 g for 5 min at 4°C, the supernatant (nuclear extract) was collected and stored at −80°C until use.
Preparation of insoluble tau
Insoluble tau aggregates were isolated from virus‐infected hippocampal tissue by a modified procedure. Brain tissues were homogenized in lysis buffer (10 mM Tris–HCl, 150 mM NaCl, 20 mM NaF, 1 mM Na3VO4, 2 mM EGTA, 0.5% Triton X‐100, and 0.1% SDS) with protease inhibitor mixture and centrifuged for 20 min at 13,000 × g. The resulting supernatant designated as soluble tau fraction. The pellet was re‐suspended in 1% SDS buffer with 10 times of ultrasonic and designated as insoluble aggregated tau.
Western blotting
Equal amounts of protein were separated by 10% sodium dodecyl sulfate‐polyacrylamide gel electrophoresis (SDS–PAGE) and transferred onto nitrocellulose membranes. For analysis of STAT1 dimerization, cell lysates were incubated for 20 min with 1 mM DSS, blocked with 0.5 mM NH4OH, and used for Western blotting with anti‐STAT1 antibody 50. The membranes were blocked in 5% non‐fat milk for 1 h at room temperature and then incubated with primary antibody (Appendix Table S3) at 4°C overnight. Then, the blots were incubated with IRDye 800CW‐conjugated affinity‐purified anti‐mouse IgG (Rockland) or IRDye 800CW anti‐rabbit IgG secondary antibody (Rockland) for 1 h at room temperature. Immunoreactive bands were visualized using Odyssey Infrared Imaging System (Licor Biosciences, Lincoln, NE, USA).
Reverse transcription and real‐time quantitative PCR
Reverse transcription and real‐time quantitative PCR were carried out according to manufacturer's instruction (Takara, Dalian, China). The PCR system contains 3 mM MgCl2, 0.5 μM forward and reverse primers, 2 μl SYBR Green PCR master mixes, and 2 μl cDNA, and the standards for each gene were prepared using appropriate primers by a conventional PCR. The samples were assayed on a Rotor‐Gene 300 Real‐time Cycler (Corbett Research, Sydney, Australia). The expression level of the interest gene was normalized by the housekeeping gene glyceraldehyde‐3‐phosphate dehydrogenase (GAPDH), which was not changed by the treatments. PCR primers employed in the present study are as follows: Mmu‐GluA1 forward and reverse primers, 5′‐CAATGACCGCTATGAGGG‐3′ and 5′‐AAGGACTGAAACGGCTGA‐3′; mmu‐GluA2 forward and reverse primers, 5′‐GTGTCGCCCATCGAAAGTG‐3′ and 5′‐AGTAGGCATACTTCCCTTTGGAT‐3′; mmu‐Syn1 forward and reverse primers, 5′‐AGGACGAGGTGAAAGC‐3′ and 5′‐TCAGTCGGAGAAGAGG‐3′; mmu‐Syt1 forward and reverse primers, 5′‐CCATAGCCATAGTTGC‐3′ and 5′‐GTTTCAGCATCGTCAT‐3′; mmu‐GluN1 forward and reverse primers, 5′‐GTCCACCAGACTAAAGA‐3′ and 5′‐TCCCATCATTCCGT‐3′; mmu‐GluN2A forward and reverse primers, 5′‐CTTTTGAGGACGCC‐3′ and 5′‐AAATGAGACCCGATG‐3′; mmu‐GluN2B forward and reverse primers, 5′‐GGCTGACTGGCTACG‐3′ and 5′‐CTTGGGCTCAGGGAT‐3′; and mmu‐GAPDH forward and reverse primers, 5′‐GGAGCGAGATCCCTCCAAAAT‐3′ and 5′‐GGCTGTTGTCATACTTCTCATGG‐3′.
Transcription factor activating profiling assay
Analysis of the activity of 96 transcription factors (TFs, shown in Appendix Tables S1 and S2) was performed according to the manufacturer's instructions by using the TF Activation Profiling Plate Array II (Signosis, Inc., Sunnyvale, CA). HEK293 cells were transfected with tau plasmid or its control vector for 48 h, and then, the nuclear protein extracts were prepared according to the manufacturer's instructions using the Nuclear Extraction Kit (Signosis, Inc., Sunnyvale, CA). A 10 μg sample of nuclear protein extracts was assayed per sample.
Electrophoresis mobility shift assay (EMSA)
The Non‐radioactive EMSA‐STAT1 Kit was purchased from Signosis (Sunnyvale, CA). EMSA was performed according to the protocol supplied by the manufacturer. Briefly, samples were incubated with a biotinized oligonucleotide probe containing a STAT1 binding site. After incubation, the samples were separated on a non‐denaturing polyacrylamide gel and transferred to nylon membranes. The transferred oligonucleotides were immobilized by UV cross‐linking. For detection of the oligonucleotides, streptavidin‐HRP was added to the membrane, and the blots were developed by ECL according to manufacturers’ instructions. Competition experiment was performed using excess amounts of unlabeled cold probe containing STAT1 binding site.
Luciferase reporter assay
Activity of the transcription factors (TFs) was analyzed by using specific luciferase reporter vectors, including pSTAT1‐Luc, pCBF‐Luc, pPIT1‐Luc, pHNF1‐Luc, pHOX4C‐Luc, and pSF1‐Luc, respectively (Signosis). These vectors contain a cis‐element (DNA‐binding sequence), a minimal promoter, and a firefly luciferase gene. The activated transcription factors (such as STAT1, CBF, PIT1, HNF1, HOX4C, and SF1) bind to the cis‐element and trans‐activate the expression of the luciferase gene correlating with the measured luciferase enzyme activity. Therefore, the luciferase activity in this assay represents activation of the transcription factor. Briefly, the HEK293 cells were transfected with tau plasmid or its empty vector control in combination with pSTAT1‐Luc (or pCBF‐Luc, or pPIT1‐Luc, or pHNF1‐Luc, or pHOX4C‐Luc, or pSF1‐Luc) reporter construct and pRL‐TK for 48 h. Then, the cells were washed with PBS and lysed in 100 μl of the 1×CCLR (Promega). The luciferase activity was measured by following the manufacturer's instruction (Promega). The activity of TFs (i.e., firefly luciferase) was normalized to transfection efficiency by using Renilla luciferase activity (pRL‐TK).
To generate luciferase reporter plasmids of GluN1, GluN2A, or GluN2B promoter, PCR fragments (Fig 5) from the mouse genomic DNA were inserted into the BglII and NcoI sites of the pGL3 basic luciferase expression vector (Promega, Madison, WI). Mutation of the pGL3‐GluN1/GluN2A/GluN2B luciferase plasmid was introduced using the GeneTailor system (Invitrogen). HEK293 cells were transfected with luciferase reporter plasmids using Lipofectamine Plus (Invitrogen) according to the instructions provided by the manufacturer. To assay the luciferase activity, HEK293 cells were seeded into 24‐well plates in DMEM, 1 day prior to transfection, and co‐transfected with pGL3 construct, tau, and pRL‐TK plasmid. After 24 h, cells were harvested and lysed with 100 μl Passive Lysis Buffer. The cell extracts (20 μl) were used for luciferase activity assay using a Lumat LB9507 luminometer (Berthold) and the Dual‐Luciferase Reporter (DLR) Assay System (Promega).
Chromatin immunoprecipitation (ChIP) assay
The DNA and protein were cross‐linked with 1% formaldehyde for 10 min, washed, and scraped into cold PBS with protease inhibitors. After centrifugation, the cell pellet was re‐suspended in buffer (20 mM HEPES, pH 7.9, 25% glycerol, 420 mM NaCl, 1.5 mM MgCl2, 0.2 mM EDTA, protease inhibitors), incubated on ice for 20 min, and centrifuged. The pellet (nucleus) was re‐suspended in breaking buffer (50 mM Tris–HCl, pH 8.0, 1 mM EDTA, 150 mM NaCl, 1% SDS, 2% Triton X‐100, protease inhibitors) and sonicated 5–10 s, and Triton buffer was added (50 mM Tris–HCl, pH 8.0, 1 mM EDTA, 150 mM NaCl, 0.1% Triton X‐100). An aliquot was reserved as the input, and the remainder was divided into immunoprecipitate with control mouse IgG (Millipore) or STAT1 (Abcam) antibody followed by incubation with protein G beads. Samples were washed three times in Triton buffer, SDS buffer was added (62.5 mM Tris–HCl, pH 6.8, 200 mM NaCl, 2% SDS, 10 mM DTT, 2 μl of proteinase K (40 mg/ml)), and then samples were vortexed and incubated at 65°C overnight to reverse cross‐linking. DNA was isolated using phenol/chloroform extraction and re‐suspended in distilled H2O. Primers used for ChIP PCR were as follows: GluN1 forward and reverse primer, 5′‐TAGCATTGGCATTGACCC‐3′, 5′‐GCTGGTGCGGTGATGTGA‐3′; GluN2A forward and reverse primer, 5′‐TCGGCTTGGACTGATACGTG‐3′, 5′‐AGGATAGACTGCCCCTGCAC‐3′; and GluN2B forward and reverse primer, 5′‐TCTCCACCGTGCTGATGT‐3′, 5′‐CTCTCCGAGTCTACCTGTTC‐3′. PCR products were analyzed by 2% agarose gel electrophoresis.
Immunohistochemistry
In brief, mice were sacrificed by overdose chloral hydrate (1 g/kg) and perfused through aorta with 100 ml 0.9% NaCl followed by 400 ml phosphate buffer containing 4% paraformaldehyde. Brains were removed and postfixed in perfusate overnight and then cut into sections (20 μm) with a vibratome (Leica, Nussloch, Germany; S100, TPI). The sections of mice and AD brains were collected consecutively in PBS for immunohistochemistry. Free‐floating sections were blocked with 0.3% H2O2 in absolute ethanol for 30 min, and nonspecific sites were blocked with bovine serum albumin (BSA) for another 30 min at room temperature. Sections were then incubated overnight at 4°C with primary antibodies. Immunoreaction was developed using HistostainTM‐SP kits and visualized with diaminobenzidine (brown color). Sections were counterstained with hematoxylin, dehydrated through a graded ethanol series, mounted on glass slides, and sealed with glass coverslips. For each primary antibody, three to five consecutive sections from each brain were used. The images were observed using a microscope (Olympus BX60, Tokyo, Japan).
Thioflavin‐S staining
The misfolded tau proteins were stained with Thioflavin‐S (Sigma). Briefly, 20‐μm brain sections were incubated in 0.25% potassium permanganate solution for 20 min, rinsed in distilled water, and incubated in bleaching solution (2% oxalic acid and 1% potassium metabisulfite in distilled water) for 2 min. The sections were washed with distilled water and incubated in blocking solution (1% sodium hydroxide and 0.9% hydrogen peroxide in distilled water) for 20 min. The sections were incubated for 5 s in 0.25% acidic acid, then washed in distilled water, and stained for 5 min with 0.0125% Thioflavin‐S in 50% ethanol. The sections were washed with 50% ethanol and placed in distilled water. Then, the sections were covered with a glass cover using mounting solution and examined under a fluorescence microscope 51.
Bielschowsky silver staining
According to the modified Bielschowsky silver staining method, 20‐μm brain sections were rinsed in distilled water for three times, followed by pre‐warmed (40°C) 4% silver nitrate (AgNO3) solution at 37°C for 30 min. Sections were rinsed in distilled water for three times, fixed in formaldehyde for 5 min, and rehydrated again, and an ammoniacal silver ethanol solution was added. Finally dehydrated and cleared through 95% ethyl alcohol, absolute alcohol, and xylene, mount with resinous medium 52.
Human brain tissue
The human brain tissues used in the present study were provided by Dr. K Ye of the Emory University School of Medicine, USA (Appendix Table S4). The study was approved by the Biospecimen Committee. AD was diagnosed according to the criteria of the Consortium to Establish a Registry for AD and the National Institute on Aging. Diagnoses were confirmed by the presence of amyloid plaques and neurofibrillary tangles in formalin‐fixed tissue. Informed consent was obtained from the subjects.
Statistical analysis
All data were collected and analyzed in a blinded manner. Data were expressed as mean ± SD or mean ± SEM and analyzed using SPSS 12.0 statistical software (SPSS Inc. Chicago, IL, USA). Statistical analysis was performed using the Mann–Whitney test (two‐group comparison), one‐way ANOVA, or two‐way repeated measures ANOVA followed by Bonferroni's post hoc test. The level of significance was set at P < 0.05. Image pro‐plus software was used to calculate fluorescence intensity of STAT1 in nucleus on HEK293 cells staining and immunohistochemical staining intensity of STAT1/pY‐STAT1 on human brain slice.
Author contributions
J‐ZW and G‐PL conceived the project, designed the experiments, and wrote the manuscript. X‐GL and X‐YH designed and performed most of the experiments. Y‐LW, S‐JZ, and D‐SS performed electrophysiological experiments. QF, J‐WY, and YG prepared primary neurons. H‐LL performed the immunohistochemical experiments. J‐FZ, X‐CL, Y‐CL, DK, and QW assisted with in vivo and in vitro experiments. KY assisted with data analysis and interpretation and critically read the manuscript.
Conflict of interest
All authors disclose (a) no actual or potential conflicts of interest including any financial, personal, or other relationships with other people or organizations within 3 years of beginning the work submitted that could inappropriately influence (bias) their work and (b) when applicable, provide statements verifying that appropriate approval and procedures were used concerning animals.
Supporting information
Appendix
Expanded View Figures PDF
Source Data for Appendix and Expanded View
Review Process File
Source Data for Figure 1
Source Data for Figure 2
Source Data for Figure 3
Source Data for Figure 4
Source Data for Figure 6
Source Data for Figure 7
Acknowledgements
We thank Dr. Xiao‐Yuan Li of Institute of Biomedical Sciences, Academia Sinica, Taiwan, for the kind gift of STAT1 plasmids. This work was supported in parts by Natural Science Foundation of China (31730035, 91632305, 81870846, and 81721005), Ministry of Science and Technology of China (2016YFC13058001), and Sanming Project of Medicine in Shenzhen (SZSM201611090).
EMBO Reports (2019) 20: e47202
Contributor Information
Gong‐Ping Liu, Email: liugp111@mail.hust.edu.cn.
Jian‐Zhi Wang, Email: wangjz@mail.hust.edu.cn.
References
- 1. Arai H, Lee VM, Otvos L Jr, Greenberg BD, Lowery DE, Sharma SK, Schmidt ML, Trojanowski JQ (1990) Defined neurofilament, hTau, and beta‐amyloid precursor protein epitopes distinguish Alzheimer from non‐Alzheimer senile plaques. Proc Natl Acad Sci USA 87: 2249–2253 [DOI] [PMC free article] [PubMed] [Google Scholar]
- 2. Braak H, Braak E (1991) Demonstration of amyloid deposits and neurofibrillary changes in whole brain sections. Brain Pathol 1: 213–216 [DOI] [PubMed] [Google Scholar]
- 3. Thal DR, Holzer M, Rüb U, Waldmann G, Günzel S, Zedlick D, Schober R (2000) Alzheimer‐related hTau‐pathology in the perforant path target zone and in the hippocampal stratum oriens and radiatum correlates with onset and degree of dementia. Exp Neurol 163: 98–110 [DOI] [PubMed] [Google Scholar]
- 4. Yin Y, Gao D, Wang Y, Wang ZH, Wang X, Ye J, Wu D, Fang L, Pi G, Yang Y et al (2016) Tau accumulation induces synaptic impairment and memory deficit by calcineurin‐mediated inactivation of nuclear CaMKIV/CREB signaling. Proc Natl Acad Sci USA 113: E3773–E3781 [DOI] [PMC free article] [PubMed] [Google Scholar]
- 5. Hu YY, He SS, Wang X, Duan QH, Grundke‐Iqbal I, Iqbal K, Wang J (2002) Levels of nonphosphorylated and phosphorylated hTau in cerebrospinal fluid of Alzheimer's disease patients: an ultrasensitive bienzyme‐substrate‐recycle enzyme‐linked immunosorbent assay. Am J Pathol 160: 1269–1278 [DOI] [PMC free article] [PubMed] [Google Scholar]
- 6. Lin YT, Cheng JT, Yao YC, Juo LI, Lo YK, Lin CH, Ger LP, Lu PJ (2009) Increased total TAU but not amyloid‐beta(42) in cerebrospinal fluid correlates with short‐term memory impairment in Alzheimer's disease. J Alzheimers Dis 18: 907–918 [DOI] [PubMed] [Google Scholar]
- 7. Kelleher I, Garwood C, Hanger DP, Anderton BH, Noble W (2007) Kinase activities increase during the development of Tauopathy in hTau mice. J Neurochem 103: 2256–2267 [DOI] [PubMed] [Google Scholar]
- 8. Kimura T, Yamashita S, Fukuda T, Park JM, Murayama M, Mizoroki T, Yoshiike Y, Sahara N, Takashima A (2007) Hyperphosphorylated hTau in parahippocampal cortex impairs place learning in aged mice expressing wild‐type human hTau. EMBO J 26: 5143–5152 [DOI] [PMC free article] [PubMed] [Google Scholar]
- 9. Rapoport M, Dawson HN, Binder LI, Vitek MP, Ferreira A (2002) Tau is essential to beta ‐amyloid‐induced neurotoxicity. Proc Natl Acad Sci USA 99: 6364–6369 [DOI] [PMC free article] [PubMed] [Google Scholar]
- 10. Roberson ED, Scearce‐Levie K, Palop JJ, Yan F, Cheng IH, Wu T, Gerstein H, Yu GQ, Mucke L (2007) Reducing endogenous hTau ameliorates amyloid beta‐induced deficits in an Alzheimer's disease mouse model. Science 316: 750–754 [DOI] [PubMed] [Google Scholar]
- 11. Vossel KA, Xu JC, Fomenko V, Miyamoto T, Suberbielle E, Knox JA, Ho K, Kim DH, Yu GQ, Mucke L (2015) Tau reduction prevents Abeta‐induced axonal transport deficits by blocking activation of GSK3beta. J Cell Biol 209: 419–433 [DOI] [PMC free article] [PubMed] [Google Scholar]
- 12. Weingarten MD, Lockwood AH, Hwo SY, Kirschner MW (1975) A protein factor essential for microtubule assembly. Proc Natl Acad Sci USA 72: 1858–1862 [DOI] [PMC free article] [PubMed] [Google Scholar]
- 13. Cleveland DW, Hwo SY, Kirschner MW (1977) Purification of hTau, a microtubule‐associated protein that induces assembly of microtubules from purified tubulin. J Mol Biol 116: 207–225 [DOI] [PubMed] [Google Scholar]
- 14. Alonso AC, Zaidi T, Grundke‐Iqbal I, Iqbal K (1994) Role of abnormally phosphorylated hTau in the breakdown of microtubules in Alzheimer disease. Proc Natl Acad Sci USA 91: 5562–5566 [DOI] [PMC free article] [PubMed] [Google Scholar]
- 15. Ebneth A, Godemann R, Stamer K, Illenberger S, Trinczek B, Mandelkow E (1998) Overexpression of hTau protein inhibits kinesin‐dependent trafficking of vesicles, mitochondria, and endoplasmic reticulum: implications for Alzheimer's disease. J Cell Biol 143: 777–794 [DOI] [PMC free article] [PubMed] [Google Scholar]
- 16. Kunzi V, Glatzel M, Nakano MY, Greber UF, Van Leuven F, Aguzzi A (2002) Unhampered prion neuroinvasion despite impaired fast axonal transport in transgenic mice overexpressing four‐repeat hTau. J Neurosci 22: 7471–7477 [DOI] [PMC free article] [PubMed] [Google Scholar]
- 17. Audouard E, Van HL, Suain V, Yilmaz Z, Poncelet L, Leroy K, Brion JP (2015) Motor deficit in a Tauopathy model is induced by disturbances of axonal transport leading to dying‐back degeneration and denervation of neuromuscular junctions. Am J Pathol 185: 2685–2697 [DOI] [PubMed] [Google Scholar]
- 18. Cox K, Combs B, Abdelmesih B, Morfini G, Brady ST, Kanaan NM (2016) Analysis of isoform‐specific hTau aggregates suggests a common toxic mechanism involving similar pathological conformations and axonal transport inhibition. Neurobiol Aging 47: 113–126 [DOI] [PMC free article] [PubMed] [Google Scholar]
- 19. Li HL, Wang HH, Liu SJ, Deng YQ, Zhang YJ, Tian Q, Wang XC, Chen XQ, Yang Y, Zhang JY et al (2007) Phosphorylation of hTau antagonizes apoptosis by stabilizing beta‐catenin, a mechanism involved in Alzheimer's neurodegeneration. Proc Natl Acad Sci USA 104: 3591–3596 [DOI] [PMC free article] [PubMed] [Google Scholar]
- 20. Duan DX, Chai GS, Ni ZF, Hu Y, Luo Y, Cheng XS, Chen NN, Wang JZ, Liu GP (2013) Phosphorylation of hTau by death‐associated protein kinase 1 antagonizes the kinase‐induced cell apoptosis. J Alzheimers Dis 37: 795–808 [DOI] [PubMed] [Google Scholar]
- 21. Luo DJ, Feng Q, Wang ZH, Sun DS, Wang Q, Wang JZ, Liu GP (2014) Knockdown of phosphotyrosyl phosphatase activator induces apoptosis via mitochondrial pathway and the attenuation by simultaneous hTau hyperphosphorylation. J Neurochem 130: 816–825 [DOI] [PubMed] [Google Scholar]
- 22. Binder LI, Frankfurter A, Rebhun LI (1985) The distribution of hTau in the mammalian central nervous system. J Cell Biol 101: 1371–1378 [DOI] [PMC free article] [PubMed] [Google Scholar]
- 23. Ittner LM, Ke YD, Delerue F, Bi M, Gladbach A, van Eersel J, Wölfing H, Chieng BC, Christie MJ, Napier IA et al (2010) Dendritic function of hTau mediates amyloid‐beta toxicity in Alzheimer's disease mouse models. Cell 142: 387–397 [DOI] [PubMed] [Google Scholar]
- 24. Thies E, Mandelkow EM (2007) Missorting of hTau in neurons causes degeneration of synapses that can be rescued by the kinase MARK2/Par‐1. J Neurosci 27: 2896–2907 [DOI] [PMC free article] [PubMed] [Google Scholar]
- 25. Zhao X, Kotilinek LA, Smith B, Hlynialuk C, Zahs K, Ramsden M, Cleary J, Ashe KH (2016) Caspase‐2 cleavage of hTau reversibly impairs memory. Nat Med 22: 1268–1276 [DOI] [PubMed] [Google Scholar]
- 26. Hu Y, Li XC, Wang ZH, Luo Y, Zhang X, Liu XP, Feng Q, Wang Q, Yue Z, Chen Z et al (2016) Tau accumulation impairs mitophagy via increasing mitochondrial membrane potential and reducing mitochondrial Parkin. Oncotarget 7: 17356–17368 [DOI] [PMC free article] [PubMed] [Google Scholar]
- 27. Li XC, Hu Y, Wang ZH, Luo Y, Zhang Y, Liu XP, Feng Q, Wang Q, Ye K, Liu GP et al (2016) Human wild‐type full‐length hTau accumulation disrupts mitochondrial dynamics and the functions via increasing mitofusins. Sci Rep 6: 24756 [DOI] [PMC free article] [PubMed] [Google Scholar]
- 28. Hsu WL, Ma YL, Hsieh DY, Liu YC, Lee EH (2014) STAT1 negatively regulates spatial memory formation and mediates the memory‐impairing effect of Abeta. Neuropsychopharmacology 39: 746–758 [DOI] [PMC free article] [PubMed] [Google Scholar]
- 29. Tai DJ, Hsu WL, Liu YC, Ma YL, Lee EH (2011) Novel role and mechanism of protein inhibitor of activated STAT1 in spatial learning. EMBO J 30: 205–220 [DOI] [PMC free article] [PubMed] [Google Scholar]
- 30. Sandelin A, Alkema W, Engstrom P, Wasserman WW, Lenhard B (2004) JASPAR: an open‐access database for eukaryotic transcription factor binding profiles. Nucleic Acids Res 32: D91–D94 [DOI] [PMC free article] [PubMed] [Google Scholar]
- 31. Liddle FJ, Alvarez JV, Poli V, Frank DA (2006) Tyrosine phosphorylation is required for functional activation of disulfide‐containing constitutively active STAT mutants. Biochemistry 45: 5599–5605 [DOI] [PubMed] [Google Scholar]
- 32. Zhang Y, Cho YY, Petersen BL, Zhu F, Dong Z (2004) Evidence of STAT1 phosphorylation modulated by MAPKs, MEK1 and MSK1. Carcinogenesis 25: 1165–1175 [DOI] [PubMed] [Google Scholar]
- 33. Quelle FW, Thierfelder W, Witthuhn BA, Tang B, Cohen S, Ihle JN (1995) Phosphorylation and activation of the DNA binding activity of purified Stat1 by the Janus protein‐tyrosine kinases and the epidermal growth factor receptor. J Biol Chem 270: 20775–20780 [DOI] [PubMed] [Google Scholar]
- 34. Darnell JE Jr (1997) STATs and gene regulation. Science 277: 1630–1635 [DOI] [PubMed] [Google Scholar]
- 35. Jatiani SS, Baker SJ, Silverman LR, Reddy EP (2010) Jak/STAT pathways in cytokine signaling and myeloproliferative disorders: approaches for targeted therapies. Genes Cancer 1: 979–993 [DOI] [PMC free article] [PubMed] [Google Scholar]
- 36. Wegenka UM, Buschmann J, Lütticken C, Heinrich PC, Horn F (1993) Acute‐phase response factor, a nuclear factor binding to acute‐phase response elements, is rapidly activated by interleukin‐6 at the posttranslational level. Mol Cell Biol 13: 276–288 [DOI] [PMC free article] [PubMed] [Google Scholar]
- 37. Sadowski HB, Shuai K, Darnell JE Jr, Gilman MZ (1993) A common nuclear signal transduction pathway activated by growth factor and cytokine receptors. Science 261: 1739–1744 [DOI] [PubMed] [Google Scholar]
- 38. Chai GS, Feng Q, Wang ZH, Hu Y, Sun DS, Li XG, Ke D, Li HL, Liu GP, Wang JZ (2017) Downregulating ANP32A rescues synapse and memory loss via chromatin remodeling in Alzheimer model. Mol Neurodegener 12: 34 [DOI] [PMC free article] [PubMed] [Google Scholar]
- 39. Tozzi A, de Iure A, Bagetta V, Tantucci M, Durante V, Quiroga‐Varela A, Costa C, Di Filippo M, Ghiglieri V, Latagliata EC et al (2016) Alpha‐synuclein produces early behavioral alterations via striatal cholinergic synaptic dysfunction by interacting with GluN2D N‐Methyl‐D‐Aspartate receptor subunit. Biol Psychiatry 79: 402–414 [DOI] [PubMed] [Google Scholar]
- 40. Qin H, Buckley JA, Li X, Liu Y, Fox TH III, Meares GP, Yu H, Yan Z, Harms AS, Li Y et al (2016) Inhibition of the JAK/STAT pathway protects against α‐synuclein‐induced neuroinflammation and dopaminergic neurodegeneration. J Neurosci 36: 5144–5159 [DOI] [PMC free article] [PubMed] [Google Scholar]
- 41. Sharma B, Iozzo RV (1998) Transcriptional silencing of perlecan gene expression by interferon‐gamma. J Biol Chem 273: 4642–4646 [DOI] [PubMed] [Google Scholar]
- 42. Shuai K, Liu B (2003) Regulation of JAK‐STAT signalling in the immune system. Nat Rev Immunol 3: 900–911 [DOI] [PubMed] [Google Scholar]
- 43. Echeverria V, Yarkov A, Aliev G (2016) Positive modulators of the alpha7 nicotinic receptor against neuroinflammation and cognitive impairment in Alzheimer's disease. Prog Neurobiol 144: 142–157 [DOI] [PubMed] [Google Scholar]
- 44. Baruch K, Rosenzweig N, Kertser A, Deczkowska A, Sharif AM, Spinrad A, Tsitsou‐Kampeli A, Sarel A, Cahalon L, Schwartz M (2015) Breaking immune tolerance by targeting Foxp3(+) regulatory T cells mitigates Alzheimer's disease pathology. Nat Commun 6: 7967 [DOI] [PMC free article] [PubMed] [Google Scholar]
- 45. Lee YJ, Choi DY, Choi IS, Kim KH, Kim YH, Kim HM, Lee K, Cho WG, Jung JK, Han SB et al (2012) Inhibitory effect of 4‐O‐methylhonokiol on lipopolysaccharide‐induced neuroinflammation, amyloidogenesis and memory impairment via inhibition of nuclear factor‐kappaB in vitro and in vivo models. J Neuroinflammation 9: 35 [DOI] [PMC free article] [PubMed] [Google Scholar]
- 46. Morris RG, Garrud P, Rawlins JN, O'Keefe J (1982) Place navigation impaired in rats with hippocampal lesions. Nature 297: 681–683 [DOI] [PubMed] [Google Scholar]
- 47. Jiang X, Chai GS, Wang ZH, Hu Y, Li XG, Ma ZW, Wang Q, Wang JZ, Liu GP (2015) CaMKII‐dependent dendrite ramification and spine generation promote spatial training‐induced memory improvement in a rat model of sporadic Alzheimer's disease. Neurobiol Aging 36: 867–876 [DOI] [PubMed] [Google Scholar]
- 48. Chittajallu R, Wester JC, Craig MT, Barksdale E, Yuan XQ, Akgül G, Fang C, Collins D, Hunt S, Pelkey KA et al (2017) Afferent specific role of NMDA receptors for the circuit integration of hippocampal neurogliaform cells. Nat Commun 8: 152 [DOI] [PMC free article] [PubMed] [Google Scholar]
- 49. Etherton M, Földy C, Sharma M, Tabuchi K, Liu X, Shamloo M, Malenka RC, Südhof TC (2011) Autism‐linked neuroligin‐3 R451C mutation differentially alters hippocampal and cortical synaptic function. Proc Natl Acad Sci USA 108: 13764–13769 [DOI] [PMC free article] [PubMed] [Google Scholar]
- 50. Koshelnick Y, Ehart M, Hufnagl P, Heinrich PC, Binder BR (1997) Urokinase receptor is associated with the components of the JAK1/STAT1 signaling pathway and leads to activation of this pathway upon receptor clustering in the human kidney epithelial tumor cell line TCL‐598. J Biol Chem 272: 28563–28567 [DOI] [PubMed] [Google Scholar]
- 51. Zhang Z, Li XG, Wang ZH, Song M, Yu SP, Kang SS, Liu X, Zhang Z, Xie M, Liu GP et al (2018) δ‐Secretase‐cleaved Tau stimulates Aβ production via upregulating STAT1‐BACE1 signaling in Alzheimer's disease. Mol Psychiatry 10.1038/s41380-018-0286-z [DOI] [PMC free article] [PubMed] [Google Scholar]
- 52. Myllykangas L, Polvikoski T, Sulkava R, Verkkoniemi A, Crook R, Tienari PJ, Pusa AK, Niinistö L, O'Brien P, Kontula K et al (1999) Genetic association of alpha2‐macroglobulin with Alzheimer's disease in a Finnish elderly population. Ann Neurol 46: 382–390 [PubMed] [Google Scholar]
Associated Data
This section collects any data citations, data availability statements, or supplementary materials included in this article.
Supplementary Materials
Appendix
Expanded View Figures PDF
Source Data for Appendix and Expanded View
Review Process File
Source Data for Figure 1
Source Data for Figure 2
Source Data for Figure 3
Source Data for Figure 4
Source Data for Figure 6
Source Data for Figure 7


