

Abstract
Xp11.2 translocation renal cell carcinoma (Xp11 tRCC) is a rare sporadic pediatric kidney cancer caused by constitutively active TFE3 fusion proteins. Tumors in patients with Xp11 tRCC tend to recur and undergo frequent metastasis, in part due to lack of methods available to detect early‐stage disease. Here we generated transgenic (Tg) mice overexpressing the human PRCC‐TFE3 fusion gene in renal tubular epithelial cells, as an Xp11 tRCC mouse model. At 20 weeks of age, mice showed no histological abnormalities in kidney but by 40 weeks showed Xp11 tRCC development and related morphological and histological changes. MicroRNA (miR)‐204‐5p levels in urinary exosomes of 40‐week‐old Tg mice showing tRCC were significantly elevated compared with levels in control mice. MicroRNA‐204‐5p expression also significantly increased in primary renal cell carcinoma cell lines established both from Tg mouse tumors and from tumor tissue from 2 Xp11 tRCC patients. All of these lines secreted miR‐204‐5p‐containing exosomes. Notably, we also observed increased miR‐204‐5p levels in urinary exosomes in 20‐week‐old renal PRCC‐TFE3 Tg mice prior to tRCC development, and those levels were equivalent to those in 40‐week‐old Tg mice, suggesting that miR‐204‐5p increases follow expression of constitutively active TFE3 fusion proteins in renal tubular epithelial cells prior to overt tRCC development. Finally, we confirmed that miR‐204‐5p expression significantly increases in noncancerous human kidney cells after overexpression of a PRCC‐TFE3 fusion gene. These findings suggest that miR‐204‐5p in urinary exosomes could be a useful biomarker for early diagnosis of patients with Xp11 tRCC.
Keywords: biomarker, exosome, miRNA, urine, Xp11 tRCC
1. INTRODUCTION
Renal cell carcinoma (RCC), the most common kidney cancer, originates from renal tubular epithelium and includes various subtypes.1 One subtype, TFE3 Xp11 translocation RCC (tRCC),2 initially described in 1996,3, 4 was included in 2004 in the World Health Organization classification of renal cell tumors.1, 5 Translocation RCC, once considered rare, is now known to be the cause of RCC in 42% of RCCs seen in children and young adults.6 Xp11 tRCC is characterized by a chromosomal translocation with a breakpoint at Xp11.2 in the TFE3 gene,2, 7 which encodes a member of the microphthalmia transcription factor (MiT) family.8, 9 Five TFE3 gene fusions (PRCC‐TFE3, ASPSCR1‐TFE3, SFPQ‐TFE3, NONO‐TFE3, and CLTC‐TFE3) have been identified in patients with Xp11 tRCC,2, 3, 7, 10 and ASPSCR1‐TFE3 is also known to cause alveolar soft part sarcoma (ASPS).2, 7 All of these fusion genes give rise to constitutively active, chimeric TFE3 proteins.2, 7 Clinically, Xp11 tRCC has the propensity to become an aggressive cancer and is often marked by recurrence and metastasis.11 However, RCCs, including Xp11 tRCC, do not generally show early clinical symptoms, and there are as yet no early diagnostic markers for RCC.
Liquid biopsy, defined as analysis of nucleic acids in body fluids, such as blood, urine, or saliva, is minimally invasive relative to conventional biopsy and is receiving attention as a potential cancer diagnostic to assess response to treatment and monitor recurrence.12, 13, 14 Numerous microRNAs (miRNAs) derived from tumor cells reportedly reside in body liquids,14, 15, 16 often interacting with proteins in microvesicles, such as exosomes, where they are resistant to ribonucleases and thus more stable.14, 17, 18 MicroRNA expression profiles reportedly differ between cancer types,19 and recent studies showed that miRNAs in body liquids could serve as biomarkers to diagnose lung, breast, colorectal, and renal cancers.14, 20, 21, 22, 23
One hurdle to developing diagnostic biomarkers for rare cancers, including Xp11 tRCC, is difficulty in obtaining sufficient clinical samples. Here, we overcome this hurdle by generating transgenic (Tg) mice overexpressing a human PRCC‐TFE3 fusion gene in renal tubular epithelial cells as an Xp11 tRCC mouse model. We observed increased microRNA (miR)‐204‐5p levels in urinary exosomes from renal PRCC‐TFE3 Tg mice compared to control mice. Moreover, miR‐204‐5p expression levels were significantly elevated in primary cancer cell lines established either from tumors from renal PRCC‐TFE3 Tg mice or tumors from 2 independent human Xp11 tRCC patients, and these cancer cells secreted miR‐204‐5p‐containing exosomes. Interestingly, we also observed increased miR‐204‐5p levels in urinary exosomes from renal PRCC‐TFE3 Tg mice prior to tRCC development, suggesting that miR‐204‐5p increases as a consequence of constitutively active TFE3 chimeric proteins in renal tubular epithelial cells rather than as a consequence of tRCC development. We conclude that miR‐204‐5p in urinary exosomes could be a useful biomarker for early diagnosis of patients with Xp11 tRCC.
2. MATERIALS AND METHODS
2.1. Animal studies
The Institutional Animal Care and Use Committee of Kumamoto University (Kumamoto, Japan) approved all experiments in accordance with international and national guidelines. All animals were bred in a mouse house with automatically controlled lighting (12 hours on, 12 hours off), and maintained at a stable temperature of 23°C. Genetically engineered mice used in this study were Tg mice overexpressing Cre driven by the murine Cadherin16 promoter (Cdh16‐Cre)24 on a C57BL/6N background. Procedures for urine collection, kidney echography, and measurement of blood urea nitrogen and creatinine concentrations in serum samples are provided in Data S1.
2.2. Generation of Rosa26 PRCC‐TFE3/+ transgenic mice
A donor vector used to generate Rosa26 PRCC‐TFE3/+ Tg mice was constructed using the pRosa26‐DEST vector (Addgene, Watertown, MA, USA), according to the manufacturer's instructions. For combinational use of the CRISPR/Cas (clustered regularly interspaced short palindromic repeats/CRISPR associated proteins) system, a set of single guide RNA oligos (5′‐caccGACTGGAGTTGCAGATCACG‐3′ and 5′‐aaacCGTGATCTGCAACTCCAGTC‐3′) was cloned into BbsI‐digested pX330 vector (Addgene). Cells (2 × 10⁶) from the C57BL/6‐derived ES line 6NK725 were coelectroporated with 10 μg of a circular form of the donor vector harboring the human PRCC‐TFE3 fusion gene plus 7.5 μg pX330 plasmid using Nucleofector (Lonza, Basel, Switzerland) and then plated on 10‐cm plates. G418 (160 μg/mL) selection was begun 24 hours later, and then 8 days later, 36 colonies were picked and stocked. Chimeric mice were produced by aggregation of ES cells with 8‐cell embryos of ICR mice (CLEA, Tokyo, Japan). Chimeric male founders were mated with C57BL/6NJcl females (CLEA) to generate F1 heterozygotes for the Rosa26 PRCC‐TFE3/+ line. Genotyping of tail DNA was carried out using the following the primers: Rosa26‐S (5′‐GTTTCCGACTTGAGTT‐3′) and Rosa26‐AS (5′‐AACCCCAGATGACTAC‐3′) to detect the WT allele; and mRosa26‐S (5′‐GGCGGACTGGCGGGACTA‐3′) and mRosa26‐AS (5′‐GGGACAGGATAAGTATGACATCATCAAGG‐3′) to detect the mutant allele.
2.3. Cell culture
The mouse renal tubular epithelial cell line M‐1 and the human renal tubular epithelial cell line HK‐2 were obtained from ATCC (Manassas, VA, USA). M‐1 cells, mouse tRCC cell lines, and human immortalized Xp11 tRCC cell lines (UOK120 and UOK124)3 were maintained in DMEM supplemented with 10% FCS. HK‐2 cells were maintained in DMEM/F‐12 medium supplemented with 10% FCS under 5% CO2 and 95% air.
Human embryonic HEK293 cells harboring a PRCC‐TFE3 fusion gene (HEK293/PRCC‐TFE3) were maintained in DMEM containing 10% FCS, 150 μg/mL hygromycin, and 15 μg/mL blasticidin. To induce expression of the fusion gene, cells were treated with 100 ng/mL doxycycline for 48 hours.
For PRCC‐TFE3 knockdown, human Xp11 tRCC cells and HEK293/PRCC‐TFE3 cells were transfected with 1 of 2 TFE3‐specific siRNAs or with negative control siRNA. Details relevant to PRCC‐TFE3 knockdown are provided in Data S1.
2.4. Immunocytochemistry
Immunocytochemical analysis of cultured cells was carried out with anti‐TFE3 Ab (Sigma‐Aldrich, St. Louis, MO, USA). Details relevant to immunocytochemistry are provided in Data S1.
2.5. Histological analysis
Histological analysis was undertaken as described.26 In brief, mouse kidney tissue samples were fixed in 4% paraformaldehyde overnight, embedded in paraffin, and cut in 4‐μm‐thick sections. Sections were then deparaffinized, stained with H&E, and analyzed using a BZ‐X710 microscope (Keyence, Osaka, Japan).
2.6. Immunohistochemistry
For TFE3 immunohistochemistry, deparaffinized sections were pretreated with 3% H2O2 in TBS (pH 7.6) to inhibit endogenous peroxidases. Sections were then heated to 121°C for 15 minutes in Target Retrieval Solution (Dako Japan, Tokyo, Japan), blocked with 5% goat serum, and incubated with anti‐TFE3 Ab (Sigma‐Aldrich, 1:100) overnight at 4°C. After washing with TBS, sections were incubated with EnVision+System‐HRP Labelled Polymer Anti‐Rabbit (Dako Japan) as secondary Ab for 1 hour at room temperature. Sections were washed with TBS, and peroxidase activity was visualized by incubation with a 3,3‐diaminobenzidine solution followed by hematoxylin counterstaining. Images were analyzed using a BZ‐X710 microscope (Keyence).
2.7. Quantitative PCR array analysis of miRNAs
Quantitative PCR array analysis of miRNAs in urinary exosomes was carried out using miRCURY LNA miRNA Custom PCR Panels (Exiqon; Qiagen, Hilden, Germany). Detailed information about quantitative PCR (qPCR) array analysis is provided in Data S1.
2.8. Exosome isolation
Mouse and human tRCC cell lines were maintained in DMEM containing 10% FCS and then changed to serum‐free medium for 48 hours. Medium was then collected, centrifuged at 10 000 g for 30 minutes at room temperature, and concentrated with a Vivaspin‐20 concentrator (Sartorius, Göttingen, Germany). These concentrated samples served as culture supernatants. Exosomes were isolated from supernatants using the MagCapture Esoxome Isolation Kit PS (FujiFilm Wako, Osaka, Japan).
Urinary exosomes were isolated from pooled urine samples (3 mL) from mice using the miRCURY Exosome Isolation Kit (Exiqon; Qiagen).
2.9. Quantitative real‐time PCR
For real‐time PCR analysis of TRPM1 and TRPM1 genes, PCR was carried out using TB Green Premix Ex Taq II (TaKaRa Bio, Shiga, Japan). Primer pairs are shown in Table S1. Relative transcript abundance was normalized to that of RPS18. For real‐time PCR analysis of miRNAs, PCR was carried out using a miRCURY LNA SYBR Green PCR Kit (Exiqon; Qiagen) and miRCURY LNA Universal RT microRNA PCR Primers (Exiqon; Qiagen) (Table S2). Relative transcript abundance was normalized to that of miR‐103‐3p. Detailed information relevant to quantitative real‐time PCR is provided in Data S1.
2.10. Western blot analysis
Protein extracts were subjected to SDS‐PAGE, and proteins were electrotransferred to PVDF membrane. Immunoblotting was undertaken with Abs against TFE3 (Sigma‐Aldrich), GAPDH (D16H11; Cell Signaling Technology, Danvers, MA, USA), histone H3 (D1H2; Cell Signaling Technology), and Hsc70 (B‐6; Santa Cruz Biotechnology, Dallas, TX, USA). Detailed information relevant to protein extraction from cultured cells is provided in Data S1.
2.11. Statistics
Statistical significance was assessed using Student's t test or the Mann‐Whitney U test. Mouse survival data were analyzed by the Kaplan‐Meier log‐rank test using JMP7 software (SAS Institute, Cary, NC, USA). Data are presented as means ± SEM, and a P value of <.05 is defined as statistically significant.
3. RESULTS
3.1. Generation of Xp11 tRCC model mice
To establish a tRCC model mouse, we first generated Tg mice conditionally overexpressing a human PRCC‐TFE3 fusion gene in the Rosa26 locus (Rosa26 PRCC‐TFE3/+ Tg mice) using homologous recombination (Figure 1A). To express the fusion gene in renal tubular epithelial cells, Rosa26 PRCC‐TFE3/PRCC‐TFE3 Tg mice were bred with Cadherin16 (Cdh16)‐Cre Tg mice24 to establish Xp11 tRCC model (renal PRCC‐TFE3 Tg mice) mice (Figure 1B). Rosa26 PRCC‐TFE3/+ Tg mice served as controls.
Figure 1.
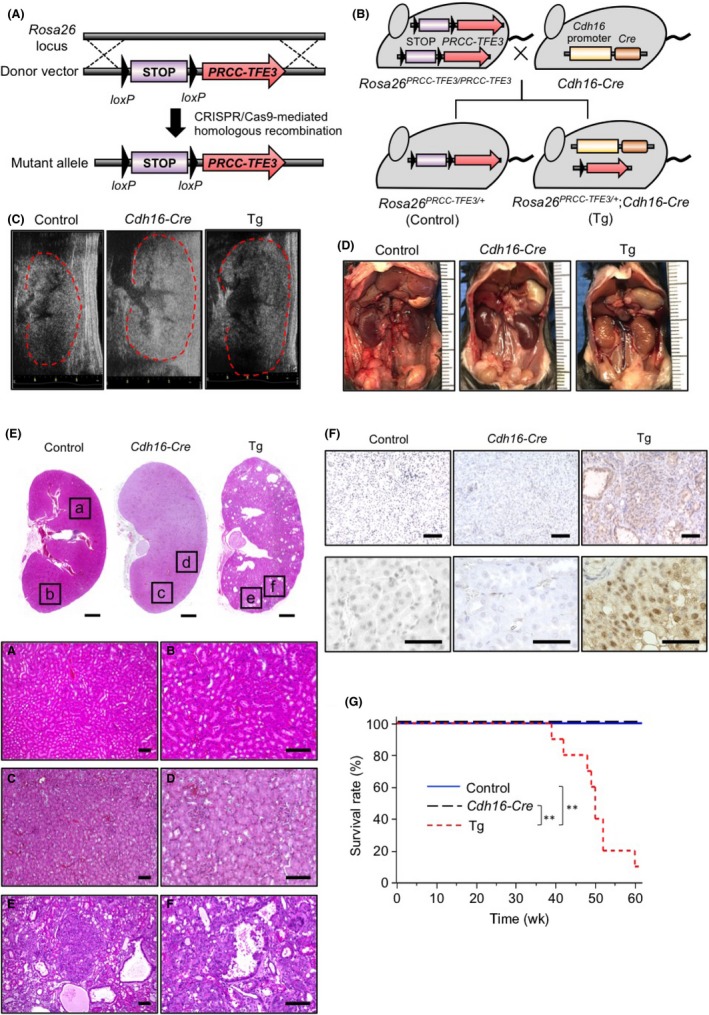
Generation of an Xp11 translocation renal cell carcinoma mouse model. A,B, Schematic showing the WT Rosa26 locus, the donor vector used to generate Rosa26 PRCC ‐ TFE 3/+ transgenic (Tg) mice, and the mutant allele (Rosa26 PRCC ‐ TFE 3/+) after CRISPR/Cas9‐mediated homologous recombination (A). Renal PRCC‐TFE3 Tg (Rosa26 PRCC ‐ TFE 3/+ and Cadherin16 [Cdh16]‐Cre), and control (Rosa26 PRCC ‐ TFE 3/+) mice were generated by breeding Rosa26 PRCC ‐ TFE 3/ PRCC ‐ TFE 3 Tg with Cdh16‐Cre Tg mice (B). C, Representative echography recordings of right kidney of 30‐wk‐old control (Control), Cdh16‐Cre, and renal PRCC‐TFE3 Tg (Tg) mice. D, Gross appearance of kidney of 40‐wk‐old control, Cdh16‐Cre, and renal PRCC‐TFE3 Tg mice. E, Representative H&E‐stained images of longitudinal sections of kidney tissues of 40‐wk‐old control, Cdh16‐Cre, and renal PRCC‐TFE3 Tg mice. Bottom panels are magnifications of corresponding squares at top. Scale bar, 1 mm (top), 100 μm (bottom). F, Immunohistochemical staining for TFE3 in kidney tissues of 40‐wk‐old control, Cdh16‐Cre, and renal PRCC‐TFE3 Tg mice. Scale bar, 100 μm (top), 50 μm (bottom). G, Kaplan‐Meier survival curves of control (n = 10), Cdh16‐Cre (n = 9), and renal PRCC‐TFE3 Tg (n = 10) mice. **P < .001, log‐rank test
To assess tRCC development in model mice, we undertook echography of the kidney of control and renal PRCC‐TFE3 Tg mice every 10 weeks from 10 to 40 weeks of age. We observed no difference between control and Tg mice at either 10 or 20 weeks of age (Figure S1). However, at 30 and 40 weeks, renal PRCC‐TFE3 Tg mice showed renal swelling relative to control or Cdh16‐Cre mice (Figure 1C,D). Histological analysis of kidney tissues from 40‐week‐old mice also revealed the disappearance of the boundary of the renal cortex and medulla, as well as dilated renal tubules showing multilayered tubular epithelium, cyst formation, and tumor development with papillary structure in Tg but not control or Cdh16‐Cre mice (Figure 1E). Immunohistochemistry for TFE3 revealed no TFE3‐positive cells in kidney tissues of control or Cdh16‐Cre mice; however, renal tubular epithelial cells and tumor cells in kidney tissues of renal PRCC‐TFE3 Tg mice showed markedly increased expression of PRCC‐TFE3 chimeric proteins localized in cell nuclei (Figure 1F). Moreover, survival of renal PRCC‐TFE3 Tg mice was significantly shortened compared with that of control or Cdh16‐Cre mice (Figure 1G). The overall time course of these changes indicates that precancerous changes occurring in kidney tissue are detectable in renal PRCC‐TFE3 Tg mice.
Although renal PRCC‐TFE3 Tg mice showed shortened survival periods, they exhibited no signs of tumor metastasis. Moreover, we observed no significant difference in body weight between control and renal PRCC‐TFE3 Tg mice at 20 weeks of age; in contrast, by 40 weeks, renal PRCC‐TFE3 Tg mice showed significantly decreased body weight compared with control mice (Figure S2A). In addition, at 40 weeks of age, levels of serum blood urea nitrogen and creatinine in renal PRCC‐TFE3 Tg mice were significantly higher than those seen in control mice (Figure S2B), suggestive of renal failure. Taken together, these results suggest that the cause of death of renal PRCC‐TFE3 Tg mice was likely debilitation due to tumor development‐associated renal failure.
3.2. Elevated miR‐204‐5p and miR‐211‐5p levels in urinary exosomes are associated with Xp11 tRCC development
Several miRNAs are reportedly targets of TFE3 fusion proteins.2, 27, 28, 29 Given the nuclear accumulation of PRCC‐TFE3 fusion proteins seen in Tg mice (Figure 1E), we hypothesized that some miRNAs might be secreted into the urine. To examine this possibility, we carried out qPCR array analysis of miRNAs in urinary exosomes isolated from pooled urine of 30‐week‐old control or renal PRCC‐TFE3 Tg mice (Figure 2A). Of 754 miRNAs examined, we excluded 739 from further analysis based on the following criteria: (a) a raw Cq value of samples from Tg mice of >37, (b) a ratio of miRNA levels from Tg vs control mice of <5.0, and (c) lack of conservation with human miRNAs. We then undertook qPCR analysis of the 15 remaining miRNAs at both 20 and 40 weeks of age in both Tg and control mice (Figure 2B). Levels of 13 of the 15 candidates did not differ significantly between control and Tg mice. Of the remaining 2 candidates, levels of miR‐204‐5p significantly increased in Tg mice relative to controls at both 20 and 40 weeks of age. A second candidate, miR‐211‐5p, was not detected in urinary exosomes of control mice at either 20 or 40 weeks, whereas Tg mice showed significant levels of miR‐211‐5p in urinary exosomes at both time points. Moreover, levels of both miR‐204‐5p and miR‐211‐5p in urinary exosomes were comparable in 20‐ and 40‐week‐old Tg mice, suggesting that changes in their expression are detectable prior to overt tRCC development.
Figure 2.
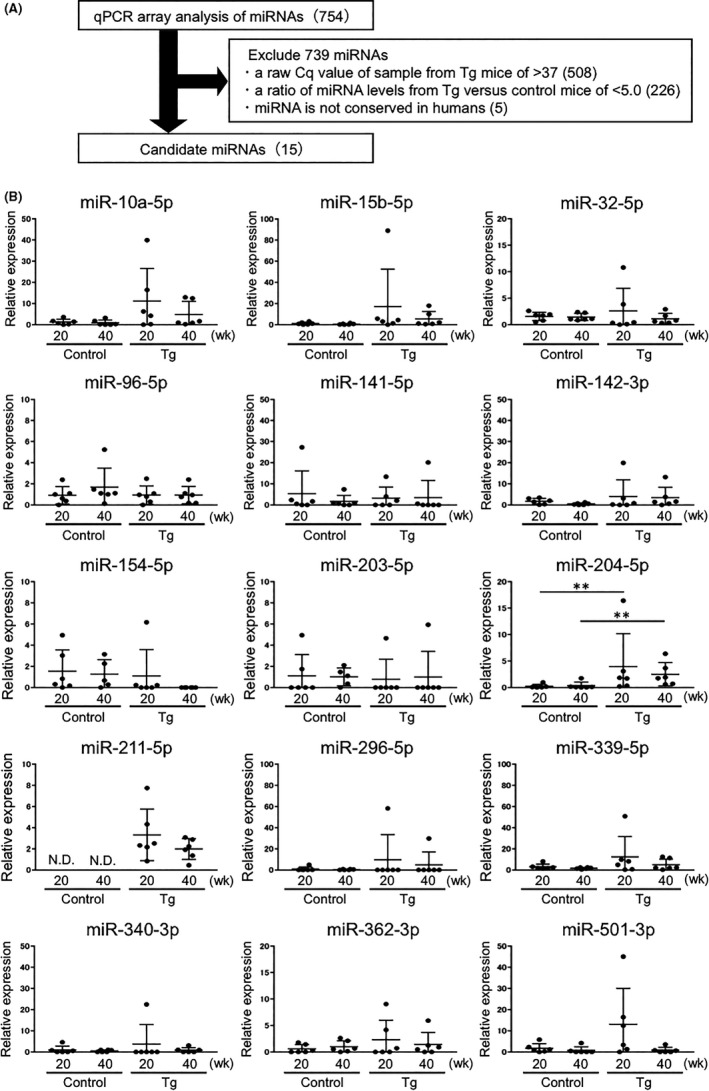
Analysis of microRNA (miRNA) levels in urinary exosomes of renal PRCC‐TFE3 transgenic (Tg) mice. A, Overview of the quantitative PCT (qPCR) array analysis‐based screening of miRNAs in urinary exosomes of renal PRCC‐TFE3 Tg mice to identify biomarker candidates. The qPCR array analysis was carried out using exosomal RNA isolated from pooled urine of 30‐wk‐old control and renal PRCC‐TFE3 Tg mice. The number of candidates excluded based on indicated criteria is shown in parentheses. B, Relative expression levels of 15 candidate miRNAs in exosomes isolated from urine samples from 20‐ or 40‐wk‐old control (Control) and renal PRCC‐TFE3 Tg (Tg) mice (n = 6). Data are means ± SEM. **P < .01. N.D., not detected
3.3. Exosomes containing miR204‐5p and miR‐211‐5p are secreted from cancer cells
We next asked whether miR‐204‐5p and miR‐211‐5p are secreted from cancer cells in kidneys of renal PRCC‐TFE3 Tg mice. To do so, we independently established 2 cancer cell lines, tRCC1 and tRCC2, from tumor tissues from 2 Tg mice. Immunoblotting analysis using a TFE3 Ab revealed marked expression of the PRCC‐TFE3 fusion protein in both lines (Figures 3A and S3A). We also detected endogenous TFE3 in the mouse renal tubular epithelial cell line M‐1, although its expression level was lower than that of PRCC‐TFE3 fusion proteins in tRCC1 and tRCC2 lines (Figures 3A and S3A). Furthermore, we observed nuclear accumulation of PRCC‐TFE3 fusion proteins in tRCC1 and tRCC2 lines but did not observe nuclear endogenous TFE3 proteins in M‐1 cells (Figures 3B and S3B).
Figure 3.
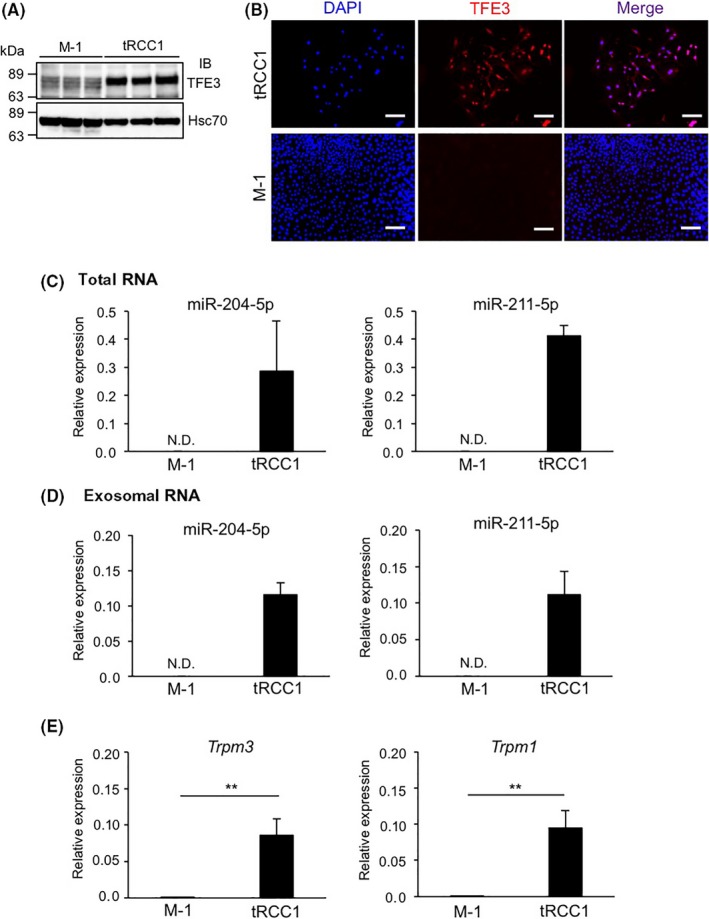
MicroRNA (miR)‐204‐5p and miR‐211‐5p are upregulated in a cancer cell line established from tumor tissues of renal PRCC‐TFE3 transgenic (Tg) mice. A, Representative immunoblotting (IB) of endogenous TFE3 protein or PRCC‐TFE3 chimeric protein in the mouse renal tubular epithelial cell line M‐1 and the translocation renal cell carcinoma cell line tRCC1. Hsc70 served as a loading control. B, Immunofluorescent staining for TFE3 (red) in M‐1 and tRCC1 cells. Nuclei were counterstained with DAPI (blue). Scale bar, 100 μm. C,D, Relative miR‐204‐5p and miR‐211‐5p levels in total RNA isolated from M‐1 and tRCC1 cells (n = 4) (C) and exosomal RNA isolated from M‐1 and tRCC cell supernatants (n = 3) (D). E, Relative Trpm3 and Trpm1 expression in M‐1 and tRCC cells (n = 6). Data are means ± SEM. **P < .01. N.D., not detected
We next assessed miR‐204‐5p and miR‐211‐5p expression levels in tRCC1, tRCC2, and M‐1 lines (Figures 3C and S3C). We did not detect miR‐204‐5p or miR‐211‐5p in M‐1 cells; however, tRCC1 and tRCC2 cells abundantly expressed both miRNAs. MicroRNA‐204‐5p levels in exosomes isolated from supernatants of cultured tRCC1 and tRCC2 cells were also elevated compared to levels seen in M‐1 cells (Figures 3D and S3D). However, we did not detect miR‐211‐5p in exosomes from tRCC2 cell supernatants (Figure S3D). Overall, these results suggest that exosomes containing miR‐204‐5p or miR‐211‐5p are secreted from some tRCC lines.
In humans and mice, miR‐211 and miR‐204 genes are contained in introns of transient receptor potential cation channel subfamily M member 1 (TRPM1) and TRPM3 genes, respectively, suggesting that expression of both miRNAs and TRPM1 or TRPM3 is coregulated by PRCC‐TFE3 fusion proteins. To investigate this possibility, we monitored Trpm1 and Trpm3 expression in tRCC1, tRCC2, and M‐1 lines (Figures 3E and S3E). In tRCC1 and tRCC2 lines, Trpm1 and Trpm3 expression levels were significantly increased relative to levels seen in M‐1 cells, suggesting that expression of miR‐211‐5p and miR‐204‐5p as well as Trpm1 and Trpm3 is positively correlated with expression of PRCC‐TFE3 fusion proteins in kidney cancer cells.
3.4. Presence of TFE3 fusion proteins increases miR‐204‐5p and miR‐211‐5p expression in human kidney cells
To assess whether miR‐204‐5p and miR‐211‐5p could serve as diagnostic markers of pretumorigenic stages of Xp11 tRCC, we first monitored miR‐204‐5p and miR‐211‐5p expression in the HEK293/PRCC‐TFE3 cell line, which is a human embryonic kidney cell line (HEK293) harboring a doxycycline‐dependent PRCC‐TFE3 fusion gene (Figure 4). As expected, levels of PRCC‐TFE3 fusion proteins markedly increased in doxycycline‐treated relative to untreated HEK293/PRCC‐TFE3 cells, and those proteins were predominantly nuclear in doxycycline‐treated cells (Figure 4A,B). Expression levels of both miR‐204‐5p and miR‐211‐5p significantly increased in doxycycline‐treated relative to untreated HEK293/PRCC‐TFE3 cells (Figure 4C), as did TRPM1 and TRPM3 expression (Figure 4D). These results suggest that TFE3 fusion proteins could upregulate expression of miR‐204‐5p, miR‐211‐5p, and TRPM genes in human kidney cells.
Figure 4.
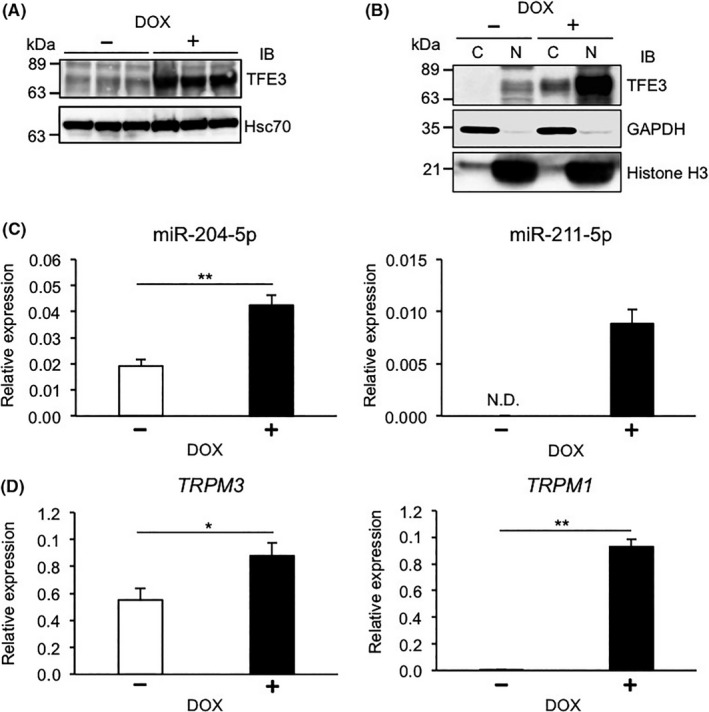
Presence of PRCC‐TFE3 fusion proteins in HEK293 cells increases expression of microRNA (miR)‐204‐5p, miR‐211‐5p, and TRPM genes. A, Representative immunoblot (IB) of endogenous TFE3 protein and PRCC‐TFE3 fusion protein in HEK293/PRCC‐TFE3 cells treated with (+) or without (−) doxycycline (DOX). Hsc70 served as a loading control. B, Representative immunoblot showing endogenous TFE3 proteins and PRCC‐TFE3 fusion proteins in cytoplasmic (C) or nuclear (N) fractions of HEK293/PRCC‐TFE3 cells treated with or without DOX. GAPDH and histone H3 served as loading controls for cytoplasmic and nuclear fractions, respectively. C, Relative miR‐204‐5p and miR‐211‐5p expression in HEK293/PRCC‐TFE3 cells treated with or without DOX (n = 4). D, Relative TRPM3 and TRPM1 expression in HEK293/PRCC‐TFE3 cells treated with or without DOX (n = 4). Data are means ± SEM. *P < .05; **P < .01. N.D., not detected
3.5. Expression of miR‐204‐5p and TRPM3 is upregulated in human Xp11 tRCC cell lines
To determine whether miR‐204‐5p and miR‐211‐5p expression increases in tumors of Xp11 tRCC patients, we assessed expression of both miRNAs and of TRPM genes in the human UOK120 and UOK124 lines, which were established from tumor tissues of 2 independent Xp11 tRCC patients.3 The molecular weight of PRCC‐TFE3 fusion proteins reportedly varies due to differences in PRCC and TFE3 gene breakpoints in individual patients.2 Accordingly, immunoblotting analysis with the TFE3 Ab revealed that UOK120 and UOK124 cells abundantly express PRCC‐TFE3 fusion proteins of ~78 and ~125 kDa, respectively. In addition, expression levels of these fusion proteins were higher than those of endogenous TFE3 proteins in the human renal tubular epithelial cell line HK‐2, and fusion proteins were predominantly nuclear in that line (Figure 5A,B).
Figure 5.
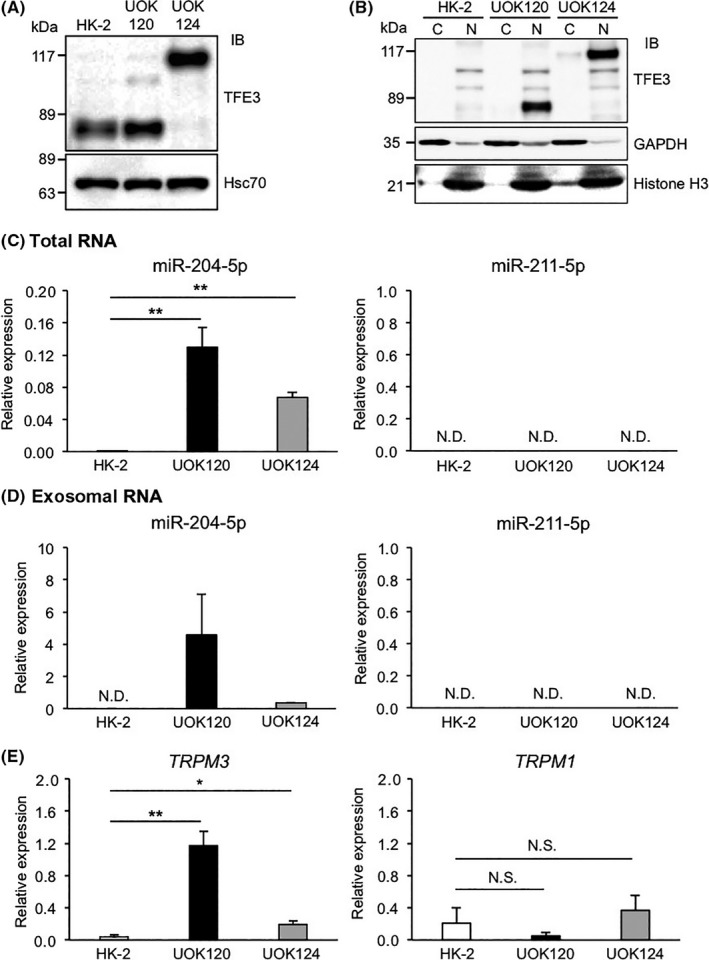
Expression of microRNA (miR)‐204‐5p and TRPM3 increases in human Xp11 translocation renal cell carcinoma (tRCC) lines. A, Representative immunoblot (IB) of endogenous TFE3 proteins and PRCC‐TFE3 fusion proteins in the human renal tubular epithelial cell line HK‐2 and in the human Xp11 tRCC lines UOK120 and UOK124. Hsc70 served as a loading control. B, Representative immunoblot of endogenous TFE3 protein and PRCC‐TFE3 fusion proteins in cytoplasmic (C) and nuclear (N) fractions of HK‐2, UOK120, and UOK124 cells. GAPDH and histone H3 served as loading controls for cytoplasmic and nuclear fractions, respectively. C,D, Relative miR‐204‐5p and miR‐211‐5p levels in total RNA isolated from HK‐2 and human Xp11 tRCC cells (n = 4) (C) and exosomal RNA isolated from culture supernatants of HK‐2 and human Xp11 tRCC cells (n = 3) (D). E, Relative TRPM3 and TRPM1 expression in HK‐2 and human Xp11 tRCC cells (n = 6). Data are means ± SEM. *P < .05; **P < .01. N.D., not detected; N.S., no statistical difference
We next examined miR‐211‐5p and miR‐204‐5p expression in UOK120, UOK124, and HK‐2 cells (Figure 5C). Unexpectedly, miR‐211‐5p was not detectable in any of the 3 lines; however, miR‐204‐5p expression levels in UOK120 and UOK124 cells were significantly higher than those in HK‐2 cells. Moreover, miR‐211‐5p was not detected in exosomes from cultured UOK120 and UOK124 cell supernatants, whereas miR‐204‐5p levels in exosomes isolated from supernatants from both lines were significantly higher than those in HK‐2 cells (Figure 4D). Accordingly, we observed no difference in TRPM1 expression among UOK120, UOK124, and HK‐2 cells, whereas TRPM3 expression levels significantly increased in UOK120 and UOK124 relative to HK‐2 cells (Figure 5E). These results show that expression of both miR‐204‐5p and TRPM3 is upregulated in human Xp11 tRCC cells and that human Xp11 tRCC cells secrete exosomes containing miR‐204‐5p.
3.6. PRCC‐TFE3 knockdown decreases expression of miR‐204‐5p and TRPM3 in noncancerous kidney cells but not in human Xp11 tRCC cells
Finally, to determine whether PRCC‐TFE3 fusion proteins regulate miR‐204‐5p and TRPM3 expression in human Xp11 tRCC cells, we transfected UOK120 and UOK124 cells with negative control siRNA (siControl) or with 1 of 2 TFE3‐specific siRNAs (siTFE3‐1 and siTFE3‐2) (Figure S4). Immunoblotting analysis revealed decreased levels of PRCC‐TFE3 fusion proteins in siTFE3‐1‐ or siTFE3‐2‐transfected Xp11 tRCC cells relative to control cells (Figure S4A). Given that siTFE3‐2 more potently decreased fusion protein levels in both UOK120 and UOK124 cells, we used it in further knockdown analyses.
Unexpectedly, expression levels of miR‐204‐5p in PRCC‐TFE3‐knockdown cells were comparable to those seen in control cells (Figure S4B). In addition, TRPM3 expression was comparable in PRCC‐TFE3‐knockdown and control cells (Figure S4C). We further examined the effect of PRCC‐TFE3 knockdown on expression of miR‐204‐5p and TRPM3 in the inducible HEK293/PRCC‐TFE3 cell line (Figure S5). Levels of PRCC‐TFE3 fusion proteins in doxycycline‐treated HEK293/PRCC‐TFE3 cells also markedly decreased following transfection with siTFE3‐2 (Figure S5A). Furthermore, PRCC‐TFE3 knockdown significantly reduced expression levels of miR‐204‐5p and TRPM3 in doxycycline‐treated HEK293/PRCC‐TFE3 cells (Figure S5B,C). Taken together, these results suggest that expression of both miR‐204‐5p and TRPM3 in noncancerous kidney cells is upregulated in a TFE3 fusion protein‐dependent manner, whereas TFE3 fusion proteins are no longer required for their expression in Xp11 tRCC cells.
4. DISCUSSION
Here, we show that miR‐204‐5p levels in urinary exosomes from our established Xp11 tRCC mouse model significantly increase relative to those in control mice. Significantly, these increases occurred at time points prior to overt tRCC development. We also show significantly increased expression of miR‐204‐5p and TRPM3 not only in cancer cell lines established from tumor tissues of renal PRCC‐TFE3 Tg mice or human Xp11 tRCC patients, but also in noncancerous human kidney cells overexpressing the PRCC‐TFE3 fusion gene. Moreover, we found that tRCCs secrete exosomes containing miR‐204‐5p. These findings suggest that the presence of miR‐204‐5p in urinary exosomes could be a useful biomarker for early detection of Xp11 tRCC.
Experimentally, we observed tRCC development in kidney tissues of 30‐ and 40‐week‐old renal PRCC‐TFE3 Tg mice, but that development was not apparent in 10‐ or 20‐week‐old Tg mice. However, levels of miR‐204‐5p in urinary exosomes were already detectable in 20‐week‐old Tg mice. We also observed no difference in miR‐204‐5p levels in urinary exosomes in Tg mice between 20 and 40 weeks of age. Moreover, PRCC‐TFE3 fusion proteins accumulated in the nuclei of renal tubular epithelial cells in Tg mice. These findings suggest that increased miR‐204‐5p levels in the urinary exosomes occur following expression of constitutively active PRCC‐TFE3 fusion proteins before overt tRCC development and progression. These observations support the idea that miR‐204‐5p in urinary exosomes could serve as an early diagnostic biomarker of Xp11 tRCC progression at pretumorigenic disease stages.
Renal cell carcinomas, including Xp11 tRCC, show few early clinical symptoms. In addition, Xp11 tRCC in humans often recurs and metastasizes, and patients show poor prognosis.11 However, if a patient's tumor is detected early, before metastasis, surgical resection is associated with cure in a high percentage of patients. Typical metastasis of RCCs occurs in lung, bone, liver, and lymph node,30 suggesting that detecting significant increases of miR‐204‐5p in circulation could be useful to monitor the possibility of metastasis in these patients. Future studies are necessary to investigate whether alterations in exosomal miR‐204‐5p levels are detectable in other body fluids, such as blood, of patients with advanced Xp11 tRCC.
Our study also shows that, in addition to miR‐204‐5p, expression levels of miR‐211‐5p increase in urinary exosomes of renal PRCC‐TFE3 Tg mice, in primary tRCC cell lines established from tumor tissues of renal PRCC‐TFE3 Tg mice, and in HEK293 cells overexpressing the PRCC‐TFE3 fusion gene. However, we did not detect miR‐211‐5p in human Xp11 tRCC lines that show abundant miR‐204‐5p expression. Recent studies have reported downregulated miR‐211‐5p expression in tumor tissues of human RCC patients and in several human RCC lines, and miR‐211‐5p also reportedly functions as a tumor suppressor in human RCC cells.31, 32 Collectively, these findings suggest that miR‐211‐5p expression in human Xp11 tRCC cells is silenced, as it is in other RCC cells. However, as we observed a significant increase in miR‐211‐5p levels in both urinary exosomes of 20‐week‐old renal PRCC‐TFE3 Tg mice and in PRCC‐TFE3‐overexpressing HEK293 cells, miR‐211‐5p silencing might not occur in renal tubular epithelial cells expressing constitutively active TFE3 fusion proteins at pretumorigenic Xp11 tRCC stages. It would be of interest to investigate whether either miR‐204‐5p or miR‐211‐5p contained in liquid biopsy samples predicts Xp11 tRCC occurrence in patients prior to overt tRCC development.
We showed that increased miR‐204‐5p levels in urinary exosomes from renal PRCC‐TFE3 Tg mice are correlated with tRCC progression. These results implicate miR‐204‐5p target genes in Xp11 tRCC development. We undertook an in silico analysis using the TargetScan database33 and observed miR‐204‐5p binding sites in the 3′‐UTR or ORF of 615 genes (Table S3). Among the top 100 target genes, several are associated with RCC. For example, 2 potential targets, von Hippel‐Lindau (VHL) and chromodomain helicase DNA binding protein 5 (CHD5), function as tumor suppressors in RCC.34, 35 Among others, high‐mobility group AT‐hook 2 (HMGA2) facilitates the epithelial‐mesenchymal transition of RCC cells36 and Ras‐related protein RAB22A accelerates RCC cell proliferation and invasion.37 Thus, miR‐204‐5p‐mediated inhibition of tumor suppressors might underlie the development and progression of Xp11 tRCC, although these mechanisms should be addressed in future studies.
Here, we showed that although human Xp11 tRCC cells show increased expression of miR‐204‐5p and TRPM3, PRCC‐TFE3 knockdown does not alter their expression. The MiT family proteins, including TFE3, activate transcription of targets through the E‐box consensus motif CANNTG,9 as do TFE3 fusion proteins.2, 9 Numerous transcription factors reportedly bind E‐boxes and some, such as myc and hypoxia‐inducible factor, are activated in human RCC cells.34, 38 These factors might also contribute to expression of both miR‐204‐5p and TRPM3 in Xp11 tRCC cells.
Loss‐of‐function germline mutations in folliculin (FLCN) cause development of RCC, fibrofolliculomas, and lung cysts in Birt‐Hogg‐Dube (BHD) syndrome.39, 40 FLCN reportedly inhibits TFE3 activation, and TFE3 protein is nuclear in tumor tissues of BHD patients.41 In addition, recent studies show that increased transcriptional activity of MiTF, a MiT family member, caused by a germline missense mutation in MiTF, increases the risk of developing RCC and melanoma.42 Furthermore, a different study reported that amplification of TFEB, another MiT family member, occurs in some RCC patients and that overexpressed TFEB proteins localize in tumor cell nuclei.43 Therefore, expression of miR‐204‐5p and TRPM3 could increase in MiT family protein‐activated renal tumors.
In summary, we found that miR‐204‐5p levels in urinary exosomes are significantly increased in both pretumorigenic and tumor developing stages in renal PRCC‐TFE3 Tg mice. We also report upregulated miR‐204‐5p expression in both human nontumor kidney cells harboring PRCC‐TFE3 fusion proteins and in human Xp11 tRCC cells, and that human Xp11 tRCC cells secrete exosomes containing miR‐204‐5p. We propose that estimation of miR‐204‐5p levels in urinary exosomes could be a useful biomarker to diagnose Xp11 tRCC at both pretumorigenic and advanced stages.
DISCLOSURE
The authors have no conflict of interest.
Supporting information
ACKNOWLEDGMENTS
We thank our colleagues for valuable suggestions and discussion. We also thank K. Tabu, N. Shirai, S. Iwaki, S. Ootaguro, and M. Kamada for technical assistance. This work was supported by the Scientific Research Fund of the Ministry of Education, Culture, Sports, Science and Technology (MEXT) of Japan (grant 18K07236 to T. Kadomatsu, grant 17K08663 to M. Endo), the Core Research for Evolutional Science and Technology (CREST) program of the Japan Science and Technology Agency (JST) (grant 13417915 to Y. Oike), the CREST program of the Japan Agency for Medical Research and Development (AMED) (grant JP18gm0610007 to Y. Oike), the Center for Metabolic Regulation of Healthy Aging (CMHA) (to R. Kurahashi and T. Kadomatsu), the Shin‐Nihon Foundation of Advanced Medical Research (to T. Kadomatsu), the Takeda Science Foundation (to T. Kadomatsu), and funded in part by Federal funds from the Frederick National Laboratory for Cancer Research, NIH, under contract HHSN261200800001E (L. S. Schmidt). This research was supported in part by the Intramural Research Program of the NIH, National Cancer Institute, Center for Cancer Research (W. M. Linehan).
Kurahashi R, Kadomatsu T, Baba M, et al. MicroRNA‐204‐5p: A novel candidate urinary biomarker of Xp11.2 translocation renal cell carcinoma. Cancer Sci. 2019;110:1897–1908. 10.1111/cas.14026
Ryoma Kurahashi and Tsuyoshi Kadomatsu contributed equally to this work.
Contributor Information
W. Marston Linehan, Email: linehanm@mail.nih.gov.
Yuichi Oike, Email: oike@gpo.kumamoto-u.ac.jp.
REFERENCES
- 1. Inamura K. Renal cell tumors: understanding their molecular pathological epidemiology and the 2016 WHO classification. Int J Mol Sci. 2017;18:2195. [DOI] [PMC free article] [PubMed] [Google Scholar]
- 2. Kauffman EC, Ricketts CJ, Rais‐Bahrami S, et al. Molecular genetics and cellular features of TFE3 and TFEB fusion kidney cancers. Nat Rev Urol. 2014;11:465‐475. [DOI] [PMC free article] [PubMed] [Google Scholar]
- 3. Sidhar SK, Clark J, Gill S, et al. The t(X;1)(p11.2;q21.2) translocation in papillary renal cell carcinoma fuses a novel gene PRCC to the TFE3 transcription factor gene. Hum Mol Genet. 1996;5:1333‐1338. [DOI] [PubMed] [Google Scholar]
- 4. Weterman MA, Wilbrink M, Geurts van Kessel A. Fusion of the transcription factor TFE3 gene to a novel gene, PRCC, in t(X;1)(p11;q21)‐positive papillary renal cell carcinomas. Proc Natl Acad Sci USA. 1996;93:15294‐15298. [DOI] [PMC free article] [PubMed] [Google Scholar]
- 5. Lopez‐Beltran A, Scarpelli M, Montironi R, Kirkali Z. 2004 WHO classification of the renal tumors of the adults. Eur Urol. 2006;49:798‐805. [DOI] [PubMed] [Google Scholar]
- 6. Cajaiba MM, Dyer LM, Geller JI, et al. The classification of pediatric and young adult renal cell carcinomas registered on the children's oncology group (COG) protocol AREN03B2 after focused genetic testing. Cancer. 2018;124:3381‐3389. [DOI] [PMC free article] [PubMed] [Google Scholar]
- 7. Ross H, Argani P. Xp11 translocation renal cell carcinoma. Pathology. 2010;42:369‐373. [DOI] [PubMed] [Google Scholar]
- 8. Martina JA, Diab HI, Li H, Puertollano R. Novel roles for the MiTF/TFE family of transcription factors in organelle biogenesis, nutrient sensing, and energy homeostasis. Cell Mol Life Sci. 2014;71:2483‐2497. [DOI] [PMC free article] [PubMed] [Google Scholar]
- 9. Raben N, Puertollano R. TFEB and TFE3: linking lysosomes to cellular adaptation to stress. Annu Rev Cell Dev Biol. 2016;32:255‐278. [DOI] [PMC free article] [PubMed] [Google Scholar]
- 10. Clark J, Lu YJ, Sidhar SK, et al. Fusion of splicing factor genes PSF and NonO (p54nrb) to the TFE3 gene in papillary renal cell carcinoma. Oncogene. 1997;15:2233‐2239. [DOI] [PubMed] [Google Scholar]
- 11. Ellis CL, Eble JN, Subhawong AP, et al. Clinical heterogeneity of Xp11 translocation renal cell carcinoma: impact of fusion subtype, age, and stage. Mod Pathol. 2014;27:875‐886. [DOI] [PubMed] [Google Scholar]
- 12. Perakis S, Speicher MR. Emerging concepts in liquid biopsies. BMC Med. 2017;15:75. [DOI] [PMC free article] [PubMed] [Google Scholar]
- 13. Crowley E, Di Nicolantonio F, Loupakis F, Bardelli A. Liquid biopsy: monitoring cancer‐genetics in the blood. Nat Rev Clin Oncol. 2013;10:472‐484. [DOI] [PubMed] [Google Scholar]
- 14. Cortez MA, Bueso‐Ramos C, Ferdin J, Lopez‐Berestein G, Sood AK, Calin GA. MicroRNAs in body fluids–the mix of hormones and biomarkers. Nat Rev Clin Oncol. 2011;8:467‐477. [DOI] [PMC free article] [PubMed] [Google Scholar]
- 15. Schwarzenbach H, Hoon DS, Pantel K. Cell‐free nucleic acids as biomarkers in cancer patients. Nat Rev Cancer. 2011;11:426‐437. [DOI] [PubMed] [Google Scholar]
- 16. Fendler A, Stephan C, Yousef GM, Kristiansen G, Jung K. The translational potential of microRNAs as biofluid markers of urological tumours. Nat Rev Urol. 2016;13:734‐752. [DOI] [PubMed] [Google Scholar]
- 17. Wang K, Zhang S, Weber J, Baxter D, Galas DJ. Export of microRNAs and microRNA‐protective protein by mammalian cells. Nucleic Acids Res. 2010;38:7248‐7259. [DOI] [PMC free article] [PubMed] [Google Scholar]
- 18. Mitchell PS, Parkin RK, Kroh EM, et al. Circulating microRNAs as stable blood‐based markers for cancer detection. Proc Natl Acad Sci USA. 2008;105:10513‐10518. [DOI] [PMC free article] [PubMed] [Google Scholar]
- 19. Lu J, Getz G, Miska EA, et al. MicroRNA expression profiles classify human cancers. Nature. 2005;435:834‐838. [DOI] [PubMed] [Google Scholar]
- 20. Poroyko V, Mirzapoiazova T, Nam A, et al. Exosomal miRNAs species in the blood of small cell and non‐small cell lung cancer patients. Oncotarget. 2018;9:19793‐19806. [DOI] [PMC free article] [PubMed] [Google Scholar]
- 21. Schwarzenbach H. Circulating nucleic acids as biomarkers in breast cancer. Breast Cancer Res. 2013;15:211. [DOI] [PMC free article] [PubMed] [Google Scholar]
- 22. ElSharawy A, Roder C, Becker T, et al. Concentration of circulating miRNA‐containing particles in serum enhances miRNA detection and reflects CRC tissue‐related deregulations. Oncotarget. 2016;7:75353‐75365. [DOI] [PMC free article] [PubMed] [Google Scholar]
- 23. Mlcochova H, Hezova R, Stanik M, Slaby O. Urine microRNAs as potential noninvasive biomarkers in urologic cancers. Urol Oncol. 2014;32:41 e1‐9. [DOI] [PubMed] [Google Scholar]
- 24. Shao X, Somlo S, Igarashi P. Epithelial‐specific Cre/lox recombination in the developing kidney and genitourinary tract. J Am Soc Nephrol. 2002;13:1837‐1846. [DOI] [PubMed] [Google Scholar]
- 25. Ishikawa E, Kosako H, Yasuda T, et al. Protein kinase D regulates positive selection of CD4(+) thymocytes through phosphorylation of SHP‐1. Nat Commun. 2016;7:12756. [DOI] [PMC free article] [PubMed] [Google Scholar]
- 26. Itoh H, Kadomatsu T, Tanoue H, et al. TET2‐dependent IL‐6 induction mediated by the tumor microenvironment promotes tumor metastasis in osteosarcoma. Oncogene. 2018;37:2903‐2920. [DOI] [PubMed] [Google Scholar]
- 27. Marchionni L, Hayashi M, Guida E, et al. MicroRNA expression profiling of Xp11 renal cell carcinoma. Hum Pathol. 2017;67:18‐29. [DOI] [PMC free article] [PubMed] [Google Scholar]
- 28. Kobos R, Nagai M, Tsuda M, et al. Combining integrated genomics and functional genomics to dissect the biology of a cancer‐associated, aberrant transcription factor, the ASPSCR1‐TFE3 fusion oncoprotein. J Pathol. 2013;229:743‐754. [DOI] [PMC free article] [PubMed] [Google Scholar]
- 29. Tanaka M, Homme M, Yamazaki Y, Shimizu R, Takazawa Y, Nakamura T. Modeling alveolar soft part sarcoma unveils novel mechanisms of metastasis. Cancer Res. 2017;77:897‐907. [DOI] [PubMed] [Google Scholar]
- 30. Noguchi G, Nakaigawa N, Taguri M, et al. Time‐dependent change in relapse sites of renal cell carcinoma after curative surgery. Clin Exp Metastasis. 2018;35:69‐75. [DOI] [PubMed] [Google Scholar]
- 31. Wang K, Jin W, Jin P, Fei X, Wang X, Chen X. miR‐211‐5p suppresses metastatic behavior by targeting SNAI1 in renal cancer. Mol Cancer Res. 2017;15:448‐456. [DOI] [PubMed] [Google Scholar]
- 32. Quan J, Pan X, He T, et al. Tumor suppressor miR‐211‐5p is associated with cellular migration, proliferation and apoptosis in renal cell carcinoma. Exp Ther Med. 2018;15:4019‐4028. [DOI] [PMC free article] [PubMed] [Google Scholar]
- 33. Agarwal V, Bell GW, Nam JW, Bartel DP. Predicting effective microRNA target sites in mammalian mRNAs. Elife. 2015;4:e05005. [DOI] [PMC free article] [PubMed] [Google Scholar]
- 34. Chappell JC, Payne LB, Rathmell WK. Hypoxia, angiogenesis, and metabolism in the hereditary kidney cancers. J Clin Invest. 2019;129:442‐451. [DOI] [PMC free article] [PubMed] [Google Scholar]
- 35. Du Z, Li L, Huang X, et al. The epigenetic modifier CHD5 functions as a novel tumor suppressor for renal cell carcinoma and is predominantly inactivated by promoter CpG methylation. Oncotarget. 2016;7:21618‐21630. [DOI] [PMC free article] [PubMed] [Google Scholar]
- 36. Kou B, Liu W, Tang X, Kou Q. HMGA2 facilitates epithelial‐mesenchymal transition in renal cell carcinoma by regulating the TGF‐β/Smad2 signaling pathway. Oncol Rep. 2018;39:101‐108. [DOI] [PMC free article] [PubMed] [Google Scholar]
- 37. Xiong F, Liu K, Zhang F, et al. MiR‐204 inhibits the proliferation and invasion of renal cell carcinoma by inhibiting RAB22A expression. Oncol Rep. 2016;35:3000‐3008. [DOI] [PubMed] [Google Scholar]
- 38. Bailey ST, Smith AM, Kardos J, et al. MYC activation cooperates with Vhl and Ink4a/Arf loss to induce clear cell renal cell carcinoma. Nat Commun. 2017;8:15770. [DOI] [PMC free article] [PubMed] [Google Scholar]
- 39. Schmidt LS, Nickerson ML, Warren MB, et al. Germline BHD‐mutation spectrum and phenotype analysis of a large cohort of families with Birt‐Hogg‐Dube syndrome. Am J Hum Genet. 2005;76:1023‐1033. [DOI] [PMC free article] [PubMed] [Google Scholar]
- 40. Schmidt LS, Linehan WM. Molecular genetics and clinical features of Birt‐Hogg‐Dube syndrome. Nat Rev Urol. 2015;12:558‐569. [DOI] [PMC free article] [PubMed] [Google Scholar]
- 41. Hong SB, Oh H, Valera VA, Baba M, Schmidt LS, Linehan WM. Inactivation of the FLCN tumor suppressor gene induces TFE3 transcriptional activity by increasing its nuclear localization. PLoS ONE. 2010;5:e15793. [DOI] [PMC free article] [PubMed] [Google Scholar]
- 42. Bertolotto C, Lesueur F, Giuliano S, et al. A SUMOylation‐defective MITF germline mutation predisposes to melanoma and renal carcinoma. Nature. 2011;480:94‐98. [DOI] [PubMed] [Google Scholar]
- 43. Argani P, Reuter VE, Zhang L, et al. TFEB‐amplified renal cell carcinomas: an aggressive molecular subset demonstrating variable melanocytic marker expression and morphologic heterogeneity. Am J Surg Pathol. 2016;40:1484‐1495. [DOI] [PMC free article] [PubMed] [Google Scholar]
Associated Data
This section collects any data citations, data availability statements, or supplementary materials included in this article.
Supplementary Materials