

Abstract
The PPAR coactivator‐1α (PGC1α) is an important transcriptional co‐activator in control of fatty acid metabolism. Mitochondrial fatty acid oxidation (FAO) is the primary pathway for the degradation of fatty acids and promotes NADPH and ATP production. Our previous study demonstrated that upregulation of carnitine palmitoyl transferase 1 A (CPT1A), the key regulator of FAO, promotes radiation resistance of nasopharyngeal carcinoma (NPC). In this study, we found that high expression of PGC1α is associated with poor overall survival in NPC patients after radiation treatment. Targeting PGC1α could sensitize NPC cells to radiotherapy. Mechanically, PGC1α binds to CCAAT/enhancer binding protein β (CEBPB), a member of the transcription factor family of CEBP, to promote CPT1A transcription, resulting in activation of FAO. Our results revealed that the PGC1α/CEBPB/CPT1A/FAO signaling axis promotes radiation resistance of NPC. These findings indicate that the expression of PGC1α could be a prognostic indicator of NPC, and targeting FAO in NPC with high expression of PGC1α might improve the therapeutic efficacy of radiotherapy.
Keywords: CPT1A, fatty acid oxidation, nasopharyngeal carcinoma, PGC1α, radiation therapy
1. INTRODUCTION
Metabolic reprogramming is a common feature of tumor cell and is characterized by disorders of glucose metabolism, tricarboxylic acid (TCA) cycle, lipid metabolism, cholesterol metabolism, glutamate metabolism, one‐carbon metabolism and choline metabolism.1, 2, 3, 4, 5 Peroxisome proliferator activated receptor (PPAR) coactivator‐1α (PGC1α) is an important transcriptional co‐activator in control of mitochondrial function and lipid metabolism, especially fatty acid oxidation (FAO).6 FAO is the primary pathway for the degradation of fatty acids and it promotes NADPH and ATP production.7, 8 Abnormal lipid metabolism mediated by FAO plays an important role in tumor progression.9, 10 High expression of PGC1α is conducive to cancer cell survival during metabolic stress, including oxidative damage, energy crisis and cancer treatment.11, 12, 13, 14 The evidence indicated that PGC1α might be a metabolic target in cancer therapy.
Notably, PGC1α can interact with numerous transcription factors to mediate mitochondrial function, FAO, gluconeogenesis, reactive oxygem species (ROS) clearance, cell adhesion and migration.15, 16, 17, 18 PGC1α is involved in regulating the expression of carnitine palmitoyl transferase 1A (CPT1A) and CPT1B in the liver and the heart.19, 20, 21, 22 CPT1A is a key rate‐limiting enzyme in FAO that catalyzes the loading of fatty acyl‐groups onto carnitine.23, 24 Recent studies showed that CPT1A promotes tumor progression in colorectal cancer, prostate cancer and hepatocellular carcinoma.25, 26, 27 The expression of CPT1A is increased in ovarian cancer and high‐grade glioblastoma patients.28, 29
A previous study indicated that targeting metabolic dependencies of cancer cells might be a selective anticancer strategy and CPT1A has been identified as a target of fatty acid metabolism.30 Recent studies confirmed that targeting CPT1A‐mediated FAO could promote therapy sensitization in several types of cancers. Inhibition of FAO could be a potential therapeutic strategy for lung carcinoma, colon adenocarcinoma and triple‐negative breast cancer.31, 32, 33 Ethyl 2‐[6‐(4‐chlorophenoxy) hexyl] oxirane‐2‐carboxylate (Etomoxir, ETO), a CPT1A enzymatic inhibitor, can sensitize human metastatic breast carcinoma, colon carcinoma, leukemia and hepatocellular carcinoma to chemotherapy.34, 35, 36
Nasopharyngeal carcinoma (NPC) is a highly prevalent tumor in southern China, South‐East Asia and northern Africa. Due to its anatomical limitations, intensity‐modulated radiotherapy is an important treatment strategy against NPC.37, 38 Our recent study showed that CPT1A is a key molecule in the regulation of FAO and promotes resistance of NPC to radiation.39 However, the upstream regulatory mechanism of CPT1A in NPC remains unclear. Therefore, the study and discovery of these upstream regulators of CPT1A might support the elucidation of tumor radiation resistance.
In this study, we illustrate a metabolic feature of active lipid turnover and FAO in PGC1α overexpressing NPC cells. A high level of expression of PGC1α is associated with poor overall survival in NPC patients after radiation therapy. PGC1α binds with CCAAT/enhancer binding protein β (CEBPB), a member of the transcription factor family of CEBP,40 and the intact complex upregulates CPT1A gene transcription and enzyme activity in NPC cells. In conclusion, the PGC1α/CEBPB/CPT1A axis promotes radiation resistance by activating fatty acid oxidation in NPC cells. Discovery of this signaling axis provides new evidence for further targeting FAO metabolism in cancer cells.
2. MATERIALS AND METHODS
2.1. Cell lines and cell culture
The human NPC cell lines HK1, HONE1, CNE2 and CNE2‐IR (CNE2 radiation‐resistant) cells were purchased from the Cell Line Resource Center of Central South University. C666‐1 cells were generously provided by Professor Sai Wah Tsao from University of Hong Kong. HK1‐PGC1α, HONE1 shPGC1α, C666‐1 shPGC1α, HONE1 shCPT1A and C666‐1 shCPT1A cells were established by our laboratory. These cells were cultured in RPMI‐1640 medium (Hyclone, Logan, UT, USA) with 10% FBS (Hyclone). The human embryonic kidney cell line HEK293T was cultured in DMEM (Hyclone) with 10% FBS. Cells were maintained at 37°C in a 5% CO2 incubator.
2.2. Nasopharyngeal carcinoma tissue array
The NPC tissue array was purchased from Pantomics. The tissue microarray consisted of non–keratinizing undifferentiated NPC (n = 48) and nasopharyngeal inflammation (n = 15). Clinical characteristics of the NPC patients were provided, including age, gender, neck lymph nodule metastasis and EBV‐encoded small RNA status. NPC patients were treated with radiation therapy by Co‐60.
2.3. Oxygen consumption assay
The extracellular oxygen consumption assay was performed using the MitoXpress Xtra oxygen consumption assay kit (Luxel Bioscience) according to the manufacturer's recommendations.
2.4. Cellular ATP measurement
The intracellular ATP level was measured using the CellTiter‐Glo 2.0 Assay kit (G9242; Promega) according to the manufacturer's instructions.
2.5. NADPH/NADP measurement
Intracellular NADPH/NADP levels were assayed using an NADP/NADPH Quantification Colorimetric Kit (K347‐100; Biovision) according to the manufacturer's instructions.
2.6. Cell transfection
Cells were transfected with CEBPB siRNA (GenePharma), PGC1αshRNA (GeneChem), CPT1A shRNA (GeneChem) (Table S1), V5‐tagged CPT1A and mutCPT1A plasmids (TSINGKE) using Lipofectamine 2000 (Invitrogen) according to manufacturer's instructions.
2.7. Western blot analysis and antibodies
Western blot analysis was performed as previously described.39 The following antibodies were used for western blotting: anti–CPT1A (ab128568; Abcam), anti–PGC1α (ST‐1202; Millipore), anti–CEBPB (ab32358, Abcam) and β‐actin (A5441; Sigma‐Aldrich).
2.8. Immunohistochemistry analysis
Immunohistochemical (IHC) staining was performed as previously described.41, 42 The results were separately quantified by 2 pathologists from Xiangya Hospital, Changsha, China. The negative to positive patterns (denoted as – to +++) and IHC scores were determined by their staining intensity and positive rate. Anti–CPT1A (ab128568, Abcam) and anti–PGC1α (ST‐1202, Millipore) were used to detect the respective proteins.
2.9. Co‐immunoprecipitation assay
Cells (1 × 10⁷) were disrupted with IP lysis buffer containing protease inhibitor cocktail (Bimake). Protein aliquots (1000 μg) were incubated with 20 μL of Dynabeads Protein A (Invitrogen) for 1 hour at 4°C for pre‐clearing. The samples were incubated with 2 μg anti–CEBPB (ab32358; Abcam) or 2 μg IgG overnight at 4°C with mild shaking. IgG was used as a negative control. Then 20 μL of Dynabeads Protein A was added to samples and incubated for 2 hours at 4°C. The beads were washed 3 times with cold lysis buffer, then resuspended in 20 μL of 1× loading buffer diluted with lysis buffer and boiled for 5 minutes. The samples were analyzed by western blotting. The antibodies used for western blot detection were anti–PGC1α (ST‐1202; Millipore) and anti–CEBPB (ab32358; Abcam).
2.10. Luciferase reporter assay
A luciferase reporter GV238‐CPT1A‐promoter (Luc‐CPT1A; GeneChem), pRL‐TK vector (Promega), PGC1α‐ overexpressing vector, CEBPB‐overexpressing vector, CEBPB small interfering RNA, PGC1α short hairpin RNA or vehicle were transfected into HEK293T cells with Lipofectamine 2000 (Invitrogen) for 48 hours according to the manufacturer's recommendations. Luciferase activities were detected by the Dual‐Luciferase Reporter Assay (E1910, Promega) System and the GloMax Microplate Luminometer (Promega) according to the manufacturer's recommendations.
2.11. ChIP assay
ChIP assays were performed with 1 × 10⁶ cells by using a ChIP Assay Kit (P2078; Beyotime) according to the manufacturer's instructions. PCR was performed with primers (Table S2) against the promoter of the CPT1A. Anti–CEBPB (ab32358; Abcam) and IgG were used for the ChIP assay and nonspecific IgG was used as a negative control.
2.12. Cell viability assay
Cells were plated in a 96‐well plate at a density of 5 × 10³/well (C666‐1), 3 × 10³/well (HK1) or 2.5 × 10³/well (HONE1), and were exposed to 4 Gy IR. Then 5 μg/mL of 3‐(4,5‐dimethylthiazol‐2‐yl)‐5‐(3‐carboxymethoxyphenyl)‐2‐(4‐sulfophenyl)‐2H tetrazolium (MTS reagent, Promega) was added into each well after culturing for 0 or 72 hours and then incubated at 37°C for 90 minutes. The absorbance was measured on a Biotek EL×800 spectrophotometer at 490 nm.
2.13. Colony formation and radiosensitivity assays
Cells were seeded in 6‐well plates in triplicate at 2 × 10³ (HONE1), 3 × 10³ (HK1) or 5 × 10³ (C666‐1) cells/well and were correspondingly exposed to 0 or 4 Gy IR. After 10‐14 days, cells were washed with 1× PBS, fixed with methanol for 15 minutes, and stained with crystal violet for 15 minutes. Colonies were counted using the Image J software program and the survival fractions were calculated.
2.14. Statistical analysis
All statistical calculations were performed with the GraphPad Prism 5 software program (GraphPad Software). The overall survival was estimated using the Kaplan‐Meier method. Differences between various groups were evaluated using a 2‐tailed Student's t test or Welch's t test and a P‐value < 0.05 was considered statistically significant.
For the materials and methods for RNA extraction, quantitative RT‐PCR, immunofluorescence analysis, CPT1 enzymatic activity and CPT1A mutation plasmid (mutCPT1A), see Data S1.
3. RESULTS
3.1. PGC1α overexpressing nasopharyngeal carcinoma cells show a metabolic signature of active fatty acid oxidation
Our previous study showed that lipid metabolism was active in NPC radiation‐resistant (CNE2‐IR) cells.39 We evaluated the expression of several genes regulating lipid metabolism in CNE2‐IR cells by PCR array and found that the mRNA level of PGC1α was significantly upregulated in CNE2‐IR cells (Figure 1A), suggesting that PGC1α might be involved in NPC radiation resistance. By using a metabolomics approach of LC/GC‐MS to profile the global metabolic changes of HK1‐PGC1α or HK1‐CON, we found that among 260 known biochemical compounds, 61 biochemical factors were altered in HK1‐PGC1α and 31 of these biochemical factors were associated with lipid metabolism (50.82%), compared with HK1‐CON cells (Figure 1B,C, Table S3). The acylcarnitines were the most highly elevated metabolites present in the HK1‐PGC1α cells and included hexanoylcarnitine, myristoylcarnitine, stearoylcarnitine, oleoylcarnitine and palmitoylcarnitine (Figure 1D). Carnitine plays an important role in FAO. Taking carnitine as the carrier, CPT converts acyl‐CoA into acylcarnitine and enters the mitochondria for further oxidative decomposition.24 The results of metabolomics might indicate that FAO is active in HK1‐PGC1α cells.
Figure 1.
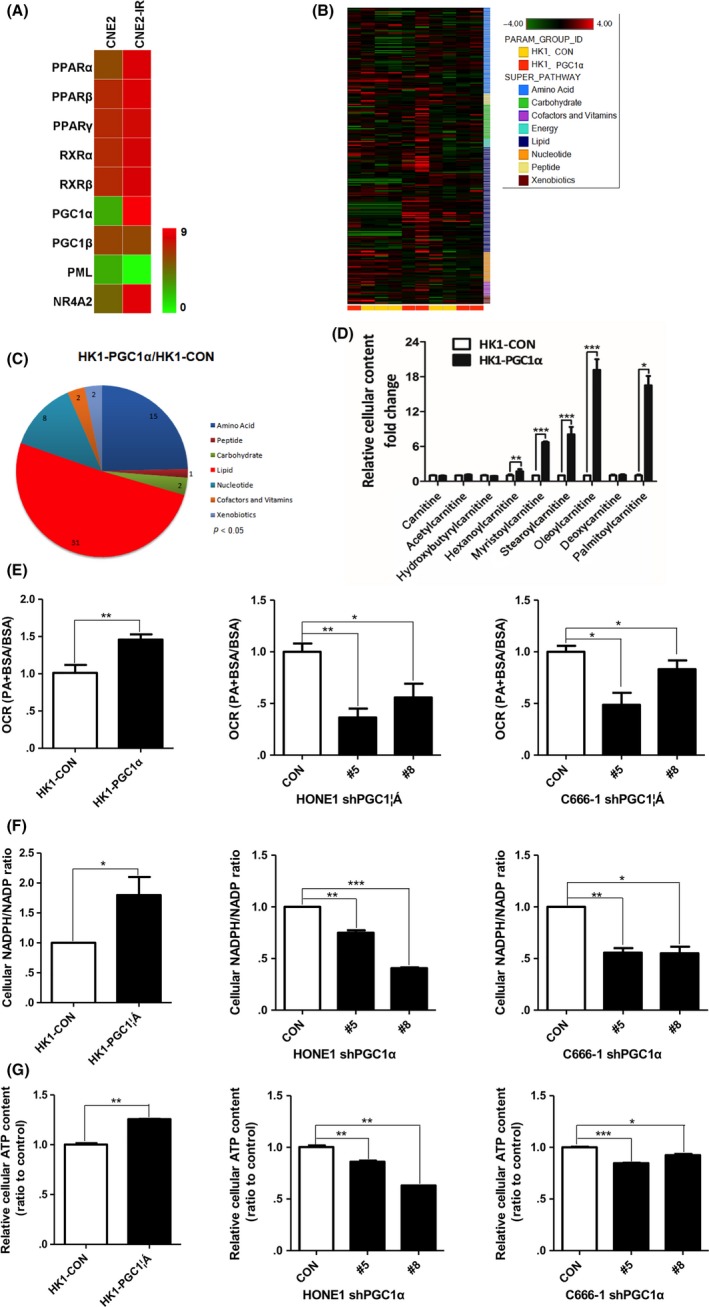
PGC1α increases fatty acid β oxidation (FAO) activity in nasopharyngeal carcinoma (NPC) cells. A, PCR array assessing the mRNA level (Log2‐fold‐change) of 9 genes regulating fatty acid metabolism in CNE2 and CNE2‐IR cells. Green to red color gradation is based on the ranking of each condition from minimum (green) to maximum (red). B, Heat map of 260 biochemical factors in lysates from HK1‐CON cells and HK1‐PGC1α cells. Five replicates were tested for each cell line and the relative fold change for each biochemical factor in each sample is represented as a relative mean value increase (red) or decrease (green). C, Pie charts indicating the number of biochemical alterations (P < 0.05, Welch's t test) in each metabolic pathway in HK1‐PGC1α cells compared with HK1‐CON cells. D, Fold change in cellular carnitine levels in HK1‐PGC1α cells compared with HK1‐CON cells. Five replicates were tested for each cell line. E, PA‐based oxygen consumption rates (OCR) were measured with the indicated reagents in PGC1α‐overexpressing HK1 cells and PGC1α knockdown HONE1 and C666‐1 cells compared with parental cells. Palmitate‐BSA (175 μmol/L) was added to cells (n = 3) and BSA was used as a control for palmitate. F and G, The cellular NADPH/NADP ratio (F) and cellular ATP levels (G) in PGC1α‐overexpressing HK1 cells and PGC1α knockdown HONE1 and C666‐1 cells compared with parental cells. *P < 0.05, **P < 0.01, ***P < 0.001
To further clarify the effect of PGC1α in FAO, we detected the activity of FAO through the palmitate (PA)‐based oxygen consumption rate (OCR), the ratio of NADPH/NADP, and the ATP levels in PGC1α overexpression or knockdown NPC cells. We observed a significant increase in PA‐based OCR, the ratio of NADPH/NADP and ATP levels in PGC1α overexpressing cells. In contrast, PGC1α knockdown cells showed an obvious decrease in PA‐based OCR, the ratio of NADPH/NADP and ATP levels (Figure 1E‐G). These results further support the metabolomics analysis and suggest that PGC1α activates FAO in NPC cells.
3.2. A high level of expression of PGC1α is associated with poor overall survival in nasopharyngeal carcinoma patients after radiation therapy
In a commercially available tissue microarray comprised of non–keratinizing undifferentiated NPC (n = 48) and nasopharyngeal inflammation (n = 15; IHC, Figure 2A), NPC patients were treated with radiation therapy and followed up. All tumor biopsies were obtained before treatment and patients’ clinical characteristics are listed in Table S4. The IHC scores indicated that PGC1α was highly expressed in the non–keratinizing undifferentiated NPC compared with samples of nasopharyngeal inflammation (Figure 2B). Based on the IHC scores for PGC1α in the non–keratinizing undifferentiated NPC (IHC, Figure 2C), we set the median score as the cut‐off value and divided patients into 2 groups. The patients with high expression of PGC1α (n = 20, median survival time = 60 months) had shorter overall survival compared to patients expressing lower levels of PGC1α (n = 28, survival rate > 50%; Figure 2D). These observations suggest that high expression of PGC1α corresponds to worse overall survival after radiation therapy in NPC.
Figure 2.
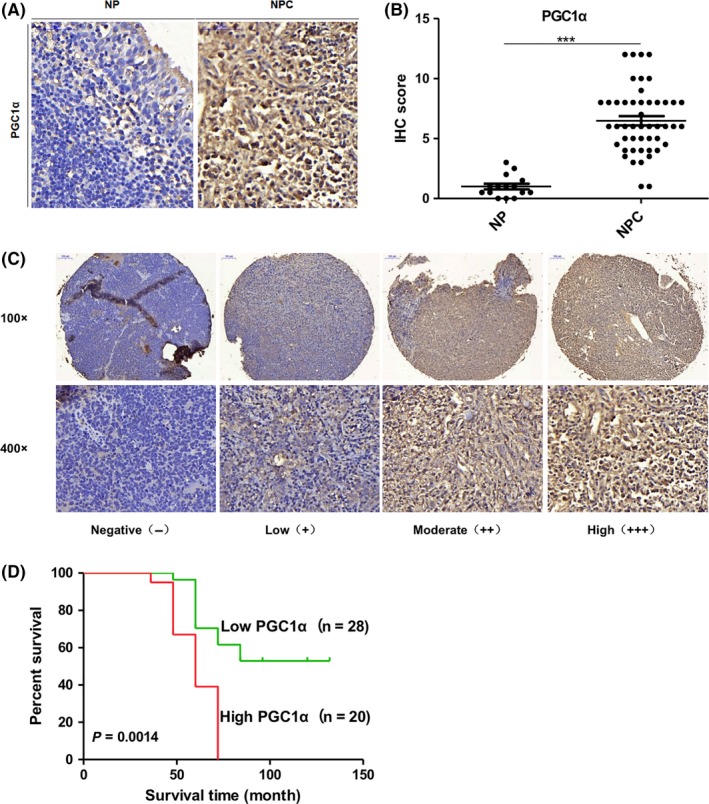
A high expression level of PGC1α is associated with poor overall survival in nasopharyngeal carcinoma (NPC) patients after radiation therapy. A and B, Representative immunohistochemical (IHC) staining (A) and IHC score (B) of PGC1α in nasopharyngeal inflammation and NPC from a tissue microarray of nasopharyngeal patients (magnification 400×). C, Representative IHC staining of PGC1α expression of nasopharyngeal squamous cell carcinoma patients after radiation therapy from a tissue microarray. D, Overall survival rates of nasopharyngeal squamous cell carcinoma patients after radiation therapy with low (n = 28, survival rate > 50%) or high (n = 20, median survival time = 60 mo) expression levels of PGC1α estimated with the Kaplan‐Meier method by log‐rank test (P = 0.0014). NP, Nasopharyngeal inflammation
3.3. PGC1α positively regulates CPT1A in nasopharyngeal carcinoma
We wondered whether PGC1α had a regulatory effect on CPT1A. After overexpressing PGC1α in HK1 cells, we observed a significant increase in mRNA, protein levels and enzyme activity of CPT1A. In contrast, PGC1α knockdown HONE1 and C666‐1 cells showed decreased CPT1A mRNA, protein levels and enzyme activity (Figure 3A‐C).
Figure 3.
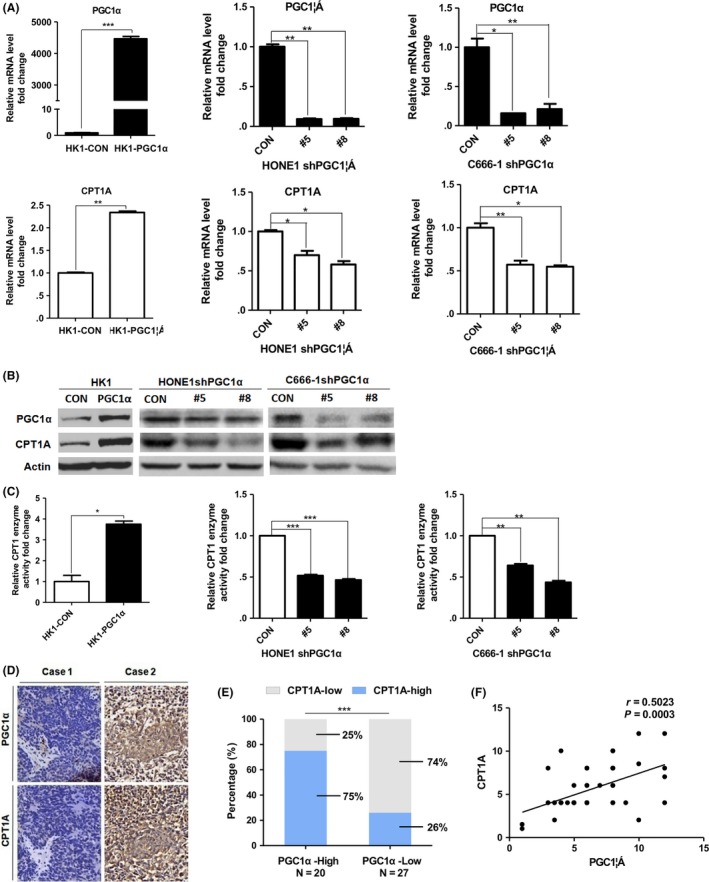
PGC1α positively regulates CPT1A in nasopharyngeal carcinoma (NPC). A and B, Real‐time PCR showing mRNA levels (A) and immunoblot analysis (B) of PGC1α and CPT1A in PGC1α‐overexpressing HK1 cells and PGC1α‐knockdown HONE1 and C666‐1 cells. Values represent means ± SD of 3 independent experiments. C, CPT1 enzyme activity in cells as mentioned above. Results are presented as fold change in enzyme activity (nmol CoA‐SH released/min/mg protein). D, Representative IHC staining of PGC1α and CPT1A from a tissue microarray of nasopharyngeal squamous cell carcinoma patients after radiation therapy (magnification 400×). E, Tumor CPT1A expression was calculated according to PGC1α expression from above tissue microarray. F, Co‐expression analysis of PGC1α and CPT1A from above tissue microarray (n = 47). *P < 0.05, **P < 0.01, ***P < 0.001
We further analyzed the relationship between PGC1α and CPT1A expression in a tissue microarray comprised of non–keratinizing undifferentiated NPC patients following radiation therapy by IHC (n = 47). Representative photos are shown in Figure 3D. Double high expression for PGC1α and CPT1A was observed in 75% (15/20) and double low expression accounted for 74% (20/27) of the patient samples (Figure 3E). Co‐expression analysis of the IHC scores for PGC1α and CPT1A with a Spearman correlation test showed that a positive correlation existed between PGC1α and CPT1A expression in the NPC tissues (Figure 3F). These data suggest that PGC1α positively regulates CPT1A in NPC cell lines and patient tissues.
3.4. CEBPB affects CPT1A transcription, expression, enzyme activity and fatty acid oxidation in nasopharyngeal carcinoma cells
PGC1α is reported to work as a transcriptional co‐activator; thus, a transcription factor interacting with PGC1α to regulate CPT1A must exist. The transcription factors that could possibly regulate CPT1A and their binding sites are shown in the transcription factor prediction database, PROMO (Alggen), and the binding sites of CEBPB are present (Figure 4A). We knocked down CEBPB in HONE1 and C666‐1 cells and found that the mRNA, protein levels and enzyme activity of CPT1A were decreased in these cells (Figure 4B‐D). These results suggest that CEBPB could regulate CPT1A in NPC cells.
Figure 4.
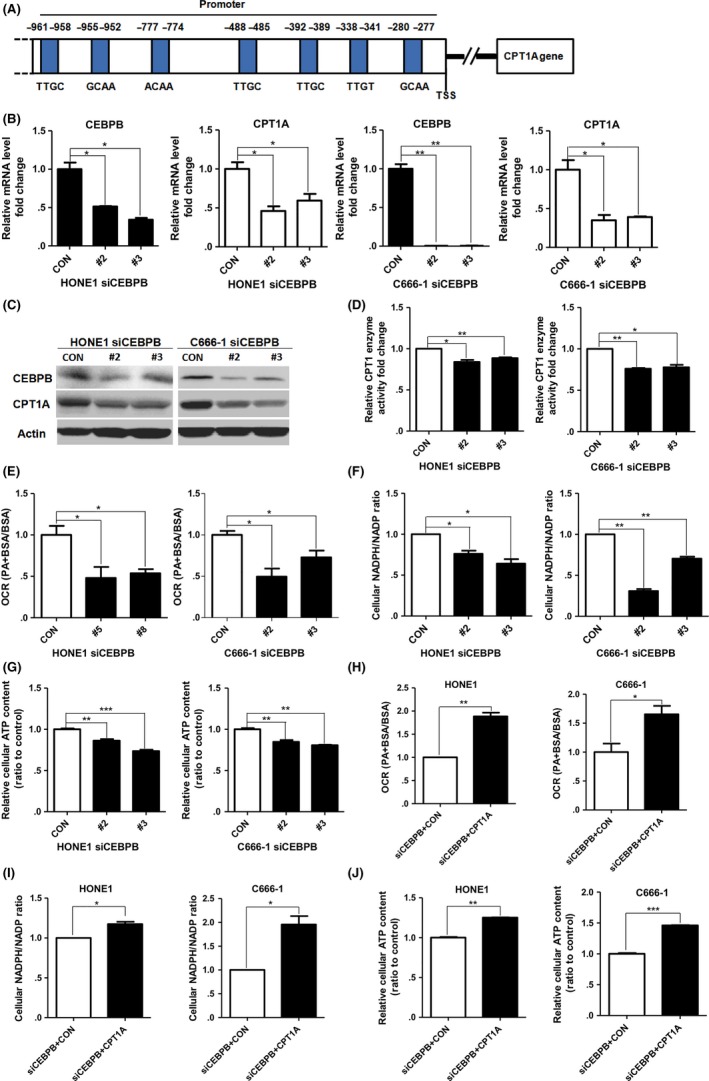
CEBPB affects CPT1A transcription, expression, enzyme activity and FAO in nasopharyngeal carcinoma (NPC) cells. A, CEBPB binding sites in the promoter of CPT1A are predicted in the transcription factor prediction database, PROMO (Alggen). B and C, Real‐time PCR showing mRNA levels (B) and immunoblot analysis (C) of CEBPB and CPT1A in CEBPB‐knockdown HONE1 and C666‐1 cells. Values represent means ± SD of 3 independent experiments. D, CPT1 enzyme activity in CEBPB‐knockdown HONE1 and C666‐1 cells. E, PA‐based oxygen consumption rates (OCR) were measured with the indicated reagents in CEBPB‐knockdown HONE1 and C666‐1 cells compared with parental cells. F and G, The cellular NADPH/NADP ratio (F) and cellular ATP levels (G) in CEBPB‐knockdown HONE1 and C666‐1 cells. H‐J, PA‐based OCR (H), NADPH/NADP ratio (I) and cellular ATP levels (J) in CEBPB‐knockdown HONE1 and C666‐1 cells transfected with the indicated plasmids. *P < 0.05, **P < 0.01, ***P < 0.001
Furthermore, we observed an obvious decrease in PA‐based OCR, the NADPH/NADP ratio and ATP content in CEBPB‐knockdown NPC cells (Figure 4E‐G). Then we examined whether the decreases by CEBPB silencing could be cancelled by forced expression of CPT1A. The data showed that exogenous expression of CPT1A rescued the OCR, the NADPH/NADP ratio and the ATP levels in CEBPB‐knockdown NPC cells (Figure 4H‐J). These results suggest that CEBPB is crucial to maintain FAO by CPT1A in NPC cells.
3.5. PGC1α and CEBPB form a complex and bind to the promoter of CPT1A
Then we used online prediction and a co‐immunoprecipitation assay to examine whether PGC1α binds to CEBPB. We analyzed the protein structure of CEBPB and PGC1α from the Protein Data Bank, and conducted the docking protocol for CEBPB and PGC1α using the GRAMM‐X Protein Docking Web Server. The results produced by the PyMOL software program indicated that PGC1α might associate with CEBPB at 2 sites, PGC1α‐ASN‐281 with CEBPB‐LEU‐148 and PGC1α‐SER‐288 with CEBPB‐LEU‐144 (Figure 5A). The merged confocal images indicated that PGC1α and CEBPB were co‐localized in C666‐1 cells (Figure 5B). Immunoprecipitation data showed that PGC1α binds to CEBPB in HONE1 and C666‐1 cells that have a high expression level of PGC1α. The binding of PGC1α‐CEBPB is markedly increased in HK1‐PGC1α cells compared to HK1‐CON cells. Interestingly, we observed an increased expression of CEBPB in HK1‐PGC1α cells (Figure 5C). To further confirm that PGC1α‐CEBPB regulates CPT1A expression in the nucleus, dual‐luciferase reporter and ChIP assays were performed. PGC1α or CEBPB, alone or combined, were overexpressed in HEK293T cells together with a luciferase reporter construct with the CPT1A promoter. Expression of PGC1α or CEBPB both increased luciferase activity, respectively. The combination of PGC1α and CEBPB showed a more significant increase in luciferase activity. Moreover, the increase in CPT1A promoter activity by PGC1α overexpression could be cancelled by silencing CEBPB. In addition, the increase in CPT1A promoter activity by CEBPB overexpression could be cancelled by PGC1α knockdown (Figure 5D). Initially, we identified putative CEBPB binding sites in the CPT1A promoter through bioinformatics analysis and designed 4 primers for these possible binding sites. Then we conducted PCR amplification to determine the binding of CEBPB to the CPT1A promoter using ChIP assays with CEBPB antibodies in C666‐1 cells. The results showed that CEBPB could bind to the CEBPB binding region #4 (−386 to −252) in the CPT1A promoter (Figure 5E). These data suggest that PGC1α interacts with CEBPB to activate CPT1A.
Figure 5.
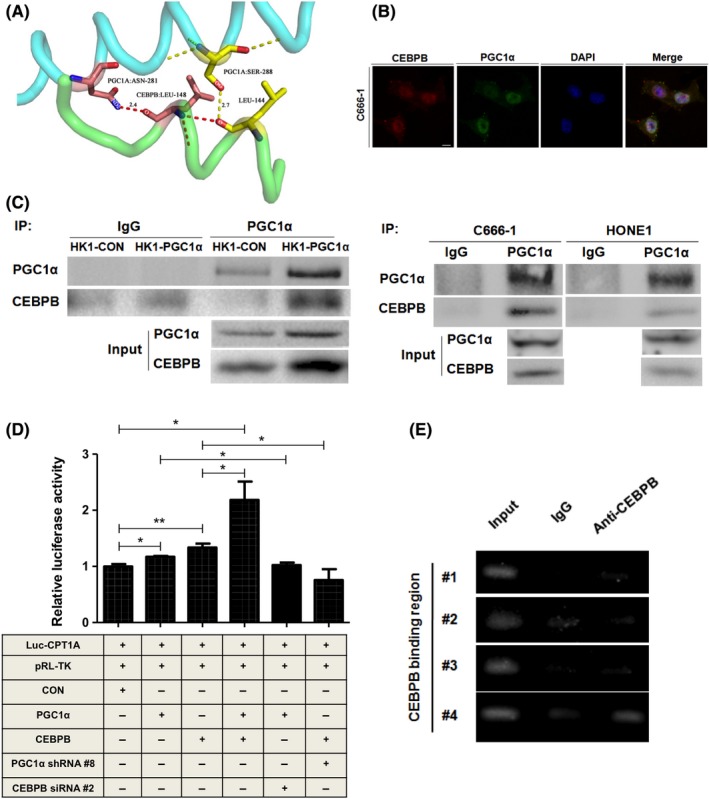
PGC1α and CEBPB form a complex and bind to the promoter of CPT1A. A, The protein structure of CEBPB and PGC1α was obtained from the Protein Data Bank (PDB), and the docking of CEBPB and PGC1α was conducted online using the GRAMM‐X Protein Docking Web Server. The results were obtained using the PyMOL software program. B, Confocal microscopic analysis of the co‐localization of PGC1α and CEBPB in C666‐1 cells. The nuclei were stained with DAPI (scale bar, 10 μm). C, Equal amounts of protein were immunoprecipitated (IP) with a PGC1α monoclonal antibody and were immunoblotted to detect CEBPB in HK1‐CON/HK1‐PGC1α, HONE1 and C666‐1 cells. D, Luciferase activity in HEK293T cells transfected with the indicated plasmids and siRNA is indicated. *P < 0.05, **P < 0.01, ***P < 0.001. E, ChIP assay of CEBPB binding to its corresponding sites on the CPT1A promoter in C666‐1 cells. The lanes are designated as: “Input”‐PCR amplification of input DNA, “anti–CEBPB”‐PCR amplification of chromatin DNA fragments precipitated by antibodies against transcription factors, and “IgG”‐a control for non–specific reactions
3.6. The PGC1α/CEBPB/CPT1A signaling axis promotes radiation resistance of nasopharyngeal carcinoma cells
We further hypothesized that PGC1α/CEBPB/CPT1A could promote radiation resistance of NPC cells. The correlation between the expression level of PGC1α/CEBPB/CPT1A and radiation resistance of NPC was detected. Colony‐formation assay results showed that overexpression of PGC1α increased the survival fraction of HK1 cells, and knockdown of PGC1α significantly decreased the survival fractions of HONE1 and C666‐1 cells after 4 Gy irradiation (Figure 6A). MTS assay results showed that overexpression of PGC1α increased proliferative capacity of HK1 cells; proliferative capacity of PGC1α‐knockdown HONE1 and C666‐1 cells decreased significantly after 4Gy irradiation (Figure 6B). Similarly, survival fractions and proliferative capacity significantly decreased in CEBPB‐knockdown HONE1 and C666‐1 cells after 4 Gy irradiation (Figure 6C,D). The influence of CPT1A on FAO activity was examined in PGC1α‐endogenous high expression NPC cells (HONE1 and C666‐1). The data revealed that PA‐based OCR, the NADPH/NADP ratio and ATP content were suppressed by knocking down CPT1A (Figure 6E‐H). In addition, knockdown of CPT1A downregulated the survival fractions and proliferative capacity after 4 Gy irradiation in PGC1α‐endogenous high expression NPC cells (Figure 6I,J). The PGC1α‐mediated radioresistance could be cancelled by silencing CEBPB or CPT1A while the inhibitory effects were also observed in ETO (CPT1A enzymatic inhibitor)‐treated cells (Figure 6K). Because the catalytic domain of CPT1A plays a critical role in CPT1A‐dependent FAO, mutCPT1A with the deletion of catalytic domain has been constructed (Figure 6L and Figure S1). Compared with CPT1A, exogenous expression of mutCPT1A did not increase survival fractions and proliferative capacity so significantly (Figure 6M,N). It is suggested that PGC1α/CEBPB induces radiation resistance through CPT1A‐dependent FAO in NPC cells. Based on these results, we proposed a model in which the activation of PGC1α and the PGC1α‐CEBPB interaction positively regulates CPT1A, which might facilitate FAO, and maximize ATP and NADPH production, contributing to resistance to radiation (Figure 7).
Figure 6.
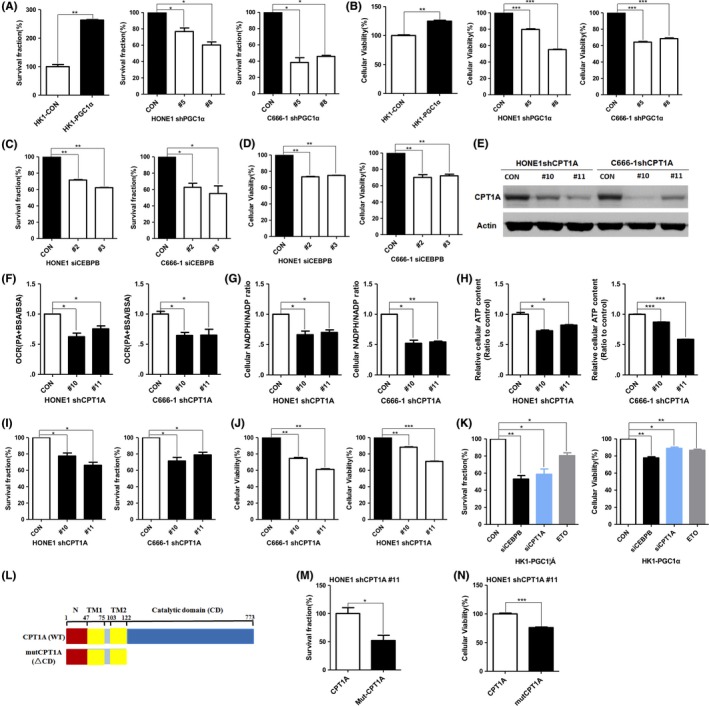
PGC1α/CEBPB/CPT1A promotes nasopharyngeal carcinoma (NPC) cell radiation‐resistance. A and B, Colony formation assay (A) or MTS assay (B) of PGC1α‐overexpressing HK1 cells and PGC1α‐knockdown HONE1 and C666‐1 cells treated with 4 Gy irradiation. Surviving fractions were calculated by comparing the colony number of each treatment group with untreated groups (0 Gy). Results are plotted as the mean surviving fraction ± SD of 3 independent experiments. C and D, Colony formation assay (C) or MTS assay (D) of CEBPB‐knockdown HONE1 and C666‐1 cells treated with 4 Gy irradiation. E‐H, PA‐based OCR (F), NADPH/NADP ratio (G) and cellular ATP levels (H) in CPT1A‐knockdown HONE1 and C666‐1 cells (E). I and J, Colony formation assay (I) or MTS assay (J) of CPT1A‐knockdown HONE1 and C666‐1 cells treated with 4 Gy irradiation. K, Colony formation assay or MTS assay of HK1‐PGC1α cells with silencing CEBPB and CPT1A, or ETO (80 μmol/L). L, Schematic diagram represented CPT1A or mutCPT1A. TM, transmembrane domains. MutCPT1A (ΔCD), the catalytic domain deletion mutant of CPT1A. M and N, Colony formation assay (M) or MTS assay (N) of CPT1A‐knockdown HONE1 cells with overexpressing CPT1A or mutCPT1A. *P < 0.05, **P < 0.01, ***P < 0.001
Figure 7.
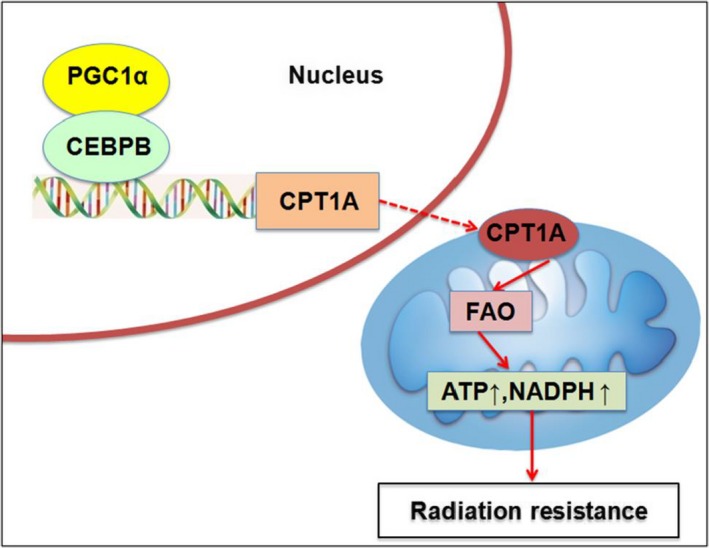
A schematic to illustrate PGC1α‐mediated radiation resistance in nasopharyngeal carcinoma (NPC). The activation of PGC1α and the PGC1α‐CEBPB interaction promote the transcription, expression and enzyme activity of CPT1A, which facilitates fatty acid oxidation and maximizes ATP and NADPH production, leading to resistance to radiation
4. DISCUSSION
Previous studies showed that abnormal expression of PGC1α is associated with cancer resistance to therapy. High expression of PGC1α/ERRα in breast cancer brain metastases increases mitochondrial respiration, FAO, glycolysis and ROS clearance, which promotes cancer resistant to chemotherapy.43 In BRAF‐mutated melanoma, inhibitors of MAPK can activate the MITF/PGC1α axis and lead to tolerance of tumor cells to therapy.44 The SIRT1/PGC1α/Nrf2 pathway has been used as a target for treatment with metformin in p53 wild‐type tumor cells.45 Clinical studies have shown that the expression of PGC1α is closely related to the prognosis of invasive ductal breast cancer patients.46 In our study, we explored the potential function of PGC1α in radiation resistance in NPC. A high expression level of PGC1α was significantly associated with worse overall survival after radiation treatment in NPC patients. Moreover, overexpression of PGC1α promotes radiation resistance in NPC cells. Knockdown of PGC1α and CPT1A, and inhibition of CPT1A by ETO re‐sensitized NPC cells to radiation treatment. These results suggest that PGC1α‐mediated FAO activation promotes radiation resistance of NPC, and the expression of PGC1α could be a prognostic indicator of this cancer.
Our previous study demonstrated that Epstein‐Barr virus (EBV) encoded latent membrane protein 1 (LMP1) regulates glycolysis through the PI3‐K/Akt/GSK3/c‐Myc/hexokinase 2 (HK2) axis, making NPC cells resistant to radiotherapy. Targeting HK2 could promote radiosensitization of NPC cells.47 LMP1 repressed the repair of DNA double strand breaks (DSB) by inhibiting DNA‐dependent protein kinase (DNA‐PK) phosphorylation and activity. Moreover, LMP1 reduced the phosphorylation of AMP‐activated protein kinase (AMPK) and changed its subcellular location after irradiation, which appeared to occur through a disruption of the physical interaction between AMPK and DNA‐PK. The decrease in AMPK activity was associated with LMP1‐mediated glycolysis and resistance to apoptosis induced by irradiation.48 Our recent study showed that the expression level of CPT1A is associated with poor overall survival of NPC patients following radiation treatment. Inhibition of CPT1A re‐sensitized NPC cells to radiation therapy by activating mitochondrial apoptosis.39 In this study, we found that PGC1α may represent a novel therapeutic target of NPC radiotherapy.
Previous studies showed that the high expression of PGC1α could activate FAO to promote tumor progression in glioma, diffuse large B cell lymphoma and colon cancer.41, 49, 50, 51 PGC1α could activate CPT1A and regulate FAO in prostate and breast cancer.32, 52 In addition, the high expression of c‐Myc in triple‐negative breast cancer upregulates multiple FAO‐promoted genes, such as PGC1α, and, thus, enhances the activity of CPT1A so as to activate FAO.53 Here, we found that PGC1α regulates CPT1A and there was a positive correlation between PGC1α and CPT1A expression in NPC patients after radiation therapy.
CEBPB plays an important role in cell proliferation and differentiation, metabolism, and inflammation.40, 54, 55 In the regenerating liver of mice, CPT1A was decreased after CEBPB was knocked out.56 CEBPB is closely related with lipid metabolism in HepG2 cells and liver cancer cells.57, 58 CEBPB expression is associated with overall survival in breast cancer and gastric cancer patients.59, 60 In Ewing sarcoma and ovarian cancer, CEBPB could promote tumor cell resistance to chemotherapy.61, 62 In this study, we found that CEBPB promotes the transcription of CPT1A and activates FAO. We confirmed that PGC1α binds to CEBPB and is co‐localized to the promoter of CPT1A; knockdown of CEBPB sensitized NPC cells to radiation therapy. However, the precise mechanism of the PGC1α‐CEBPB interaction is not clear.
Interestingly, we observed an increased expression of CEBPB in PGC1α‐overexpressing HK1 cells. CEBPB has been shown to regulate the expression of the PGC1α gene by binding to a cAMP response element in the PGC1α promoter.63 The reduced transcriptional activity of CEBPB inhibits PGC1α expression.64 Thus, a complicated feedback loop between PGC1α and CEBPB might exist under different circumstances.
Overall, our study showed that the PGC1α‐CEBPB interaction positively regulates CPT1A, which can facilitate FAO, and maximizes ATP and NADPH production, contributing to radiation resistance. The expression of PGC1α could be a prognostic indicator of NPC. Targeting the PGC1α/CEBPB/CPT1A signaling axis might be a potential strategy to improve the therapeutic efficacy of radiotherapy in NPC.
DISCLOSURE
The authors have no conflict of interest.
Supporting information
ACKNOWLEDGMENTS
This work was supported by the National Natural Science Foundation of China (No. 81573014, 81874195); Open Projects of State Key Laboratory of Oncology in South China (HN2016‐01); Key Projects of Key Research and Development Program of Hunan Province (2018SK2123).
Du Q, Tan Z, Shi F, et al. PGC1α/CEBPB/CPT1A axis promotes radiation resistance of nasopharyngeal carcinoma through activating fatty acid oxidation. Cancer Sci. 2019;110:2050–2062. 10.1111/cas.14011
Contributor Information
Xiangjian Luo, Email: luocsu@csu.edu.cn.
Ya Cao, Email: ycao98@vip.sina.com.
REFERENCES
- 1. Boroughs LK, DeBerardinis RJ. Metabolic pathways promoting cancer cell survival and growth. Nat Cell Biol. 2015;17:351‐359. [DOI] [PMC free article] [PubMed] [Google Scholar]
- 2. Pavlova NN, Thompson CB. The emerging hallmarks of cancer metabolism. Cell Metab. 2016;23:27‐47. [DOI] [PMC free article] [PubMed] [Google Scholar]
- 3. Ward PS, Thompson CB. Metabolic reprogramming: a cancer hallmark even warburg did not anticipate. Cancer Cell. 2012;21:297‐308. [DOI] [PMC free article] [PubMed] [Google Scholar]
- 4. Luo X, Hong L, Cheng C, et al. DNMT1 mediates metabolic reprogramming induced by Epstein‐Barr virus latent membrane protein 1 and reversed by grifolin in nasopharyngeal carcinoma. Cell Death Dis. 2018;9:619. [DOI] [PMC free article] [PubMed] [Google Scholar]
- 5. Luo X, Zhao X, Cheng C, Li N, Liu Y, Cao Y. The implications of signaling lipids in cancer metastasis. Exp Mol Med. 2018;50:127. [DOI] [PMC free article] [PubMed] [Google Scholar]
- 6. Rosenfeld MG, Lunyak VV, Glass CK. Sensors and signals: a coactivator/corepressor/epigenetic code for integrating signal‐dependent programs of transcriptional response. Genes Dev. 2006;20:1405‐1428. [DOI] [PubMed] [Google Scholar]
- 7. Houten SM, Wanders RJ. A general introduction to the biochemistry of mitochondrial fatty acid beta‐oxidation. J Inherit Metab Dis. 2010;33:469‐477. [DOI] [PMC free article] [PubMed] [Google Scholar]
- 8. Luo X, Cheng C, Tan Z, et al. Emerging roles of lipid metabolism in cancer metastasis. Mol Cancer. 2017;16:76. [DOI] [PMC free article] [PubMed] [Google Scholar]
- 9. Beloribi‐Djefaflia S, Vasseur S, Guillaumond F. Lipid metabolic reprogramming in cancer cells. Oncogenesis. 2016;5:e189. [DOI] [PMC free article] [PubMed] [Google Scholar]
- 10. Carracedo A, Cantley LC, Pandolfi PP. Cancer metabolism: fatty acid oxidation in the limelight. Nat Rev Cancer. 2013;13:227‐232. [DOI] [PMC free article] [PubMed] [Google Scholar]
- 11. Fisher KW, Das B, Kortum RL, Chaika OV, Lewis RE. Kinase suppressor of ras 1 (KSR1) regulates PGC1alpha and estrogen‐related receptor alpha to promote oncogenic Ras‐dependent anchorage‐independent growth. Mol Cell Biol. 2011;31:2453‐2461. [DOI] [PMC free article] [PubMed] [Google Scholar]
- 12. Bhalla K, Hwang BJ, Dewi RE, et al. PGC1alpha promotes tumor growth by inducing gene expression programs supporting lipogenesis. Can Res. 2011;71:6888‐6898. [DOI] [PMC free article] [PubMed] [Google Scholar]
- 13. McGuirk S, Gravel SP, Deblois G, et al. PGC‐1alpha supports glutamine metabolism in breast cancer. Cancer Metab. 2013;1:22. [DOI] [PMC free article] [PubMed] [Google Scholar]
- 14. Tennakoon JB, Shi Y, Han JJ, et al. Androgens regulate prostate cancer cell growth via an AMPK‐PGC‐1alpha‐mediated metabolic switch. Oncogene. 2014;33:5251‐5261. [DOI] [PMC free article] [PubMed] [Google Scholar]
- 15. Lin J, Handschin C, Spiegelman BM. Metabolic control through the PGC‐1 family of transcription coactivators. Cell Metab. 2005;1:361‐370. [DOI] [PubMed] [Google Scholar]
- 16. Settembre C, De Cegli R, Mansueto G, et al. TFEB controls cellular lipid metabolism through a starvation‐induced autoregulatory loop. Nat Cell Biol. 2013;15:647‐658. [DOI] [PMC free article] [PubMed] [Google Scholar]
- 17. Sen N, Satija YK, Das S. PGC‐1alpha, a key modulator of p53, promotes cell survival upon metabolic stress. Mol Cell. 2011;44:621‐634. [DOI] [PubMed] [Google Scholar]
- 18. Luo X, Li N, Zhong J, et al. Grifolin inhibits tumor cells adhesion and migration via suppressing interplay between PGC1alpha and Fra‐1/LSF‐ MMP2/CD44 axes. Oncotarget. 2016;7:68708‐68720. [DOI] [PMC free article] [PubMed] [Google Scholar]
- 19. Louet JF, Hayhurst G, Gonzalez FJ, Girard J, Decaux JF. The coactivator PGC‐1 is involved in the regulation of the liver carnitine palmitoyltransferase I gene expression by cAMP in combination with HNF4 alpha and cAMP‐response element‐binding protein (CREB). J Biol Chem. 2002;277:37991‐38000. [DOI] [PubMed] [Google Scholar]
- 20. Vega RB, Huss JM, Kelly DP. The coactivator PGC‐1 cooperates with peroxisome proliferator‐activated receptor alpha in transcriptional control of nuclear genes encoding mitochondrial fatty acid oxidation enzymes. Mol Cell Biol. 2000;20:1868‐1876. [DOI] [PMC free article] [PubMed] [Google Scholar]
- 21. Song S, Zhang Y, Ma K, et al. Peroxisomal proliferator activated receptor gamma coactivator (PGC‐1alpha) stimulates carnitine palmitoyltransferase I (CPT‐Ialpha) through the first intron. Biochem Biophys Acta. 2004;1679:164‐173. [DOI] [PubMed] [Google Scholar]
- 22. Zhang Y, Ma K, Song S, Elam MB, Cook GA, Park EA. Peroxisomal proliferator‐activated receptor‐gamma coactivator‐1 alpha (PGC‐1 alpha) enhances the thyroid hormone induction of carnitine palmitoyltransferase I (CPT‐I alpha). J Biol Chem. 2004;279:53963‐53971. [DOI] [PubMed] [Google Scholar]
- 23. Bonnefont JP, Djouadi F, Prip‐Buus C, Gobin S, Munnich A, Bastin J. Carnitine palmitoyltransferases 1 and 2: biochemical, molecular and medical aspects. Mol Aspects Med. 2004;25:495‐520. [DOI] [PubMed] [Google Scholar]
- 24. Qu Q, Zeng F, Liu X, Wang QJ, Deng F. Fatty acid oxidation and carnitine palmitoyltransferase I: emerging therapeutic targets in cancer. Cell Death Dis. 2016;7:e2226. [DOI] [PMC free article] [PubMed] [Google Scholar]
- 25. Wang YN, Zeng ZL, Lu J, et al. CPT1A‐mediated fatty acid oxidation promotes colorectal cancer cell metastasis by inhibiting anoikis. Oncogene. 2018;37:6025‐6040. [DOI] [PubMed] [Google Scholar]
- 26. Schlaepfer IR, Rider L, Rodrigues LU, et al. Lipid catabolism via CPT1 as a therapeutic target for prostate cancer. Mol Cancer Ther. 2014;13:2361‐2371. [DOI] [PMC free article] [PubMed] [Google Scholar]
- 27. Xu A, Wang B, Fu J, et al. Diet‐induced hepatic steatosis activates Ras to promote hepatocarcinogenesis via CPT1alpha. Cancer Lett. 2019;442:40‐52. [DOI] [PubMed] [Google Scholar]
- 28. Cirillo A, Di Salle A, Petillo O, et al. High grade glioblastoma is associated with aberrant expression of ZFP57, a protein involved in gene imprinting, and of CPT1A and CPT1C that regulate fatty acid metabolism. Cancer Biol Ther. 2014;15:735‐741. [DOI] [PMC free article] [PubMed] [Google Scholar]
- 29. Shao H, Mohamed EM, Xu GG, et al. Carnitine palmitoyltransferase 1A functions to repress FoxO transcription factors to allow cell cycle progression in ovarian cancer. Oncotarget. 2016;7:3832‐3846. [DOI] [PMC free article] [PubMed] [Google Scholar]
- 30. Vander Heiden MG. Targeting cancer metabolism: a therapeutic window opens. Nat Rev Drug Discovery. 2011;10:671‐684. [DOI] [PubMed] [Google Scholar]
- 31. Hossain F, Al‐Khami AA, Wyczechowska D, et al. Inhibition of fatty acid oxidation modulates immunosuppressive functions of myeloid‐derived suppressor cells and enhances cancer therapies. Cancer Immunol Res. 2015;3:1236‐1247. [DOI] [PMC free article] [PubMed] [Google Scholar]
- 32. Camarda R, Zhou AY, Kohnz RA, et al. Inhibition of fatty acid oxidation as a therapy for MYC‐overexpressing triple‐negative breast cancer. Nat Med. 2016;22:427‐432. [DOI] [PMC free article] [PubMed] [Google Scholar]
- 33. Park JH, Vithayathil S, Kumar S, et al. Fatty acid oxidation‐driven Src links mitochondrial energy reprogramming and oncogenic properties in triple‐negative breast cancer. Cell Rep. 2016;14:2154‐2165. [DOI] [PMC free article] [PubMed] [Google Scholar]
- 34. Samudio I, Harmancey R, Fiegl M, et al. Pharmacologic inhibition of fatty acid oxidation sensitizes human leukemia cells to apoptosis induction. J Clin Investig. 2010;120:142‐156. [DOI] [PMC free article] [PubMed] [Google Scholar]
- 35. Chen CL, Uthaya Kumar DB, Punj V, et al. NANOG metabolically reprograms tumor‐initiating stem‐like cells through tumorigenic changes in oxidative phosphorylation and fatty acid metabolism. Cell Metab. 2016;23:206‐219. [DOI] [PMC free article] [PubMed] [Google Scholar]
- 36. Hernlund E, Ihrlund LS, Khan O, et al. Potentiation of chemotherapeutic drugs by energy metabolism inhibitors 2‐deoxyglucose and etomoxir. Int J Cancer. 2008;123:476‐483. [DOI] [PubMed] [Google Scholar]
- 37. Chua MLK, Wee JTS, Hui EP, Chan ATC. Nasopharyngeal carcinoma. Lancet. 2016;387:1012‐1024. [DOI] [PubMed] [Google Scholar]
- 38. Mao YP, Xie FY, Liu LZ, et al. Re‐evaluation of 6th edition of AJCC staging system for nasopharyngeal carcinoma and proposed improvement based on magnetic resonance imaging. Int J Radiat Oncol Biol Phys. 2009;73:1326‐1334. [DOI] [PubMed] [Google Scholar]
- 39. Tan Z, Xiao L, Tang M, et al. Targeting CPT1A‐mediated fatty acid oxidation sensitizes nasopharyngeal carcinoma to radiation therapy. Theranostics. 2018;8:2329‐2347. [DOI] [PMC free article] [PubMed] [Google Scholar]
- 40. Ramji DP, Foka P. CCAAT/enhancer‐binding proteins: structure, function and regulation. Biochem J. 2002;365:561‐575. [DOI] [PMC free article] [PubMed] [Google Scholar]
- 41. Caro P, Kishan AU, Norberg E, et al. Metabolic signatures uncover distinct targets in molecular subsets of diffuse large B cell lymphoma. Cancer Cell. 2012;22:547‐560. [DOI] [PMC free article] [PubMed] [Google Scholar]
- 42. Hu J, Deng X, Bian X, et al. The expression of functional chemokine receptor CXCR4 is associated with the metastatic potential of human nasopharyngeal carcinoma. Clin Cancer Res. 2005;11(13):4658–65. [DOI] [PubMed] [Google Scholar]
- 43. Chen EI, Hewel J, Krueger JS, et al. Adaptation of energy metabolism in breast cancer brain metastases. Can Res. 2007;67:1472‐1486. [DOI] [PubMed] [Google Scholar]
- 44. Haq R, Shoag J, Andreu‐Perez P, et al. Oncogenic BRAF regulates oxidative metabolism via PGC1alpha and MITF. Cancer Cell. 2013;23:302‐315. [DOI] [PMC free article] [PubMed] [Google Scholar]
- 45. Do MT, Kim HG, Choi JH, Jeong HG. Metformin induces microRNA‐34a to downregulate the Sirt1/Pgc‐1alpha/Nrf2 pathway, leading to increased susceptibility of wild‐type p53 cancer cells to oxidative stress and therapeutic agents. Free Radic Biol Med. 2014;74:21‐34. [DOI] [PubMed] [Google Scholar]
- 46. LeBleu VS, O'Connell JT, Gonzalez Herrera KN, et al. PGC‐1alpha mediates mitochondrial biogenesis and oxidative phosphorylation in cancer cells to promote metastasis. Nat Cell Biol. 2014;16(10):992‐1003. [DOI] [PMC free article] [PubMed] [Google Scholar]
- 47. Xiao L, Hu ZY, Dong X, et al. Targeting Epstein‐Barr virus oncoprotein LMP1‐mediated glycolysis sensitizes nasopharyngeal carcinoma to radiation therapy. Oncogene. 2014;33:4568‐4578. [DOI] [PMC free article] [PubMed] [Google Scholar]
- 48. Lu J, Tang M, Li H, et al. EBV‐LMP1 suppresses the DNA damage response through DNA‐PK/AMPK signaling to promote radioresistance in nasopharyngeal carcinoma. Cancer Lett. 2016;380:191‐200. [DOI] [PubMed] [Google Scholar]
- 49. Carracedo A, Weiss D, Leliaert AK, et al. A metabolic prosurvival role for PML in breast cancer. J Clin Investig. 2012;122:3088‐3100. [DOI] [PMC free article] [PubMed] [Google Scholar]
- 50. Zaugg K, Yao Y, Reilly PT, et al. Carnitine palmitoyltransferase 1C promotes cell survival and tumor growth under conditions of metabolic stress. Genes Dev. 2011;25:1041‐1051. [DOI] [PMC free article] [PubMed] [Google Scholar]
- 51. Pike LS, Smift AL, Croteau NJ, Ferrick DA, Wu M. Inhibition of fatty acid oxidation by etomoxir impairs NADPH production and increases reactive oxygen species resulting in ATP depletion and cell death in human glioblastoma cells. Biochem Biophys Acta. 2011;1807:726‐734. [DOI] [PubMed] [Google Scholar]
- 52. Holla VR, Wu H, Shi Q, Menter DG, DuBois RN. Nuclear orphan receptor NR4A2 modulates fatty acid oxidation pathways in colorectal cancer. J Biol Chem. 2011;286:30003‐30009. [DOI] [PMC free article] [PubMed] [Google Scholar]
- 53. Sancho P, Burgos‐Ramos E, Tavera A, et al. MYC/PGC‐1alpha balance determines the metabolic phenotype and plasticity of pancreatic cancer stem cells. Cell Metab. 2015;22:590‐605. [DOI] [PubMed] [Google Scholar]
- 54. Hendricks‐Taylor LR, Bachinski LL, Siciliano MJ, et al. The CCAAT/enhancer binding protein (C/EBP alpha) gene (CEBPA) maps to human chromosome 19q13.1 and the related nuclear factor NF‐IL6 (C/EBP beta) gene (CEBPB) maps to human chromosome 20q13.1. Genomics. 1992;14:12‐17. [DOI] [PubMed] [Google Scholar]
- 55. Osada S, Yamamoto H, Nishihara T, Imagawa M. DNA binding specificity of the CCAAT/enhancer‐binding protein transcription factor family. J Biol Chem. 1996;271:3891‐3896. [DOI] [PubMed] [Google Scholar]
- 56. Wang H, Peiris TH, Mowery A, Le Lay J, Gao Y, Greenbaum LE. CCAAT/enhancer binding protein‐beta is a transcriptional regulator of peroxisome‐proliferator‐activated receptor‐gamma coactivator‐1alpha in the regenerating liver. Mol Endocrinol. 2008;22:1596‐1605. [DOI] [PMC free article] [PubMed] [Google Scholar]
- 57. Zhao NQ, Li XY, Wang L, et al. Palmitate induces fat accumulation by activating C/EBPbeta‐mediated G0S2 expression in HepG2 cells. World J Gastroenterol. 2017;23:7705‐7715. [DOI] [PMC free article] [PubMed] [Google Scholar]
- 58. Zidek LM, Ackermann T, Hartleben G, et al. Deficiency in mTORC1‐controlled C/EBPbeta‐mRNA translation improves metabolic health in mice. EMBO Rep. 2015;16:1022‐1036. [DOI] [PMC free article] [PubMed] [Google Scholar]
- 59. Kurzejamska E, Johansson J, Jirstrom K, et al. C/EBPbeta expression is an independent predictor of overall survival in breast cancer patients by MHCII/CD4‐dependent mechanism of metastasis formation. Oncogenesis. 2014;3:e125. [DOI] [PMC free article] [PubMed] [Google Scholar]
- 60. Du YX, Zhang LH, Wang XH, et al. Expression of CCAAT/enhancer binding protein beta in human gastric carcinoma and its clinical significance. Zhonghua Wei Chang Wai Ke Za Zhi. 2013;16:179‐182. [PubMed] [Google Scholar]
- 61. Gardiner JD, Abegglen LM, Huang X, et al. C/EBPbeta‐1 promotes transformation and chemoresistance in Ewing sarcoma cells. Oncotarget. 2017;8:26013‐26026. [DOI] [PMC free article] [PubMed] [Google Scholar]
- 62. Liu D, Zhang XX, Li MC, et al. C/EBPbeta enhances platinum resistance of ovarian cancer cells by reprogramming H3K79 methylation. Nat Commun. 2018;9:1739. [DOI] [PMC free article] [PubMed] [Google Scholar]
- 63. Karamanlidis G, Karamitri A, Docherty K, Hazlerigg DG, Lomax MA. C/EBPbeta reprograms white 3T3‐L1 preadipocytes to a Brown adipocyte pattern of gene expression. J Biol Chem. 2007;282:24660‐24669. [DOI] [PubMed] [Google Scholar]
- 64. Chen X, Zhong J, Dong D, Liu G, Yang P. Endoplasmic reticulum stress‐induced CHOP inhibits PGC‐1alpha and causes mitochondrial dysfunction in diabetic embryopathy. Toxicol Sci. 2017;158:275‐285. [DOI] [PMC free article] [PubMed] [Google Scholar]
Associated Data
This section collects any data citations, data availability statements, or supplementary materials included in this article.
Supplementary Materials