

Abstract
Background:
Exposure to “early life” adversity is known to predict DNA methylation (DNAm) patterns that may be related to psychiatric risk. However, few studies have investigated whether adversity has time-dependent effects based on the age at exposure.
Methods:
Using a two-stage structured life course modeling approach (SLCMA), we tested the hypothesis that there are sensitive periods when adversity induced greater DNAm changes. We tested this hypothesis in relation to two alternatives: an accumulation hypothesis, in which the effect of adversity increases with the number of occasions exposed, regardless of timing, and a recency model, in which the effect of adversity is stronger for more proximal events. Data came from the Accessible Resource for Integrated Epigenomics Studies (ARIES), a subsample of mother-child pairs from the Avon Longitudinal Study of Parents and Children (ALSPAC; n=691–774).
Results:
After covariate adjustment and multiple testing correction, we identified 38 CpG sites that were differentially methylated at age 7 following exposure to adversity. Most loci (n=35) were predicted by the timing of adversity, namely exposures before age 3. Neither the accumulation nor recency of the adversity explained considerable variability in DNAm. A standard EWAS of lifetime exposure (vs. no exposure) failed to detect these associations.
Conclusions:
The developmental timing of adversity explains more variability in DNAm than the accumulation or recency of exposure. Very early childhood appears to be a sensitive period when exposure to adversity predicts differential DNAm patterns. Classification of individuals as exposed vs. unexposed to “early life” adversity may dilute observed effects.
Keywords: epigenetics, DNA methylation, childhood adversity, sensitive periods, children, longitudinal
Introduction
Exposure to childhood adversity, including poverty (1), abuse (2, 3), family dysfunction (4, 5), and other stressors (6, 7), is a common and potent determinant of mental health across the lifespan, increasing risk of childhood- and adult-onset psychiatric disorders by at least two-fold (8–10). Although the biological mechanisms explaining this relationship are poorly understood, accumulating evidence suggests adversity may become programmed molecularly, leaving behind biological memories that persistently alter genome function and increase susceptibility to mental disorders. Indeed, dozens of candidate gene and epigenome-wide association studies (EWAS) in both animals and humans have shown that early life adversity is associated with persistent alterations in the epigenome (11–15), including changes in DNA methylation (DNAm), which is the most studied epigenetic mechanism involving the addition of methyl groups to cytosines in the DNA sequence (16, 17). These differential DNAm sites can alter gene expression, providing a mechanism by which gene by environment interactions affect biological responses (18).
Recent evidence, particularly from animal studies, suggests that epigenetic programming may be developmentally time-sensitive and that there may be sensitive periods (19, 20) when adversity exposure is more likely to induce DNAm changes. For instance, rodent experiments have demonstrated the existence of sensitive periods for different aspects of epigenetic regulation – from embryonic reprogramming to postnatal exposure leading to differences in epigenetic outcomes and gene expression (21–25). Recent work in nonhuman primates also suggests that there are differential effects on DNAm based on whether adversity exposure, including maternal separation, occurred at birth versus later in development (26). Yet, few human studies, whether candidate gene (16, 27–29) or EWAS (30–32), have examined the time-dependent effects of psychosocial adversity on DNAm; nearly all human epigenetic studies have instead focused on the presence versus absence of exposure to “early life” adversity. Thus, it is unknown whether there are age stages when adversity differentially affects DNAm, children are therefore more vulnerable, and prevention efforts could be most efficacious.
This study aimed to address this limitation by using data from a prospective, birth cohort of children to test the hypothesis that there are sensitive periods associated with DNAm alterations following adversity exposure. To test this hypothesis, we used a two-stage Structured Life Course Modeling Approach (SLCMA) (33, 34) to examine the effect of repeated exposure to seven types of childhood adversities across three developmental periods (in very early childhood, before age 3; early childhood, ages 3–5; and middle childhood, ages 6–7) on DNAm profiles at age 7. Recognizing that alternative conceptual models have been proposed to explain the effects of adversity, we also used the SLCMA to determine whether the sensitive period model explained more variability in DNAm relative to two other theoretical models described in the life course epidemiology literature (35–37): (1) an accumulation model (38–40), in which the effect of adversity on DNAm increases with the number of occasions exposed, regardless of timing; and (2) a recency model (41), in which the effect of adversity on DNAm is stronger for more proximal events. Finally, to evaluate the potential advantage of the SLCMA relative to the standard EWAS approach, which would ignore the timing or frequency of adversity, we examined the number of epigenome-wide significant loci identified by each approach and evaluated their degree of overlap.
Methods and Materials
Sample and Procedures
Data came from the Avon Longitudinal Study of Parents and Children (ALSPAC), a population-based birth cohort (42–44). ALSPAC generated blood-based DNAm profiles at birth and age 7 as part of the Accessible Resource for Integrated Epigenomics Studies (ARIES), a subsample of 1,018 mother-child pairs from the ALSPAC (45). The ARIES mother-child pairs were randomly selected out of those with complete data across at least five waves of data collection (Supplemental Materials).
Measures
Exposure to Adversity
We examined the effect of seven adversities shown previously to associate with epigenetic marks (46–48): (a) caregiver physical or emotional abuse (49–52); (b) sexual or physical abuse (by anyone) (49–52); (c) maternal psychopathology (53, 54); (d) one adult in the household (55); (e) family instability (56, 57); (f) financial stress/poverty (58, 59); and (g) neighborhood disadvantage/poverty (60). These adversities were chosen because they capture experiences that deviate from a child’s expected social and physical environment (61). Each adversity was measured via maternal report on at least four occasions at or before age 7 from a single item or psychometrically validated standardized measures. Specific time periods of assessment varied across adversity type (Supplemental Materials). For each adversity type, we generated three sets of encoded variables (Supplemental Materials): (a) a set of variables indicating presence of the adversity at a specific developmental stage versus absence of the adversity at that stage, to test the sensitive period hypothesis; (b) a single variable denoting the total number of time periods of exposure to a given adversity, to test the accumulation hypothesis; and (c) a single variable denoting the total number of developmental periods of exposure, with each exposure weighted by the age of the child during the measurement time period, to test the recency hypothesis; this variable upweighted more recent exposures, allowing us to determine whether more recent exposures were more impactful.
DNA Methylation
DNAm was measured at 485,000 CpG dinucleotide sites across the genome using the Illumina Infinium Human Methylation 450k BeadChip microarray. DNA for this assay was extracted from cord blood and peripheral blood leukocytes at age 7. DNA methylation wet laboratory procedures, preprocessing analyses, and quality control were performed at the University of Bristol (Supplemental Materials and (45)). DNAm levels are expressed as a ‘beta’ value (β-value), representing the proportion of cells methylated at each interrogated CpG site.
Prior to analysis, raw methylation β-values, which are preferred over M-values due to their interpretability (62), were normalized (63) to remove or minimize the effects of variation due to technical artifacts. To adjust for DNAm variation due to cell type heterogeneity in peripheral and cord blood samples, we estimated cell counts from DNAm profiles (64) and regressed out these estimates from the normalized β-values. Additionally, to remove possible outliers, we winsorized the β-values at each CpG site, setting the bottom 5% and top 95% of values to the 5th and 95th quantile, respectively (65).
Covariates
To adjust for baseline socio-demographic differences in the cohort, all analyses additionally controlled for the following variables, measured at child birth (Supplemental Materials): child race/ethnicity; child birth weight; maternal age; number of previous pregnancies; sustained maternal smoking during pregnancy; and parent social class (66). Justification for the inclusion of parent social class as a covariate along with alternative results from analyses that exclude social class as a covariate are presented in the Supplemental Materials.
Data Analysis
Our primary analyses involved comparing the three theoretical models using the SLCMA, which was originally developed by Mishra (68) and later extended by Smith (33, 34) to analyze repeated, binary exposure data across the life course (Supplemental Materials). The major advantage of the SLCMA is that it provides an unbiased way to compare multiple competing theoretical models simultaneously and identify the most parsimonious explanation for the observed outcome variation. The SLCMA uses Least Angle Regression (LARS) (69) and an associated covariance test (70) to identify the single theoretical model (or potentially more than one model working in combination) that explains the most outcome variation (R2). Compared to other methods for structured life course analysis, LARS has greater statistical power (33) and does not over-inflate effect size estimates (69) or bias hypothesis tests (70). The SLCMA has been used in several life course epidemiology studies (71, 72), including studies of other birth cohorts (73, 74). The LARS procedure functions under the same assumptions as multiple linear regression.
In the first stage, we entered the set of encoded variables described previously into the LARS variable selection procedure (69). LARS identified the variable with the strongest association with the outcome, thus identifying whether the sensitive period, accumulation, or recency model was most supported by the data. Therefore, for each CpG site, seven unique LARS models were selected, corresponding to each type of adversity. For each selected model, we performed a covariance test of the null hypothesis that the variable selected is unassociated with the outcome. With respect to multiple testing, the covariance test p-values are adjusted for the number of variables included in the LARS procedure, controlling the type I error rate for each adversity type and CpG site. To adjust for confounding during the first stage, we regressed each encoded variable on the covariates and implemented LARS on the regression residuals (34).
In the second stage, the theoretical model shown in the first stage to best fit the observed data for a specific type of adversity was then carried forward to a multivariate regression framework, where measures of effect were estimated. Only models with a covariance test p-value <1×10⁻⁷, the standard Bonferroni correction threshold for epigenome-wide statistical significance, were included in the second stage. Positive effect estimates thus indicate elevated (hyper) methylation and negative effect estimates indicate decreased (hypo) methylation. The same covariates were also included in the second stage. We compared the distribution of theoretical models across the Bonferroni-significant CpG sites with an omnibus chi-squared test, which tested the null hypothesis that the theoretical models were likely to be represented among the significant results in proportion to the frequency in which they were tested.
To evaluate the loss or gain of information when using a simpler versus more complex analytic approach, we also performed seven EWASs (one for each type of adversity) to evaluate the association between lifetime exposure to adversity (coded as ever versus never exposed) and DNAm across all CpG sites. The EWAS results were then compared to the SLCMA to determine if the two approaches yielded similar or distinct conclusions regarding the number of significant loci detected.
We also performed sensitivity analyses to evaluate the fit of the LARS selection procedure, determine the degree of differential methylation present at birth, and control for genetic variation. We examined the biological significance of the findings by: (a) examining the correlation in methylation between blood and brain tissue for the top CpG sites using an online database (75); (b) investigating enrichment of regulatory elements annotated to false discovery rate (FDR)-significant CpG sites; (c) performing a functional clustering analysis of all Gene Ontology (GO) terms for genes annotated to FDR-significant sites in DAVID 6.8 (76); and (d) assessing the selective constraint of these genes using the Exome Aggregation Consortium (ExAC) (77).
Results
Sample Characteristics and Distribution of Exposure to Adversity
Demographic characteristics of the ARIES analytic sample are shown in Table S1 for the total sample and among children exposed to any adversity (n=650, 67%, experienced at least one adversity at some point in their lifetime). Details on the prevalence and correlations of exposure across time are also reported in Figures 1 and S1 and Table S2. Of note, differences in the prevalence of exposure across time are unlikely to affect model selection as all variables are automatically standardized by the LARS procedure.
Figure 1. Exposure to adversity in the ARIES dataset.
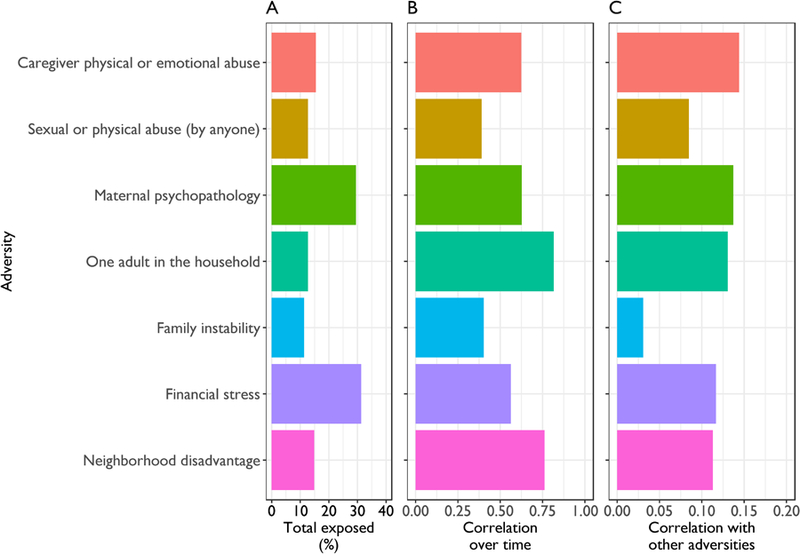
The figure displays the lifetime prevalence by age 7 of exposure to each adversity (labeled as total exposed), the average correlation between exposure to one type of adversity at one time point with exposure to that same adversity at a second time point (labeled as correlation over time), and the average correlation between exposure to one type of adversity and a second type of adversity (labeled as correlation with other adversities). Panel A: The lifetime prevalence of each adversity varied by type. The most commonly reported adversities were financial stress (31%) and maternal psychopathology (29%). The remaining adversities were less reported adversities, but still common: caregiver physical or emotional abuse (15%), neighborhood disadvantage (15%), sexual or physical abuse (by anyone; 13%), one adult in the household (13%), and family instability (11%). Panel B: Among specific types of adversity, exposures tended to correlate over time, with neighboring time points being more related than distant time points. For instance, exposure to one adult in the household and neighborhood disadvantage were most strongly correlated over time (r=0.54–0.93 and r=0.67–0.89, respectively), whereas exposure to family instability (r=0.11–0.74) and sexual or physical abuse (r=0.02–0.69) were more weakly correlated across time. Panel C: The average correlation of having ever been exposed to the other adversities was modest across adversities, suggesting that we were capturing unique subtypes of adversity.
Model Comparison and Effect Estimation
We identified 38 CpG sites (“top sites”) that were differentially methylated at age 7 following exposure to adversity (p<1×10⁻⁷, Figure 2). Methylation at most sites (n=35) was related to the developmental timing of exposure to adversity, especially adversity during very early childhood, meaning between birth and age 2 (Figure 3a). In fact, exposure to adversity during very early childhood explained variability at more CpG sites (22 in total) than expected, while the accumulation and recency models were associated with fewer CpG sites than expected (1 and 2 CpG sites, respectively; 32=11.43, p=0.02).
Figure 2. Manhattan plot displaying top CpG sites associated with exposure to adversity.
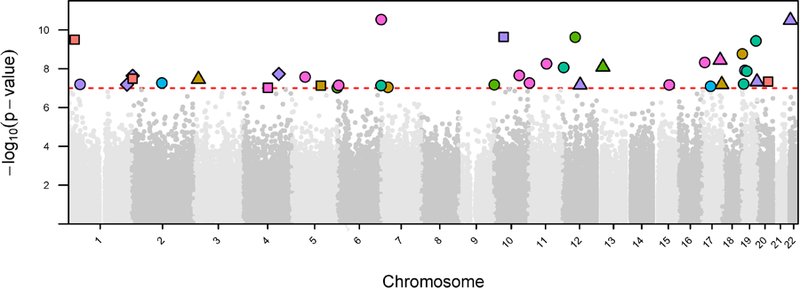
In this Manhattan plot, the x-axis is the chromosomal position for each CpG site and the y-axis is the -log10 p-value for the association between exposure to adversity and DNAm values at each CpG site. The dashed line shows the epigenome-wide significance level, with each CpG site above the line representing a statistically significant association (p<1×10⁻⁷). The color of each CpG site refers to the type of adversity. The shape of each CpG site indicates the lifecourse model tested. The sensitive period hypotheses were encoded as circle: very early childhood, triangle: early childhood, square: middle childhood. The recency hypothesis was encoded as a diamond. As shown, CpG sites significantly affected by exposure adversity were distributed throughout the genome. There was no obvious genomic spatial pattern by adversity type or timing of exposure.
Figure 3. Frequency each lifecourse theoretical model was chosen for each type of adversity.

Each plot displays the number of CpG sites for which adversity significantly predicted methylation, after controlling for covariates and correcting for multiple comparisons using (a) a Bonferroni threshold (p<1×10⁻⁷, n=38 sites) and (b) a False Discovery Rate (FDR) correction q < 0.05 (n=380 sites). The distribution of theoretical models chosen first by the LARS procedure for top CpG sites was significantly different than expected by chance, with exposure to adversity during sensitive periods, especially during very early childhood, more frequently predicting methylation.
As shown in Table 1 and Figure 3a, neighborhood disadvantage was the type of adversity predicting the greatest number of genome-wide methylation differences (10 CpG sites), followed by financial stress (9 CpG sites), sexual or physical abuse (by anyone) and one adult in the household (5 CpG sites). Maternal psychopathology, caregiver physical or emotional abuse, and family instability were associated with differences at four, three, and two CpG sites, respectively.
Table 1.
Results of the Structured Lifecourse Modeling Approach (SLCMA) in ARIES, with annotation to the closest gene, for the Bonferroni-significant CpG sites (p<1×10⁻⁷).
| CpG site | Adversity | First hypothesis chosen by LARS procedure | DNAm in unexposed group (beta) | DNAm in exposed group (beta) | Increases in R^2 | P | Beta (effect estimate) | SE | Lower 95% Cl | Upper 95% Cl | Chr | Coordinate (bp) | Nearest gene | Distance to nearest gene (bp) |
|---|---|---|---|---|---|---|---|---|---|---|---|---|---|---|
| cgl0713431 | Caregiver physical or emotional abuse (N=719) | middle childhood (age 6) | 0.132 | 0.139 | 0.025 | 4.59E-08 | 0.004 | 0.0019 | 0.004 | 0.012 | 20 | 43933204 | MATN4 | 0 |
| cel2023170a | middle childhood (3ge 6) | 0.074 | 0.086 | 0.038 | 3.17E-10* | 0.013 | 0.0022 | 0.008 | 0.017 | 1 | 23751761 | TCEA3 | 499 | |
| cgl9S25600a,b | middle childhood (age 6) | 0.458 | 0.384 | 0.027 | 3.23E-08 | −0.072 | 0.0158 | −0.103 | −0.041 | 2 | 3704501 | ALLC | 1283 | |
| Cg0l370449 | Sexual or physical abuse (by anvone) (N=703) | very early childhood (age 2.5) | 0.244 | 0.334 | 0.030 | S.S7E-08 | 0.0S3 | 0.0168 | 0.050 | 0.116 | 7 | 27183369 | HOXA-AS3 | 0 |
| cg06430102 | very early childhood (age 2.5) | 0.926 | 0.862 | 0.037 | 1.69E-09* | −0.05S | 0.0103 | −0.07S | −0.03 S | 19 | 1151960 | SBN02 | 0 | |
| cgl9170021 | early childhood (age 4.75) | 0.734 | 0.827 | 0.028 | 6.41E-08 | 0.092 | 0.0209 | 0.051 | 0.134 | 17 | 79077169 | BAL4P2 | 0 | |
| cg05072819a | early childhood (age 5.75) | 0.040 | 0.053 | 0.030 | 3.49E-08 | 0.014 | 0.0027 | 0.009 | 0.019 | 3 | 20081367 | KAT2B | 155 | |
| cg05936516 | middle childhood (age 6.75) | 0.128 | 0.153 | 0.031 | 7.47E-08 | 0.025 | 0.0048 | 0.016 | 0.035 | 5 | 114507066 | TRIM36 | 0 | |
| cg045S3S13 | Maternal psychopathology (N=o91) | very early childhood (age 8 mo.) | 0.900 | 0.878 | 0.031 | 6.57E-08 | −0.023 | 0.0046 | −0.032 | −0.014 | 10 | 560323 | DIP2C | 0 |
| cgOS171937 | very early childhood (age 2.75) | 0.016 | 0.017 | 0.034 | 2.33E-10* | 0.001 | 0.0003 | 0.001 | 0.002 | 12 | 49454761 | RHEBL1 | 3705 | |
| cgl066662S | very early childhood (age 2.75) | 0.020 | 0.021 | 0.029 | 9.29E-08 | 0.002 | 0.0004 | 0.001 | 0.003 | 5 | 179050666 | HNRNPH1 | 0 | |
| cgl7S069S9 | early childhood (age 5) | 0.981 | 0.975 | 0.032 | S.16E-09* | −0.006 | 0.0012 | −0.009 | −0.004 | 13 | 2533S2S7 | RNF17 | 12 | |
| cg0S337366a | One adult in the household (N=710) | very early childhood (age 8 mo.) | 0.934 | 0.906 | 0.029 | 6.07E-08 | −0.032 | 0.0066 | −0.045 | −0.019 | 19 | 6371622 | ALKBH7 | 820 |
| csl0192O47 | very early childhood (ase 8 mo.) | 0.016 | 0.019 | 0.029 | 1.31 E-08* | 0.003 | 0.0007 | 0.002 | 0.005 | 19 | 18722754 | TMEM59L | 926 | |
| cg26990406 | very early childhood (age 8 mo.) | 0.868 | 0.72S | 0.027 | 7.22E-08 | −0.142 | 0.0308 | −0.203 | −0.082 | 7 | 178S29 | FAM20C | 14138 | |
| cg2446S070 | very early childhood (age 1.75) | 0.038 | 0.05S | 0.034 | 3.63E-10* | 0.023 | 0.0044 | 0.014 | 0.031 | 19 | 54976501 | CDC42EP5 | 0 | |
| cg03397307 | very early childhood (age 2.75) | 0.025 | 0.030 | 0.030 | 8.46E-09* | 0.005 | 0.0010 | 0.003 | 0.007 | 12 | 3S62423 | CRACR2A | 56 | |
| cglS3113S4 | Family instability (N=703) | very early childhood (age 2.5) | 0.019 | 0.022 | 0.027 | 7.97E-08 | 0.002 | 0.0005 | 0.001 | 0.003 | 17 | 34842312 | ZNHIT3 | 159 |
| cg27637303 | very early childhood (age 2.5) | 0.345 | 0.420 | 0.02S | 5.32E-08 | 0.078 | 0.0168 | 0.045 | 0.111 | 2 | 118942893 | INSIG2 | 75295 | |
| cgl1631610 | Financial stress (N=774) | very early childhood (age 8 mo.) | 0.949 | 0.923 | 0.027 | 1.20E-08* | −0.027 | 0.0057 | −0.03 8 | −0.016 | 19 | 11322739 | DOCK6 | 0 |
| cg067S3003 | very early childhood (age 1.75) | 0.860 | 0.893 | 0.024 | 6.25E-08 | 0.037 | 0.0083 | 0.021 | 0.053 | 1 | 45116008 | RNF220 | 0 | |
| cg01050704a | early childhood (age 5) | 0.017 | 0.019 | 0.025 | 4.6SE-08 | 0.002 | 0.0005 | 0.001 | 0.003 | 19 | 590S4995 | MZF1-AS1 | 0 | |
| cg02006977 | early childhood (age 5) | 0.015 | 0.017 | 0.024 | 6.87E-08 | 0.002 | 0.0005 | 0.001 | 0.003 | 12 | 69139955 | SLC35E3 | 0 | |
| cg2129945S | early childhood (age 5) | 0.110 | 0.147 | 0.035 | 3.19E-11* | 0.038 | 0.0070 | 0.024 | 0.052 | 22 | 20779896 | SCARF2 | 0 | |
| cgl9219503 | middle childhood (age 7) | 0.922 | 0.889 | 0.031 | 2.2SE-10* | −0.035 | 0.0071 | −0.049 | −0.021 | 10 | 37414802 | ANKRD30A | 0 | |
| cgll714S46 | Accumulation | 0.923 | 0.915 | 0.023 | 6.64E-08 | −0.005 | 0.0011 | −0.007 | −0.003 | 1 | 230419534 | GALNT2 | 165S | |
| cg21924472 | Recency | 0.756 | 0.770 | 0.027 | 1.87E-08 | 0.003 | 0.0006 | 0.002 | 0.004 | 4 | 139600734 | LINC00499 | 255235 | |
| cg24996440 | Recency | 0.566 | 0.585 | 0.026 | 2.2SE-08 | 0.004 | 0.0009 | 0.003 | 0.006 | 2 | 3583570 | RNASEH1 | 9119 | |
| cg00928478 | Neighborhood disadvantage (N=702) | very early childhood (age 1.75) | 0.020 | 0.0 18 | 0.027 | 2.19E-08 | −0.002 | 0.0005 | −0.003 | -0.001 | 10 | 99078824 | FRAT1 | 196 |
| ce01954337 | very earlv childhood (ase 1.75) | 0.050 | 0.059 | 0.028 | 5.32E-08 | 0.008 | 0.0018 | 0.005 | 0.012 | 11 | 3S19010 | NUP9S | 0 | |
| cg049966S9 | very early childhood (age 1.75) | 0.029 | 0.035 | 0.028 | 2.63E-08 | 0.006 | 0.0011 | 0.003 | 0.008 | 5 | 52285560 | ITGA2 | 0 | |
| cgl2069925 | very early childhood (age 1.75) | 0.042 | 0.048 | 0.030 | 4.72E-09* | 0.007 | 0.0014 | 0.004 | 0.009 | 17 | 11900858 | ZNF1S | 72 | |
| cgl4522055 | very early childhood (age 1.75) | 0.030 | 0.035 | 0.028 | 6.77E-08 | 0.005 | 0.0011 | 0.003 | 0.007 | 15 | 64338757 | DAPK2 | 235 | |
| cgl9157140 | very early childhood (age 1.75) | 0.014 | 0.016 | 0.037 | 2.S7E-11* | 0.002 | 0.0005 | 0.001 | 0.003 | 7 | 766323 | PRKAR1B | 0 | |
| cg21740964 | very early childhood (age 1.75) | 0.160 | 0.173 | 0.025 | 7.13E-08 | 0.014 | 0.0028 | 0.008 | 0.019 | 6 | 3849331 | FAM50B | 299 | |
| cg24S26S92a | very early childhood (age 1.75) | 0.016 | 0.0 18 | 0.030 | 5.50E-09* | 0.003 | 0.0006 | 0.002 | 0.004 | 11 | 71159390 | DHCR7 | 0 | |
| cg0S546016 | early childhood (age 5) | 0.050 | 0.056 | 0.029 | 3.63E-09* | 0.006 | 0.0012 | 0.004 | 0.009 | 17 | 72776238 | TMEM104 | 0 | |
| cgl2412390 | middle childhood (age 7) | 0.038 | 0.046 | 0.030 | 9.59E-08 | 0.008 | 0.0016 | 0.005 | 0.011 | 4 | 96469286 | UNC5C | 0 | |
DNAm = unadjusted DNA methylation (beta values) averaged within group; Increase in R2 = increase in R2 explained by first hypothesis chosen after accounting for covariates; P = p-value of covariance test assessing significance of increase in R2 explained; Beta, SE, Lower 95% CI, Upper 95% CI = parameter estimate, standard error, and lower and upper limits of 95% confidence interval of regression coefficient of first hypothesis chosen; Chr, Coordinate = chromosome and position of CpG site; Nearest gene, Distance to nearest gene = Gene symbol of and distance in bases to nearest gene from CpG site (as measured from transcription start site)
In potentially noisy probe list of Naeem et al. 2014 (i.e., cross-reactive probes, probes with SNPs/INDELs/repeat regions, probes affected by unknown factors)
In potentially noisy probe list of Chen et al. 2013 (i.e., cross-reactive probes, probes with SNPs)
significant at p < 1.43×10⁻⁸ , a more stringent p-value threshold that accounted for the testing of seven types of adversity (1×10⁻⁷ / 7=1.43×10⁻⁸)
Across all 38 top sites, exposure to adversity was typically associated with hypermethylation (73.7% positive beta coefficients; 32=8.53, p=0.004; Table 1). On average, exposure to adversity during a sensitive period was associated with a 2.5% difference in methylation level (beta) after controlling for all covariates (range 0.1–14.2%). For the two CpG sites associated with recency of exposure to financial stress, one additional adverse event was associated with a 0.3–0.4% increase in methylation per year of age at the event. For the single site associated with accumulation of exposure, one additional adverse event was associated with a 0.5% decrease in methylation. Of these 38 CpG sites, 14 remained statistically significant after imposing a more stringent p-value threshold that accounted for the testing of seven types of adversity (p=1×10⁻⁷ / 7=1.43×10⁻⁸; Table 1).
After relaxing the multiple testing correction threshold to a FDR q<0.05, there were 380 CpG sites affected by exposure to adversity (Figure 3b; Table S3). As with the top 38 Bonferroni-significant sites, methylation at 352 of the 380 FDR-significant sites was best explained by sensitive period models (Figures 3b, Table S3). Exposure in very early childhood explained methylation variation at more CpG sites than expected from the background for neighborhood disadvantage (Figures S2). The effects of adversity type and timing on methylation were distributed throughout the genome (Figure S3).
Exposed vs. Unexposed Analysis
Across the seven EWASs, which separately evaluated the effect of ever versus never exposed to each type of adversity on CpG site DNAm, only one statistically significant result emerged (Figure S4); this was for cg02431672, a locus located on chromosome 1 79kb away from the gene FAM183A and was associated with exposure to abuse (β=−0.005; p=1.77×10⁻⁸).
Overall, there was very little overlap in identified CpG sites across the top SLCMA and EWAS results. Most of the top 38 sites had effect estimates that were larger in the SLCMA compared to the EWAS (Figure 4). There was also little overlap in findings across specific CpG sites. For example, the cg02431672 locus, which was the top hit in the EWAS of abuse, did not emerge as a top hit in the SLCMA of abuse, failing to appear in the list of FDR significant loci (p=0.0138). Similarly, the top CpG site in the SLCMA (cg19157140), which suggested a sensitive period at age 1.75 associated with the effects of neighborhood disadvantage, was non-significant in the corresponding EWAS (β=0.001; p=0.0002; Figure 5). These results suggest that the SLCMA allowed us to more effectively identify methylation differences among children with and without a history of exposure to adversity.
Figure 4. Scatterplot displaying increased power in the SLCMA shown by the comparison of beta estimates from the EWAS vs. SLCMA approaches.
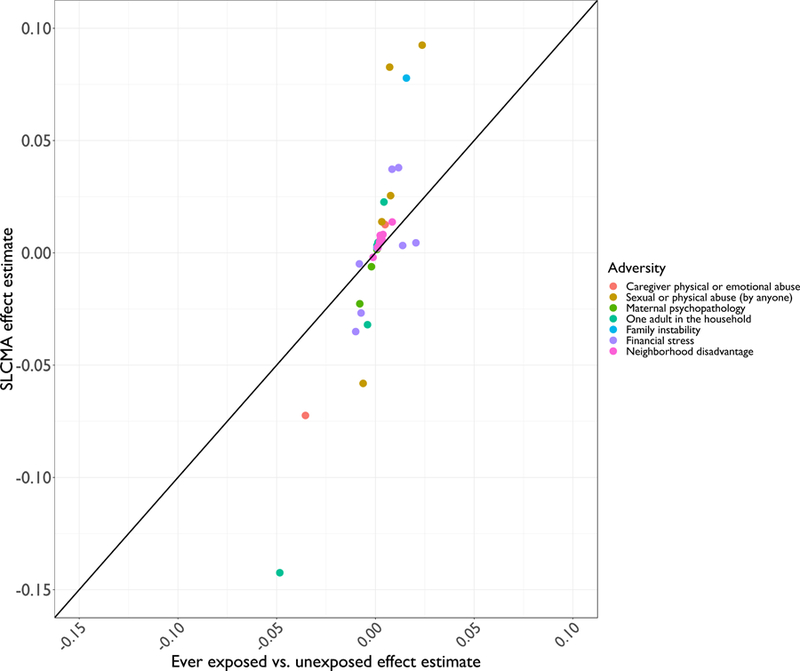
In this scatterplot, the y-axis represents the beta estimates associated with the 38 top CpG sites derived for the SLCMA; the x-axis represents the beta estimates associated with the same 38 CpG sites obtained from EWAS. Different types of adversity are indicated by colors. The black straight line denotes the 1:1 correspondence between the two sets of beta values. Substantial positive deviation from the line suggests increased power in the SLCMA. For most CpG sites, the magnitudes of effect were larger for the SLCMA compared to the EWAS results.
Figure 5. Comparison of EWAS vs. SLCMA estimates for the top CpG site identified in SLCMA, cg19157140.
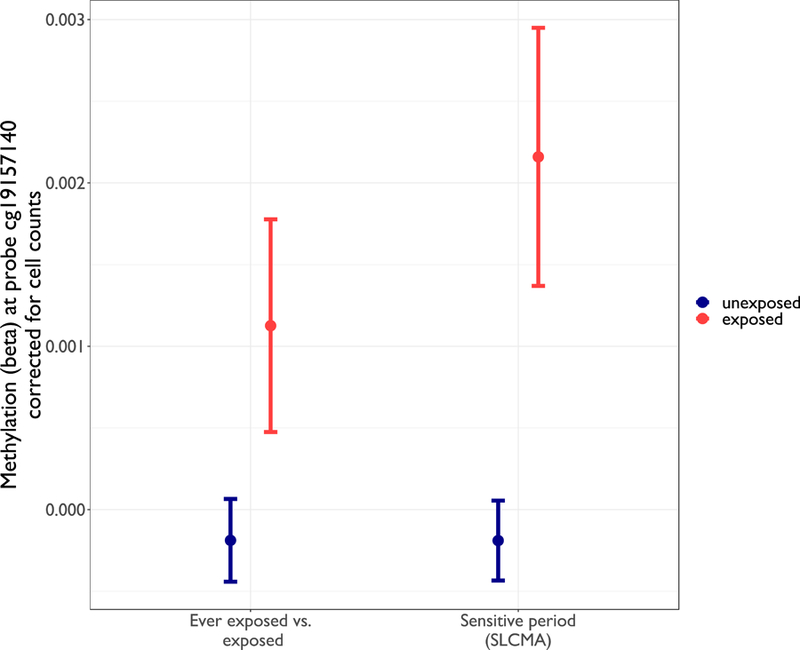
The effect estimates and the confidence intervals obtained from the EWAS approach comparing ever exposed to never exposed to financial stress for cg19157140 are presented on the left. The stage 2 effect estimates and confidence intervals obtained from the SLCMA comparing being exposed to neighborhood disadvantage at age 1.75 to being unexposed at age 1.75 for the same CpG site are displayed on the right. The top CpG site in the SLCMA, which suggested a sensitive period at age 1.75 associated with the effects of neighborhood disadvantage, was non-significant after correction for multiple testing (p=0.0002) in the EWAS of neighborhood disadvantage.
Sensitivity Analyses
Evaluation of the LARS Selection Procedure
There was no evidence in support of compound theoretical models, whereby more than one theoretical model explained the most outcome variability. For each of the top 38 CpG sites, the marginal increase in variance of methylation explained by additional steps of the LARS procedure was not significant (each p>0.05, Figure S5), suggesting that methylation was best explained by a single theoretical model.
Evaluation of Methylation at Birth for Top CpG Sites
Adversity-associated methylation differences occurred during early childhood for most top CpG sites. After examining the effect of the selected exposure on DNAm in cord blood for the top 38 sites, we found that DNAm differences at birth were only significant for one out of the 38 sites (p>0.05/38=0.00132), suggesting that the differences in DNAm at age 7 mainly occurred after birth, as a result of exposure to postnatal stressors (Table S4). Similar results were obtained when examining the 380 FDR significant loci, where significant differences at birth were detected at only six out of the 380 probes (Table S4-Extension). An example of a site differentially methylated at birth and an example of a site non-differentially methylated at birth are shown in Figure S6.
Correction for Genetic Variation
Genetic variation did not appear to influence observed DNAm differences at the top CpG sites. Using a database of methylation quantitative trait loci (mQTLs) of the ARIES cohort (78), there were 658 SNPs associated with DNAm at 17 of the top 38 sites. After controlling for genetic variation at mQTLs linked to these 17 sites, the effect of exposure to adversity remained significant (each FDR q<0.05; Table S5), suggesting that adversity could have caused these methylation differences distinct from genetic sequence variation.
Exploring the Biological Significance of Findings
Correlation Between Blood and Brain Tissue
On average, methylation in blood at the top 38 sites was slightly positively correlated with methylation in four brain regions (prefrontal cortex: ravg=0.10, entorhinal cortex: ravg=0.11, superior temporal gyrus: ravg=0.11, cerebellum: ravg=0.06; Table S6). CpG sites with methylation that is highly correlated between blood and brain tissue may be indicative of important inter-individual covariation (i.e., because of adversity) or a strong genetic influence on methylation, while those that are uncorrelated may still be biomarkers of a response to adversity.
Enrichment of Regulatory Elements
As compared to all autosomal loci tested, FDR-significant loci were more likely to be located in gene promoters (32=9.92, p=0.002) and less likely to be in gene enhancers (32=3.86, p=0.049; Figure S7A). Furthermore, the location of FDR-significant loci differed from all other loci tested relative to CpG Islands (32=42.92, p<0.0001; Figure S7B). With eFORGE 1.2 (79), we also tested whether FDR-significant loci colocalize with markers of transcriptional activity. FDR-significant loci were not enriched for DNase I hypersensitivity sites or histone marks in any tissue or cell-type after correction for multiple comparisons (each q>0.05). The strongest trend for enrichment was detected in the analysis of all histone marks in fetal thymus cells (uncorrected p=0.0007). Annotations at each FDR-significant site are presented in Table S3.
Biological Processes Potentially Affected by Adversity
Genes near the FDR-significant sites (n=365 genes) corresponded to 158 clusters of GO biological process terms (76). The top 11 GO term clusters, including positive regulation of developmental growth, axon development, and neuron apoptotic process, were more likely to be represented than chance (average enrichment p<0.05; Figure S8).
Additionally, we uncovered evidence of functional constraint for these genes. Genes annotated to FDR-significant sites were more highly constrained, as measured by the probability of intolerance to Loss-of-Function variation (pLI) from ExAC (77), than the rest of the autosomal genes tested (permutation p=0.0001; Figure S9). This indicates a greater importance of these genes, on average, to survival and reproduction over human evolution.
Discussion
This prospective study used data from a large population-based sample of children to test three competing life course theoretical models describing the association between exposure to childhood adversity, measured repeatedly across the first 7 years of life, and DNAm at age 7. By comparing these theoretical models to each other, we could evaluate which one explained the most variation in DNAm. To our knowledge, this is the first use of the SLCMA in an epigenome-wide context.
The main finding of this study is that the effect of adversity on DNAm depends primarily on the developmental timing of exposure. In our Bonferroni-corrected analysis, we identified 38 CpG sites that were differently methylated following exposure to adversity, with more than half of these loci showing associations based on adversity occurring during very early childhood, meaning before age 3. Exposure in very early childhood was associated with DNAm differences for nearly all adversity types. In contrast, the effects of exposure in middle childhood were largely only detected for arguably most severe forms of adversity exposure (e.g., sexual or physical abuse). These results are consistent with at least one human longitudinal study (16) and multiple animal studies (21, 22, 24, 25) in emphasizing the existence of sensitive periods (19, 20)– particularly occurring shortly after birth – when epigenetic programming is maximally dynamic in response to parental care disruptions and other environmental inputs. The lack of detectable sensitive periods in one recent study (32) may be due to focusing only on adversities occurring at or after age 5. Interestingly, neither the accumulation nor recency of the adversity explained considerable variability in DNAm. The observed DNAm differences were absent at birth, identified for a range of adversities, and unrelated to genetic variation. The absence of support for an accumulation model is surprising, given previous research linking cumulative time spent in institutional care to DNAm status in stress-related genes (29).
Perhaps more importantly, our results suggest that broad classifications of individuals as exposed versus unexposed to “early life” adversity – although commonly used – may dilute observed effects and fail to detect DNAm differences among those exposed to adversity during specific life stages. These findings support the value of more detailed phenotyping, which is meaningful given the trend in psychiatric genetics towards minimizing phenotypic precision in the service of maximizing sample size. The lack of overlap in identified loci across the SLCMA and EWAS suggest that refinement of the environmental phenotype – by treating each time point of exposure as unique – may better capture underlying signal. Indeed, results of a post-hoc power calculation suggest that the EWAS of exposed versus unexposed will be underpowered when the true underlying relationship between exposure and outcome depends on the timing or amount of exposure (Supplemental Materials). Thus, more precise phenotyping could preserve study power and provide more mechanistic insights to guide targeted interventions.
These findings also raise important questions regarding why exposure to adversity in the first three years of life may be particularly salient in influencing DNA methylation patterns. When adversity occurs early in life, it coincides with when the foundation of brain architecture is initially sculpted. Experiences of childhood adversity, which represent deviations from expected cognitive, social, and sensory inputs (61), may be more likely to be wired into neural circuitry during this especially vulnerable stage in brain development. Relatedly, DNAm patterns are known to be dynamic across the lifecourse. It may be that very early exposure to adversity produces more stable DNAm changes that persist across the lifecourse, in contrast to later exposure to adversity. With more longitudinal studies of DNAm, the field of psychiatric epigenetics will be better positioned to determine not only when are the most vulnerable life stages for DNAm changes to occur, but also the extent to which these adversity-induced DNAm patterns persist over time.
Although these findings emphasize the importance of exposure timing, greater insights are needed regarding the age stages when adversity may be most harmful, as mixed results have emerged among the small number of studies comparing the effects of “early” to “later” adversity. Some retrospective studies have shown that adolescent DNAm patterns are more strongly associated with life stress during adolescence than earlier periods (27). However, other studies have found potentially persistent effects of childhood adversity into adolescence (80) and adulthood (81), even after accounting for subsequent stress exposure. A recent study also found that the effects of adversity timing may be gene-specific (29). As epigenetic patterns appear to vary over the life course (26, 82), longitudinal studies are needed to study the developmental trajectories of DNAm and evaluate the extent to which these adversity-induced DNAm differences persist or attenuate over time, and operate independently of or in interaction with subsequent experience to ultimately predict mental health outcomes. Ideally, these longitudinal studies would include repeated measures of prenatal and postnatal adversity exposure and investigate whether any adversity-associated DNAm signatures predict psychopathology. If our findings about the importance of sensitive periods do replicate, these results would emphasize the need to prioritize policies and interventions towards children exposed to adversity within the first three years of life, when the biological effects of adversity may be most profound.
Several limitations are noted. First, some adversity measures were drawn from single items. Parents may have also under-reported exposure to stigmatizing experiences (83, 84), especially if they were implicated in the exposure (85). However, the prevalence of several adversities, including those capturing possible experiences of abuse, were similar to and even greater than those reported from some nationally-representative samples (9, 86). Second, as with any longitudinal study, there was attrition over time, which could result in bias due to loss of follow-up. However, ARIES children were sampled from among those with the most complete longitudinal data. Within the field of epigenetics, efforts are now underway to understand the consequences of attrition and how potential biases arising from attrition could be mitigated through multiple imputation or other strategies. Third, we were unable to examine the impact of experiencing multiple adversities simultaneously because each adversity was measured at slightly different time points. Fourth, the DNAm samples were obtained from peripheral tissue and not the brain; multiple datasets, however, are starting to identify limited though important shared DNAm patterns across central nervous system and peripheral tissue (87). Fifth, we were unable to directly examine whether DNAm at the identified loci influenced gene expression of the nearest genes. Future work using a sample with both methylation and expression data is needed to clarify the functional consequences of significant CpG sites. Finally, the p-values derived from the covariance tests could be potentially inflated, as the test relies on asymptotic theories and therefore does not theoretically guarantee the control of Type I error rate in a finite sample (70). However, the covariance test might be a more sensitive method to detect signals compared to other post-selection significance tests that make fewer assumptions (88). As the relative statistical power of the available tests remains unclear, simulation studies are underway to identify the best inference tools in different settings and the statistical power of the SLCMA with varying effect sizes.
In summary, this study lends further support to the evidence-base showing that DNAm patterns are responsive to experience. However, these results reveal that DNAm patterns may be most influenced by exposures during sensitive periods in development. Efforts may therefore be needed to move beyond crude comparisons of those exposed versus unexposed to “early life” adversity.
Supplementary Material
Acknowledgments:
We are extremely grateful to all the families who took part in this study, the midwives for their help in recruiting them, and the whole ALSPAC team, which includes interviewers, computer and laboratory technicians, clerical workers, research scientists, volunteers, managers, receptionists and nurses. The UK Medical Research Council and the Wellcome Trust (Grant ref: 102215/2/13/2) and the University of Bristol provide core support for ALSPAC. ARIES was funded by the BBSRC (BBI025751/1 and BB/I025263/1). Supplementary funding to generate DNA methylation data which is included in ARIES has been obtained from the MRC, ESRC, NIH and other sources. ARIES is maintained under the auspices of the MRC Integrative Epidemiology Unit at the University of Bristol (MC_UU_12013/2 and MC_UU_12013/8). A comprehensive list of grants funding is available on the ALSPAC website (http://www.bristol.ac.uk/alspac/external/documents/grant-acknowledgements.pdf). This publication is the work of the authors, each of whom serve as guarantors for the contents of this paper. This work was conducted with support from Harvard Catalyst | The Harvard Clinical and Translational Science Center (National Center for Research Resources and the National Center for Advancing Translational Sciences, National Institutes of Health Award UL1 TR001102 and K01MH102403) and financial contributions from Harvard University and its affiliated academic healthcare centers. Some data presented in this paper were published previously in abstract form at the 2017 Society of Biological Psychiatry annual meeting and materials from this study were also available on the preprint server bioRxiv. The content is solely the responsibility of the authors and does not necessarily represent the official views of Harvard Catalyst, Harvard University and its affiliated academic healthcare centers, or the National Institutes of Health. The authors thank Kathryn Davis, Samantha Ernst, and Janine Cerutti for their assistance in preparing this manuscript for publication.
Footnotes
Conflicts of Interest: All authors report no biomedical financial interests or potential conflicts of interest.
References
- 1.Brooks-Gunn J, Duncan GJ (1997): Effects of poverty on children. The Future of Children 7:55–71. [PubMed] [Google Scholar]
- 2.Slopen N, Koenen KC, Kubzansky LD (2014): Cumulative adversity in childhood and emergent risk factors for long-term health. Journal of Pediatrics 164:631–638. [DOI] [PubMed] [Google Scholar]
- 3.Widom CS, Kahn EE, Kaplow JB, Sepulveda-Kozakowski S, Wilson HW (2007): Child abuse and neglect: Potential derailment from normal developmental pathways. NYS Psychologist 19:2–6. [Google Scholar]
- 4.Gilman SE, Kawachi I, Fitzmaurice GM, Buka SL (2003): Family disruption in childhood and risk of adult depression. American Journal of Psychiatry 160:939–946. [DOI] [PubMed] [Google Scholar]
- 5.Repetti RL, Taylor SE, Seeman TE (2002): Risky families: Family social environments and the mental and physical health of offspring. Psychological Bulletin 128:330–366. [PubMed] [Google Scholar]
- 6.Hammen C (2005): Stress and depression. Annual Review of Clinical Psychology 1:293–319. [DOI] [PubMed] [Google Scholar]
- 7.Kessler RC (1997): The effects of stressful life events on depression. Annual Review of Psychology 48:191–214. [DOI] [PubMed] [Google Scholar]
- 8.McLaughlin KA, Kubzansky LD, Dunn EC, Waldinger R, Vaillant G, Koenen KC (2010): Childhood social environment, emotional reactivity to stress, and mood and anxiety disorders across the life course. Depression and anxiety 27:1087–1094. [DOI] [PMC free article] [PubMed] [Google Scholar]
- 9.McLaughlin KA, Green JG, Gruber MJ, Sampson NA, Zaslavsky AM, Kessler RC (2012): Childhood adversities and first onset of psychiatric disorders in a national sample of US adolescents. JAMA Psychiatry 69:1151–1160. [DOI] [PMC free article] [PubMed] [Google Scholar]
- 10.Norman RE, Byambaa M, De R, Butchart A, Scott J, Vos T (2012): The long-term health consequences of child physical abuse, emotional abuse, and neglect: a systematic review and meta-analysis. PLoS Med 9:e1001349. [DOI] [PMC free article] [PubMed] [Google Scholar]
- 11.Klengel T, Mehta D, Anacker C, Rex-Haffner M, Pruessner JC, Pariante CM, et al. (2013): Allele-specific FKBP5 DNA demethylation mediates gene-childhood trauma interactions. Nat Neurosci 16:33–41. [DOI] [PMC free article] [PubMed] [Google Scholar]
- 12.Lewis CR, Olive MF (2014): Early-life stress interactions with the epigenome: potential mechanisms driving vulnerability toward psychiatric illness. Behav Pharmacol 25:341–351. [DOI] [PMC free article] [PubMed] [Google Scholar]
- 13.Bagot RC, Labonte B, Pena CJ, Nestler EJ (2014): Epigenetic signaling in psychiatric disorders: stress and depression. Dialogues Clin Neurosci 16:281–295. [DOI] [PMC free article] [PubMed] [Google Scholar]
- 14.Szyf M, Bick J (2013): DNA methylation: a mechanism for embedding early life experiences in the genome. Child Dev 84:49–57. [DOI] [PMC free article] [PubMed] [Google Scholar]
- 15.Zhang L, Hu XZ, Benedek DM, Fullerton CS, Forsten RD, Naifeh JA, et al. (2014): The interaction between stressful life events and leukocyte telomere length is associated with PTSD. Mol Psychiatry 19:855–856. [DOI] [PubMed] [Google Scholar]
- 16.Essex MJ, Boyce WT, Hertzman C, Lam LL, Armstrong JM, Neumann SM, et al. (2013): Epigenetic vestiges of early developmental adversity: childhood stress exposure and DNA methylation in adolescence. Child Development 84:58–75. [DOI] [PMC free article] [PubMed] [Google Scholar]
- 17.Yang BZ, Zhang H, Ge W, Weder N, Douglas-Palumberi H, Perepletchikova F, et al. (2013): Child abuse and epigenetic mechanisms of disease risk. Am J Prev Med 44:101–107. [DOI] [PMC free article] [PubMed] [Google Scholar]
- 18.Barker ED, Walton E, Cecil CAM (2017): Annual Research Review: DNA methylation as a mediator in the association between risk exposure and child and adolescent psychopathology. Journal of child psychology and psychiatry, and allied disciplines [DOI] [PubMed] [Google Scholar]
- 19.Bornstein MH (1989): Sensitive periods in development: Structural characteristics and causal interpretations. Psychol Bull 105:179–197. [DOI] [PubMed] [Google Scholar]
- 20.Knudsen E (2004): Sensitive periods in the development of the brain and behavior. Journal of Cognitive Neuroscience 16:1412–1425. [DOI] [PubMed] [Google Scholar]
- 21.Curley JP, Champagne FA (2016): Influence of maternal care on the developing brain: Mechanisms, temporal dynamics and sensitive periods. Frontiers in neuroendocrinology 40:52–66. [DOI] [PMC free article] [PubMed] [Google Scholar]
- 22.Faulk C, Dolinoy DC (2011): Timing is everything: the when and how of environmentally induced changes in the epigenome of animals. Epigenetics 6:791–797. [DOI] [PMC free article] [PubMed] [Google Scholar]
- 23.Morgan HD, Santos F, Green K, Dean W, Reik W (2005): Epigenetic reprogramming in mammals. Hum Mol Genet 14 Spec No 1:R47–58. [DOI] [PubMed] [Google Scholar]
- 24.Pena CJ, Neugut YD, Champagne FA (2013): Developmental timing of the effects of maternal care on gene expression and epigenetic regulation of hormone receptor levels in female rats. Endocrinology 154:4340–4351. [DOI] [PMC free article] [PubMed] [Google Scholar]
- 25.Pena CJ, Kronman HG, Walker DM, Cates HM, Bagot RC, Purushothaman I, et al. (2017): Early life stress confers lifelong stress susceptibility in mice via ventral tegmental area OTX2. Science 356:1185–1188. [DOI] [PMC free article] [PubMed] [Google Scholar]
- 26.Massart R, Nemoda Z, Suderman MJ, Sutti S, Ruggiero AM, Dettmer AM, et al. (2016): Early life adversity alters normal sex-dependent developmental dynamics of DNA methylation. Dev Psychopathol 28:1259–1272. [DOI] [PMC free article] [PubMed] [Google Scholar]
- 27.van der Knaap LJ, Riese H, Hudziak JJ, Verbiest MM, Verhulst FC, Oldehinkel AJ, et al. (2015): Adverse life events and allele-specific methylation of the serotonin transporter gene (SLC6A4) in adolescents: the TRAILS study. Psychosom Med 77:246–255. [DOI] [PubMed] [Google Scholar]
- 28.van der Knaap LJ, van Oort FVA, Verhulst FC, Oldehinkel AJ, Riese H (2015): Methylation of NR3C1 and SLC6A4 and internalizing problems. The TRAILS study. Journal of Affective Disorders 180:97–103. [DOI] [PubMed] [Google Scholar]
- 29.Non AL, Hollister BM, Humphreys KL, Childebayeva A, Esteves K, Zeanah CH, et al. (2016): DNA methylation at stress‐related genes is associated with exposure to early life institutionalization. American journal of physical anthropology [DOI] [PMC free article] [PubMed] [Google Scholar]
- 30.Borghol N, Suderman M, McArdle W, Racine A, Hallett M, Pembrey M, et al. (2012): Associations with early-life socio-economic position in adult DNA methylation. International Journal of Epidemiology 41:62–74. [DOI] [PMC free article] [PubMed] [Google Scholar]
- 31.Esposito EA, Jones MJ, Doom JR, MacIsaac JL, Gunnar MR, Kobor MS (2016): Differential DNA methylation in peripheral blood mononuclear cells in adolescents exposed to significant early but not later childhood adversity. Development and Psychopathology 28:1385–1399. [DOI] [PMC free article] [PubMed] [Google Scholar]
- 32.Marzi SJ, Sugden K, Arseneault L, Belsky DW, Burrage J, Corcoran DL, et al. (2018): Analysis of DNA Methylation in Young People: Limited Evidence for an Association Between Victimization Stress and Epigenetic Variation in Blood. Am J Psychiatry.appiajp201717060693 [DOI] [PMC free article] [PubMed] [Google Scholar]
- 33.Smith AD, Heron J, Mishra G, Gilthorpe MS, Ben-Shlomo Y, Tilling K (2015): Model Selection of the Effect of Binary Exposures over the Life Course. Epidemiology 26:719–726. [DOI] [PMC free article] [PubMed] [Google Scholar]
- 34.Smith AD, Hardy R, Heron J, Joinson CJ, Lawlor DA, Macdonald-Wallis C, et al. (2016): A structured approach to hypotheses involving continuous exposures over the life course. Int J Epidemiol [DOI] [PMC free article] [PubMed] [Google Scholar]
- 35.Ben-Shlomo Y, Cooper R, Kuh D (2016): The last two decades of life course epidemiology and its relevance for research on ageing. International Journal of Epidemiology [DOI] [PMC free article] [PubMed] [Google Scholar]
- 36.Kuh D, Ben-Shlomo Y (2004): A life course approach to chronic disease epidemiology [PubMed] [Google Scholar]
- 37.Ben-Shlomo Y, Kuh D (2002): A life course approach to chroic disease epidemiology: conceptual models, empirical challenges, and interdisciplinary perspectives. International Journal of Epidemiology 31:285–293. [PubMed] [Google Scholar]
- 38.Sameroff AJ (2000): Dialectical Processes in Developmental Psychopathology. In: Sameroff AJ, Lewis M, Miller SM, editors. Handbook of Developmental Psychopathology Boston, MA: Springer US, pp 23–40. [Google Scholar]
- 39.Evans GW, Li D, Whipple SS (2013): Cumulative risk and child development. Psychological Bulletin 139:342–396. [DOI] [PubMed] [Google Scholar]
- 40.Rutter M (1979): Protective factors in children’s responses to stress and disadvantage. Annals of the Academy of Medicine, Singapore 8:324–338. [PubMed] [Google Scholar]
- 41.Shanahan L, Copeland WE, Costello EJ, Angold A (2011): Child-, adolescent-and young adult-onset depressions: differential risk factors in development? Psychological Medicine 41:2265–2274. [DOI] [PMC free article] [PubMed] [Google Scholar]
- 42.Boyd A, Golding J, Macleod J, Lawlor DA, Fraser A, Henderson J, et al. (2012): Cohort profile: the ‘children of the 90s’—the index offspring of the Avon Longitudinal Study of Parents and Children. International journal of epidemiology dys064. [DOI] [PMC free article] [PubMed] [Google Scholar]
- 43.Golding J, Pembrey M, Jones R, the ALSPAC Study Team (2001): ALSPAC: The Avon Longitudinal Study of Parents and Children I. Study methodology. Paediatric and Perinatal Epidemiology 15:74–87. [DOI] [PubMed] [Google Scholar]
- 44.Fraser A, Macdonald-Wallis C, Tilling K, Boyd A, Golding J, Davey Smith G, et al. (2012): Cohort profile: The Avon Longitudinal Study of Parents and Children: ALSPAC mothers cohort. International Journal of Epidemiology [DOI] [PMC free article] [PubMed] [Google Scholar]
- 45.Relton CL, Gaunt T, McArdle W, Ho K, Duggirala A, Shihab H, et al. (2015): Data Resource Profile: Accessible Resource for Integrated Epigenomic Studies (ARIES). Int J Epidemiol 44:1181–1190. [DOI] [PMC free article] [PubMed] [Google Scholar]
- 46.Cunliffe VT (2016): The epigenetic impacts of social stress: how does social adversity become biologically embedded? Epigenomics 8:1653–1669. [DOI] [PMC free article] [PubMed] [Google Scholar]
- 47.Vaiserman AM, Koliada AK (2017): Early-life adversity and long-term neurobehavioral outcomes: epigenome as a bridge? Human genomics 11:34. [DOI] [PMC free article] [PubMed] [Google Scholar]
- 48.Eachus H, Cunliffe VT (2018): Biological Embedding of Psychosocial Stress Over the Life Course. Epigenetics of Aging and Longevity: Elsevier, pp 251–270. [Google Scholar]
- 49.Ramo‐Fernández L, Schneider A, Wilker S, Kolassa IT (2015): Epigenetic alterations associated with war trauma and childhood maltreatment. Behavioral sciences & the law 33:701–721. [DOI] [PubMed] [Google Scholar]
- 50.Provenzi L, Giorda R, Beri S, Montirosso R (2016): SLC6A4 methylation as an epigenetic marker of life adversity exposures in humans: a systematic review of literature. Neuroscience & Biobehavioral Reviews 71:7–20. [DOI] [PubMed] [Google Scholar]
- 51.Tyrka AR, Ridout KK, Parade SH (2016): Childhood adversity and epigenetic regulation of glucocorticoid signaling genes: Associations in children and adults. Development and psychopathology 28:1319–1331. [DOI] [PMC free article] [PubMed] [Google Scholar]
- 52.Tomassi S, Tosato S (2017): Epigenetics and gene expression profile in First-Episode Psychosis: the role of Childhood Trauma. Neuroscience & Biobehavioral Reviews [DOI] [PubMed] [Google Scholar]
- 53.Lewis AJ, Austin E, Knapp R, Vaiano T, Galbally M (2015): Perinatal maternal mental health, fetal programming and child development. Healthcare: Multidisciplinary Digital Publishing Institute, pp 1212–1227. [DOI] [PMC free article] [PubMed] [Google Scholar]
- 54.Newman L, Judd F, Olsson CA, Castle D, Bousman C, Sheehan P, et al. (2016): Early origins of mental disorder-risk factors in the perinatal and infant period. BMC psychiatry 16:270. [DOI] [PMC free article] [PubMed] [Google Scholar]
- 55.Beach SR, Lei MK, Brody GH, Kim S, Barton AW, Dogan MV, et al. (2016): Parenting, SES-risk, and later Young Adult Health: exploration of opposing indirect effects via DNA methylation. Child development 87:111. [DOI] [PMC free article] [PubMed] [Google Scholar]
- 56.Naumova OY, Lee M, Koposov R, Szyf M, Dozier M, Grigorenko EL (2012): Differential patterns of whole-genome DNA methylation in institutionalized children and children raised by their biological parents. Development and psychopathology 24:143–155. [DOI] [PMC free article] [PubMed] [Google Scholar]
- 57.Non AL, Hollister BM, Humphreys KL, Childebayeva A, Esteves K, Zeanah CH, et al. (2016): DNA methylation at stress‐related genes is associated with exposure to early life institutionalization. American journal of physical anthropology 161:84–93. [DOI] [PMC free article] [PubMed] [Google Scholar]
- 58.Uddin M, Jansen S, Telzer EH (2017): Adolescent depression linked to socioeconomic status? Molecular approaches for revealing premorbid risk factors. BioEssays 39. [DOI] [PubMed] [Google Scholar]
- 59.Subramanyam MA, Diez-Roux AV, Pilsner JR, Villamor E, Donohue KM, Liu Y, et al. (2013): Social factors and leukocyte DNA methylation of repetitive sequences: the multi-ethnic study of atherosclerosis. PloS one 8:e54018. [DOI] [PMC free article] [PubMed] [Google Scholar]
- 60.Jovanovic T, Vance LA, Cross D, Knight AK, Kilaru V, Michopoulos V, et al. (2017): Exposure to violence accelerates epigenetic aging in children. Scientific reports 7:8962. [DOI] [PMC free article] [PubMed] [Google Scholar]
- 61.McLaughlin KA (2016): Future directions in childhood adversity and youth psychopathology. Journal of Clinical Child & Adolescent Psychology 45:361–382. [DOI] [PMC free article] [PubMed] [Google Scholar]
- 62.Zhuang J, Widschwendter M, Teschendorff AE (2012): A comparison of feature selection and classification methods in DNA methylation studies using the Illumina Infinium platform. BMC Bioinformatics 13:59. [DOI] [PMC free article] [PubMed] [Google Scholar]
- 63.Touleimat N, Tost J (2012): Complete pipeline for Infinium® Human Methylation 450K BeadChip data processing using subset quantile normalization for accurate DNA methylation estimation. Epigenomics 4:325–341. [DOI] [PubMed] [Google Scholar]
- 64.Houseman EA, Molitor J, Marsit CJ (2014): Reference-free cell mixture adjustments in analysis of DNA methylation data. Bioinformatics 30:1431–1439. [DOI] [PMC free article] [PubMed] [Google Scholar]
- 65.Tukey JW (1962): The Future of Data Analysis. The Annals of Mathematical Statistics 33:1–67. [Google Scholar]
- 66.Richmond RC, Simpkin AJ, Woodward G, Gaunt TR, Lyttleton O, McArdle WL, et al. (2015): Prenatal exposure to maternal smoking and offspring DNA methylation across the lifecourse: findings from the Avon Longitudinal Study of Parents and Children (ALSPAC). Hum Mol Genet 24:2201–2217. [DOI] [PMC free article] [PubMed] [Google Scholar]
- 67.Glymour MM, Avendano M, Kawachi I (2014): Socioeconomic status and health. Social epidemiology 2:17–63. [Google Scholar]
- 68.Mishra G, Nitsch D, Black S, De Stavola B, Kuh D, Hardy R (2009): A structured approach to modelling the effects of binary exposure variables over the life course. International Journal of Epidemiology 38:528–537. [DOI] [PMC free article] [PubMed] [Google Scholar]
- 69.Efron B, Hastie T, Johnstone I, Tibshirani R (2004): Least angle regression. The Annals of Statistics 32:407–499. [Google Scholar]
- 70.Lockhart R, Taylor J, Tibshirani RJ, Tibshirani R (2014): A significance test for the LASSO. Annals of statistics 42:413–468. [DOI] [PMC free article] [PubMed] [Google Scholar]
- 71.Birnie K, Martin RM, Gallacher J, Bayer A, Gunnell D, Ebrahim S, et al. (2011): Socio-economic disadvantage from childhood to adulthood and locomotor function in old age: a lifecourse analysis of the Boyd Orr and Caerphilly prospective studies. J Epidemiol Community Health 65:1014–1023. [DOI] [PMC free article] [PubMed] [Google Scholar]
- 72.Murray ET, Mishra GD, Kuh D, Guralnik J, Black S, Hardy R (2011): Life course models of socioeconomic position and cardiovascular risk factors: 1946 birth cohort. Ann Epidemiol 21:589–597. [DOI] [PMC free article] [PubMed] [Google Scholar]
- 73.Collin SM, Tilling K, Joinson C, Rimes KA, Pearson RM, Hughes RA, et al. (2015): Maternal and Childhood Psychological Factors Predict Chronic Disabling Fatigue at Age 13 Years. Journal of Adolescent Health 56:181–187. [DOI] [PubMed] [Google Scholar]
- 74.Evans J, Melotti R, Heron J, Ramchandani P, Wiles N, Murray L, et al. (2012): The timing of maternal depressive symptoms and child cognitive development: a longitudinal study. Journal of Child Psychology and Psychiatry 53:632–640. [DOI] [PubMed] [Google Scholar]
- 75.Hannon E, Lunnon K, Schalkwyk L, Mill J (2015): Interindividual methylomic variation across blood, cortex, and cerebellum: implications for epigenetic studies of neurological and neuropsychiatric phenotypes. Epigenetics 10:1024–1032. [DOI] [PMC free article] [PubMed] [Google Scholar]
- 76.Huang DW, Sherman BT, Lempicki RA (2008): Systematic and integrative analysis of large gene lists using DAVID bioinformatics resources. Nat Protocols 4:44–57. [DOI] [PubMed] [Google Scholar]
- 77.Lek M, Karczewski KJ, Minikel EV, Samocha KE, Banks E, Fennell T, et al. (2016): Analysis of protein-coding genetic variation in 60,706 humans. Nature 536:285–291. [DOI] [PMC free article] [PubMed] [Google Scholar]
- 78.Gaunt TR, Shihab HA, Hemani G, Min JL, Woodward G, Lyttleton O, et al. (2016): Systematic identification of genetic influences on methylation across the human life course. Genome biology 17:61. [DOI] [PMC free article] [PubMed] [Google Scholar]
- 79.Breeze CE, Paul DS, van Dongen J, Butcher LM, Ambrose JC, Barrett JE, et al. (2016): eFORGE: A Tool for Identifying Cell Type-Specific Signal in Epigenomic Data. Cell reports 17:2137–2150. [DOI] [PMC free article] [PubMed] [Google Scholar]
- 80.Esposito EA, Jones MJ, Doom JR, MacIsaac JL, Gunnar MR, Kobor MS (2016): Differential DNA methylation in peripheral blood mononuclear cells in adolescents exposed to significant early but not later childhood adversity. Dev Psychopathol 28:1385–1399. [DOI] [PMC free article] [PubMed] [Google Scholar]
- 81.Klengel T, Mehta D, Anacker C, Rex-Haffner M, Pruessner JC, Pariante CM, et al. (2013): Allele-specific FKBP5 DNA demethylation mediates gene-childhood trauma interactions. Nature Neuroscience 16:33–41. [DOI] [PMC free article] [PubMed] [Google Scholar]
- 82.Simpkin AJ, Suderman M, Gaunt TR, Lyttleton O, McArdle WL, Ring SM, et al. (2015): Longitudinal analysis of DNA methylation associated with birth weight and gestational age. Hum Mol Genet 24:3752–3763. [DOI] [PMC free article] [PubMed] [Google Scholar]
- 83.Holt S, Buckley H, Whelan S (2008): The impact of exposure to domestic violence on children and young people: a review of the literature. Child Abuse & Neglect 32:797–810. [DOI] [PubMed] [Google Scholar]
- 84.Holden GW (2003): Children exposed to domestic violence and child abuse: terminology and taxonomy. Clin Child Fam Psychol Rev 6:151–160. [DOI] [PubMed] [Google Scholar]
- 85.Graham-Bermann SA, Seng J (2005): Violence exposure and traumatic stress symptoms as additional predictors of health problems in high-risk children. J Pediatr 146:349–354. [DOI] [PubMed] [Google Scholar]
- 86.Gilbert R, Widom CS, Browne K, Fergusson D, Webb E, Janson S (2009): Burden and consequences of child maltreatment in high-income countries. Lancet 373:68–81. [DOI] [PubMed] [Google Scholar]
- 87.Smith AK, Kilaru V, Klengel T, Mercer KB, Bradley B, Conneely KN, et al. (2015): DNA extracted from saliva for methylation studies of psychiatric traits: evidence tissue specificity and relatedness to brain. Am J Med Genet B Neuropsychiatr Genet 168b:36–44. [DOI] [PMC free article] [PubMed] [Google Scholar]
- 88.Tibshirani RJ, Taylor J, Lockhart R, Tibshirani R (2016): Exact Post-Selection Inference for Sequential Regression Procedures. Journal of the American Statistical Association 111:600–620. [Google Scholar]
- 89.Naeem H, Wong NC, Chatterton Z, Hong MKH, Pedersen JS, Corcoran NM, et al. (2014): Reducing the risk of false discovery enabling identification of biologically significant genome-wide methylation status using the HumanMethylation450 array. BMC Genomics 15:51. [DOI] [PMC free article] [PubMed] [Google Scholar]
- 90.Chen Y-a, Lemire M, Choufani S, Butcher DT, Grafodatskaya D, Zanke BW, et al. (2013): Discovery of cross-reactive probes and polymorphic CpGs in the Illumina Infinium HumanMethylation450 microarray. Epigenetics 8:203–209. [DOI] [PMC free article] [PubMed] [Google Scholar]
Associated Data
This section collects any data citations, data availability statements, or supplementary materials included in this article.