

Abstract
Background/Objectives:
Several diets, e.g. those low in fruits/vegetables, high in sodium and red/processed meat, have been related to a higher stroke risk. We investigated stroke mortality associated with a priori diet-quality indices in the Multiethnic Cohort study.
Subjects/Methods:
Based on 172 043 observations including 3 548 stroke deaths, we investigated the Healthy Eating Index-2010 (HEI-2010), the Alternative HEI-2010, the alternate Mediterranean diet score, and the Dietary Approaches to Stop Hypertension index in relation to stroke mortality. Using Cox regression, we estimated adjusted population attributable risks (PAR) and hazard ratios (HR) for tertiles of the indices while adjusting for relevant confounders.
Results:
The associations between all diet-quality indices and stroke mortality were consistent in direction; a low-quality diet was associated with a greater risk of stroke death but the HEI-2010 was the strongest predictor. The PAR for stroke death based on HEI-2010 was 7.9% (95%-CI: 3.7-12.2%), indicating the preventable percentage of deaths if the total population had the same diet quality as those in the highest tertile for this diet-quality index. The lowest as compared to the highest tertile of the HEI-2010 was associated with a 1.23-fold (95%-CI: 1.13-1.34) risk. The PARs for low and medium adherence to the indices were similar by sex and follow-up time, but varied by ethnicity, with the highest PAR in Whites (15.4%) and no association in Latinos.
Conclusions:
Findings for four diet-quality indices, in particular the HEI-2010, indicated that diet quality acts as an independent risk factor for stroke mortality. Promotion of a high diet quality could have a substantial impact on the prevention of stroke deaths.
Keywords: stroke mortality, diet-quality indices, population attributable risk, ethnicity
INTRODUCTION
Despite major improvements in treatment, stroke remains the fifth leading cause of death1 and a leading cause of long-term severe disability.2 Based on the Global Burden of Disease Study, 90.5% of stroke-burden as measured in disability-adjusted life-years was due to 17 risk factors and 74.2% were associated with behavioral risk factors alone.3 The INTERSTROKE study estimated the population attributable risk (PAR) of ten risk factors (hypertension, physical inactivity, apolipoprotein, diet, waist-to-hip ratio, psychosocial factors, smoking, cardiac causes, alcohol consumption, diabetes mellitus) to be 90.7% for all incident strokes.4 Based on this evidence, preventive measures directed at these potentially modifiable risk factors might therefore have a large impact at the population level.
As for single dietary components, a diet high in sodium,5 low in fruits and vegetables and/or whole grains was associated with a high stroke-burden.3 Two meta-analyses described protective associations for fruits and vegetables6,7 and another one reported an elevated risk of red/processed meat intake with ischemic but not hemorrhagic stroke.8 Instead of examining single nutrients or foods, dietary pattern analyses and a priori defined dietary indices take interactions and interdependencies among nutrients and foods into account and provide promising strategies for disease control and prevention.9 The Healthy Eating Index-2010 (HEI-2010) representing the most commonly used dietary recommendations in the US was associated with cardiovascular and all-cause mortality,10 but its relation with stroke mortality has not been reported so far. Based on the modified Alternative Healthy Eating Index (AHEI), the INTERSTROKE study reported a stroke risk of 0.60 (99%-CI: 0.53-0.67) for the highest vs. lowest tertile and a PAR of 23.2% (99%-CI: 18.2-28.9) for the low and medium vs. the highest tertile.4 Adherence to the alternate Mediterranean diet score (aMED) was significantly inversely associated with stroke incidence in the Nurses’ Health Study (highest vs. lowest quintile: relative risk (RR) = 0.71, 95%-CI: 0.62-0.82),11 and similar results were found in a meta-analysis based on a more general definition of the Mediterranean diet (RR=0.71, 95%-CI: 0.57-0.89).12 According to a meta-analysis, the DASH (Dietary Approaches to Stop Hypertension) diet was associated with a lower RR of stroke (RR=0.81, 95%-CI: 0.72-0.92 for highest vs. lowest adherence).13
Previous stroke research investigated ethnic differences in stroke mortality and the distribution of risk factors known to be associated with stroke. In 2008, stroke mortality in the US was highest among African Americans, followed by Whites, Asians, Hispanics, and Indians.14 The prevalence of stroke subtypes was previously shown to vary by ethnicity,15,16 just as dietary intake and lifestyle risk factors.17 The results of the INTERSTROKE study even indicated noticeable variations in the risk for stroke attributable to diet quality across world regions and ethnic groups.4
In the present study, we investigated stroke risk factors in a population with diverse ethnic backgrounds. Using four, a priori defined, diet-quality indices based on diet recommendations, we inferred the percentage of stroke deaths preventable by the adoption of healthy eating patterns, as well as the relative risk of stroke mortality due to diet in the Multiethnic Cohort Study (MEC).18 Further insights were obtained by subgroup analyses by sex, ethnicity, and follow-up time.
MATERIALS AND METHODS
Study Population.
The MEC is a prospective cohort study of more than 215 000 Hawaii (48.1%) and Los Angeles (51.9%) residents between 45 and 75 years of age, recruited in 1993 to 1996.17 Briefly, participants were identified through drivers’ license records, voter registration records, and Medicare files. The aim was to explore the association between lifestyle, medical, and genetic factors and the incidence of cancer and other chronic diseases within five major ethnic groups. Response rates varied between 28% and 51% among sex and ethnic groups. A comparison of the distribution of MEC participants to the US census suggested that MEC participants represented all educational levels well.17 Receipt of a completed questionnaire was evidence of a desire to participate in the study and was taken as a formal indication of consent; the study was approved by the Institutional Review Boards of the University of Hawaii and University of Southern California. The baseline questionnaire asked for all ethnic backgrounds and categorized individuals according to a priority ranking into African Americans, Native Hawaiians, Latinos, Japanese Americans, and Whites, and included questions on demographics, anthropometry, medical history, education, lifestyle factors, and diet.17
Dietary Assessment.
A validated19 food frequency questionnaire with over 180 items was part of the baseline assessment.17 Based on this information, the following a priori defined diet-quality indices were constructed as previously described18,20 and visually displayed in Table 1.
The HEI-2010 is based on the Dietary Guidelines for Americans from 2010, where higher values reflect better adherence to federal dietary guidelines.21,22
The AHEI-2010 was developed to identify patterns associated with lower risk of chronic disease.23
The aMED reflects eating behaviors associated with lower risk of chronic disease.24
The DASH25 includes eight components as a modified version of the original DASH diet.26
Table 1:
Components of HEI-2010, AHEI-2010, aMED and DASH
| Components | HEI-2010 | AHEI-2010 | aMED | DASH | |
|---|---|---|---|---|---|
| Maximum Score | 100 | 110 | 9 | 40 | |
| Total vegetables | ↑ | ||||
| Vegetables excluding potatoes | ↑ | ↑ | ↑ | ||
| Total fruits | ↑ | ↑ | ↑ | ||
| Whole fruits | ↑ | ↑ | |||
| Nuts, seeds and legumes | ↑ | ||||
| Nuts and legumes | ↑ | ||||
| Nuts | ↑ | ||||
| Legumes | ↑ | ||||
| Fish | ↑ | ||||
| Seafood and plant protein | ↑ | ||||
| Total protein foods | ↑ | ||||
| Dairy | ↑ | ↑ | |||
| Oils/fats | ↑ | ↑ | ↑ | ||
| Alcohol | ↑ | ↑ | |||
| Red & processed meat | ↓ | ↓ | ↓ | ||
| Whole grains | ↑ | ↑ | ↑ | ↑ | |
| Refined grains | ↓ | ||||
| Empty caloriesa | ↓ | ||||
| SSBb & fruit juice | ↓ | ↓ | |||
| Sodium | ↓ | ↓ | ↓ | ||
↑ Components were positively scored, i.e. a higher intake is associated with a higher score
↓ Components were inversely scored, i.e. a higher intake is associated with a lower score
Empty calories: energy from solid fat, added sugars and alcohol
Sugar sweetened beverages (SSB)
According to MEC baseline distributions, these indices were categorized into tertiles of low, medium, and high adherence to the recommendations. Based on the hypothesis that low adherence constitutes a risk factor for stroke, we present results with the highest tertile as reference category.
Outcome ascertainment.
Deaths were identified by state death records and the National Death Index, and therefore loss to follow-up was negligible. Stroke deaths were defined by ICD (International Classification of Diseases) codes, specifically ICD-9 (430–438) and ICD-10 (I60-I69) codes. December 31st, 2013 was used as the end of follow-up. Ischemic and hemorrhagic strokes were identified based on the American Heart Association/American Stroke Association (AHA/ASA) definition of stroke.27 However, the distinction between these subtypes based on ICD codes has limited reliability overall.28 In addition, for the majority of stroke cases (65.4%), the subtype was not provided and e.g. ICD-9 436 and ICD-10 I64 were used. As a result, only 5.0% could be categorized as ischemic and 29.6% as hemorrhagic strokes. Therefore, results should be interpreted with care.
Inclusion and Exclusion Criteria.
From the original cohort of over 215 000 individuals, we excluded the ethnic category “other” (N=13 994), a stroke prior to recruitment as reported at baseline or missing information on this question (N=5 449), invalid dietary assessment information defined by implausible energy and macronutrient intakes (N=7 876), and 16 419 (8.7%) records with missing covariates. This resulted in a dataset for a complete case analysis of 172 043 participants and 55 211 deaths with 3 548 stroke deaths, which was very similar to the original MEC study as far as the distributions of sex, ethnicity within the five targeted groups, and major risk factors are concerned.17
Statistical analysis.
We described the frequency distributions, by sex and ethnic group, of the diet-quality indices categorized as tertiles and following established stroke risk factors: age at baseline, self-reported medical conditions (hypertension, type 2 diabetes, previous heart attack/angina), BMI, hormone therapy, smoking status (never, former, current light or heavy), alcohol intake, physical activity (hours of daily moderate or vigorous activity: ≥1.5, 0.5-<1.5, ≤0.5), education, place of birth, living >25 years in the US, and total energy intake (Table 2). We also calculated Spearman correlations between the diet-quality indices. Cox regression was applied to model the association between the four diet-quality indices and stroke mortality adjusting for sex, age, ethnicity, and stroke risk factors. Based on the hazard ratio (HR) estimates for the middle and lowest tertiles of each index relative to the highest tertile, we estimated adjusted PARs as the preventable percentage of deaths if the entire population were to consume a diet according to the observed highest tertile of this diet-quality index.29 To investigate whether the effect of the diet-quality indices on stroke mortality differs depending on certain variables, stratified analyses by sex, ethnicity, and length of follow-up (<10, 10 to <20, ≥20 years) were performed, and we additionally tested for interaction effects between the continuous indices and the stratification variables. In a sensitivity analysis to better explore the nature of the relation between risk and level of exposure, e.g. whether it is of a linear or curvilinear shape, we additionally categorized the diet-quality indices into quintiles. All analyses were conducted with version 9.4 of the SAS System for Windows (SAS Institute Inc., Cary, NC) and for graphical representation the ggplot2 package30 of the statistical software R31 was used.
Table 2:
Follow-up characteristics, All-Cause and Stroke Mortality, and distribution of Diet-Quality indices and other risk factors by Sex & Ethnicity
| Men | Women | ||||||||||
|---|---|---|---|---|---|---|---|---|---|---|---|
| W | AA | NH | JA | L | W | AA | NH | JA | L | ||
| Number of individuals | 20 865 | 10 334 | 5 686 | 24 537 | 18 958 | 23 590 | 16 467 | 7 028 | 26 378 | 18 200 | |
| Mean (std) follow-up time (years) | 17.1 (5.3) | 15.6 (6.4) | 16.7 (5.4) | 17.2 (5.0) | 17.2 (5.1) | 18.0 (4.5) | 17.4 (5.6) | 17.7 (4.7) | 18.5 (3.8) | 18.3 (4.3) | |
| Mean (std) age at baseline (years) | 58.8 (9.1) | 61.5 (8.9) | 56.5 (8.6) | 60.9 (9.2) | 60.0 (7.8) | 58.5 (9.0) | 59.9 (9.1) | 55.7 (8.6) | 60.5 (8.9) | 58.9 (7.8) | |
| Number of deaths (% of individuals) | All cause | 7 416 (35.5) | 5 426 (52.5) | 2 175 (38.3) | 8 719 (35.5) | 6 579 (34.7) | 6 429 (27.3) | 6 266 (38.1) | 1 966 (28.0) | 5 814 (22.0) | 4 421 (24.3) |
| Stroke | 360 (1.7) | 310 (3.0) | 101 (1.8) | 581 (2.4) | 394 (2.1) | 408 (1.7) | 432 (2.6) | 109 (1.6) | 514 (1.9) | 339 (1.9) | |
| Ischemic | 27 (0.1) | 15 (0.1) | 5 (0.1) | 24 (0.1) | 21 (0.1) | 21 (0.1) | 18 (0.1) | 10 (0.1) | 21 (0.1) | 14 (0.1) | |
| Hemorrhagic | 101 (0.5) | 72 (0.7) | 26 (0.5) | 194 (0.8) | 126 (0.7) | 113 (0.5) | 83 (0.5) | 40 (0.6) | 197 (0.7) | 98 (0.5) | |
| Crude death rates | All cause | 2 071 | 3 366 | 2 291 | 2 066 | 2 018 | 1 514 | 2 187 | 1 580 | 1 191 | 1 327 |
| per 100 000 person-years | Stroke | 101 | 192 | 106 | 138 | 121 | 96 | 151 | 88 | 105 | 102 |
| Diet-Quality Indices (%) | |||||||||||
| HEI-2010 | High | 33.5 | 31.2 | 23.3 | 25.0 | 17.0 | 45.2 | 46.7 | 36.5 | 40.5 | 27.5 |
| Medium | 32.2 | 31.8 | 31.8 | 35.0 | 33.9 | 31.5 | 30.3 | 33.1 | 34.8 | 35.6 | |
| Low | 34.2 | 37.0 | 44.9 | 39.9 | 49.1 | 23.3 | 23.0 | 30.5 | 24.7 | 36.8 | |
| AHEI-2010 | High | 34.9 | 26.5 | 32.6 | 40.4 | 22.4 | 35.3 | 31.4 | 35.0 | 44.4 | 22.9 |
| Medium | 30.8 | 33.3 | 32.7 | 31.4 | 34.6 | 32.6 | 33.9 | 33.8 | 32.3 | 37.8 | |
| Low | 34.2 | 40.2 | 34.7 | 28.2 | 43.0 | 32.1 | 34.7 | 31.2 | 23.2 | 39.2 | |
| aMED | High | 45.1 | 39.8 | 46.2 | 46.0 | 37.8 | 40.8 | 41.1 | 47.7 | 45.0 | 36.9 |
| Medium | 19.4 | 19.0 | 19.3 | 19.7 | 20.2 | 18.7 | 18.8 | 18.5 | 19.4 | 20.0 | |
| Low | 35.4 | 41.2 | 34.5 | 34.3 | 42.0 | 40.5 | 40.0 | 33.8 | 35.6 | 43.0 | |
| DASH | High | 40.4 | 26.2 | 22.5 | 24.7 | 30.7 | 38.5 | 26.2 | 24.4 | 26.3 | 30.6 |
| Medium | 33.2 | 32.5 | 29.8 | 30.1 | 35.6 | 34.4 | 31.8 | 30.2 | 32.2 | 35.3 | |
| Low | 26.3 | 41.3 | 47.7 | 45.1 | 33.6 | 27.1 | 42.0 | 45.3 | 41.6 | 34.1 | |
| Other risk factors (%) | |||||||||||
| Hypertension | No | 69.8 | 46.9 | 53.0 | 57.2 | 65.6 | 73.7 | 45.5 | 58.9 | 64.4 | 65.6 |
| Yes | 30.2 | 53.1 | 47.0 | 42.8 | 34.4 | 26.3 | 54.5 | 41.1 | 35.6 | 34.4 | |
| Type 2 diabetes | No | 94.0 | 84.7 | 84.5 | 88.4 | 84.0 | 95.0 | 85.8 | 83.0 | 91.3 | 85.8 |
| Yes | 6.0 | 15.3 | 15.5 | 11.6 | 16.0 | 5.0 | 14.2 | 17.0 | 8.7 | 14.2 | |
| Previous heart attack/angina | No | 90.4 | 88.5 | 90.6 | 91.1 | 90.6 | 95.5 | 89.6 | 94.0 | 96.9 | 92.4 |
| Yes | 9.6 | 11.5 | 9.4 | 8.9 | 9.4 | 4.5 | 10.4 | 6.0 | 3.1 | 7.6 | |
| Smokinga | Never | 32.5 | 24.6 | 31.9 | 29.3 | 31.8 | 44.9 | 45.6 | 45.1 | 68.9 | 65.0 |
| Former | 51.5 | 49.6 | 46.6 | 56.0 | 50.7 | 38.8 | 34.6 | 31.9 | 22.2 | 24.8 | |
| Current light | 4.9 | 14.6 | 8.3 | 5.5 | 11.5 | 6.8 | 14.3 | 14.2 | 5.7 | 8.2 | |
| Current heavy | 11.0 | 11.2 | 13.2 | 9.3 | 6.0 | 9.6 | 5.5 | 8.7 | 3.2 | 2.0 | |
| Alcohol intake | <=1 drink/d | 61.8 | 77.1 | 70.3 | 74.1 | 75.3 | 80.2 | 92.2 | 91.3 | 96.9 | 95.3 |
| >1 drink/d | 38.2 | 22.9 | 29.7 | 25.9 | 24.7 | 19.8 | 7.8 | 8.7 | 3.1 | 4.7 | |
| Physical activityb | High | 33.8 | 19.1 | 35.1 | 27.7 | 22.7 | 30.3 | 13.8 | 25.1 | 20.0 | 16.4 |
| Medium | 39.7 | 35.0 | 39.0 | 41.3 | 34.8 | 41.5 | 35.4 | 41.1 | 39.3 | 32.1 | |
| Low | 26.5 | 45.9 | 25.9 | 31.1 | 42.4 | 28.2 | 50.8 | 33.8 | 40.7 | 51.5 | |
| BMI (kg/m2) | <25 | 37.6 | 29.6 | 19.8 | 50.2 | 24.9 | 53.8 | 25.7 | 32.3 | 69.5 | 31.9 |
| 25 to <30 | 45.5 | 48.1 | 43.9 | 42.1 | 53.8 | 28.1 | 36.7 | 32.6 | 24.0 | 39.8 | |
| ≥30 | 16.9 | 22.3 | 36.3 | 7.7 | 21.3 | 18.1 | 37.6 | 35.1 | 6.5 | 28.3 | |
| Hormone therapy | Never | 45.9 | 61.1 | 62.1 | 51.7 | 58.8 | |||||
| Ever | 54.1 | 38.9 | 37.9 | 48.3 | 41.2 | ||||||
| Education (years) | >12 | 78.3 | 60.8 | 50.5 | 63.2 | 36.7 | 71.3 | 62.8 | 46.4 | 59.6 | 29.6 |
| 12 | 15.5 | 24.9 | 36.7 | 28.9 | 21.4 | 23.2 | 26.6 | 43.6 | 31.8 | 26.5 | |
| <12 | 6.2 | 14.3 | 12.9 | 7.9 | 41.9 | 5.5 | 10.6 | 10.0 | 8.6 | 43.9 | |
| US born | No | 10.5 | 3.3 | 0.3 | 5.2 | 48.9 | 11.9 | 3.0 | 0.3 | 11.1 | 47.1 |
| Yes | 89.5 | 96.7 | 99.7 | 94.8 | 51.1 | 88.1 | 97.0 | 99.7 | 88.9 | 52.9 | |
| >25 years in US | No | 3.6 | 2.0 | 0.5 | 2.3 | 20.0 | 3.3 | 1.7 | 0.2 | 3.9 | 21.7 |
| Yes | 96.4 | 98.0 | 99.5 | 97.7 | 80.0 | 96.7 | 98.3 | 99.8 | 96.1 | 78.3 | |
| Energy intake (kcal) | 2289 (897) | 2211 (1166) | 2780 (1338) | 2260 (832) | 2617 (1366) | 1809 (701) | 1895 (990) | 2371 (1256) | 1808 (676) | 2185 (1166) | |
current light: <20 pack-years, current heavy: ≥20 pack-years;
Hours of moderate or vigorous activity per day: high (≥1.5), moderate (0.5 to <1.5), low (≤0.5);
W: White; AA: African American; NH: Native Hawaiian; JA: Japanese American; L: Latino; HEI-2010: Healthy Eating Index-2010; AHEI-2010: Alternative Healthy Eating Index-2010; aMED: alternate Mediterranean diet score; DASH: Dietary Approaches to Stop Hypertension
RESULTS
Characteristics of study population.
The study population was mostly composed of Whites and Japanese Americans, followed by Latinos, African Americans, and Native Hawaiians (Table 2). During a mean follow-up of 17.6 years, 1 746 (5.8%) and 1 802 (7.2%) deaths due to stroke were reported for men and women, respectively. The highest stroke death rate among both men and women was observed for African Americans, followed by Japanese Americans and Latinos (Table 2). The distribution of all diet-quality indices differed by ethnic group. Latino men exhibited the highest proportion of low adherence to HEI-2010, AHEI-2010, and aMED. DASH showed the highest proportion of low diet quality for Native Hawaiian men. White and African American men had the highest proportion of high adherence to HEI-2010, Whites also to DASH. Japanese American men had the highest AHEI-2010 scores and Native Hawaiian and Japanese men had the highest aMED scores. For women, the distribution of dietary indices was very similar to men, with Latino having the lowest adherence to HEI-2010, AHEI-2010, and aMED, Native Hawaiian to DASH.
PAR and HR for diet-quality indices.
Spearman correlations between all diet-quality indices ranged from 0.53 to 0.70 (Supplementary Table I). Adjusting for sex, age, and ethnicity only, food patterns representing the lower and medium tertiles were significantly related to stroke mortality for all four indices (Table 3). High adherence could prevent 4.9 to 10.4% of stroke mortality and the increased risk for low versus high adherence varied between 13% and 32% depending on the index. With additional adjustment for established risk factors, the HR decreased to 1.05-1.23, indicating confounding by these factors. However, diet still was an important risk factor and the HRs remained statistically significant, except for the DASH. The PAR was highest for HEI-2010 (HR=1.23 for lowest vs. highest tertile). After adjustment, about 7.9% of all stroke deaths were attributable to a dietary pattern representing low and medium adherence to the HEI-2010 (Table 3 and Supplementary Table II). The aMED (5.4%) and AHEI-2010 (4.3%) also showed significant PARs for low and medium adherence. The DASH was not significantly related to stroke mortality risk, as the corresponding HR and PAR estimates were not significant. The results based on quintiles instead of tertiles of the indices were similar (Supplementary Table III), although the estimates cannot be directly compared due to a different reference category. As the linear trend tests for the diet-quality indices were also significant, our findings support the idea of a consistent, inverse relationship between diet quality and the risk of stroke mortality. The results for stroke subtypes indicated that low diet quality, except for DASH, is a risk factor for both ischemic and hemorrhagic strokes. HEI-2010 and aMED explained hemorrhagic strokes to a larger extent (PAR=9.6% and PAR=10.5%, respectively), whereas the AHEI-2010 had a higher PAR for ischemic strokes (PAR=12.3%) (Supplementary Table IV).
Table 3:
Unadjusted and Adjusted Population Attributable Risks (PAR) and Hazard Ratios (HR) for stroke mortality associated with four diet-quality indices categorized into tertiles
| Minimally adjusteda | Fully adjustedb | ||||
|---|---|---|---|---|---|
| PAR (95%-CI) | HR (95%-CI) | PAR (95%-CI) | HR (95%-CI) | ||
| HEI-2010 | High | 10.41 (6.43; 14.35) | 1 | 7.90 (3.68; 12.18) | 1 |
| Medium | 1.09 (1.01; 1.19) | 1.06 (0.98; 1.15) | |||
| Low | 1.32 (1.21; 1.43) | 1.23 (1.13; 1.34) | |||
| AHEI-2010 | High | 6.45 (1.91; 10.97) | 1 | 4.28 (−0.51; 9.05) | 1 |
| Medium | 1.07 (0.99; 1.16) | 1.04 (0.96; 1.13) | |||
| Low | 1.16 (1.07; 1.27) | 1.10 (1.01; 1.20) | |||
| aMED | High | 6.77 (2.45; 11.05) | 1 | 5.38 (0.72; 10.02) | 1 |
| Medium | 1.06 (0.97; 1.16) | 1.04 (0.95; 1.14) | |||
| Low | 1.17 (1.09; 1.26) | 1.13 (1.04; 1.24) | |||
| DASH | High | 4.91 (0.3; 9.5) | 1 | 1.47 (−3.72; 6.66) | 1 |
| Medium | 1.03 (0.95; 1.12) | 1.00 (0.92; 1.08) | |||
| Low | 1.13 (1.05; 1.23) | 1.05 (0.96; 1.14) | |||
HEI-2010 … Healthy Eating Index-2010; AHEI-2010 … Alternative Healthy Eating Index-2010; aMED … alternate Mediterranean diet score; DASH … Dietary Approaches to Stop Hypertension; PAR … population attributable risk for middle and low adherence to diet-quality index; HR… hazard ratio; CI … confidence interval
based on Cox regression models adjusted for sex, ethnicity, and age
based on Cox regression models adjusted for sex, ethnicity, age and all risk factors as in Table 2, except models including AHEI-2010 and aMED were not additionally adjusted for alcohol consumption
p-values for linear trend tests: HEI-2010: <0.0001, AHEI-2010: 0.002, aMED: 0.04, DASH: 0.005
Stratified analyses.
There were few differences by sex in the distribution of the diet-quality indices, the HRs, and the PARs (Figure 1); the interaction term of the continuous indices with sex was significant for AHEI-2010 only. PARs were higher among women than men for the HEI-2010, AHEI-2010, and aMED, due to a higher HR and a higher prevalence of non-adherence.
Figure 1: Hazard Ratios and Population Attributable Risks for Stroke Mortality associated with Diet-Quality Indices by Sexa.
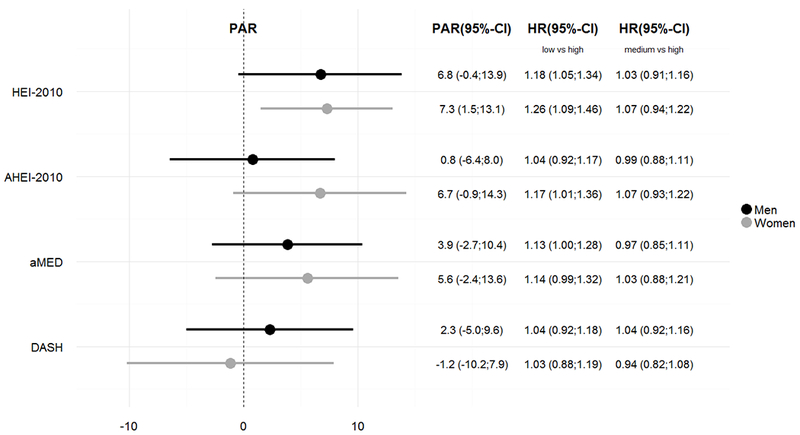
ap-values for interaction tests: HEI-2010: 0.18, AHEI-2010: 0.032, aMED: 0.34, DASH: 0.48
Although the tests for interaction were not significant, the distribution and with some exceptions also the HRs varied considerably between ethnic groups and consequently also the PARs (Figure 2). In Whites, 15.4% of stroke deaths were attributable to diet as assessed with HEI-2010, mostly due to their increased risk of low vs. high adherence (HR=1.52). Between 7.1 and 7.9% of stroke deaths in African Americans were attributable to low or medium adherence to the HEI-2010, AHEI-2010, or DASH, resulting from high HRs for low or medium adherence to the diet-quality indices. For the same reason, about 6% of stroke deaths in Native Hawaiians were attributable to diet quality, except for the DASH. The PARs for Japanese Americans varied between 0.3% (DASH) and 8.2% (HEI-2010), the HRs between 1.00 (DASH) and 1.25 (aMED) for low vs. high adherence. The PARs and HRs for Latinos were rather inconsistent. The HRs for the comparison of low vs. high adherence were only slightly above 1, except for the DASH.
Figure 2: Hazard Ratios and Population Attributable Risks for Stroke Mortality associated with Diet-Quality Indices by Ethnicitya.

ap-values for interaction tests: HEI-2010: 0.25, AHEI-2010 0.63, aMED: 0.53, DASH: 0.32
We did not find consistent differences for short or long term effects of diet. For HEI-2010, there was a decreasing but non-significant trend in PAR and HR over the three follow-up duration periods (<10, 10 to <20, ≥20 years), indicating that poor diet quality explained a higher percentage of stroke deaths during a short vs. long follow-up (Figure 3). However, the HRs within all three periods did not differ significantly from each other for any of the indices. The aMED and DASH also exhibited a decreasing HR but not PAR.
Figure 3: Hazard Ratios and Population Attributable Risks for Stroke Mortality associated with Diet-Quality Indices by Follow-Up Timesa.
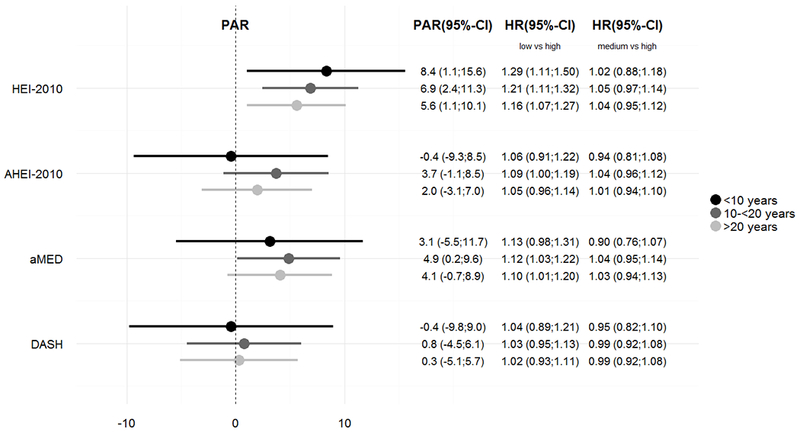
ap-values for interaction tests: HEI-2010: 0.71, AHEI-2010: 0.54, aMED: 0.48, DASH: 0.99
DISCUSSION
Summary.
Our results imply that diet quality according to well established dietary recommendations acts as an independent risk factor for stroke mortality although the attributable and relative risk estimates vary considerably across indices. Adherence to the HEI-2010 had the highest prevention potential, preventing as many as 7.9% of stroke deaths without substantial differences by sex and follow-up period. However, this association was mostly found for Whites with a PAR of 15.4%, followed by non-significant PARs for Japanese Americans (8.2%), African Americans (7.2%), Native Hawaiians (5.9%), and no association in Latinos. Adherence to the AHEI-2010 had the highest prevention potential for African Americans, the aMED for Native Hawaiians and Latinos, the HEI-2010 for Japanese Americans, but the PARs by ethnicity did not differ significantly from zero. Diet quality was overall also inversely related to both ischemic and hemorrhagic stroke death, with varying PARs across indices.
Reasons for differences between diet recommendations.
The finding of high PAR and HR for HEI-2010 may be due to its components that were previously found to be associated with stroke, namely vegetables, fruits, whole grains, and sodium (Table 1), but many of these are also part of the other indices. Specifically, the HEI-2010 includes refined grains and empty calories, which are not included in the other indices and may represent the adverse effects of sugars and foods with a high glycemic load, as well as dairy products and moderate alcohol intake. Additional differences are the inclusion of total protein foods as positive in the HEI-2010 as opposed to the inverse scoring of red/processed meat in the other three indices. However, based on such composite indices, it is not possible to derive a conclusion about the relevance of red/processed meat with any certainty as the sources of proteins are not specified.
Relative importance of diet.
In a joint model, the HEI-2010 had a smaller relative risk (HR=1.23) than medical risk factors such as diabetes (1.68) or a previous heart attack/angina (1.51), but the HEI-2010 PAR of 7.9% was similar to their PARs (8.0% and 5.2%, respectively). This suggests that diet has a similar prevention potential as comorbid conditions, particularly due to the high prevalence of low adherence to diet recommendations. The HR for low adherence to the HEI-2010 was higher than the HR for alcohol intake (HR=1.03, PAR=0.45%), but lower than that for smoking (HR=1.62 and 1.83 for light and heavy smoking, respectively, PAR=10.81%) (Supplementary Table II). In comparison to other study outcomes,18 the findings for all-cause and CVD mortality also revealed the highest HR of HEI-2010 in Whites, both HEI-2010 and DASH in African Americans, and HEI-2010 and aMED in Japanese Americans. The ranking of HRs due to the diet-quality indices in Native Hawaiians and Latinos differed marginally but did not contradict our results.
Comparison to other studies.
The INTERSTROKE study4 is, to our knowledge, the only study with results for a diet-quality index by region and ethnicity. However, it differs in three aspects from the current MEC analysis. First, INTERSTROKE investigated stroke incidence rather than mortality. Second, it reported findings for world regions and ethnic groups, potentially combining differences due to living conditions with differences due to ethnicity. Third, it used an adapted version of AHEI32 which did not report portion sizes and used frequency of intake for scoring instead. Differences in PAR were particularly obvious for participants of European ancestry or from Western Europe, North America, and Australia in INTERSTROKE (region: PAR=33.3%; ethnicity: PAR=32.6%). The difference between Latinos in the MEC (2.6%) and the INTERSTROKE South American region (37.3%) and the Latin American ethnicity (37.0%) was even greater. Japanese Americans and Native Hawaiians in the MEC could not be compared. African Americans in the MEC showed a higher PAR (7.9%) than in the INTERSTROKE African region (3.6%) or African ethnicity (4.7%), possibly because African Americans living in the area of Los Angeles have dietary patterns more similar to White Americans than to other Africans as well as possibly being less exposed to adverse living conditions, such as poor access to health care. It could also indicate that the MEC food frequency questionnaire was more appropriate for diet assessment as it was developed specifically for the five ethnic groups.
Reasons for ethnic differences in PAR.
There are four possible explanations for the variation of PAR estimates across ethnic groups. First, by definition the PAR depends on two parameters, the HR and the prevalence, i.e., even if a risk factor exhibits an HR greater than 1, a low prevalence leads to a low PAR. Moreover, the PAR of categorical risk factors with more than two categories is a combined PAR, depending on more than one prevalence and HR estimate. Second, dietary indices were developed and validated in mostly white populations. Eating behaviors of other ethnic groups might not be correctly reflected, who may differ in their susceptibility to disease from specific foods and nutrients. Third, the relative proportion of ischemic vs. hemorrhagic stroke differs across populations and diet might not be equally important for all subtypes. Fourth, stroke mortality differs by ethnicity as it was highest among African Americans, followed by Whites, Asians, and Hispanics.14
Strengths and limitations.
The two main contributions of this longitudinal study are the focus on diet recommendations rather than individual food items or nutrients and the estimation of preventable proportions in addition to relative risks. Moreover, drawing on data from a large cohort study, the sample size was sufficient to detect differences in stroke mortality even in stratified analyses. Another strength is the validated dietary assessment tool specifically designed for the five ethnic groups and the ability to compute different diet-quality indices.
A major limitation is the use of stroke mortality as the outcome, as especially in Western countries the lethality of stroke has decreased. Therefore, results based on stroke mortality can only serve as a proxy for stroke incidence. Due to the use of ICD codes in death records, stratified analyses by stroke subtypes were of limited reliability and due to the low rate of classification into the main subtypes, we refrained from further stratification by ethnicity. We cannot exclude that these classifications depended on patient characteristics and were not applied consistently across physicians and institutions. We did not include medication use to control hypertension, which is known to vary by ethnicity. Moreover, we could not account for other important risk factors known to be associated with stroke mortality, as for example access to health care, the type of treatment in the course of the disease, and more detailed information about the socioeconomic status, which was found to be strongly associated with stroke mortality.33–36 Another limitation was the assumption of constant dietary patterns over a long time when changes in diet were highly likely but were not assessed. However, no significant differences by length of follow-up were detected.
Conclusions.
Diet recommendations based on HEI-2010 were found to have a higher impact than the other three indices to prevent stroke death, especially in Whites and, possibly, for hemorrhagic stroke. This might be due to the HEI-2010 including a large number of food components in general and a majority of the main food items previously reported to be associated with stroke. About 8% of stroke deaths could be prevented if the population maintained high instead of low or medium adherence to this food pattern. Individuals with low adherence had a 23% higher risk of stroke mortality. Similarity in relative risks by follow-up time emphasizes the importance of diet over a long time. Stratified analyses by ethnicity revealed a more diverse picture of attributable and relative risks. The variation probably had several underlying causes, but was primarily due to different patterns of adherence to diet recommendations. These differences highlight the importance for future studies to distinguish ischemic and hemorrhagic stroke in ethnically diverse populations. The current results highlight the great preventive potential of stroke through improvements in diet quality, which could have a substantial impact on the population level, particularly among Whites.
Supplementary Material
ACKNOWLEDGEMENTS
Sources of Support: The Multiethnic Cohort has been supported by NCI grant U01 CA164973 (PI: Drs. L. Le Marchand/C.A. Haiman/L.W. Wilkens). SJ was supported by a postdoctoral fellowship from the German Research Foundation (DFG, JA 2564/1-1). AA received funding from the German Exchange Service (DAAD) for her research stay at the University of Hawaii Cancer Center.
Footnotes
Conflict of interest: The authors declare no conflict of interest.
Supplementary information is available at European Journal of Clinical Nutrition’s website.
REFERENCES
- 1.Kochanek KD, Murphy SL, Xu J, Tejada-Vera B. Deaths: Final Data for 2014. National Vital Statistics Reports 65 (2016). <http://www.cdc.gov/nchs/data/nvsr/nvsr65/nvsr65_04.pdf>. [PubMed] [Google Scholar]
- 2.Miniño AM, Murphy SL, Xu J, Kochanek KD. Deaths: final data for 2008. National vital statistics reports: from the Centers for Disease Control and Prevention, National Center for Health Statistics, National Vital Statistics System 2011; 59: 1–126. [PubMed] [Google Scholar]
- 3.Feigin VL, Roth GA, Naghavi M, Parmar P, Krishnamurthi R, Chugh S, et al. Global burden of stroke and risk factors in 188 countries, during 1990–2013: a systematic analysis for the Global Burden of Disease Study 2013. The Lancet Neurology 2016. [DOI] [PubMed] [Google Scholar]
- 4.O’Donnell MJ, Chin SL, Rangarajan S, Xavier D, Liu L, Zhang H, et al. Global and regional effects of potentially modifiable risk factors associated with acute stroke in 32 countries (INTERSTROKE): a case-control study. The Lancet 2016; 388: 761–775. [DOI] [PubMed] [Google Scholar]
- 5.Gardener H, Rundek T, Wright CB, Elkind MSV, Sacco RL. Dietary sodium and risk of stroke in the Northern Manhattan study. Stroke 2012; 43: 1200–1205. [DOI] [PMC free article] [PubMed] [Google Scholar]
- 6.Dauchet L, Amouyel P, Dallongeville J. Fruit and vegetable consumption and risk of stroke a meta-analysis of cohort studies. Neurology 2005; 65: 1193–1197. [DOI] [PubMed] [Google Scholar]
- 7.He FJ, Nowson CA, MacGregor GA. Fruit and vegetable consumption and stroke: meta-analysis of cohort studies. The Lancet 2006; 367: 320–326. [DOI] [PubMed] [Google Scholar]
- 8.Kaluza J, Wolk A, Larsson SC. Red Meat Consumption and Risk of Stroke A Meta-Analysis of Prospective Studies. Stroke 2012; 43: 2556–2560. [DOI] [PubMed] [Google Scholar]
- 9.Hu FB. Dietary pattern analysis: a new direction in nutritional epidemiology. Current opinion in lipidology 2002; 13: 3–9. [DOI] [PubMed] [Google Scholar]
- 10.Reedy J, Krebs-Smith SM, Miller PE, Liese AD, Kahle LL, Park Y, et al. Higher diet quality is associated with decreased risk of all-cause, cardiovascular disease, and cancer mortality among older adults. The Journal of nutrition 2014; 144: 881–889. [DOI] [PMC free article] [PubMed] [Google Scholar]
- 11.Fung TT, Rexrode KM, Mantzoros CS, Manson JE, Willett WC, Hu FB. Mediterranean diet and incidence of and mortality from coronary heart disease and stroke in women. Circulation 2009; 119: 1093–1100. [DOI] [PMC free article] [PubMed] [Google Scholar]
- 12.Psaltopoulou T, Sergentanis TN, Panagiotakos DB, Sergentanis IN, Kosti R, Scarmeas N. Mediterranean diet, stroke, cognitive impairment, and depression: A meta‐analysis. Annals of neurology 2013; 74: 580–591. [DOI] [PubMed] [Google Scholar]
- 13.Salehi-Abargouei A, Maghsoudi Z, Shirani F, Azadbakht L. Effects of Dietary Approaches to Stop Hypertension (DASH)-style diet on fatal or nonfatal cardiovascular diseases—incidence: a systematic review and meta-analysis on observational prospective studies. Nutrition 2013; 29: 611–618. [DOI] [PubMed] [Google Scholar]
- 14.National Institutes of Health. Morbidity & Mortality. 2012. Chart Book on Cardiovascular, Heart and Lung Diseases. Bethesda, MD: National Institutes of Health 2012. [Google Scholar]
- 15.Collaborators NMSS, Sacco RL, Boden-Albala B, Gan R, Chen X, Kargman DE, et al. Stroke incidence among white, black, and Hispanic residents of an urban community: the Northern Manhattan Stroke Study. American journal of epidemiology 1998; 147: 259–268. [DOI] [PubMed] [Google Scholar]
- 16.Markus HS, Khan U, Birns J, Evans A, Kalra L, Rudd AG, et al. Differences in stroke subtypes between black and white patients with stroke. Circulation 2007; 116: 2157–2164. [DOI] [PubMed] [Google Scholar]
- 17.Kolonel LN, Henderson BE, Hankin JH, Nomura AM, Wilkens LR, Pike MC, et al. A multiethnic cohort in Hawaii and Los Angeles: baseline characteristics. American journal of epidemiology 2000; 151: 346–357. [DOI] [PMC free article] [PubMed] [Google Scholar]
- 18.Harmon BE, Boushey CJ, Shvetsov YB, Ettienne R, Reedy J, Wilkens LR, et al. Associations of key diet-quality indexes with mortality in the Multiethnic Cohort: the Dietary Patterns Methods Project. The American journal of clinical nutrition 2015; 101: 587–597. [DOI] [PMC free article] [PubMed] [Google Scholar]
- 19.Stram DO, Hankin JH, Wilkens LR, Pike MC, Monroe KR, Park S, et al. Calibration of the dietary questionnaire for a multiethnic cohort in Hawaii and Los Angeles. American Journal of Epidemiology 2000; 151: 358–370. [DOI] [PMC free article] [PubMed] [Google Scholar]
- 20.Sharma S, Murphy S, Wilkens L, Au D, Shen L, Kolonel L. Extending a multiethnic food composition table to include standardized food group servings. Journal of Food Composition and Analysis 2003; 16: 485–495. [Google Scholar]
- 21.US Department of Health and Human Services and US Department of Agriculture. Dietary Guidelines for Americans. 7 edn, (US Government Printing Office, 2010). [Google Scholar]
- 22.Guenther PM, Casavale KO, Reedy J, Kirkpatrick SI, Hiza HA, Kuczynski KJ, et al. Update of the healthy eating index: HEI-2010. Journal of the Academy of Nutrition and Dietetics 2013; 113: 569–580. [DOI] [PMC free article] [PubMed] [Google Scholar]
- 23.Chiuve SE, Fung TT, Rimm EB, Hu FB, McCullough ML, Wang M, et al. Alternative dietary indices both strongly predict risk of chronic disease. The Journal of nutrition 2012: jn.111.157222. [DOI] [PMC free article] [PubMed] [Google Scholar]
- 24.Fung TT, McCullough ML, Newby P, Manson JE, Meigs JB, Rifai N, et al. Diet-quality scores and plasma concentrations of markers of inflammation and endothelial dysfunction. The American journal of clinical nutrition 2005; 82: 163–173. [DOI] [PubMed] [Google Scholar]
- 25.Fung TT, Chiuve SE, McCullough ML, Rexrode KM, Logroscino G, Hu FB. Adherence to a DASH-style diet and risk of coronary heart disease and stroke in women. Archives of internal medicine 2008; 168: 713–720. [DOI] [PubMed] [Google Scholar]
- 26.NIH U. Department of Health and Human Services, National Institutes of Health, National Heart, Lung, and Blood Institute, Your guide to lowering your blood pressure with DASH. DASH eating plan 2006. [Google Scholar]
- 27.Sacco RL, Kasner SE, Broderick JP, Caplan LR, Culebras A, Elkind MS, et al. An updated definition of stroke for the 21st century. Stroke 2013; 44: 2064–2089. [DOI] [PMC free article] [PubMed] [Google Scholar]
- 28.McCormick N, Bhole V, Lacaille D, Avina-Zubieta JA. Validity of diagnostic codes for acute stroke in administrative databases: a systematic review. PloS one 2015; 10: e0135834. [DOI] [PMC free article] [PubMed] [Google Scholar]
- 29.Spiegelman D, Hertzmark E, Wand H. Point and interval estimates of partial population attributable risks in cohort studies: examples and software. Cancer Causes & Control 2007; 18: 571–579. [DOI] [PubMed] [Google Scholar]
- 30.Wickham H ggplot2: elegant graphics for data analysis. (Springer Science & Business Media, 2009). [Google Scholar]
- 31.R: A language and environment for statistical computing (R Foundation for Statistical Computing, Vienna, Austria, 2016). [Google Scholar]
- 32.Dehghan M, Mente A, Teo KK, Gao P, Sleight P, Dagenais G, et al. Relationship Between Healthy Diet and Risk of Cardiovascular Disease Among Patients on Drug Therapies for Secondary Prevention A Prospective Cohort Study of 31 546 High-Risk Individuals From 40 Countries. Circulation 2012; 126: 2705–2712. [DOI] [PubMed] [Google Scholar]
- 33.Myint PK, O Bachmann M, Loke YK, D Musgrave S, Price GM, Hale R, et al. Important factors in predicting mortality outcome from stroke: findings from the Anglia Stroke Clinical Network Evaluation Study. Age and ageing 2017; 46: 83–90. [DOI] [PMC free article] [PubMed] [Google Scholar]
- 34.Wu SH, Woo J, Zhang X-H. Worldwide socioeconomic status and stroke mortality: an ecological study. International journal for equity in health 2013; 12: 42. [DOI] [PMC free article] [PubMed] [Google Scholar]
- 35.Wang H, Sandel ME, Terdiman J, Armstrong MA, Klatsky A, Camicia M, et al. Postacute care and ischemic stroke mortality: findings from an integrated health care system in northern California. PM&R 2011; 3: 686–694. [DOI] [PubMed] [Google Scholar]
- 36.Williams LS, Eckert GJ, Gilbert J, Lapuerta P, Weinberger M. Regional variation in health care utilization and outcomes in ischemic stroke. Journal of Stroke and Cerebrovascular Diseases 2003; 12: 259–265. [DOI] [PubMed] [Google Scholar]
Associated Data
This section collects any data citations, data availability statements, or supplementary materials included in this article.