

Abstract
Adoptive transfer of tumor epitope–reactive T cells has emerged as a promising strategy to control tumor growth. However, chronically-stimulated T cells expanded for adoptive cell transfer are susceptible to cell death in an oxidative tumor microenvironment. Because oxidation of cell-surface thiols also alters protein functionality, we hypothesized that increasing the levels of thioredoxin (Trx), an antioxidant molecule facilitating reduction of proteins through cysteine thiol-disulfide exchange, in T cells will promote their sustained antitumor function. Using pre-melanosome protein (Pmel)–Trx1 transgenic mouse-derived splenic T cells, flow cytometry, and gene expression analysis, we observed here that higher Trx expression inversely correlated with reactive oxygen species and susceptibility to T-cell receptor restimulation or oxidation-mediated cell death. These Trx1-overexpressing T cells exhibited a cluster of differentiation 62Lhi (CD62Lhi) central memory-like phenotype with reduced glucose uptake (2-NBDGlo) and decreased effector function (interferon γlo). Furthermore, culturing tumor-reactive T cells in the presence of recombinant Trx increased the dependence of T cells on mitochondrial metabolism and improved tumor control. We conclude that strategies for increasing the antioxidant capacity of antitumor T cells modulate their immunometabolic phenotype leading to improved immunotherapeutic control of established tumors.
Keywords: T-cell, melanoma, cell metabolism, antioxidant, immunotherapy, adoptive cell therapy, cell-surface thiol, redox protein, thioredoxin
Introduction
Adoptive T-cell therapy (ACT)3 is a promising approach for treating patients with advanced malignancies (1). However, a quantitative or qualitative decrease of transferred antitumor T cells in tumor-bearing host results in tumor recurrence, leaving substantial room for improvement. Successful approaches to program T cells toward a immunometabolic or stem cell memory (Tscm) phenotype or by blocking the mTOR, the Akt, or the glycolytic pathways have led to increased persistence and exhibit better tumor control (2). Therefore, understanding the mechanisms that are central to the Tcm or Tscm phenotypes has the potential to improve the effectiveness of ACT.
It has been widely recognized that reduction–oxidation (redox) responses occurring at the intra- and extracellular levels are important in regulating several biological processes (3). Recent studies have also shown the importance of redox-mediated regulation of the immune response (4, 5). We have previously observed that reactive oxygen species (ROS) contribute to T-cell restimulation–induced cell death (6), and T cells with higher cell-surface thiol (c-SH) expression exhibit improved immunotherapeutic control of established melanomas (5). Therefore, we hypothesized that c-SHhi is a biomarker for T cells with increased persistence, and mechanisms that result in the c-SHhi phenotype would lead to improved antitumor activity in vitro and in vivo. Because the thioredoxin enzyme system (Trx, thioredoxin reductase, and NADPH) has the capacity to reduce oxidized thiols and contribute to cellular redox balance (7), we determined if Trx1 overexpression alters T-cell phenotype and function. We show here that T cells overexpressing the thiol-regulating molecule thioredoxin (Trx) are not only c-SHhi but also provide unique immunometabolic phenotypes akin to the memory T cells. This leads to improved persistence of antitumor T cells in an oxidative tumor microenvironment. We believe that this strategy to generate robust “antitumor T cells” by targeting the redox status of a T cell will be of high-translational significance in ACT.
Results
Trx transgenic T cells exhibit increased thiols, reduced susceptibility to tumor microenvironment–mediated oxidative stress, and Tcm/Tscm phenotypes
Trx is a class of 12-kDa ubiquitous redox proteins found primarily in the cytosol. Trx possesses a catalytically active di-thiol function in a Cys–Gly–Pro–Cys motif and are present in all organisms. Biomolecules with redox-active sulfhydryl (–SH) functions are necessary for the maintenance of mildly reductive cellular environments to counteract oxidative stress and for the execution of redox reactions for metabolism and detoxification (10). We recently bred melanoma epitope gp100-reactive TCR-bearing transgenic mouse Pmel with a thioredoxin1 (Trx1)-transgenic mouse, in which human Trx1 is systemically overexpressed under the control of the β-actin promoter (11), to obtain Pmel–Trx mouse. Fig. S1A shows successful generation of the Pmel–Trx mice. The gel picture shows the characterization of the Pmel–Trx mice. Although Pmel mice showed gp100 TCRα (600 bp) and TCRβ (500 bp) in Fig. S1A, lane 1, Trx expression was undetectable in lane 2. Similarly, the Trx–Tg mouse does not show any Pmel TCRαβ expression (Fig. S1A, lane 3) but is positive for Trx (lane 4). Furthermore, the Pmel–Trx mouse shows expression of Pmel TCRαβ (Fig. S1A, lane 5) and Trx (lane 6). A comparison of thymi showed a reduction in the CD8 single-positive (SP) cells, and increase in CD4+ SP and CD4+CD8+ double-positive cells (Fig. S1B). A FACS-based comparison also showed increased Trx expression in class I epitope gp100 reactive Pmel–Trx CD8+ T cells than observed in Pmel CD8+ T cells (Fig. 1A). The high expression of Trx also correlated with increased expression of cell-surface thiols (c-SH) in splenic Pmel–Trx T cells as compared with T cells from Pmel mice (Fig. 1B). The c-SH staining was done using the Alexa Fluor–labeled maleimide dye (Invitrogen), as reported previously (5). The increased antioxidant thiol levels were also inversely correlated to the ROS levels in the activated T cells as measured by DCFDA (Fig. 1C), and less cell death was mediated by oxidant injury using H2O2 (Fig. 1D) or activation-induced cell death induced upon TCR restimulation (Fig. 1E). Importantly, the levels of receptor-interacting protein kinase (RIPK)-1 and RIPK-3, which are known to regulate oxidative stress and activation induced cell death (AICD) leading to necroptosis (12), were also reduced in activated T cells overexpressing Trx (Fig. 1F and Fig. S1C).
Figure 1.

Trx-overexpressing transgenic T cells exhibit higher antioxidant capacity and reduced susceptibility to oxidative stress. Splenic T cells from Pmel and Pmel–Trx T cells were activated with gp100 peptide antigen for 3 days in presence of IL2 (50 IU/ml) before using to determine: A, Trx expression staining on the Pmel and Pmel–Trx T cells. B, expression of cell-surface thiols (c-SH) using Alexa Fluor–labeled maleimide dye. C, intracellular reactive oxygen species accumulation (H2O2) by DCFDA. D, annexin V levels after overnight culture in the presence of 50 μm exogenous H2O2. E, annexin V levels 4 h after restimulation with cognate antigen. F, cell in E were stained intracellularly using fluorochrome-conjugated anti-RIPK3 antibody. G, 3-day–activated Pmel and Pmel–Trx splenocytes were transferred i.p. to the EL4 ascites established for 14 days in C57BL/6 mice. The T cells were retrieved after 24 h, and oxidative stress markers 8-OHdG (left panel) and nitrotyrosine (right panel) were determined in Vβ13-gated CD8+ T cells. Mean fluorescence intensity (MFI) from two independent experiments is represented as bar diagram. The bar diagram adjacent to each panel represents the cumulative data of MFI from 3 to 5 independent experiments. *, p value < 0.05; **, p value <0.01.
To confirm the functional advantage of Trx overexpression in T cells, activated congenic Pmel or Pmel–Trx Tg T cells were transferred i.p. into the C57BL/6 mice with EL4 ascites. The analysis of Vβ13+ T cells retrieved after 24 h from ascites showed reduced 8-hydroxyguanine (8-OHdG) and reduced nitrotyrosine (marker for ROS/reactive nitrogen species stress) (13) in Pmel–Trx, as compared with Pmel cells alone (Fig. 1G). This established that increased Trx levels indeed protect the T cells in an oxidative tumor microenvironment.
Since a recent study has shown that T stem cell-like memory (Tscm) cells may reside within the Tcm group (14), we evaluated whether Trx-overexpressing T cells from Pmel–Trx mouse have increased the Tscm phenotype, which could be responsible for better tumor control. We found that the Tscm fraction, which can be tracked by gating on CD8+CD62Lhi CD44loSca-1hiCD122hi (15), was indeed greater in Pmel–Trx T cells (Fig. 2A). The increased “stemness” in Pmel–Trx T cells also correlated with significantly high expression of stem cell genes as Lef1, Oct4, Ctnnb1 (β-catenin), and Bcl6 (Fig. 2B). Thus, our data confirm that Trx indeed increases the “stemness” phenotype in Trx-overexpressing T cells.
Figure 2.

Trx-overexpressing T cells exhibit enhanced Tscm phenotype and recall response. A, 3-day antigen-activated gp100 TCR-specific splenic T cells from Pmel and Pmel–Trx mice were gated on CD44loCD62L+ and evaluated for CD122 and Sca1 expression. B, RNA prepared from activated Pmel and Pmel–Trx T cells was used to determine expression of stem cell–related genes. n = 3. C, 3-day activated Pmel and Pmel–Trx transgenic T cells (1 × 10⁶ cells/mouse) were adoptively transferred into Rag1−/− mice. After 25 days, T-cell–transferred mice were subcutaneously injected with B16-F10 solid tumors (0.25 × 10⁶ cells/mouse). Upper panel shows representative flow cytometric analysis done to determine the percentage of TCR transgenic T cells retrieved from spleen, lymph nodes, blood, lung, and liver after 5 days of tumor injection. Lower panel is the cumulative data from different mice. D, splenocytes from C were stimulated overnight with hgp100 antigen before being analyzed for intracellular signature of IFNγ. n = 3. *, p < 0.05; **, p < 0.005; ***, p < 0.0005.
To determine the trafficking ability and capacity of Trx–Tg T cells to establish memory in vivo, we activated both Pmel and Pmel–Trx mouse-derived splenic T cells with melanoma epitope gp100 for 3 days and transferred them i.v. into Rag1−/− mice. After 25 days of initial transfer of T cells, the recipient mice were subcutaneously injected with murine melanoma B16-F10 cells. Then the transgenic T cells were tracked after 5 days of tumor injection in different lymphoid and nonlymphoid organs. We observed that Pmel–Trx T cells exhibited higher recall response to tumor challenge as compared with Pmel control T cells, which was evident by its significantly increased expansion in each organ (Fig. 2C). Additionally, the Pmel–Trx T cells tracked from the spleen of recipient mice also showed enhanced cytokine secretion upon restimulation, as compared with the Pmel T cells (Fig. 2D). This indicates that Trx overexpression renders T cells with a functional memory phenotype.
Increased Trx expression alters T cell signaling
To determine whether any differences exist in TCR signaling between the Pmel and Pmel–Trx cells, we determined the phosphorylation levels of key signaling molecules AKT, JNK, and STAT5. Our data in Fig. 3A show reduced phosphorylation levels of AKT, JNK, and ERK. Given the importance of STAT5 involvement in assessing a T-cell response to the cytokine microenvironment that shapes its function (16), we determined the pSTAT5 in Pmel–Trx T cells. We observed that Pmel–Trx T cells have reduced up-regulation of pSTAT5 as compared with the Pmel T cells (Fig. 3B). This also corresponded to the reduced ability of Pmel–Trx T cells to secrete cytokine IFNγ (33% by Pmel–Trx versus 59% by Pmel) (Fig. 3C), which is shown to dependent upon glucose availability (17). Using the fluorescence glucose analog 2NBDG, we observed that Pmel–Trx T cells exhibit lower glucose uptake as compared with the Pmel T cells alone (Fig. 3D). A real-time PCR analysis confirmed that activated Pmel–Trx T cells exhibit reduced expression of the glucose transporter Glut1 and lesser expression of key glycolytic molecule hexokinase II (HKII) (Fig. 3E). However, the transcription factor associated with mitochondria and ND4 was up-regulated in Pmel–Trx T cells. This indicated that the Trx-overexpressing T cells are more dependent upon mitochondrial oxidative phosphorylation than glycolysis for their energy demands. A Seahorse-based metabolic flux analysis confirmed that antigen Pmel–Trx T cells activated with cognate antigen for 3 days exhibit higher basal oxygen consumption rate (OCR), and they possessed enhanced spare respiratory capacity (SRC) than the Pmel T cells alone (Fig. 3F). Overall, these differences established that OCR/ECAR ratio was higher in Pmel–Trx as compared with Pmel (Fig. 3F, right panel). Mitochondrial fatty acid oxidation has been shown to modulate OXPHOS in memory T cells with high SRC and CPT1a, a rate-limiting enzyme that regulates the entry of fatty acid from cytosol to mitochondria (18). However, we observed that inhibition of CPT1a using etomoxir did not deplete OCR and SRC in Trx–Tg T cells. Thus, it is possible that the other pathway, as glutaminolysis, is involved in shaping the phenotype of Trx–Tg T cells.
Figure 3.

Cell signaling and function of Pmel–Trx T cells. Pmel and Pmel–Trx-derived splenic T cells were activated for 3 days with cognate antigen and used for determining: A, phosphorylation levels of key signaling molecules by intracellular staining with phospho-antibodies (from BD Biosciences) as per the manufacturer's protocol. B, cells were left in IL2 (50 IU) for 15 and 60 min before staining with fluorochrome-conjugated antibody for phospho-STAT5. C, intracellular IFNγ staining after reactivation with cognate antigens overnight. Adjacent bar diagram represents the cumulative data for the percentage of Vβ13+CD8+ cells producing IFNγ from three independent experiments. D, glucose uptake (using 2NBDG) after antigen restimulation for 4 h. Adjacent bar diagram represents the cumulative data of MFI from three independent experiments. E, qPCR analysis of various genes in 3-day activated Pmel and Pmel–Trx cells. Data are representative of three independent experiments. F, OCR was measured using Seahorse flux analyzer in the presence or absence of etomoxir (200 μm) followed by the addition of the indicated mitochondrial inhibitors in 3-day activated WT or Trx-overexpressing T cells in the left panel. Graphs in the right panel represent maximum OCR (maximum rate measured after carbonyl cyanide p-trifluoromethoxyphenylhydrazone (FCCP) injection), spare respiratory capacity (SRC, maximum respiration-basal respiration), and OCR/ECAR ratio. Results are representative of three independent experiments with similar observations. *, p < 0.05; **, p < 0.01; and ***, p < 0.005.
Comprehensive metabolic profiling of activated Pmel versus Pmel–Trx shows distinct metabolites in Pmel–Trx T cells
Because commitment of the T cells to different metabolic pathways has been shown to result in differential fate of the T cells (19), we utilized the services of the commercial vendor Metabolon, Inc., to quantify the differences in metabolites accumulated within the TCR-activated Pmel versus Pmel–Trx T cells. For this purpose, 10 million activated Pmel and Pmel–Trx T cells were sorted, and the pellets were frozen as per the protocol before overnight shipping for the analysis that was done using gas chromatography–mass spectroscopy (GC-MS). The principal component analysis in Fig. 4A summarizes the degree of differences between metabolites in Pmel versus Pmel–Trx T cells, whereas Fig. 4, B–D, shows the heat maps of key metabolic pathways comparing the metabolites between Pmel versus Pmel–Trx T cells. Specifically, the Pmel–Trx T cells exhibited higher metabolites related to the pentose phosphate pathway (PPP) and tricarboxylic acid (TCA) cycle. Although a number of amino acids were found to be up-regulated in Pmel–Trx T cells, those noticeable were the ones that have been shown to be involved in life-span extension, i.e. serine, proline, or histidine (20). Importantly, Trx are characterized by the presence of three conserved prolines, with one located between the catalytic cysteine residues of the –Cys–Gly–Pro–Cys motif. Proline is also the key residue that determines the reducing power of Trx, and replacing it by a serine or a threonine has a dramatic effect on the redox and the stability properties of the protein (20). Thus, we believe that the thioredoxin overexpression in T cells potentiates the reductive phenotype. This could be attributed to increased usage of PPP (as evident by increased NADPH) and accumulation of the α-ketoglutarate (α-KG). A recent study showed that α-KG blocks ATP synthase and lowers ATP levels in the cells with a longer life span and aids in stem cell differentiation (21).
Figure 4.
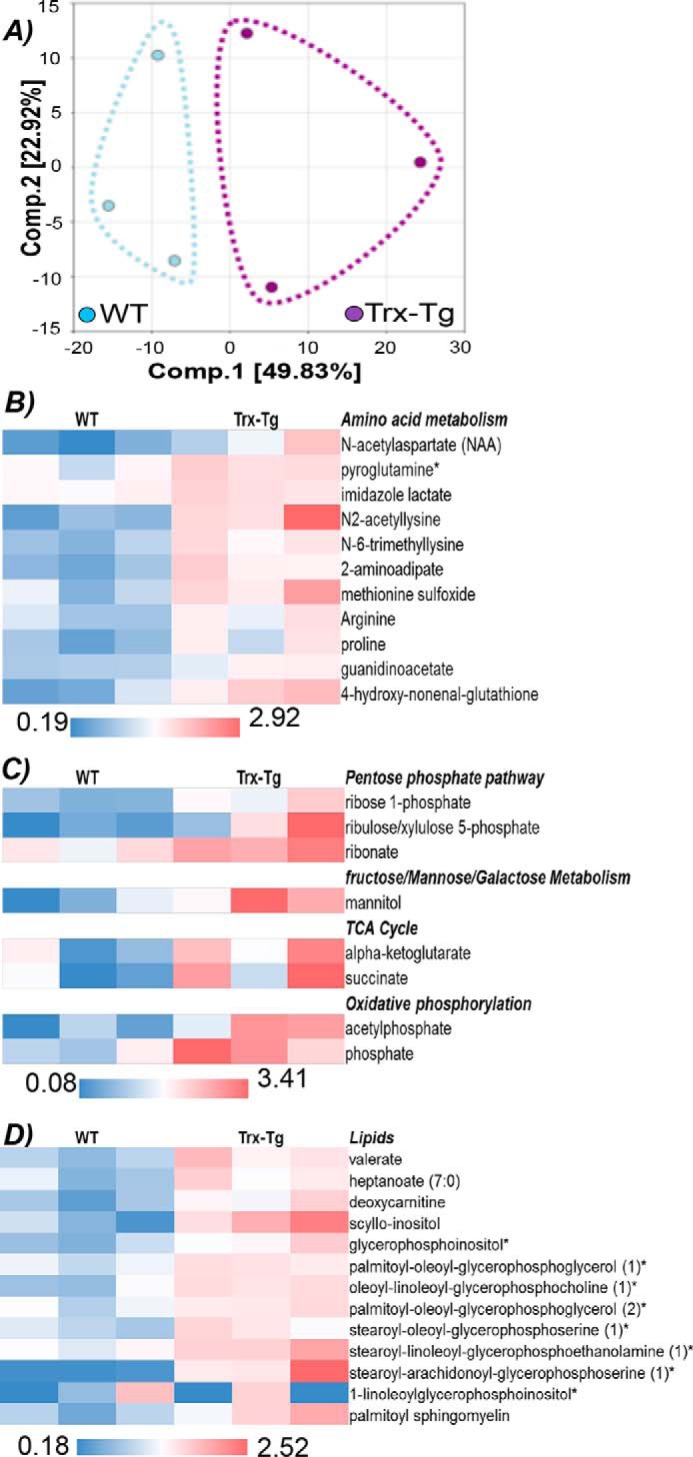
Metabolic profiling of Pmel–Trx T cells. Pmel and Pmel–Trx T cells were activated with the cognate antigen for 3 days and used for quantifying intracellular metabolites using MS. A, principal component analysis shows distribution of the metabolites. B–D, relative amount of metabolites evaluated between the triplicate Pmel and Pmel–Trx T cells are segregated into different metabolic pathways and shown as heat maps.
Increased glutamine uptake by Trx-overexpressing T cells imprints a unique metabolic advantage
The observation that Trx–T cells exhibit elevated levels of the metabolite α-KG, which is also replenished by anaplerotic reactions using glutamine and enters into the mitochondrial citric acid cycle, led us to hypothesize that differential glutamine levels in Trx-overexpressing T cells may be responsible for their increased persistence in the tumor microenvironment. It has also been shown that although glutamine helps differentiation of T cells to effector phenotype (22), and the deficiency of glutamine can result in formation of Tregs (22). To establish the role of glutamine dependence of Pmel–Trx T cells, we used the tracer studies by incubating the 3-day TCR-activated T cells with l-[3,4-3H]glutamine (0.5 mCi) for 5 min at room temperature, and incorporation per cell was measured in counts/min as detailed earlier (22). Our data shows that Pmel–Trx T cells have increased glutamine uptake as compared with the Pmel T cells (Fig. 5A), and Pmel T cells when activated in presence of recombinant Trx (rTrx) also display high glutamine uptake. Because increased levels of glutamine leading to higher α-KG accumulation can either be due to increased activity of glutamine synthetase, increased transportation of glutamine (due to transporters), or a higher degree of glutaminolysis (i.e. degradation of available glutamine), we determined the contribution of each of these pathways by determining the mRNA expression of these molecules in activated Pmel, Pmel–Trx, and Pmel + rTrx groups (Fig. 5B). We observed that the genes associated with glutamine uptake (e.g. glutamine transporters Slc1a5, Slc3a2, Slc7a5, and xCT) and its catabolism (Glud1, Gls1, and Gfpt) were considerably higher in Pmel–Trx and Pmel + rTrx T cells as compared with Pmel T cells alone. Although the solute carrier family members (Slc1a5, Slc3a2, and Slc7a5) facilitate exchange of glutamine (and other neutral or branched-chain and aromatic amino acids) (23), Glud1 (glutamate dehydrogenase) is a mitochondrial matrix enzyme that catalyzes the oxidative deamination of glutamate to α-ketoglutarate and ammonia (24). Glud1 plays a key role in glutamine anaplerosis by producing α-ketoglutarate, an important intermediate in the tricarboxylic acid cycle. Similarly, Gls1 (glutaminase I) is an aminohydrolase enzyme that generates glutamate from glutamine. Furthermore, flow-cytometry analysis confirmed the increased expression of xCT (SLC7A11), the antiporter that plays an antioxidant role by exporting glutamate for cysteine (Fig. 5C). However, we observed the lower level of free enzyme in the glutamine pathway (Fig. 5C), which indicates active utilization of glutamine and elevated glutaminolysis in Trx–T cells. The enhanced expression of glutaminolysis enzymes in Pmel–Trx T cells was supported by the increased accumulation of the key metabolites glutamine, glutamate, and α-KG (Fig. 5D).
Figure 5.

Increased glutamine dependence of Trx-overexpressing T cells. Pmel and Pmel–Trx T cells activated using cognate peptide antigen for 3 days were used to: A, uptake of radiolabeled glutamine that was measured in counts/min (CPM) was determined and presented as mean of four replicate samples from three repeated experiments. B, obtain RNA and determine the expression of various glutaminolysis-associated genes using qPCR. The data presented are from three experiments. C, cell-surface expression of amino acid transporter xCT and glutaminolytic enzymes (upper panel). Bar diagrams (lower panel) represent the cumulative data of MFI from three independent experiments. *, p < 0.05; **, p < 0.01. D, activated Pmel and Pmel–Trx cells were used to measure intracellular metabolites using MS. E, splenic T cells from C57BL/6 mouse were activated with anti-CD3/28 (each 2 μg/ml) either in the absence or presence of α-KG for 3 days, after which Tscm phenotype was evaluated using CD62L and CD44 cell-surface expression. F, cells in E were also used for determining glucose uptake using 2NBDG. Representative data from one of three experiments with similar results are presented. G, RNA was used to determine the expression of genes involved in chromatin modification using mouse epigenetic chromatin modification enzymes PCR array (Qiagen).
Furthermore, to determine whether glutamine-catabolized α-KG (which supports energy production through TCA cycle anaplerosis) is responsible for the memory phenotype exhibited by Pmel–Trx T cells, we used cell-permeable octyl-α-KG (Cayman, stock no. CAS 876150) in the cell culture. Our data show that Pmel T cells activated and expanded for 72 h with octyl–α-KG results in an increased fraction of cells co-expressing CD44loCD62L+ (7.43% in untreated versus 23.9% in treated in lower right quadrant), indicating an increase in Pmel cells with a Tscm phenotype (Fig. 5E), and exhibited decreased glucose uptake (≈40% lower mean intensity of the fluorescence glucose uptake) (Fig. 5F). It has also been shown that many chromatin-modifying enzymes, including Jumonji C domain-containing histone demethylases and ten-eleven translocation (Tet) DNA demethylases, are sensitive to α-KG levels (25). To further address the role of Trx in mediating epigenetic modification, we used a qPCR array analysis for epigenetic modifiers (catalog no. PAMM-085A, Qiagen). Our data in Fig. 5G show that the expression of Hdac11 was lower, whereas the enzymes involved in modifying methylation (as PRMT1) and chromatin structure (as Setd family) were increased in Trx–Tg T cells. Next, a comprehensive RNA analysis revealed that Trx transgenic T cells differentially expressed 1689 genes. Table 1 and Fig. S2 show the iPathway guide analysis (Advaita Bioinformatics) for key biological pathway and genes that were significantly different in Trx-overexpressing T cells. These data indicate that Trx overexpression renders unique metabolic phenotype to T cells, which in turn could also modify epigenetic pathway molecules and boost its antitumor potential.
Table 1.
List of biological pathways significantly altered in Trx-overexpressing T cells
| Biological pathways | p value |
|---|---|
| Cysteine and methionine metabolism | 0.000292547 |
| TNF-signaling pathway | 0.001535877 |
| Tight junction | 0.001581198 |
| Regulation of actin cytoskeleton | 0.002066769 |
| Leukocyte transendothelial migration | 0.002511068 |
| Chemical carcinogenesis | 0.002823408 |
| MicroRNAs in cancer | 0.004175701 |
| PI3K–Akt-signaling pathway | 0.008407723 |
| Sphingolipid-signaling pathway | 0.008425501 |
| Cytokine–cytokine receptor interaction | 0.031239851 |
| Chemokine-signaling pathway | 0.03186533 |
| Antigen processing and presentation | 0.033102383 |
| NF-κB–signaling pathway | 0.035012555 |
| MAPK-signaling pathway | 0.037652869 |
| T-cell receptor–signaling pathway | 0.04559592 |
| mTOR-signaling pathway | 0.046443821 |
| Alanine, aspartate, and glutamate metabolism | 0.046562088 |
Pmel–Trx T cells secrete Trx upon antigen stimulation, and recombinant Trx reprograms Pmel T cells ex vivo
To gain insight into the mechanism that may be responsible for the phenotypic differences observed between the antigen-activated gp100 epitope-reactive Pmel and Pmel–Trx T cells, we determined whether Pmel–Trx secreted Trx upon antigen restimulation that, in turn, affected the functional outcome. We observed that, as compared with Pmel T cells, Pmel–Trx T cells upon overnight activation with cognate antigen do secrete significantly high amounts (≥1000 pg/ml) of Trx in the culture supernatant (Fig. 6A). To determine how secreted Trx would have modulated the Pmel T cells, we used recombinant Trx during antigen-induced in vitro Pmel activation and compared the phenotype with untreated Pmel and Pmel–Trx T cells. We observed that T cells lose Trx with every cell division (Fig. 6B), as has been linked with cellular aging (26), and incorporating rTrx during T cell activation is nontoxic as it does not hamper the cell division (Fig. 6C) but leads to increased expression of Trx and iGSH (Fig. 6, D and E). It has also been shown recently that Trx1-mediated reduction of Cys-130 and Cys-174 is essential for AMPK function, and decreased Trx levels could lead to oxidation of Cys-130 and Cys-174 by inducing aggregation that prevents its activation and phosphorylation by AMPKs (27). Given the role of AMPK in T-cell memory, and in regulating T-cell metabolic adaptation for effector responses in vivo (28), we next compared AMPK levels between different T cells. Our data show that Pmel–Trx and rTrx-treated Pmel T cells exhibit increased pAMPK compared with activated Pmel T cells (Fig. 6F), and supports that maintaining high Trx levels on T cells is essential for “metabolic fitness” of T cells. Because cross-talk between AMPK and mTOR is known to regulate energy balance (29), we next determined whether rTrx would modulate phosphorylation of S6, a downstream molecule in the mTOR pathway. We observed that Trx concentration present during the activation of T cells inversely correlated to pS6 levels, as its expression decreased with increasing concentrations of rTrx (Fig. 6G). The ability of rTrx to down-regulate pS6 is intriguing, because another antioxidant intracellular GSH has been shown to increase mTOR activity recently (30). We also observed that although Trx and l-NAC treatment reduced pS6, GSH increased pS6 (Fig. S3A), along with a concomitant increase in Trx (Fig. S3B). Importantly, qPCR analysis for “stemness” genes showed up-regulation of the Lef1 and Tcf7 genes in Pmel T cells that were activated in the presence of recombinant Trx (Fig. 6H). Although it has been reported that regulatory T cells exhibit higher Trx levels (31), when using rTrx in an iTreg generation protocol, we did not observe any increase in the quantity or suppressive quality of the iTreg's generated (Fig. S3C). Additionally, compared with cognate antigen-activated Pmel T cells (light blue overlay), Pmel T cells cultured with recombinant Trx for 3 days (orange overlay) exhibit reduced cell death as measured by annexin V levels (Fig. 6I) and glucose uptake (similar to Pmel–Trx T cells in dark blue overlay) (Fig. 6J) upon TCR re-stimulation with cognate antigen (hgp100). Thus, these data indicate that restoring high Trx levels on immediate effector T cells could be important to render the memory phenotype with a unique differentiation program (as high AMPK and, low glucose uptake) (28).
Figure 6.

Exogenous Trx renders increased antioxidant capacity, altered signaling and improved antitumor property to T cells. A, 3-day–activated gp100 epitope-reactive splenic T cells from Pmel and Pmel–Trx mouse were re-stimulated overnight with cognate antigen, and supernatant was evaluated for secreted Trx by ELISA as per protocol. n = 3; **, p < 0.005. B, Pmel T cells were labeled with CFSE and stimulated with cognate antigen gp100 for 3 days. The expression of Trx was then determined using fluorochrome- conjugated antibody by gating on the cells in a different phase of division. C, CFSE-labeled Pmel T cells were stimulated with cognate antigen in the absence or presence of rTrx at various doses. D, Pmel T cells activated with cognate antigen in the presence of rTrx (5 μg/ml) were used at day 3 to determine the expression of Trx. Cells in D were also used for determining the following: iGSH (E) and pAMPK (F). G, Pmel T cells stimulated with cognate antigen in the absence or presence of rTrx at various doses were used to determine pS6 levels using fluorochrome-conjugated antibody. H, 3-day–activated Pmel and Pmel–Trx T cells were used to prepare RNA for determining stemness genes using qPCR. I, 3-day TCR-activated T cells were used for determining annexin V up-regulation after 4 h of TCR restimulation with cognate antigen hgp100 or noncognate ova peptide. J, cells in I were used for glucose uptake using 2NBDG. Numerical values in each plot represent mean fluorescence intensity. *, p < 0.05; **, p < 0.01. K, melanoma epitope gp100-reactive T cells obtained from Pmel TCR transgenic mouse were activated with cognate antigen either in the presence or absence of rTrx for 3 days before being adoptively transferred to the immunocompetent C57BL/6 recipient mice with 10-day subcutaneously established murine melanoma B16-F10. Tumor measurements from two different experiments where Pmel and Pmel + rTrx were transferred to a minimum of nine recipient mice were compiled for this presentation. ***, p value < 0.01 obtained at the last time point of the tumor measurement before the experiment was terminated. L, C57BL/6 mice (n = 3 mice/group) were inoculated (s.c.) with 0.25 × 10⁶ B16-F10 melanoma cells for 14 days, after which mice were adoptively transferred with 1 × 10⁶ 3-day gp100-activated Pmel T cells, Pmel cells treated with rTrx (10 μg/ml). After 12 days of T-cell transfer, lymphocytes were retrieved from the excised tumor and the indicated lymphoid organs. Upper panel shows FACS plot for TCR transgenic T cells determined by staining for Vβ13 expression. Lower panel shows cumulative data. Retrieved lymphocytes were stimulated overnight with αCD3 (2 μg/ml) and αCD28 antibody (5 μg/ml) before staining with fluorochrome-conjugated antibodies to determine the following: M, intracellular IFNγ level, and N, granzyme B (GzmB) level. n = 3. *, p < 0.05; **, p < 0.005.
Furthermore, we determined whether the strategy to activate and expand in the presence of rTrx ex vivo would render tumor epitope–reactive T cells with robust antitumor property. Our data show that gp100-reactive effector T cells generated in presence of rTrx do survive longer in vivo after adoptive transfer in a C57BL/6 host bearing subcutaneous B16–F10 murine melanoma and lead to much improved tumor control (Fig. 6K). Furthermore, a higher number of gp100 TCR Vβ13+ T cells were obtained from the tumors, draining lymph nodes, spleen, and blood of the mice where ACT was performed with Pmel + rTrx T cells, when compared to those which received Pmel T cells (Fig. 6L). Importantly, the increased numbers of Vβ13+ T cells tracked in the Pmel + rTrx group also showed a higher ability to secrete effector cytokine IFNγ upon restimulation (Fig. 6M and Fig. S3D) and to express enhanced levels of granzyme B (Fig. 6N and Fig. S3E). The frequency of Treg's from these sites was also not found to be any different between the two groups (Fig. S3F). These data show that rTrx cultured T cells could keep their functional phenotype in vivo, and similar strategies could be employed in a clinical scenario where TCR-transduced T cells or chimeric antigen receptor (CAR)-transduced patient T cells could be reprogrammed to improve their antitumor function.
Human T cells engineered to express Trx exhibit enhanced antioxidant levels and central memory phenotype
T cells from human patients are being used for adoptive immunotherapy approaches after engineering them with tumor-reactive TCR or CARs. To determine whether our strategy to increase the antioxidant property of T cells will render human T cells with an altered phenotype (as observed in mouse studies), we generated a human melanoma epitope tyrosinase-reactive TIL1383I retroviral construct with human Trx inserted into it. For this purpose, we synthesized the gene construct (at Genscript) with a Trx gene flanked by Bsp119i restriction sites and then cloned it into the original Samen/1383I-34t vector. The clones were screened for correct orientation (Fig. S4A). The retroviral supernatant was used to transduce the activated human T cells with either TIL1383I TCR or TIL1383I-TCR + Trx. Fig. S4B shows that the retroviral construct with Trx could be used to generate tyrosinase epitope–reactive T cells with transduction efficiency of 40% or more. Fig. S4C shows that the majority of the expanded cells exhibited the CD62L+CD44+CD45RA+ Tscm phenotype (14, 32). Importantly, engineering Trx on human T cells also resulted in reducing the glycolytic commitment as observed by lower glucose uptake in the 2NBDG assay (Fig. S4D). Furthermore, upon overnight TCR re-stimulation with cognate antigen, the TIL1383I-Trx–transduced T cells showed less cell death as indicated by higher mitochondrial membrane potential (Fig. S4E) and reduced NO accumulation (Fig. S4F). A qPCR-based analysis also showed that TIL1383I-Trx–transduced T cells express significantly higher levels of stemness genes as compared with the TIL1383I-TCR–transduced T cells (Fig. S4G, p < 0.005). These data establish that the antitumor effector T cells can be programmed ex vivo for increasing antioxidant phenotypes that could translate to better tumor control in vivo.
Discussion
It has long been known that lymphocytes require a reducing milieu for optimal activation/proliferation (33). It has been shown that T lymphocytes are defective in cystine uptake and require exogenous thiols for activation and function (33). As the functional group of the amino acid cysteine, the thiol (–SH) group plays a very important role in biology (34). Recently, oxidative cysteine modifications have emerged as a central mechanism for dynamic post-translational regulation of almost all major protein classes and correlate with many disease states (35). Certain proteins in which the redox state of cysteine residues are modified (termed “redox sensors”) seem to be involved in the initial and direct regulation of signaling molecules in response to ROS. Such redox sensors commonly possess highly-conserved free cysteine (Cys) residues of which the –SH functional groups are the most important direct cellular targets or “sensors” of ROS (36). A number of redox sensors have been identified that participate in many important biological functions, some of which are crucial molecules modulating stem cell self-renewal and differentiation, including HIF-1α, FoxOs, APE1/Ref-1, Nrf2, AMPK, p38, and p53 (37). In addition, glutamate (Glu) and anti-Trx–inactivating antibodies inhibit antigen-dependent T lymphocyte proliferation (33). In T lymphocytes, intracellular GSH is critical for the proliferative response to mitogens or antigens (38). However, lymphocytes lack an efficient system of Cys-2 import, although they easily take up free thiols (39). Therefore, to sustain lymphocyte activation and proliferation, exogenous thiols must somehow be generated in the microenvironment of an immune response. Extracellular Trx has been proposed to exert a synergistic activity on the mitogen- or cytokine-induced proliferation of lymphocytes (40). The importance of thioredoxin reductase in the last step of nucleotide biosynthesis has also been described recently, where it donates reducing equivalents to ribonucleotide reductase to overcome DNA damage response (41). We show here that increasing the Trx in the tumor microenvironment by using Trx-overexpressing T cells that secrete Trx or by using rTrx during ex vivo programming maintains the reducing environment and leads to long-term T-cell antitumor function in vivo.
Our data indicate the functional differences between the CD8+ T cells obtained from the Pmel and Pmel–Trx mice, likely due to the protein thiol alterations that remain unknown at this time. Oxidation of thiol (–SH) groups is a post-translational modification that regulates numerous processes, including differentiation, cellular proliferation, and apoptosis (35). We hypothesize that the “number of free reduced versus oxidized thiols present on signaling molecules could lead to differences in their functionality and thus dictate the effector T cells versus memory T-cell phenotype.” Our data show that the difference observed between the Pmel and Pmel–Trx T cells is exclusively due to Trx, because addition of rTrx also leads to a similar phenotype as observed when using T cells overexpressing Trx. We observed the reduction in mTOR when T cells were incubated with l-NAC, and in rTrx, while there was an increase in pS6 in the presence of GSH. Although the role of GSH in up-regulating mTOR has been shown recently (30), it is likely that increased c-SH due to rTrx and l-NAC resulted in lower pS6 levels that we reported earlier (5). An earlier study done using T cells from systemic lupus erythematosus patients also showed that T-cell dysfunction in patients was controlled by orally administering l-NAC that resulted in inhibition of mTOR (42). Given the role of oxidative stress signaling and use of the mTOR inhibitor rapamycin and other antioxidants to promote anti-aging (43), one would expect that Trx treatment should reduce mTOR activation, as observed by us. The growing evidence that Trx and GSH target different cysteines in the proteome could also support the existence of nonredundant functions observed by us (44).
The commitment to different metabolic pathways could lead to differences in the level of intrinsic metabolites in a cell, which could be important in regulating various signaling pathways (45). Our preliminary data quantifying the metabolite levels between TCR-activated Pmel versus Pmel–Trx T cells show a distinct profile in thioredoxin-overexpressing T cells. The activated Pmel–Trx cells exhibit increased levels of PPP metabolites that contribute to nucleotide precursors and help to regenerate the reducing agent NADPH, which can contribute to ROS scavenging. In addition, the TCA (also known as Krebs's cycle) metabolite α-KG was also found to be significantly elevated in the Pmel–Trx cells. The role of α-KG, also produced by deamination of glutamate, in the detoxification of ROS has only recently begun to be appreciated (46). This keto acid neutralizes ROS in an NADPH-independent manner with the concomitant formation of the succinate and CO2. In addition, α-KG has also been shown to extend the life span of adult Caenorhabditis elegans (21). This study showed that α-KG inhibits ATP synthase leading to reduced ATP content, decreased oxygen consumption, and depends on the target of rapamycin downstream. Furthermore, the role of metabolite α-KG has also been shown in maintaining the pluripotency of the embryonic stem cells (25). It has been shown that many chromatin-modifying enzymes, including Jumonji C domain-containing histone demethylases and Tet DNA demethylases, are sensitive to α-KG levels (25). This study also showed that embryonic stem cells cultured in glutamine-free media had high ratios of tri- to mono-methylation on H3K9, H3K27, H3K36, and H4K20, and the addition of α-KG reversed these changes (25). Thus, high levels of the small metabolite α-KG in cells promote naive pluripotency by suppressing the accumulation of repressive histone modifications and DNA methylation.
Furthermore, Trx-overexpressing T cells also showed differences in epigenetic modifiers as compared with normal T cells. The reduced expression of HDAC11 was observed in Trx–T cells, which has been recently shown to enhance the T-cell effector function and enhanced alloreactivity in a murine model (47). We also observed increased expression of the protein arginine N-methyltransferase (PRMT1), which is the main enzyme that mediates monomethylation and asymmetric dimethylation of histone H4 “Arg-4” (H4R3me1 and H4R3me2a, respectively), a specific tag for epigenetic transcriptional activation. Importantly, it has been shown to methylate Foxo1 and retain it in the nucleus leading to increased transcriptional activity (48). Similarly, we also observed an in increase in expression of the SET domain-containing proteins that play a vital role in regulating gene expression during development through modifications in chromatin structure (49). We observed that histone methyltransferase SETD1B, which specifically methylates “Lys-4” of histone H3, was elevated in the Trx–Tg T cells. Similarly, Setd5 expression was also increased in Trx–T cells. Setd5-deficient embryonic stem cells have impaired cellular proliferation, increased apoptosis, and defective cell cycle progression (50). Additionally, Setd7, histone methyltransferase that specifically monomethylates “Lys-4” of histone H3, was increased in Trx–T cells. This has also been shown to have methyltransferase activity toward nonhistone proteins such as p53/TP53 and TAF10 (51). Thus, it is likely that Trx-mediated differences in metabolic pathways that lead to difference in accumulation of metabolites (such as α-KG) may have led to epigenetic reprogramming of T cells resulting in sustained tumor control and memory generation.
The increased glutamine uptake due to enhanced expression of antiporter xCT in Pmel–Trx T cells or in the presence of rTrx could be an important feature that renders potent antitumor control, a mechanism that has been shown to promote tumor growth where ambient glutamine indirectly supports environmental cystine acquisition via the xCT antiporter (52). The observation that Trx-overexpressing T cells exhibit increased glutamine uptake also implies that this amino acid may have contributed toward the programming of Pmel–Trx effectors for the enhanced antitumor phenotype. It has also been shown that although glutamine helps differentiation of T cells to effector phenotypes (22), the deficiency of glutamine can result in the formation of Tregs (22). Importantly, higher glutamine levels in Pmel–Trx T cells would have led to down-regulation of CD95 and CD95L expression and up-regulation of memory marker CD45RO and Bcl-2 expression, as has been shown earlier (53). Thus, the results presented here in support of the role of Trx in regulating redox status of adoptively transferred T cells and that Trx-mediated “antioxidant help” in vivo may be important in generating long-lived antitumor memory T cells in the oxidative tumor microenvironment. We believe that the strategy to generate antitumor memory T cells using Trx will have great translational significance in the field of cancer immunotherapy.
Materials and methods
Mice
C57BL/6, B6-Thy1.1 (B6.PL-Thy1a/CyJ) and Pmel mice were obtained from The Jackson Laboratory (Bar Harbor, ME). Animals were maintained in pathogen-free facilities, and experimental procedures were approved by the Institutional Animal Care and Use Committees of the Medical University of South Carolina, Charleston.
Reagents and cell lines
Penicillin, streptomycin, glucose-free RPMI 1640 medium, and Iscove's modified Dulbecco's medium (IMDM) were purchased from Life Technologies, Inc. Fetal bovine serum was procured from Atlanta Biologicals, Atlanta, GA. hgp100(25–33) peptide (KVPRNQDWL) was purchased from GenScript (Piscataway, NJ). Recombinant IL2 (rIL2) was procured from NCI, Biological Resources Branch, National Institutes of Health. Fluorochrome-conjugated anti-mouse CD8 (53–6.7), CD71 (RI7217), CD25 (PC61), CD69 (H1.2F3), CD44 (IM7), CD62L (MEL-14), and Sca1 (D7), and anti-human CD8 (SK1), CD44 (IM7), CD62L (DREG-56), and CD28 (CD28.2) were purchased from Biolegend, San Diego, CA. Anti-mouse Vβ13 (MR12-3) was procured from BD Biosciences. Anti-human Vβ12 was from Thermo Fisher Scientific (Rockford, IL). Anti-mouse pS6 conjugated with Alexa Fluor 647, pAkt (Ser-473) conjugated with phycoerythrin and pFoxo1 (Ser-256) were purchased from Cell Signaling Technology (Danvers, MA). Anti-mouse CD3 (145-2C11), and CD28 (37.51) were purchased from BioXcell (West Lebanon, NH). B16-F10 melanoma (catalog no. CRL-6475) was obtained from ATCC (Manassas, VA). Peripheral blood mononuclear cells from healthy donors were obtained from a commercial vendor, Research Blood Components, LLC, after institutional approval by the Human Investigation Review Board.
Cell culture
Splenocytes from Pmel or Pmel–Trx mice were activated with using hgp100(25–33) peptide (KVPRNQDWL, 1 μg/ml) for 3 days. rIL2 (100 units/ml) was added during T-cell activation. In some cases, Pmel splenic T cells were activated with a cognate antigen in the presence of rTrx. Complete IMDM supplemented with 10% fetal calf serum, 4 mm l-glutamine, 100 units/ml penicillin, 100 μg/ml streptomycin, 5 μm β-mercaptoethanol was used for T-cell culture. Where indicated, purified CD4+ T cells were differentiated to induce regulatory T cells using the standard protocol, as published recently (8).
Adoptive T cell protocol
Mouse melanoma tumor (B16-F10) was maintained in vitro in complete IMDM. On day 9 following B16-F10 cell inoculation, the C57BL/6 recipient mice were injected intraperitoneally (i.p.) with cyclophosphamide (CTX) at 4 mg/mouse. After 24 h of CTX injection, tumor-bearing C57BL/6 mice were either kept untreated or adoptively transferred with 3-day–activated pMel cells (1 × 10⁶/mouse). Recipient mice were given IL2 (50,000 units/mouse; i.p.) for 3 consecutive days after ACT.
Flow cytometry
Detailed protocol for staining of cell-surface molecules and intracellular proteins has been described earlier (8). Samples were acquired on LSRFortessa and analyzed with FlowJo software (Tree Star, OR).
Real-time quantitative-PCR array
Total RNA was isolated from pellets of the indicated T-cell subsets (2 × 10⁶ cells) using TRIzol reagent (Life Technologies, Inc.). cDNA was generated from 1 μg of total RNA using iScript cDNA synthesis kit (Bio-Rad). SYBR Green incorporation of quantitative real-time PCR was performed using a SYBR Green mix (Bio-Rad) in the CFX96 Detection System (Bio-Rad). All array data have been deposited in the EBI ArrayExpress Database accession number E-MTAB-7571.
Activation-induced T-cell death
Three-day-activated T cells from either Pmel or Pmel–Trx mice were either left untreated or re-stimulated overnight with cognate antigen gp100. Apoptosis was measured by annexin V (BD Biosciences) versus 7-aminoactinomycin D staining according to the manufacturer's protocol, followed by flow cytometry. Data were analyzed with FlowJo software (Tree Star, OR).
Glucose uptake, oxygen consumption, and glycolytic flux
Glucose uptake by activated T cells were determined by incubating cells with 100 μm 2NBDG (Cayman Chemical, Ann Arbor, MI) for 30 min before measuring fluorescence by flow cytometry. ECAR was evaluated as described earlier (8).
Statistical analysis
All data reported are the arithmetic mean from three independent experiments performed in triplicate ± S.D. unless stated otherwise. The unpaired Student's t test was used to evaluate the significance of differences observed between groups, accepting p < 0.05 as a threshold of significance. Data analyses were performed using the Prism software (GraphPad, San Diego, CA). Analysis of tumor size (mm2) was performed using R statistical software version 3.2.3 and SAS version 9.4. Tumor size at each time point was measured relative to tumor size at the day of T-cell transfer (day 9) to adjust for differences between animals at baseline. We transformed resulting fold-change (FC) values using a log base 2 transformation to achieve approximate normality. Using maximum likelihood, we fit linear mixed effects regression models of log2 FC as a function of experimental group, time (as a continuous variable), group-by-time interaction, and mouse-specific random effects to account for the correlation among measures obtained from the same animal over time. We evaluated the functional form of time in each model, and considered nonlinear transformations as appropriate based on fractional polynomials (9). Group comparisons were performed using model-based linear contrasts and were restricted to time points at which data were available from at least two animals per group.
Author contributions
P. C. and S. M. conceptualization; P. C., S. C., P. K., K. T., S. I., A. D., and G. H. data curation; P. C., S. C., P. K., K. T., H. N., S. P. S., G. S., L. E. B., V. G., M. P. R., N. K.-D., E. G. H., B. O., X.-Z. Y., and M. I. N. formal analysis; P. C., S. C., P. K., K. T., S. I., H. N., S. P. S., P. N., G. S., G. H., M. P. R., N. K.-D., E. G. H., B. O., X.-Z. Y., M. I. N., and S. M. methodology; S. C., N. M., L. E. B., V. G., M. P. R., N. K.-D., B. O., X.-Z. Y., M. I. N., and S. M. resources; S. C., G. H., and S. M. writing-original draft; H. N., G. H., E. G. H., and S. M. validation; P. N., M. P. R., B. O., M. I. N., and S. M. investigation; N. M., L. E. B., V. G., M. P. R., N. K.-D., E. G. H., B. O., X.-Z. Y., M. I. N., and S. M. writing-review and editing; L. E. B., V. G., E. G. H., and X.-Z. Y. software; E. G. H., M. I. N., and S. M. supervision; B. O., M. I. N., and S. M. funding acquisition; S. M. project administration.
Supplementary Material
Acknowledgments
The Hollings Cancer Center Shared Resources was supported in part by National Institutes of Health Grant P30 CA138313. The Medical University of South Carolina was recipient of the South Carolina Clinical & Translational Research (SCTR) Institute Grant UL1TR001450, SC Center of Biomedical Research Excellence (COBRE) in Oxidants, Redox Balance, and Stress Signaling, and National Institutes of Health Grant 5P20GM103542.
This work was supported in part by funds from Department of Surgery and National Institutes of Health Grants R01CA138930, R21CA137725, R21CA198646 (to S. M.), P01CA203628 (to B. O.), and P01CA154778. The authors declare that they have no conflicts of interest with the contents of this article. The content is solely the responsibility of the authors and does not necessarily represent the official views of the National Institutes of Health.
This article contains Figs. S1–S4.
Array data have been deposited in the EBI ArrayExpress Database accession number E-MTAB-7571.
- ACT
- adoptive cell transfer
- c-SH
- cell-surface thiol
- TSH
- thioredoxin
- ROS
- reactive oxygen species
- 8-OHdG
- 8-hydroxyguanine
- TCR
- T-cell receptor
- IFN
- interferon
- 2NBDG
- 2-deoxy-2-[(7-nitro-2,1,3-benzoxadiazol-4-yl)amino]-d-glucose
- Tg
- transgenic
- DCFDA
- 2′,7′-dichlorodihydrofluorescein diacetate
- Tcm
- T-cell central memory
- Tscm
- T-cell stem cell memory
- mTOR
- mechanistic target of rapamycin
- CFSE
- carboxyfluorescein succinimidyl ester
- MFI
- mean fluorescence intensity
- OCR
- oxygen consumption rate
- SRC
- spare respiratory capacity
- FC
- fold-change
- IMDM
- Iscove's modified Dulbecco's medium
- ECAR
- extracellular acidification rate
- CAR
- chimeric antigen receptor
- Trx
- thioredoxin
- rTrx
- recombinant Trx
- TCA
- tricarboxylic acid cycle
- qPCR
- quantitative PCR
- α-KG
- α-ketoglutarate
- SP
- single-positive
- AMPK
- AMP-activated protein kinase
- iGSH
- intracellular GSH
- PPP
- pentose phosphate pathway
- CTX
- cyclophosphamide.
References
- 1. Rosenberg S. A., and Restifo N. P. (2015) Adoptive cell transfer as personalized immunotherapy for human cancer. Science 348, 62–68 10.1126/science.aaa4967 [DOI] [PMC free article] [PubMed] [Google Scholar]
- 2. Kishton R. J., Sukumar M., and Restifo N. P. (2017) Metabolic regulation of T cell longevity and function in tumor immunotherapy. Cell Metab. 26, 94–109 10.1016/j.cmet.2017.06.016 [DOI] [PMC free article] [PubMed] [Google Scholar]
- 3. Schieber M., and Chandel N. S. (2014) ROS function in redox signaling and oxidative stress. Curr. Biol. 24, R453–R462 10.1016/j.cub.2014.03.034 [DOI] [PMC free article] [PubMed] [Google Scholar]
- 4. Mehrotra S., Mougiakakos D., Johansson C. C., Voelkel-Johnson C., and Kiessling R. (2009) Oxidative stress and lymphocyte persistence: implications in immunotherapy. Adv. Cancer Res. 102, 197–227 10.1016/S0065-230X(09)02006-5 [DOI] [PubMed] [Google Scholar]
- 5. Kesarwani P., Al-Khami A. A., Scurti G., Thyagarajan K., Kaur N., Husain S., Fang Q., Naga O. S., Simms P., Beeson G., Voelkel-Johnson C., Garrett-Mayer E., Beeson C. C., Nishimura M. I., and Mehrotra S. (2014) Promoting thiol expression increases the durability of antitumor T-cell functions. Cancer Res. 74, 6036–6047 10.1158/0008-5472.CAN-14-1084 [DOI] [PMC free article] [PubMed] [Google Scholar]
- 6. Norell H., Martins da Palma T., Lesher A., Kaur N., Mehrotra M., Naga O. S., Spivey N., Olafimihan S., Chakraborty N. G., Voelkel-Johnson C., Nishimura M. I., Mukherji B., and Mehrotra S. (2009) Inhibition of superoxide generation upon T-cell receptor engagement rescues Mart-1(27–35)-reactive T cells from activation-induced cell death. Cancer Res. 69, 6282–6289 10.1158/0008-5472.CAN-09-1176 [DOI] [PMC free article] [PubMed] [Google Scholar]
- 7. Berndt C., Lillig C. H., and Holmgren A. (2007) Thiol-based mechanisms of the thioredoxin and glutaredoxin systems: implications for diseases in the cardiovascular system. Am. J. Physiol. Heart Circ. Physiol. 292, H1227–H1236 10.1152/ajpheart.01162.2006 [DOI] [PubMed] [Google Scholar]
- 8. Chatterjee S., Daenthanasanmak A., Chakraborty P., Wyatt M. W., Dhar P., Selvam S. P., Fu J., Zhang J., Nguyen H., Kang I., Toth K., Al-Homrani M., Husain M., Beeson G., Ball L., et al. (2018) CD38-NAD(+)axis regulates immunotherapeutic antitumor T cell response. Cell Metab. 27, 85–100.e8 10.1016/j.cmet.2017.10.006 [DOI] [PMC free article] [PubMed] [Google Scholar]
- 9. Royston P., and Sauerbrei W. (2004) A new measure of prognostic separation in survival data. Stat. Med. 23, 723–748 10.1002/sim.1621 [DOI] [PubMed] [Google Scholar]
- 10. Mailloux R. J., Jin X., and Willmore W. G. (2014) Redox regulation of mitochondrial function with emphasis on cysteine oxidation reactions. Redox Biol. 2, 123–139 10.1016/j.redox.2013.12.011 [DOI] [PMC free article] [PubMed] [Google Scholar]
- 11. Adluri R. S., Thirunavukkarasu M., Zhan L., Akita Y., Samuel S. M., Otani H., Ho Y. S., Maulik G., and Maulik N. (2011) Thioredoxin 1 enhances neovascularization and reduces ventricular remodeling during chronic myocardial infarction: a study using thioredoxin 1 transgenic mice. J. Mol. Cell. Cardiol. 50, 239–247 10.1016/j.yjmcc.2010.11.002 [DOI] [PMC free article] [PubMed] [Google Scholar]
- 12. Kesarwani P., Chakraborty P., Gudi R., Chatterjee S., Scurti G., Toth K., Simms P., Husain M., Armeson K., Husain S., Garrett-Mayer E., Vasu C., Nishimura M. I., and Mehrotra S. (2016) Blocking TCR restimulation induced necroptosis in adoptively transferred T cells improves tumor control. Oncotarget 7, 69371–69383 10.18632/oncotarget.12674 [DOI] [PMC free article] [PubMed] [Google Scholar]
- 13. Darwish R. S., Amiridze N., and Aarabi B. (2007) Nitrotyrosine as an oxidative stress marker: evidence for involvement in neurologic outcome in human traumatic brain injury. J. Trauma 63, 439–442 10.1097/TA.0b013e318069178a [DOI] [PubMed] [Google Scholar]
- 14. Graef P., Buchholz V. R., Stemberger C., Flossdorf M., Henkel L., Schiemann M., Drexler I., Höfer T., Riddell S. R., and Busch D. H. (2014) Serial transfer of single-cell–derived immunocompetence reveals stemness of CD8(+) central memory T cells. Immunity 41, 116–126 10.1016/j.immuni.2014.05.018 [DOI] [PubMed] [Google Scholar]
- 15. Gattinoni L., Zhong X. S., Palmer D. C., Ji Y., Hinrichs C. S., Yu Z., Wrzesinski C., Boni A., Cassard L., Garvin L. M., Paulos C. M., Muranski P., and Restifo N. P. (2009) Wnt signaling arrests effector T cell differentiation and generates CD8+ memory stem cells. Nat. Med. 15, 808–813 10.1038/nm.1982 [DOI] [PMC free article] [PubMed] [Google Scholar]
- 16. Tripathi P., Kurtulus S., Wojciechowski S., Sholl A., Hoebe K., Morris S. C., Finkelman F. D., Grimes H. L., and Hildeman D. A. (2010) STAT5 is critical to maintain effector CD8+ T cell responses. J. Immunol. 185, 2116–2124 10.4049/jimmunol.1000842 [DOI] [PMC free article] [PubMed] [Google Scholar]
- 17. Cham C. M., and Gajewski T. F. (2005) Glucose availability regulates IFN-γ production and p70S6 kinase activation in CD8+ effector T cells. J. Immunol. 174, 4670–4677 10.4049/jimmunol.174.8.4670 [DOI] [PubMed] [Google Scholar]
- 18. van der Windt G. J., Everts B., Chang C. H., Curtis J. D., Freitas T. C., Amiel E., Pearce E. J., and Pearce E. L. (2012) Mitochondrial respiratory capacity is a critical regulator of CD8+ T cell memory development. Immunity 36, 68–78 10.1016/j.immuni.2011.12.007 [DOI] [PMC free article] [PubMed] [Google Scholar]
- 19. Sukumar M., Liu J., Ji Y., Subramanian M., Crompton J. G., Yu Z., Roychoudhuri R., Palmer D. C., Muranski P., Karoly E. D., Mohney R. P., Klebanoff C. A., Lal A., Finkel T., Restifo N. P., and Gattinoni L. (2013) Inhibiting glycolytic metabolism enhances CD8+ T cell memory and antitumor function. J. Clin. Invest. 123, 4479–4488 10.1172/JCI69589 [DOI] [PMC free article] [PubMed] [Google Scholar]
- 20. Edwards C., Canfield J., Copes N., Brito A., Rehan M., Lipps D., Brunquell J., Westerheide S. D., and Bradshaw P. C. (2015) Mechanisms of amino acid-mediated lifespan extension in Caenorhabditis elegans. BMC Genet. 16, 8 10.1186/s12863-015-0167-2 [DOI] [PMC free article] [PubMed] [Google Scholar]
- 21. Chin R. M., Fu X., Pai M. Y., Vergnes L., Hwang H., Deng G., Diep S., Lomenick B., Meli V. S., Monsalve G. C., Hu E., Whelan S. A., Wang J. X., Jung G., Solis G. M., et al., (2014) The metabolite α-ketoglutarate extends lifespan by inhibiting ATP synthase and TOR. Nature 510, 397–401 10.1038/nature13264 [DOI] [PMC free article] [PubMed] [Google Scholar]
- 22. Klysz D., Tai X., Robert P. A., Craveiro M., Cretenet G., Oburoglu L., Mongellaz C., Floess S., Fritz V., Matias M. I., Yong C., Surh N., Marie J. C., Huehn J., Zimmermann V., et al. (2015) Glutamine-dependent α-ketoglutarate production regulates the balance between T helper 1 cell and regulatory T cell generation. Sci. Signal. 8, ra97 10.1126/scisignal.aab2610 [DOI] [PubMed] [Google Scholar]
- 23. Cha Y. J., Kim E. S., and Koo J. S. (2018) Amino acid transporters and glutamine metabolism in breast cancer. Int. J. Mol. Sci. 19, E907 10.3390/ijms19030907 [DOI] [PMC free article] [PubMed] [Google Scholar]
- 24. Spanaki C., and Plaitakis A. (2012) The role of glutamate dehydrogenase in mammalian ammonia metabolism. Neurotox. Res. 21, 117–127 10.1007/s12640-011-9285-4 [DOI] [PubMed] [Google Scholar]
- 25. Carey B. W., Finley L. W., Cross J. R., Allis C. D., and Thompson C. B. (2015) Intracellular α-ketoglutarate maintains the pluripotency of embryonic stem cells. Nature 518, 413–416 10.1038/nature13981 [DOI] [PMC free article] [PubMed] [Google Scholar]
- 26. Yoshida T., Oka S., Masutani H., Nakamura H., and Yodoi J. (2003) The role of thioredoxin in the aging process: involvement of oxidative stress. Antioxid. Redox Signal. 5, 563–570 10.1089/152308603770310211 [DOI] [PubMed] [Google Scholar]
- 27. Shao D., Oka S., Liu T., Zhai P., Ago T., Sciarretta S., Li H., and Sadoshima J. (2014) A redox-dependent mechanism for regulation of AMPK activation by thioredoxin1 during energy starvation. Cell Metab. 19, 232–245 10.1016/j.cmet.2013.12.013 [DOI] [PMC free article] [PubMed] [Google Scholar]
- 28. Blagih J., Coulombe F., Vincent E. E., Dupuy F., Galicia-Vázquez G., Yurchenko E., Raissi T. C., van der Windt G. J., Viollet B., Pearce E. L., Pelletier J., Piccirillo C. A., Krawczyk C. M., Divangahi M., and Jones R. G. (2015) The energy sensor AMPK regulates T cell metabolic adaptation and effector responses in vivo. Immunity 42, 41–54 10.1016/j.immuni.2014.12.030 [DOI] [PubMed] [Google Scholar]
- 29. Xu J., Ji J., and Yan X. H. (2012) Cross-talk between AMPK and mTOR in regulating energy balance. Crit. Rev. Food Sci. Nutr. 52, 373–381 10.1080/10408398.2010.500245 [DOI] [PubMed] [Google Scholar]
- 30. Mak T. W., Grusdat M., Duncan G. S., Dostert C., Nonnenmacher Y., Cox M., Binsfeld C., Hao Z., Brüstle A., Itsumi M., Jäger C., Chen Y., Pinkenburg O., Camara B., Ollert M., et al. (2017) Glutathione primes T cell metabolism for inflammation. Immunity 46, 1089–1090 10.1016/j.immuni.2017.06.009 [DOI] [PubMed] [Google Scholar]
- 31. Mougiakakos D., Johansson C. C., Jitschin R., Böttcher M., and Kiessling R. (2011) Increased thioredoxin-1 production in human naturally occurring regulatory T cells confers enhanced tolerance to oxidative stress. Blood 117, 857–861 10.1182/blood-2010-09-307041 [DOI] [PubMed] [Google Scholar]
- 32. Gattinoni L., Lugli E., Ji Y., Pos Z., Paulos C. M., Quigley M. F., Almeida J. R., Gostick E., Yu Z., Carpenito C., Wang E., Douek D. C., Price D. A., June C. H., Marincola F. M., et al. (2011) A human memory T cell subset with stem cell-like properties. Nat. Med. 17, 1290–1297 10.1038/nm.2446 [DOI] [PMC free article] [PubMed] [Google Scholar]
- 33. Angelini G., Gardella S., Ardy M., Ciriolo M. R., Filomeni G., Di Trapani G., Clarke F., Sitia R., and Rubartelli A. (2002) Antigen-presenting dendritic cells provide the reducing extracellular microenvironment required for T lymphocyte activation. Proc. Natl. Acad. Sci. U.S.A. 99, 1491–1496 10.1073/pnas.022630299 [DOI] [PMC free article] [PubMed] [Google Scholar]
- 34. Haugaard N. (2000) Reflections on the role of the thiol group in biology. Ann. N.Y. Acad. Sci. 899, 148–158 [DOI] [PubMed] [Google Scholar]
- 35. Leonard S. E., and Carroll K. S. (2011) Chemical 'omics' approaches for understanding protein cysteine oxidation in biology. Curr. Opin. Chem. Biol. 15, 88–102 10.1016/j.cbpa.2010.11.012 [DOI] [PubMed] [Google Scholar]
- 36. Janssen-Heininger Y. M., Mossman B. T., Heintz N. H., Forman H. J., Kalyanaraman B., Finkel T., Stamler J. S., Rhee S. G., and van der Vliet A. (2008) Redox-based regulation of signal transduction: principles, pitfalls, and promises. Free Radic. Biol. Med. 45, 1–17 10.1016/j.freeradbiomed.2008.03.011 [DOI] [PMC free article] [PubMed] [Google Scholar]
- 37. Wang K., Zhang T., Dong Q., Nice E. C., Huang C., and Wei Y. (2013) Redox homeostasis: the linchpin in stem cell self-renewal and differentiation. Cell Death Dis. 4, e537 10.1038/cddis.2013.50 [DOI] [PMC free article] [PubMed] [Google Scholar]
- 38. Smyth M. J. (1991) Glutathione modulates activation-dependent proliferation of human peripheral blood lymphocyte populations without regulating their activated function. J. Immunol. 146, 1921–1927 [PubMed] [Google Scholar]
- 39. Ishii T., Sugita Y., and Bannai S. (1987) Regulation of glutathione levels in mouse spleen lymphocytes by transport of cysteine. J. Cell. Physiol. 133, 330–336 10.1002/jcp.1041330217 [DOI] [PubMed] [Google Scholar]
- 40. Wakasugi N., Tagaya Y., Wakasugi H., Mitsui A., Maeda M., Yodoi J., and Tursz T. (1990) Adult T-cell leukemia-derived factor/thioredoxin, produced by both human T-lymphotropic virus type I- and Epstein-Barr virus-transformed lymphocytes, acts as an autocrine growth factor and synergizes with interleukin 1 and interleukin 2. Proc. Natl. Acad. Sci. U.S.A. 87, 8282–8286 10.1073/pnas.87.21.8282 [DOI] [PMC free article] [PubMed] [Google Scholar]
- 41. Muri J., Heer S., Matsushita M., Pohlmeier L., Tortola L., Fuhrer T., Conrad M., Zamboni N., Kisielow J., and Kopf M. (2018) The thioredoxin-1 system is essential for fueling DNA synthesis during T-cell metabolic reprogramming and proliferation. Nat. Commun. 9, 1851 10.1038/s41467-018-04274-w [DOI] [PMC free article] [PubMed] [Google Scholar]
- 42. Lai Z. W., Hanczko R., Bonilla E., Caza T. N., Clair B., Bartos A., Miklossy G., Jimah J., Doherty E., Tily H., Francis L., Garcia R., Dawood M., Yu J., Ramos I., et al. (2012) N-Acetylcysteine reduces disease activity by blocking mammalian target of rapamycin in T cells from systemic lupus erythematosus patients: a randomized, double-blind, placebo-controlled trial. Arthritis Rheum. 64, 2937–2946 10.1002/art.34502 [DOI] [PMC free article] [PubMed] [Google Scholar]
- 43. Blagosklonny M. V. (2008) Aging: ROS or TOR. Cell Cycle 7, 3344–3354 10.4161/cc.7.21.6965 [DOI] [PubMed] [Google Scholar]
- 44. Go Y. M., Roede J. R., Walker D. I., Duong D. M., Seyfried N. T., Orr M., Liang Y., Pennell K. D., and Jones D. P. (2013) Selective targeting of the cysteine proteome by thioredoxin and glutathione redox systems. Mol. Cell. Proteomics 12, 3285–3296 10.1074/mcp.M113.030437 [DOI] [PMC free article] [PubMed] [Google Scholar]
- 45. Metallo C. M., and Vander Heiden M. G. (2010) Metabolism strikes back: metabolic flux regulates cell signaling. Genes Dev. 24, 2717–2722 10.1101/gad.2010510 [DOI] [PMC free article] [PubMed] [Google Scholar]
- 46. Lemire J., Milandu Y., Auger C., Bignucolo A., Appanna V. P., and Appanna V. D. (2010) Histidine is a source of the antioxidant, α-ketoglutarate, in Pseudomonas fluorescens challenged by oxidative stress. FEMS Microbiol. Lett. 309, 170–177 [DOI] [PubMed] [Google Scholar]
- 47. Woods D. M., Woan K. V., Cheng F., Sodré A. L., Wang D., Wu Y., Wang Z., Chen J., Powers J., Pinilla-Ibarz J., Yu Y., Zhang Y., Wu X., Zheng X., Weber J., et al. (2017) T cells lacking HDAC11 have increased effector functions and mediate enhanced alloreactivity in a murine model. Blood 130, 146–155 10.1182/blood-2016-08-731505 [DOI] [PMC free article] [PubMed] [Google Scholar]
- 48. Yamagata K., Daitoku H., Takahashi Y., Namiki K., Hisatake K., Kako K., Mukai H., Kasuya Y., and Fukamizu A. (2008) Arginine methylation of FOXO transcription factors inhibits their phosphorylation by Akt. Mol. Cell 32, 221–231 10.1016/j.molcel.2008.09.013 [DOI] [PubMed] [Google Scholar]
- 49. Dillon S. C., Zhang X., Trievel R. C., and Cheng X. (2005) The SET-domain protein superfamily: protein lysine methyltransferases. Genome Biol. 6, 227 10.1186/gb-2005-6-8-227 [DOI] [PMC free article] [PubMed] [Google Scholar]
- 50. Osipovich A. B., Gangula R., Vianna P. G., and Magnuson M. A. (2016) Setd5 is essential for mammalian development and the co-transcriptional regulation of histone acetylation. Development 143, 4595–4607 10.1242/dev.141465 [DOI] [PMC free article] [PubMed] [Google Scholar]
- 51. Huang J., Perez-Burgos L., Placek B. J., Sengupta R., Richter M., Dorsey J. A., Kubicek S., Opravil S., Jenuwein T., and Berger S. L. (2006) Repression of p53 activity by Smyd2-mediated methylation. Nature 444, 629–632 10.1038/nature05287 [DOI] [PubMed] [Google Scholar]
- 52. Timmerman L. A., Holton T., Yuneva M., Louie R. J., Padró M., Daemen A., Hu M., Chan D. A., Ethier S. P., van 't Veer L. J., Polyak K., McCormick F., and Gray J. W. (2013) Glutamine sensitivity analysis identifies the xCT antiporter as a common triple-negative breast tumor therapeutic target. Cancer Cell 24, 450–465 10.1016/j.ccr.2013.08.020 [DOI] [PMC free article] [PubMed] [Google Scholar]
- 53. Chang W. K., Yang K. D., Chuang H., Jan J. T., and Shaio M. F. (2002) Glutamine protects activated human T cells from apoptosis by up-regulating glutathione and Bcl-2 levels. Clin. Immunol. 104, 151–160 10.1006/clim.2002.5257 [DOI] [PubMed] [Google Scholar]
Associated Data
This section collects any data citations, data availability statements, or supplementary materials included in this article.