

Abstract
Long noncoding RNAs (lncRNAs) are critical regulators of gene transcription. Our previous results have demonstrated that iron deficiency accelerates intervertebral disc degeneration (IDD) by affecting the stability of the DNA polymerase epsilon (Polε) complex. Here, we discovered that the novel lncRNA lncPolE functions as a negative regulator of Polε. The expression of lncPolE in IDD tissues was upregulated compared to its expression in healthy control tissues, and this was in contrast to the PolE1 expression levels. The increased lncPolE level was significantly correlated with the severity of IDD. Ectopic expression of lncPolE in human nucleus pulposus cells (hNPCs) was able to decrease PolE1 levels and cause apoptosis, while the specific knockdown of lncPolE in primary NP cells (pNPCs) from IDD patients can restore PolE1 levels. Interestingly, iron depletion or supplementation can affect the expression of lncPolE. Further analyses indicated that the downregulation of DNA methylation in the promoter region of lncPolE caused its overexpression. Collectively, our results suggest that the aberrant expression of lncPolE contributes to the pathogenesis of IDD by negatively regulating PolE1 in iron deficient conditions, and this may provide a new avenue to alleviate IDD progression in clinical treatment.
Keywords: IDD, lncRNA, PolE, lncPolE, apoptosis, iron deficiency
Introduction
The vast majority of people encounter low back pain (LBP) with age, which causes severe economic and social burdens [1,2]. Intervertebral disc degeneration (IDD), a multifactorial disease caused by genetic and environmental factors (e.g., inflammation and apoptosis), is known as a significant cause of LBP [3,4]. Intervertebral discs (IVDs) consist of the following three parts: cartilage endplates, annulus fibrosus (AF) and nucleus pulposus (NP) from the outside to the inside of the disc [5,6]. The outer endplates serve as the interface between rigid vertebral bodies and pliant intervertebral disks, and they can absorb the small molecules and nutrients required for NP and AF cells [5,6]. The middle AF is the tough circular exterior of the IVD that surrounds the soft inner NP [5,6]. Human clinical trial and animal model studies have documented that many signaling pathways are involved in the process of IDD. For instance, the Notch pathway is activated by hypoxia in AF cells [7], and the treatment of tumor necrosis factor alpha (TNF-α) or interleukin 1 beta (IL-1β) in NP cells can induce the expression of Notch-1 and Notch-2, two Notch receptors [8,9]. The transcription factor nuclear factor kappa β (NF-κB) and mitogen-activated protein kinase (MAPK) pathways can mediate the inflammation process by regulating pro-inflammatory mediators, such as TNF-α, IL-1β, and IL-6 [10,11]. The apoptotic pathway is also involved in IDD by regulating the levels of Bcl-2, caspase-3, collagen and aggrecan (ACAN) in NP cells [12-14].
Emerging studies have demonstrated that long noncoding RNAs (lncRNAs), an important class of the noncoding RNA family that are longer than 200 nt, play critical roles in the pathogenesis of many diseases (e.g., cancers, cardiovascular disease and neurodegenerative disorders) by affecting diverse biological processes, such as cell differentiation, cell cycle progression and apoptosis [15-18]. Recently, a few studies have also focused on revealing lncRNA profiles in the process of IDD [19,20]. Some of them have demonstrated how these lncRNAs contribute to IDD [19-22]. For instance, Linc-ADAMTS5, a long intergenic noncoding RNA, cooperates with Ras-responsive element-binding protein 1 (RREB1) to contribute to IDD pathogenesis by inhibiting the expression of ADAMTS5 (a disintegrin and metalloproteinase with thrombospondin motif-5) in NP cells [21]. The lncRNA NEAT1 plays a role in the occurrence and development of IDD by regulating the levels of MMP13 (matrix metallopeptidase 13) and ADAMTS5, as well as affecting the extracellular-signal-regulated kinase (ERK)/MAPK signaling pathway in degenerative NP cells [22]. These findings revealed the significance of studying the roles of IDD-associated lncRNAs, which may enhance our understanding of the molecular basis of IDD initiation and progression. In addition, current evidence has indicated that aberrant histone acetylation or DNA methylation in the promoter region of lncRNAs can result in the differential expression of lncRNAs [23-25].
Our most recent study showed that iron deficiency causes the downregulation of DNA polymerase epsilon (Polε), which activates apoptotic pathways and eventually leads to the occurrence of IDD [26]. The mammalian Polε complex is composed of the four following subunits: PolE1 (catalytic subunit), PolE2, PolE3, and PolE4 [26,27]. Our results have shown that PolE1 is regulated at the transcriptional level under low iron conditions [27]. Thus, we next sought to determine whether lncRNAs were involved in the regulation of this process. For this purpose, we performed a lncRNA-specific microarray and found that lncPolE can negatively regulate the expression of PolE1. Here, we revealed the role of lncPolE in the regulation of PolE1 expression, and we also investigated the underlying mechanism of lncPolE upregulation in IDD patients.
Materials and methods
Clinical samples from IDD patients
The blood samples were collected from 24 healthy volunteers and 120 IDD patients who underwent surgery and therapy from 2014 to 2016 at the Department of Orthopedics at the First Affiliated Hospital of Kunming Medical University, Kunming, Yunnan, China. These 120 IDD patients were divided into five groups according to their Pfirrmann grades (from 1 to 5, n=24 in each group). In addition, degenerative tissue samples from five IDD patients (one sample from each Pfirrmann grade) were collected. All of these samples were collected according to protocols that were approved by the ethical board of Kunming Medical University. The basic information (average age and their Pfirrmann grades) of the IDD patients is shown in Table S1.
Cell culture and transfection
Human NP cells (hNPCs) were obtained from ScienCell Research Laboratories (Cat. #4800) and were grown with the previous method [26]. Cell transfection was performed as previously described [26]. Briefly, lncPolE-specific siRNA (TGTGGGTTCCAGTGTGTCCTGTGAT) or pCDNA3-lncPolE was transfected into hNPCs using Lipofectamine 2000 (Invitrogen, USA, Cat. #11668027). After incubation at 37°C for 48 hr, the transfected cells were used in the required experiments.
Isolation of the primary nucleus pulposus cells (pNPCs)
The primary pNPCs were isolated as described previously [28]. Briefly, the separated NP tissues were washed with Dulbecco’s Modified Eagle Medium (DMEM) (Thermo Fisher Scientific, USA, Cat. #11965-084) supplemented with 100 μg/mL kanamycin (Thermo Fisher Scientific, Cat. #11815-024) and 100 μg/mL gentamycin (Thermo Fisher Scientific, Cat. #15750-078). The tissues were then cut into 1-2 mm pieces, followed by an incubation in DMEM/F12 medium (Thermo Fisher Scientific, Cat. #10565042) supplemented with 10% fetal bovine serum (FBS) (Thermo Fisher Scientific, Cat. #10437028) in a 25-cm2 flask. The culture medium was changed twice per week. After 3-4 weeks, the attached cells were collected and subjected to the required experiments.
RNA isolation and quantitative RT-PCR (qRT-PCR) analysis
The total RNA from the tissues and cultured cells was extracted using the TRIzolTM kit (Thermo Fisher Scientific, Cat. #15596026). The first-strand cDNA of each sample was generated using a High-Capacity cDNA Reverse Transcription Kit (Thermo Fisher Scientific, Cat. #4368814) following the manufacturer’s instructions. After a dilution of 10-fold, the cDNA was subjected to qRT-PCR analysis with the previously used primers. The 2-ΔΔCt method was used to determine the fold change of individual gene expression.
Microarray analysis
The microarray analysis was carried out as described previously [29]. Briefly, 0.5 μg total RNA from one healthy control and from five IDD patients with different Pfirrmann grades (from 1 to 5, one patient per grade) was used to synthesize cDNA using a GeneChip 3’ In Vitro Transcription (IVT) Express Kit (Thermo Fisher Scientific, Cat. #902789). Following this, the cDNA was fragmented and hybridized with a Human LncRNA Expression Array V4.0 (Arraystar Inc. USA, Cat. #AS-LNC-H-V4.0), which contained 40,173 human lncRNA probes. After hybridization, the chip was washed and scanned with a GeneChipTM Scanner 3000 7G system (Thermo Fisher Scientific, Cat. #000213).
Western blot analysis
The protein levels were determined by western blotting as described previously [30]. Briefly, equal amounts of cell lysates were subjected to electrophoresis, followed by transferring the proteins to a nitrocellulose membrane (Thermo Fisher Scientific, Cat. #LC2009) and probing them with the primary antibodies as described previously [30]. After incubation with peroxidase-labeled secondary antibodies, the enhanced chemiluminescence (ECL) signals were recorded using a ChemiDoc MP (Bio-Rad, USA, Cat. #17001402).
Flow cytometry analysis
Flow cytometry assays were performed as described previously [26]. In brief, a total of 104 cells that were grown in culture dishes were resuspended in 100 μL of binding buffer. Then, the cells were stained with a PE Annexin V Apoptosis Detection Kit (BD Biosciences, USA, Cat. #559763). After an incubation at 23°C for 20 min, the cells were used for flow cytometry assays with a FACScan machine (BD Biosciences, USA).
Quantitative methylation-specific PCR (qMSP)
The qMSP was performed as described previously [31]. Briefly, the genomic DNA was isolated with a Genomic DNA Purification Kit (Thermo Fisher Scientific, Cat. #K182104A) according to the manufacturer’s methods. For each sample, 0.8 µg of genomic DNA was treated with sodium bisulfite using the EZ DNA Methylation-GOLD Kit (ZYMO Research, USA, Cat. #D5008) following the manufacturer’s instructions. The resulting genomic DNA was subjected to PCR analysis with the primers listed in Table S2.
Statistical analysis
All experiments in the current study were repeated three times independently. The statistical analyses of the experimental data were performed using a two-tailed Student’s t-test. The significance was set at P < 0.05, and the data are represented as the mean ± standard deviation (SD).
Results
Identification of differentially expressed lncRNA profiles in IDD patients
Our previous results have shown that PolE1 and its interacting proteins, including PolE2, -3 and -4, were markedly decreased in severe IDD patients [26]. To identify if lncRNAs are involved in the regulation of these PolEs, we randomly selected one degenerative sample from each Pfirrmann grade (1-5) and used one nondegenerative IVD tissue from a patient who had been in a car accident and needed surgery to repair his IVD as a control. After RNA extraction, we subjected these 6 samples to a microarray analysis. Out of a collection of 40,173 lncRNA probes, we found that the expression of a total of 146 lncRNAs was consistently increased or decreased in different IDD patients. Of those, 61 lncRNAs were upregulated, while the other 85 lncRNAs were downregulated (Table S3). As shown in the heat map, we indicated the top 15 upregulated and top 15 downregulated lncRNAs (Figure 1A). In the upregulated group, ENST00000544414.1 showed the greatest increase (nearly 33.5-fold) in the Pfirrmann grade 5 patient. In the downregulated group, ENST00000415358.1 demonstrated the greatest decrease (nearly 55.4-fold) in the Pfirrmann grade 5 patient. To verify the accuracy of the microarray results, we selected 6 lncRNAs to quantify their expression by qRT-PCR using the same RNA samples in the microarray analysis. Of these lncRNAs, three, including ENST00000415358.1, ENST00000530313.1 and ENST00000485805.1, were from the downregulated group, and the other three, including ENST00000544414.1, ENST00000540987.1 and ENST00000527514.1, were from the upregulated group. Consistent with the microarray results, the expression levels of ENST00000415358.1, ENST00000530313.1 and ENST00000485805.1 gradually decreased with the increasing severity of IDD patients (Figure 1B-D), whereas the levels of ENST00000544414.1, ENST00000540987.1 and ENST00000527514.1 were reversed (Figure 1E-G).
Figure 1.
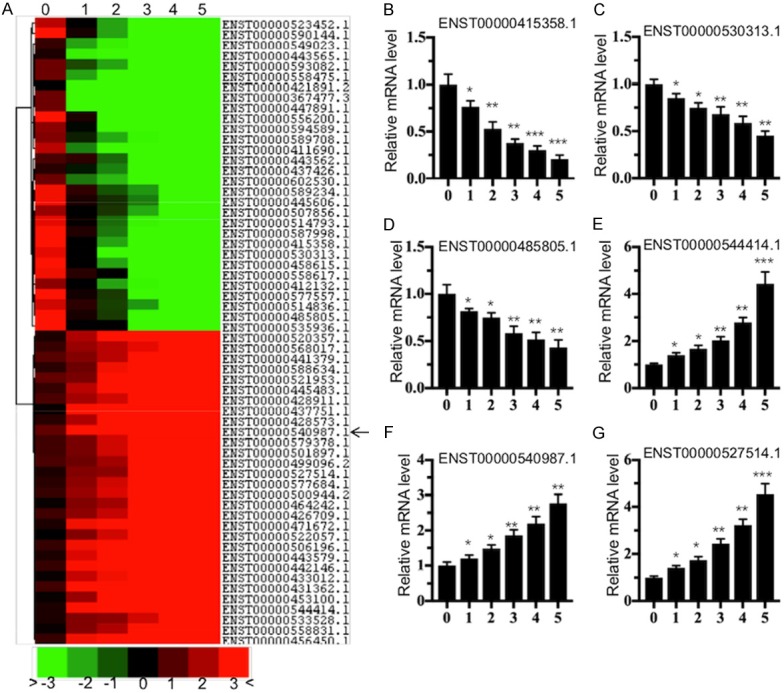
The aberrantly expressed lncRNA profile in IDD patients. (A) The heat map of the top 15 downregulated and top 15 upregulated lncRNAs in IDD patients. The total RNA from a healthy control (0) and from five IDD patients with different Pfirrmann grades (from 1 to 5, one sample per grade) was subjected to a microarray analysis. The heat map indicated high (red) or low (green) levels of lncRNA expression. (B-G) The verification of lncRNA levels in IDD patients. qRT-PCR was performed to verify the expression of three downregulated lncRNAs, including ENST00000415358.1 (B), ENST00000530313.1 (C), and ENST00000485805.1 (D), and three upregulated lncRNAs, including ENST00000544414.1 (E), ENST00000540987.1 (F), and ENST00000527514.1 (G). *P < 0.05, **P < 0.01, and ***P < 0.001.
LncPolE is upregulated in IDD patients
Given that many lncRNAs are antisense and that they have been reported to act on gene expression in multiple model organisms, one sample way to determine whether these differentially expressed lncRNAs can regulate PolE expression is to map their chromosome locations. After carefully comparing their chromosome positions, we found that ENST00000540987.1 was located across the 28th and 29th exons of PolE1 (Figure 2A), and its direction was opposite to that of the PolE1 gene. Given that ENST00000540987.1 was upregulated and PolE1 was downregulated in IDD tissues, we speculated that ENST00000540987.1 was an antisense lncRNA of PolE1 and that it might negatively affect PolE1 levels. To further investigate its role and to simplify its name, we termed ENST00000540987.1 as lncPolE in the following study. Our previous results have shown that the PolE1 level was negatively associated with the severity of disc degeneration. To investigate whether the expression level of lncPolE was correlated with disc degeneration, we measured its level in different Pfirrmann grade patients. As shown in Figure 2B, our results indicated that the lncPolE level was positively associated with the severity of Pfirrmann grades, that is, the higher grades, the higher the lncPolE level. In addition, we also combined all of the relative expression levels of lncPolE in IDD patients and then compared them with those in the healthy controls. Similarly, we also observed a significant increase in lncPolE in IDD patients (Figure 2C).
Figure 2.
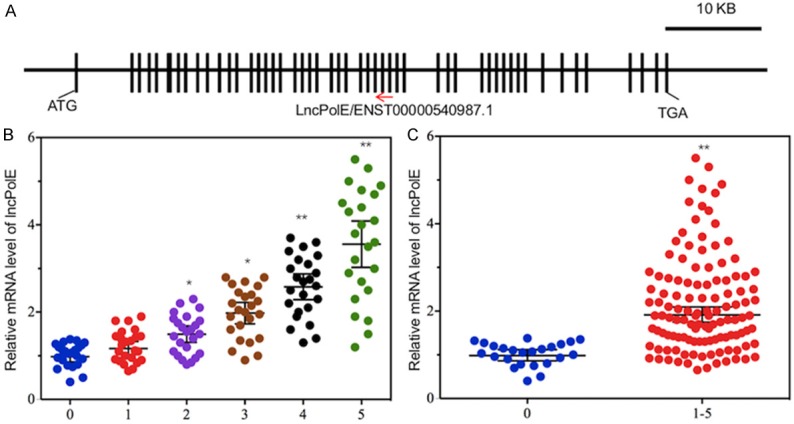
lncPolE expression was increased in IDD patients. A. A schematic diagram of the PolE1 gene and the location of lncPolE. The exons of the PolE1 gene are shown as black boxes, and lncPolE is located across the 28th and 29th exons. B and C. The expression of lncPolE was elevated in IDD patients. Venous blood samples were collected from healthy controls (n=24) and 120 IDD patients with different Pfirrmann grades (from 1 to 5, n=24 patients in each grade). The RNA from these samples was subjected to an analysis of lncPolE levels. *P < 0.05, **P < 0.01.
Overexpression of lncPolE results in the repression of PolEs and leads to apoptosis
To investigate whether lncPolE can regulate PolE1 expression, we constructed a pCDNA3-lncPolE vector and transfected it into NP cells, followed by measuring the expression levels of lncPolE and PolE1. As shown in Figure 3A and 3B, the overexpression of lncPolE resulted in the repression of PolE1. Given that our previous results have shown that the downregulation of PolE1 in NP cells caused the instability of the PolE complex and led to apoptosis, we next sought to evaluate the effect of lncPolE overexpression on the stability of the PolE complex and the apoptotic status of cells. Our results indicated that the overexpression of lncPolE not only resulted in a decrease in the PolE1, -2 and -3 protein levels but also induced apoptosis because of the activation of caspase-3, -9, and PARP (poly (ADP-ribose) polymerase 1) (Figure 3C). In addition, we also stained the lncPolE overexpression cells with Annexin V-PE and 7-AAD and detected the cellular apoptosis status with flow cytometry. The results showed that lncPolE overexpression significantly increased the cell population in Q2 (early apoptosis) and Q3 (late apoptosis) compared to the population of the control cells (Figure 3D and 3E), which suggests that lncPolE overexpression was able to induce apoptosis.
Figure 3.

The in vitro overexpression of lncPolE inhibited PolE1 expression and induced apoptosis. Human NP cells (hNPCs) were infected with a pCDNA3 empty vector (control) and pCDNA3-lncPolE. After incubation for 48 hr, the cells were subjected to an analysis of the lncPolE levels (A) and the PolE1 mRNA levels (B), as well as an analysis of the protein levels of PolE1, PolE2, PolE3, Caspase-3, Caspase-8 and PARP. GAPDH was used as a loading control (C). (D and E) The same cells used in (A) were stained with Annexin V-PE/7-AAD and were subjected to flow cytometry analysis. (D) Control cells and (E) cells transfected with pCDNA3-lncPolE.
Knockdown of lncPolE in NP cells increases PolE levels and reverses apoptosis
Our above results indicated that the increase of lncPolE resulted in the instability of the PolE complex and induced apoptosis. To further evaluate whether the upregulation of lncPolE is the fundamental cause of this phenomenon, we next attempted to knockdown lncPolE in pNPCs from IDD patients and then detect the PolE complex levels and apoptotic proteins. Accordingly, we isolated pNPCs from a healthy tissue and two IDD tissues with Pfirrmann grades 2 and 4. After transfection with lncPolE-specific siRNA for 48 hr, we measured the mRNA levels of lncPolE and PolE1, as well as the protein levels of the PolE complex and apoptotic proteins, including caspase-3, -9, and PARP. As expected, we significantly knocked down the lncPolE levels in pNPCs from IDD tissues (Figure 4A), which resulted in a dramatic increase in the PolE1 mRNA levels (Figure 4B) and caused the accumulation of the PolE complex (Figure 4C). Meanwhile, the knockdown of lncPolE in primary NP cells also led to the inhibition of apoptosis compared to that in nontransfected cells because of the inactivation of caspase-3, -9, and PARP (Figure 4C).
Figure 4.
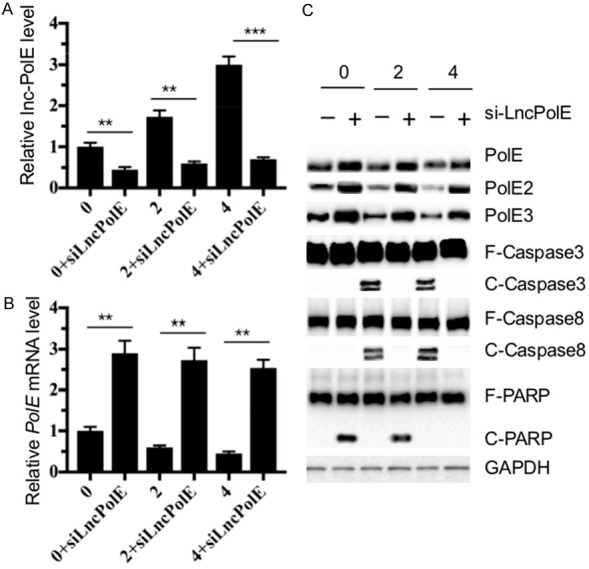
The in vitro knockdown of lncPolE resulted in the increase of PolE1 expression and inhibited apoptosis. The primary NP cells (pNPCs) that were isolated from one healthy control (0) and from two IDD patients with the Pfirrmann grades 2 and 4 were transfected with lncPolE-specific siRNA. The resulting cells were incubated for another 48 hr and were then used to measure the lncPolE levels (A), PolE1 mRNA levels (B), and protein levels of PolE1, PolE2, PolE3, Caspase-3, Caspase-8 and PARP. GAPDH was used as a loading control (C).
Iron depletion or supplementation changes the lncPolE levels
Our previous results showed that iron supplementation with FeCl3 in pNPCs from IDD tissues increased the protein levels of PolE1, -2 and -3 but decreased the levels of apoptotic proteins [26]. In contrast, iron depletion with the chelator deferoxamine (DFO) in hNPCs caused a decrease in PolE1, -2 and -3 but an induction of apoptotic proteins. To further determine whether iron depletion or supplementation can affect the lncPolE levels, we primarily treated hNPCs with different concentrations of DFO (0, 20, 40 and 60 μM), followed by the detection of the mRNA levels of lncPolE and PolE1. As shown in Figure 5A, the lncPolE levels gradually increased with increasing DFO concentrations. However, the mRNA level of PolE1 gradually decreased with increasing DFO concentrations (Figure 5B). In addition, we also treated pNPCs that were isolated from one healthy control and two IDD tissues with different Pfirrmann grades (2 and 4) using 100 μM FeCl3. After 24 hr of incubation, we observed that iron supplementation resulted in a dramatic decrease in the lncPolE level in two degenerative cells compared to that in their corresponding untreated cells (Figure 5C). In contrast, iron supplementation led to a significant increase in the PolE1 mRNA levels in these two degenerative cells (Figure 5D). We did not observe significant changes in either of the lncPolE and PolE1 levels in healthy NP cells under conditions with or without FeCl3 treatment (Figure 5C and 5D).
Figure 5.
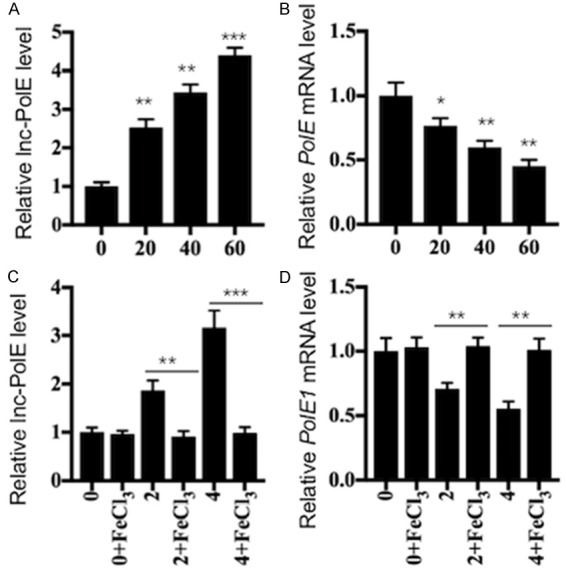
Iron depletion and supplementation affected the lncPolE and PolE1 levels. The hNPCs were treated with different concentrations (0, 20, 40 and 60 μM) of DFO for 24 hr. The cells were then harvested and subjected to an examination of their lncPolE levels (A) and PolE1 mRNA levels (B). *P < 0.05, **P < 0.01, and ***P < 0.001. The pNPCs from healthy controls (0) and from two IDD patients with Pfirrmann grades 2 and 4 were treated with or without 100 μM FeCl3 for 24 hr. Following this, the cells were harvested and subjected to an examination of their lncPolE levels (C) and PolE1 mRNA levels (D). **P < 0.01, and ***P < 0.001.
The decreased DNA methylation level in the promoter of lncPolE causes the upregulation of lncPolE
Our above results verified the increase in lncPolE levels in IDD tissues and in hNPCs treated with DFO. Thus, we next sought to investigate the underlying mechanism of its upregulation. Currently, dysregulated DNA methylation and acetylation in the promoters of lncRNAs are the two primary mechanisms that cause the differential expression of lncRNAs. Based on this notion, we primarily analyzed the promoter sequence of lncPolE and found two CpG islands located in the regions of (-)430-(-)357 and (-)932-(-)823 (Figure 6A). Because DNA methylation often occurs at CpG islands, we speculated that disrupted DNA methylation in the promoter of lncPolE might be the primary reason for its overexpression in IDD tissues. To verify this hypothesis, we examined the DNA methylation level of CpG islands in healthy and degenerative NP cells with the qMSP method. As shown in Figure 6B, our results indicate that the methylation levels of both CpG islands were dramatically decreased in degenerative NP cells compared to healthy pNPCs. To further verify that the DNA methylation level affects lncPolE expression, we treated hNPCs with the DNA methylation inhibitor 5-aza-2’-deoxycytidine (AZA, 1 μM) and with the acetylation inhibitor trichostatin A (TSA, 300 nM) in combination with or without DFO (30 and 60 μM), followed by measuring the DNA methylation levels of CpG islands and the lncPolE level. Our results indicated that in comparison to the methylation levels with DMSO treatment, the methylation levels of both CpG islands were markedly decreased with AZA treatment but not with TSA treatment (Figure 6C and 6D). In contrast, the expression level of lncPolE was significantly increased in the AZA treatment compared to the level in the DMSO or TSA treatments (Figure 6E). In addition, we also found that the treatments of DFO in combination with DMSO or TSA dramatically decreased the methylation levels of both CpG islands (Figure 6C and 6D) but significantly increased the lncPolE levels (Figure 6E). However, we did not observe significant changes in DNA methylation or lncPolE levels when cells were treated with DFO and AZA (Figure 6C-E). At the same time, we also measured the PolE1 mRNA levels in these treatments, and the results showed that AZA treatment, but not TSA treatment, caused its downregulation (Figure 6F). These results clearly indicated that dysregulated DNA methylation in the promoters of lncPolE played a significant role in the regulation of PolE1 levels.
Figure 6.

Dysregulated DNA methylation levels contributed to lncPolE overexpression in IDD tissues. (A) A schematic diagram of the CpG islands in the promoter of lncPolE. The promoter of lncPolE (1500 bp length) had two CpG islands (1 and 2). The position of lncPolE is indicated by a red arrow. (B) The methylation levels of two CpG islands were significantly downregulated in IDD tissues. qMSP was performed to examine the DNA methylation levels of both CpG islands in one healthy control (HC) and in two IDD tissues with Pfirrmann grades 2 and 4 (IDD-2 and -4, respectively). *P < 0.05, and **P < 0.01. (C and D) AZA treatment significantly downregulated the DNA methylation levels of both CpG islands. The hNPCs were treated with DMSO, 1 μM of AZA or 300 nM of TSA in combination with different concentrations of DFO (0, 30 and 60 μM). The qMSP was then performed to examine the DNA methylation levels of both CpG islands. **P < 0.01, and ***P < 0.001. (E and F) AZA treatment significantly upregulated the lncPolE levels but downregulated PolE1 expression. The cells used in B were subjected to an examination of their lncPolE levels (E) and PolE1 expression levels (F), respectively. *P < 0.05, and **P < 0.01.
Discussion
Iron deficiency is a critical cause of many diseases because iron is an essential cofactor for proteins [32,33]. Our recent study has revealed that iron deficiency results in the instability of the DNA polymerase epsilon complex, which leads to cell apoptosis and the pathogenesis of IDD [26]. In the present study, we further investigated the underlying mechanism regarding PolE1 downregulation in IDD tissues. Our results suggest that cells need to maintain a certain DNA methylation status to regulate noncoding RNA and gene expression under normal conditions. The DNA methylation status determines the lncPolE level, which negatively regulates PolE expression (Figure 7). In degenerative cells from IDD tissues, the DNA methylation level dramatically decreased in the promoter of lncPolE, which caused the upregulation of lncPolE. The elevated level of lncPolE represses PolE1 expression, which affects the stability of the PolE complex and induces apoptosis, eventually leading to the pathogenesis of IDD (Figure 7).
Figure 7.
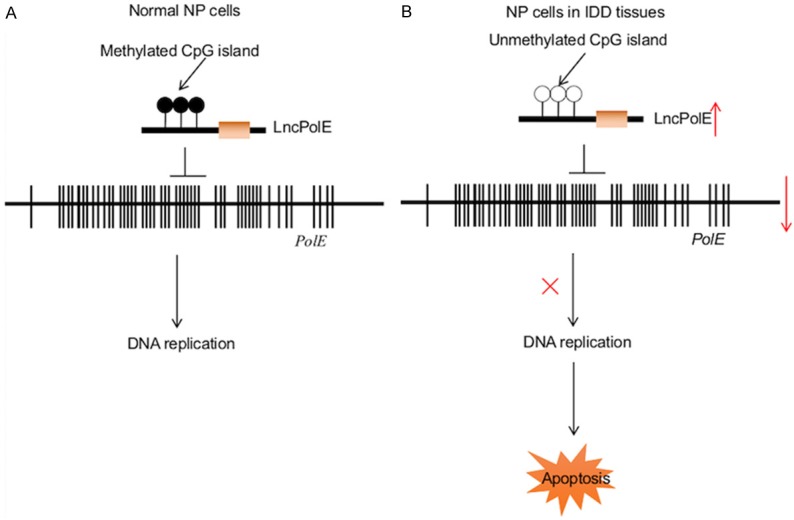
Schematic model of lncPolE in IDD pathogenesis. A. The working model of lncPolE in normal NP cells. Under normal conditions, NP cells must maintain a certain methylation status to regulate lncPolE levels. lncPolE plays a negative regulatory role to repress PolE1 expression, thereby controlling the DNA replication process. B. The working model of lncPolE in degenerative NP cells is shown. In degenerative cells, the methylation levels of CpG islands in the promoter of lncPolE are very low, which causes the overexpression of lncPolE and the downregulation of PolE1; this eventually leads to the instability of the PolE complex and the occurrence of apoptosis.
In recent years, noncoding RNAs, in particular, microRNAs (miRNAs), and lncRNAs have been identified to be widely involved in the pathogenesis of IDD [34-37]. In the present study, we found a total of 146 differentially expressed lncRNAs in IDD tissues. Importantly, these lncRNAs were not only differentially expressed in IDD tissues, but their expression levels also seemed to be associated with the severity of disc degeneration. These results suggest that they are IDD-dependent lncRNAs. Although we do not examine how these lncRNAs (except for lncPolE) function in the process of IDD, we speculate that our microarray data provide evidence for future studies in the field of lncRNAs and their involvement in IDD pathogenesis. In our recently published work, we performed a microarray to identify genes that are differentially expressed in IDD tissues, and we identified a total of 327 differentially expressed genes. A critical future work is to analyze these two microarray results and to determine whether the dysregulated lncRNAs can regulate those differentially expressed genes.
Through the in vitro knockdown and overexpression experiments, we verified that PolE1 was negatively regulated by lncPolE. We also found that dysregulated DNA methylation levels are the basic cause of lncPolE overexpression in IDD tissues. Given that DNA methylation occurs by the addition of a methyl (CH3) group to DNA with DNA methyltransferases (DNMTs) [38,39], we will determine the DNMT levels in IDD tissues and investigate whether DNMTs are involved in the regulation of lncPolE levels. One interesting phenomenon observed in this study is that the intracellular iron levels were able to regulate the lncPolE levels. By the supplementation of iron in pNPCs from IDD tissues, we observed a significant decrease in the lncPolE levels (Figure 5C). However, iron depletion in hNPCs causes an increase in the lncPolE levels (Figure 5A). To our knowledge, this is the first lncRNA that can be regulated by a metal ion. However, we do not know whether it is directly regulated by the metal ion. One possibility is that iron regulates the PolE1 level, which in turn, has a feedback effect on lncPolE. Several assays, including the knockdown of DMT1 (iron divalent metal transporter 1) or TfR1 (iron transferrin receptor 1), can be performed to verify this possibility.
Conclusion
In this study, we identified the new lncRNA lncPolE that can negatively regulate PolE1 expression. The decreased DNA methylation level in the promoter of lncPolE causes its overexpression and leads to PolE1 downregulation in degenerative cells. The instability of the PolE complex induces apoptosis and results in the pathogenesis of IDD.
Acknowledgements
This study was supported by a grant from the National Natural Science Foundation of China (No. 81601939) and two grants from Yunnan Applied Basic Research Projects (No. 2017FE468-145 and No. 2018FB125).
Disclosure of conflict of interest
None.
Supporting Information
References
- 1.Wong AY, Karppinen J, Samartzis D. Low back pain in older adults: risk factors, management options and future directions. Scoliosis Spinal Disord. 2017;12:14. doi: 10.1186/s13013-017-0121-3. [DOI] [PMC free article] [PubMed] [Google Scholar]
- 2.Awosan KJ, Yikawe SS, Oche OM, Oboirien M. Prevalence, perception and correlates of low back pain among healthcare workers in tertiary health institutions in Sokoto, Nigeria. Ghana Med J. 2017;51:164–174. [PMC free article] [PubMed] [Google Scholar]
- 3.Feng Y, Egan B, Wang J. Genetic factors in intervertebral disc degeneration. Genes Dis. 2016;3:178–185. doi: 10.1016/j.gendis.2016.04.005. [DOI] [PMC free article] [PubMed] [Google Scholar]
- 4.Martirosyan NL, Patel AA, Carotenuto A, Kalani MY, Belykh E, Walker CT, Preul MC, Theodore N. Genetic alterations in intervertebral disc disease. Front Surg. 2016;3:59. doi: 10.3389/fsurg.2016.00059. [DOI] [PMC free article] [PubMed] [Google Scholar]
- 5.Pattappa G, Li Z, Peroglio M, Wismer N, Alini M, Grad S. Diversity of intervertebral disc cells: phenotype and function. J Anat. 2012;221:480–496. doi: 10.1111/j.1469-7580.2012.01521.x. [DOI] [PMC free article] [PubMed] [Google Scholar]
- 6.An HS, Masuda K, Inoue N. Intervertebral disc degeneration: biological and biomechanical factors. J Orthop Sci. 2006;11:541–552. doi: 10.1007/s00776-006-1055-4. [DOI] [PMC free article] [PubMed] [Google Scholar]
- 7.Hiyama A, Skubutyte R, Markova D, Anderson DG, Yadla S, Sakai D, Mochida J, Albert TJ, Shapiro IM, Risbud MV. Hypoxia activates the notch signaling pathway in cells of the intervertebral disc: implications in degenerative disc disease. Arthritis Rheum. 2011;63:1355–1364. doi: 10.1002/art.30246. [DOI] [PMC free article] [PubMed] [Google Scholar]
- 8.Johnson ZI, Schoepflin ZR, Choi H, Shapiro IM, Risbud MV. Disc in flames: roles of TNF-alpha and IL-1beta in intervertebral disc degeneration. Eur Cell Mater. 2015;30:104–116. doi: 10.22203/ecm.v030a08. [DOI] [PMC free article] [PubMed] [Google Scholar]
- 9.Wang H, Tian Y, Wang J, Phillips KL, Binch AL, Dunn S, Cross A, Chiverton N, Zheng Z, Shapiro IM, Le Maitre CL, Risbud MV. Inflammatory cytokines induce NOTCH signaling in nucleus pulposus cells: implications in intervertebral disc degeneration. J Biol Chem. 2013;288:16761–16774. doi: 10.1074/jbc.M112.446633. [DOI] [PMC free article] [PubMed] [Google Scholar]
- 10.Oeckinghaus A, Ghosh S. The NF-kappaB family of transcription factors and its regulation. Cold Spring Harb Perspect Biol. 2009;1:a000034. doi: 10.1101/cshperspect.a000034. [DOI] [PMC free article] [PubMed] [Google Scholar]
- 11.Lawrence T. The nuclear factor NF-kappaB pathway in inflammation. Cold Spring Harb Perspect Biol. 2009;1:a001651. doi: 10.1101/cshperspect.a001651. [DOI] [PMC free article] [PubMed] [Google Scholar]
- 12.Fang H, Li X, Shen H, Sun B, Teng H, Li P. Osteogenic protein-1 attenuates apoptosis and enhances matrix synthesis of nucleus pulposus cells under high-magnitude compression though inhibiting the p38 MAPK pathway. Biosci Rep. 2018 doi: 10.1042/BSR20180018. [Epub ahead of print] [DOI] [PMC free article] [PubMed] [Google Scholar] [Retracted]
- 13.Liu G, Cao P, Chen H, Yuan W, Wang J, Tang X. MiR-27a regulates apoptosis in nucleus pulposus cells by targeting PI3K. PLoS One. 2013;8:e75251. doi: 10.1371/journal.pone.0075251. [DOI] [PMC free article] [PubMed] [Google Scholar]
- 14.Wang Z, Leng J, Zhao Y, Yu D, Xu F, Song Q, Qu Z, Zhuang X, Liu Y. N-cadherin maintains the healthy biology of nucleus pulposus cells under high-magnitude compression. Cell Physiol Biochem. 2017;43:2327–2337. doi: 10.1159/000484385. [DOI] [PubMed] [Google Scholar]
- 15.Wapinski O, Chang HY. Long noncoding RNAs and human disease. Trends Cell Biol. 2011;21:354–361. doi: 10.1016/j.tcb.2011.04.001. [DOI] [PubMed] [Google Scholar]
- 16.DiStefano JK. The emerging role of long noncoding RNAs in human disease. Methods Mol Biol. 2018;1706:91–110. doi: 10.1007/978-1-4939-7471-9_6. [DOI] [PubMed] [Google Scholar]
- 17.Chen X, Yan CC, Zhang X, You ZH. Long non-coding RNAs and complex diseases: from experimental results to computational models. Brief Bioinform. 2017;18:558–576. doi: 10.1093/bib/bbw060. [DOI] [PMC free article] [PubMed] [Google Scholar]
- 18.Harries LW. Long non-coding RNAs and human disease. Biochem Soc Trans. 2012;40:902–906. doi: 10.1042/BST20120020. [DOI] [PubMed] [Google Scholar]
- 19.Wan ZY, Song F, Sun Z, Chen YF, Zhang WL, Samartzis D, Ma CJ, Che L, Liu X, Ali MA, Wang HQ, Luo ZJ. Aberrantly expressed long noncoding RNAs in human intervertebral disc degeneration: a microarray related study. Arthritis Res Ther. 2014;16:465. doi: 10.1186/s13075-014-0465-5. [DOI] [PMC free article] [PubMed] [Google Scholar]
- 20.Zhao B, Lu M, Wang D, Li H, He X. Genome-wide identification of long noncoding RNAs in human intervertebral disc degeneration by RNA sequencing. Biomed Res Int. 2016;2016:3684875. doi: 10.1155/2016/3684875. [DOI] [PMC free article] [PubMed] [Google Scholar]
- 21.Bellelli R, Borel V, Logan C, Svendsen J, Cox DE, Nye E, Metcalfe K, O’Connell SM, Stamp G, Flynn HR, Snijders AP, Lassailly F, Jackson A, Boulton SJ. Polepsilon instability drives replication stress, abnormal development, and tumorigenesis. Mol Cell. 2018;70:707–721. doi: 10.1016/j.molcel.2018.04.008. [DOI] [PMC free article] [PubMed] [Google Scholar]
- 22.Cao J. The functional role of long non-coding RNAs and epigenetics. Biol Proced Online. 2014;16:11. doi: 10.1186/1480-9222-16-11. [DOI] [PMC free article] [PubMed] [Google Scholar]
- 23.Jiang K, Zhang C, Yu B, Chen B, Liu Z, Hou C, Wang F, Shen H, Chen Z. Autophagic degradation of FOXO3a represses the expression of PUMA to block cell apoptosis in cisplatin-resistant osteosarcoma cells. Am J Cancer Res. 2017;7:1407–1422. [PMC free article] [PubMed] [Google Scholar]
- 24.Li Q, Li H, Zhao X, Wang B, Zhang L, Zhang C, Zhang F. DNA methylation mediated downregulation of miR-449c controls osteosarcoma cell cycle progression by directly targeting oncogene c-Myc. Int J Biol Sci. 2017;13:1038–1050. doi: 10.7150/ijbs.19476. [DOI] [PMC free article] [PubMed] [Google Scholar]
- 25.Li S. Expression of concern: the functional role of long non-coding RNAs and epigenetics. Biol Proced Online. 2016;18:12. doi: 10.1186/s12575-016-0042-1. [DOI] [PMC free article] [PubMed] [Google Scholar]
- 26.Zhang C, Wang B, Zhao X, Li X, Lou Z, Chen X, Zhang F. Iron deficiency accelerates intervertebral disc degeneration through affecting the stability of DNA polymerase epsilon complex. Am J Transl Res. 2018;10:3430–3442. [PMC free article] [PubMed] [Google Scholar]
- 27.Ruan Z, Ma H, Li J, Liu H, Jia H, Li F. The long non-coding RNA NEAT1 contributes to extracellular matrix degradation in degenerative human nucleus pulposus cells. Exp Biol Med (Maywood) 2018;243:595–600. doi: 10.1177/1535370218760774. [DOI] [PMC free article] [PubMed] [Google Scholar]
- 28.Tang X, Richardson WJ, Fitch RD, Brown CR, Isaacs RE, Chen J. A new non-enzymatic method for isolating human intervertebral disc cells preserves the phenotype of nucleus pulposus cells. Cytotechnology. 2014;66:979–986. doi: 10.1007/s10616-013-9650-7. [DOI] [PMC free article] [PubMed] [Google Scholar]
- 29.Wang K, Song Y, Liu W, Wu X, Zhang Y, Li S, Kang L, Tu J, Zhao K, Hua W, Yang C. The noncoding RNA linc-ADAMTS5 cooperates with RREB1 to protect from intervertebral disc degeneration through inhibiting ADAMTS5 expression. Clin Sci (Lond) 2017;131:965–979. doi: 10.1042/CS20160918. [DOI] [PubMed] [Google Scholar]
- 30.Zhang C, Chen B, Jiang K, Lao L, Shen H, Chen Z. Activation of TNF-alpha/NF-kappaB axis enhances CRL4B(DCAF)(11) E3 ligase activity and regulates cell cycle progression in human osteosarcoma cells. Mol Oncol. 2018;12:476–494. doi: 10.1002/1878-0261.12176. [DOI] [PMC free article] [PubMed] [Google Scholar]
- 31.Zhou Z, Lin Z, Pang X, Tariq MA, Ao X, Li P, Wang J. Epigenetic regulation of long non-coding RNAs in gastric cancer. Oncotarget. 2018;9:19443–19958. doi: 10.18632/oncotarget.23821. [DOI] [PMC free article] [PubMed] [Google Scholar]
- 32.Zhang C. Essential functions of iron-requiring proteins in DNA replication, repair and cell cycle control. Protein Cell. 2014;5:750–760. doi: 10.1007/s13238-014-0083-7. [DOI] [PMC free article] [PubMed] [Google Scholar]
- 33.Zhang C, Zhang F. Iron homeostasis and tumorigenesis: molecular mechanisms and therapeutic opportunities. Protein Cell. 2015;6:88–100. doi: 10.1007/s13238-014-0119-z. [DOI] [PMC free article] [PubMed] [Google Scholar]
- 34.Zhou X, Chen L, Grad S, Alini M, Pan H, Yang D, Zhen W, Li Z, Huang S, Peng S. The roles and perspectives of microRNAs as biomarkers for intervertebral disc degeneration. J Tissue Eng Regen Med. 2017;11:3481–3487. doi: 10.1002/term.2261. [DOI] [PubMed] [Google Scholar]
- 35.Zhao B, Yu Q, Li H, Guo X, He X. Characterization of microRNA expression profiles in patients with intervertebral disc degeneration. Int J Mol Med. 2014;33:43–50. doi: 10.3892/ijmm.2013.1543. [DOI] [PMC free article] [PubMed] [Google Scholar]
- 36.Qu Z, Quan Z, Zhang Q, Wang Z, Song Q, Zhuang X, Fu C, Xu F, Liu Y, Wang Y, Wang Z, Liu Y. Comprehensive evaluation of differential lncRNA and gene expression in patients with intervertebral disc degeneration. Mol Med Rep. 2018;18:1504–1512. doi: 10.3892/mmr.2018.9128. [DOI] [PMC free article] [PubMed] [Google Scholar]
- 37.Chen Y, Ni H, Zhao Y, Chen K, Li M, Li C, Zhu X, Fu Q. Potential role of lncRNAs in contributing to pathogenesis of intervertebral disc degeneration based on microarray data. Med Sci Monit. 2015;21:3449–3458. doi: 10.12659/MSM.894638. [DOI] [PMC free article] [PubMed] [Google Scholar]
- 38.Moore LD, Le T, Fan G. DNA methylation and its basic function. Neuropsychopharmacology. 2013;38:23–38. doi: 10.1038/npp.2012.112. [DOI] [PMC free article] [PubMed] [Google Scholar]
- 39.Jin B, Li Y, Robertson KD. DNA methylation: superior or subordinate in the epigenetic hierarchy? Genes Cancer. 2011;2:607–617. doi: 10.1177/1947601910393957. [DOI] [PMC free article] [PubMed] [Google Scholar]
Associated Data
This section collects any data citations, data availability statements, or supplementary materials included in this article.