

Abstract
Replicative crisis is a senescence-independent process that acts as a final barrier against oncogenic transformation by eliminating pre-cancerous cells with disrupted cell cycle checkpoints1. It functions as a potent tumour suppressor and culminates in extensive cell death. Cells rarely evade elimination and evolve towards malignancy, but the mechanisms that underlie cell death in crisis are not well understood. Here we show that macroautophagy has a dominant role in the death of fibroblasts and epithelial cells during crisis. Activation of autophagy is critical for cell death, as its suppression promoted bypass of crisis, continued proliferation and accumulation of genome instability. Telomere dysfunction specifically triggers autophagy, implicating a telomere-driven autophagy pathway that is not induced by intrachromosomal breaks. Telomeric DNA damage generates cytosolic DNA species with fragile nuclear envelopes that undergo spontaneous disruption. The cytosolic chromatin fragments activate the cGAS-STING (cyclic GMP-AMP synthase-stimulator of interferon genes) pathway and engage the autophagy machinery. Our data suggest that autophagy is an integral component of the tumour suppressive crisis mechanism and that loss of autophagy function is required for the initiation of cancer.
Reporting summary.
Further information on research design is available in the Nature Research Reporting Summary linked to this paper.
Tumorigenesis requires cells to bypass or escape two discrete barriers: senescence and crisis. Senescence comprises permanent arrest of the cell cycle, is activated as primary response to telomere deprotection and involves stimulation of the P53-P21WAF1 and/or P16INK4A-RB tumour suppressor pathways. Attenuation of cell cycle checkpoints allows cells to bypass senescence and continue to proliferate, while telomeres shorten further. Eventually such cells initiate a terminal response called replicative crisis, during which critically short telomeres fuse; this results in mitotic delay, amplified telomere deprotection and cell death2. Although the vast majority of cells die during crisis, occasionally individual cells escape. Such post-crisis cells exhibit characteristics of malignant transformation, including an unstable genome, loss of checkpoint control and upregulated telomere maintenance, emphasizing the essential role of cell death in crisis as a tumour suppressor3,4. However, the mechanisms of cell death during replicative crisis are not yet understood.
Death in crisis is consistent with programmed death, as it is finely modulated by telomeric damage signals2. To model telomere crisis, we used human lung fibroblasts (cell lines IMR90 and WI38) in which the RB and P53 pathways were disabled using the SV40 large T antigen (SV40-LT)5 (referred to as IMR90SV40 or WI38SV40) or human papillomavirus (HPV) E6 and E7 oncoproteins6 (IMR90E6E7 or WI38E6E7). The cells bypassed senescence and reached crisis at around population doubling (PD) 105 for IMR90 and PD85 for WI38 (Extended Data Fig. 1a, b). Human mammary epithelial cells (HMECs) escape from senescence through spontaneous silencing of P16INK4A and enter crisis at PD277 (Extended Data Fig. 1c, d). Alternatively, overexpression of mutant CDK4 (CDK4(R24C)) and dominant negative P53 (P53(DD)) prevented senescence and induced crisis at PD60 in human prostate epithelial cells (PrECs)8 (Extended Data Fig. 1c, e. Crisis was associated with deprotected telomeres (Extended Data Fig. 1f, g), fused chromosomes (Extended Data Fig. 1h, i) and cell death (Extended Data Fig. 2a).
Cells in crisis displayed extensive cytoplasmic vacuolization (Extended Data Fig. 2b), suggestive of macroautophagy. The cytoplasm contained numerous vacuoles with features of doublemembrane autophagosomes (containing intact cytosol or organelles) and single-membrane autolysosomes (containing digested cellular components) (Fig. 1a, Extended Data Fig. 2c, d). Hallmarks of apoptosis were detected only in staurosporine-treated cells (Fig. 1a).
Fig. 1 |. Crisis cells exhibit features of active autophagy.
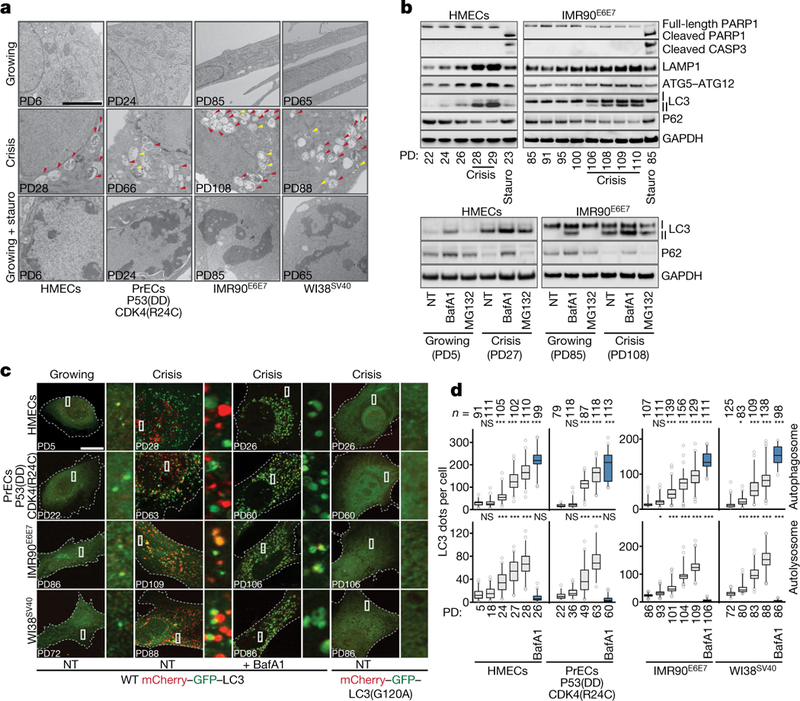
a, Electron micrographs of growing, crisis and staurosporine-treated (stauro) growing cells (1 μM for 6 h). Yellow and red arrows indicate autophagosomes and autolysosomes, respectively. Two independent experiments. Scale bar, 2 μm. Quantification in Extended Data Fig. 2d. PD, population doubling. b, Top, immunoblotting of HMECs and IMR90E6E7 cells approaching crisis with GAPDH as loading control. Two independent experiments performed. Bottom, LC3-II and P62 turnover assays. Immunoblotting of HMECs and IMR90E6E7 cells in the presence or absence of bafilomycin A1 (BafA1, 50 nM for 24 h) or MG132 (10 μM for 24 h). NT, not treated; GAPDH as loading control. One experiment. c, Confocal microscopy images of growing and crisis cells expressing wild-type (WT) mCherry-GFP-LC3, crisis cells expressing wild-type mCherry-GFP-LC3 treated with bafilomycin A1 and crisis cells expressing mutant mCherry-GFP-LC3(G120A). Two independent experiments. Scale bar, 10 μm. d, Box and whisker plots showing the number of autophagosomes (yellow LC3 dots) and autolysosomes (red LC3 dots). Centre line, median; box limits, first and third quartiles; whiskers, 10th and 90th percentiles. n shows number of cells analysed. Two independent experiments. One-way ANOVA; NS, not significant, *P < 0.05, **P < 0.01, ***P < 0.001. For gel source data see Supplementary Fig. 1.
Crisis was associated with an increase in the autophagy-related proteins lysosomal-associated membrane protein 1 (LAMP1), ATG5-ATG12 conjugate (for phagophore biogenesis) and the lipidated form of microtubule-associated protein 1A/1B-light chain 3 (LC3), LC3-II (for phagophore expansion), whereas the autophagy target polyubiquitin-binding protein9 P62 (also known as SQSTM1) was reduced (Fig. 1b). Apoptosis markers (cleavage of PARP1 and caspase 3) could not be detected (Fig. 1b). To exclude the possibility that accumulation of LC3-II was the result of a blockade of a downstream autophagy step, we monitored LC3-II levels in the presence of bafilomycin A1, an inhibitor of autophagosome-lysosome fusion and lysosomal acidification10. LC3-II levels were elevated in treated cells, indicating that autophagic activity operates during crisis (Fig. 1b). Moreover, the levels of P62 decreased, but this was partially prevented by bafilomycin A1, whereas inhibition of proteasomes by MG132 had no effect, demonstrating that autophagic activity is enhanced during crisis (Fig. 1b).
We directly monitored autophagic flux using a tandem fluorescence LC3 reporter (mCherry-GFP-LC3), which labels autophagosomes in yellow (mCherry and GFP) and acidic autolysosomes in red (mCherry). Activation of autophagic flux leads to the accumulation of both yellow and red LC3 dots11. Basal autophagic activity under nutrient-rich conditions (Fig. 1c) was strongly elevated upon starvation, and under these conditions LC3 distribution converted to a punctate pattern, forming yellow autophagosomes and red autolysosomes (Extended Data Fig. 3a). Similarly, cells in crisis exhibited extensive accumulation of autophagosomes and autolysosomes (Fig. 1c), with the absolute numbers of both types of vacuole simultaneously and significantly increasing (Fig. 1d). Treatment of crisis cells with bafilomycin A1 led to even greater accumulation of autophagosomes, but abolished autolysosomes (Fig. 1c, d), consistent with the existence of active autophagic flux. Cells expressing a C-terminal glycine mutant form of LC3 that shows impaired translocation (mCherry-GFP-LC3(G120A)) showed only diffuse staining, arguing against non-specific aggregation of LC312 (Fig. 1c). Endogenous LC3 displayed a similar pattern (Extended Data Fig. 3b).
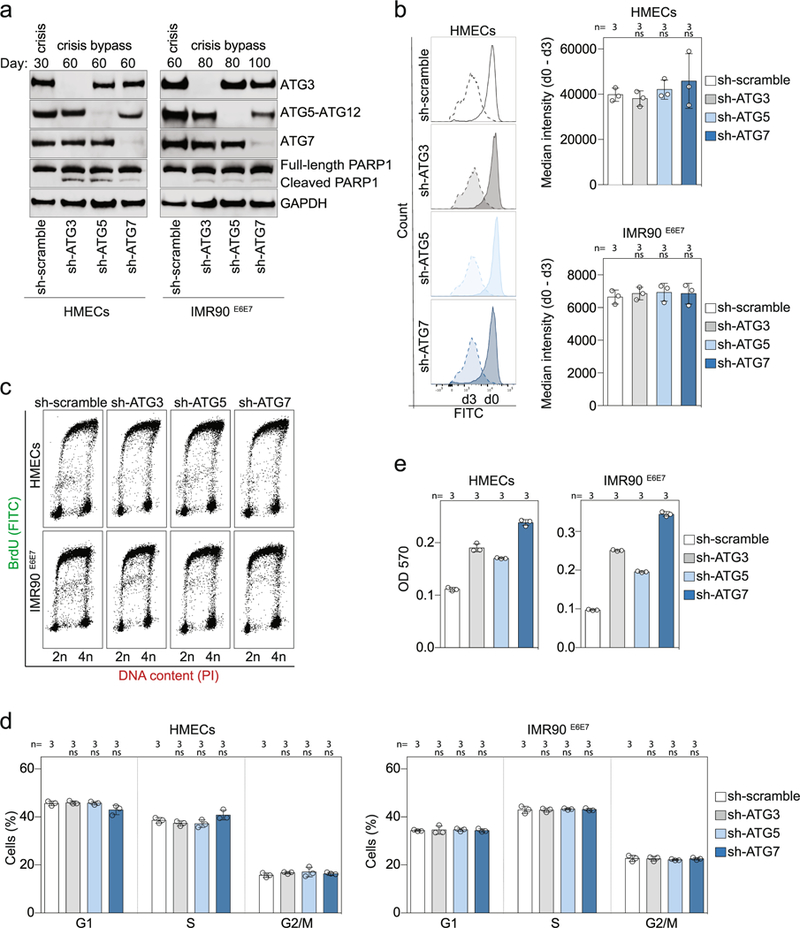
Next, we tested whether suppression of autophagy would enable cells to evade death and bypass crisis. Inhibition of ATG3, ATG5 or ATG7 had no effect on the proliferation rate or cell cycle distribution (Extended Data Fig. 4a–d) and autophagy-deficient cells proliferated at a similar rate to wild-type cells before crisis (Fig. 2a). Control cells entered crisis at around day 30 for HMECs and day 60 for IMR90E6E7 cells (Fig. 2a, b), when death was frequent and replicative capacity reduced (Fig. 2c, d). However, autophagy-deficient cells continued to proliferate and bypassed crisis (Fig. 2a); this process was associated with reduced cell death (Fig. 2c, d). Cell viability assays confirmed resistance to cell death and further cell divisions when autophagy was suppressed (Fig. 2b, Extended Data Fig. 4e). Bypass of crisis was not due to a reduction in telomere shortening rates (Extended Data Fig. 5a), and control and autophagy-deficient cells had similar numbers of deprotected and fused telomeres (Extended Data Fig. 5b, c). Apoptosis was detected only in cells that had bypassed crisis (Extended Data Fig. 4a), raising the possibility that these cells were undergoing breakage-fusion-bridge cycles. Indeed, epithelial cells and fibroblasts that bypassed crisis accumulated non-telomeric γH2AX foci (Extended Data Fig. 5d). Spectral karyotyping analysis by an investigator blinded to conditions revealed gross chromosomal aberrations in cells that had bypassed crisis (Fig. 2e, f, Supplementary Table 1). Only when the cells grew past the proliferative capacity of control cells (day 40) by inhibition of autophagy did they accumulate high levels of chromosomal aberrations (day 85) (Fig. 2e, f, Supplementary Table 1). Indeed, non-reciprocal translocations, deletions and aneu-ploidy were frequent (Fig. 2e, Supplementary Table 1), demonstrating that the elimination of cells in crisis by autophagy is essential to prevent genome instability.
Fig. 2 |. Autophagy inhibition promotes crisis bypass.
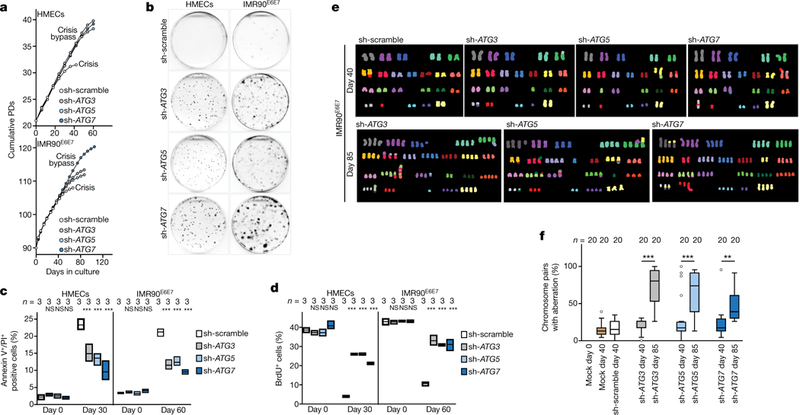
a, Growth curves of post-senescent HMECs and IMR90E6E7 cells that have bypassed senescence expressing non-targeting control short hairpin RNA (shRNA; sh-scramble) or shRNA against ATG3, ATG5 or ATG7. b, Crystal violet viability assay of HMECs and IMR90E6E7 cells expressing non-targeting shRNA or shRNA against ATG3, ATG5 or ATG7. Two independent experiments. Quantification in Extended Data Fig. 4e. c, Cells were stained with annexin V and propidium iodide (PI) and percentages of double-positive cells were measured by flow cytometry. Floating bars show the percentage of Annexin V+/PI+ cells; centre line, mean; box limits, minimum and maximum. n shows number of independent experiments. One-way ANOVA; NS, not significant, ***P < 0.001. d, Floating bars showing the percentage of BrdU+ cells by flow cytometry, as in c. e, Representative multiplex fluorescence in situ hybridization (M-FISH) showing full metaphase spreads of sh-scramble, sh-ATG3, sh-ATG5 and sh-ATG7 IMR90E6E7 cells before crisis (day 40) and sh-ATG3, sh-ATG5 and sh-ATG7 IMR90E6E7 cells that bypassed crisis (day 85). One experiment. f, Box and whisker plots showing percentages of chromosome pairs with aberrations (structural and numerical). Centre line, median; box limits, first and third quartiles; whiskers are plotted according to the Tukey method. n shows number of metaphases analysed. One-way ANOVA; NS, not significant, **P < 0.01, ***P < 0.001. Aberrations listed in Supplementary Table 1. For gel source data see Supplementary Fig. 1.
To test whether deprotected telomeres could specifically signal to autophagy independently of crisis, we removed TRF2. As expected, this led to the formation of telomere dysfunction-induced damage foci and chromosome end-to-end fusions13,14 (Extended Data Fig. 6a, b). LAMP1, ATG5-ATG12 conjugates and LC3-II were upregulated and P62 was decreased, with no trace of PARP1 or caspase 3 cleavage (Fig. 3a). Autophagic bodies accumulated and autophagic flux was enhanced (Fig. 3b, c, Extended Data Fig. 6c). Depletion of TRF1 did not provoke telomeric damage or activation of cell death pathways (Fig. 3a–c).
Fig. 3 |. Telomeric DNA damage activates autophagy.
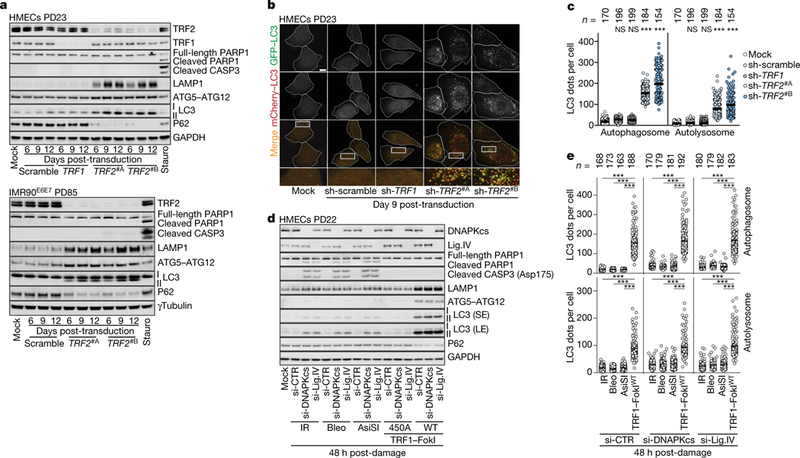
a, Immunoblotting of HMECs (top) and IMR90E6E7 cells (bottom) expressing non-targeting shRNA or shRNA against TRF1 or TRF2 with GAPDH as loading control. Three independent experiments performed for HMECs and one for IMR90E6E7 cells. b, Representative confocal microscopy images of cells expressing wild-type mCherry-GFP-LC3. Two independent experiments. Scale bar, 10 μm. c, Scatter plots showing the number of autophagosomes and autolysosomes. Centre line, mean. n shows number of cells analysed. Two independent experiments. One-way ANOVA; NS, not significant, ***P < 0.001. d, Immunoblotting of HMECs with intrachromosomal damage (ionizing radiation, IR; bleocin, bleo; and AsiSI) or telomeric damage (catalytically inactive TRF1-FokI(450A); wild-type TRF1-FokI). Small inhibitory RNA (siRNA) targeting of DNAPKcs or ligase IV (Lig.IV) performed 48 h before damage induction. si-CTR, control; GAPDH, loading control. Two independent experiments. SE, short exposure; LE, long exposure. e, Scatter plots showing the number of autophagosomes and autolysosomes determined with wild-type mCherry-GFP-LC3 as in c. Two independent experiments. One-way ANOVA; NS, not significant, ***P < 0.001. For gel source data, see Supplementary Fig. 1.
To quantitatively compare telomeric with intrachromosomal damage, we induced telomeric breaks by expression of a fusion protein containing TRF1 and the restriction endonuclease FokI (TRF1-FokI) and administration of 4-hydroxytamoxifen (10 μM 4-OHT) and Shield1 ligand15 (Extended Data Fig. 7a). Damage titration revealed that induction of wild-type TRF1-FokI by 1 μM Shield1 produced a number of γH2AX foci similar to that induced by 1 Gy ionizing irradiation, 1 μg ml−1 bleocin or induction of AsiSI by 0.5 μM Shield116,17 (Extended Data Fig. 7a). Considering that damage foci are resolved more slowly at chromosome ends18, we inhibited canonical non-homologous end joining (cNHEJ) in HMECs by targeting the catalytic subunit of DNA-dependent protein kinase (DNAPKcs) and DNA ligase IV, which led to comparable repair dynamics (Extended Data Fig. 7b, c). Whereas intrachromosomal breaks activated apoptosis (Fig. 3d), telomere damage mediated by wild-type TRF1-FokI led only to activation of autophagy (Fig. 3d, e). IMR90E6E7 cells responded similarly (Extended Data Fig. 7d) and autophagic flux was activated in both cell types (Extended Data Fig. 7e). The generation of long-lasting intrachromosomal breaks induced a slight increase in expression of LC3-II (Fig. 3d).
Dicentric chromosomes that form when telomeres fuse can fragment and release nuclear DNA into the cytosol19. We observed a gradual increase in the frequency of nucleoplasmic bridges, micronuclei and cytoplasmic chromatin fragments in crisis cells (Fig. 4a, b) and in growing cells upon loss of TRF2 or induction of wild-type TRF1-FokI, but to a much lesser extent in cells suffering from radiation-induced intrachromosomal breaks (Fig. 4b). The envelope composition of cytosolic DNA species lacked lamin A and lamin B1 (Extended Data Fig. 8a) and failed to import red fluorescent protein fused with a nuclear localization signal, indicating loss of compartmentalization (Extended Data Fig. 8a). Cytosolic DNA species were negative for mitotracker staining (Extended Data Fig. 8b) and did not resemble extrachromosomal telomeric repeats, as has been observed in ALT cells20 (Extended Data Fig. 8c, d). Suppression of TRF2 and ligase IV—which prevented fusion (Extended Data Fig. 9a–e)—suppressed the accumulation of cytosolic DNA (Extended Data Fig. 9f) and attenuated autophagy (Extended Data Fig. 9g), suggesting that fusion-dependent cytosolic DNA has a pivotal role in the telomeric autophagy response. TRF1-FokI induced autophagy independently of cNHEJ (Fig. 3d), although cytosolic DNA still accumulated (Fig. 4b), potentially owing to the release of large telomeric fragments or cNHEJ-independent fusion formation21 (Extended Data Figs. 8c, d, 9h).
Fig. 4 |. Telomere-driven autophagy requires the cGAS-STING pathway.
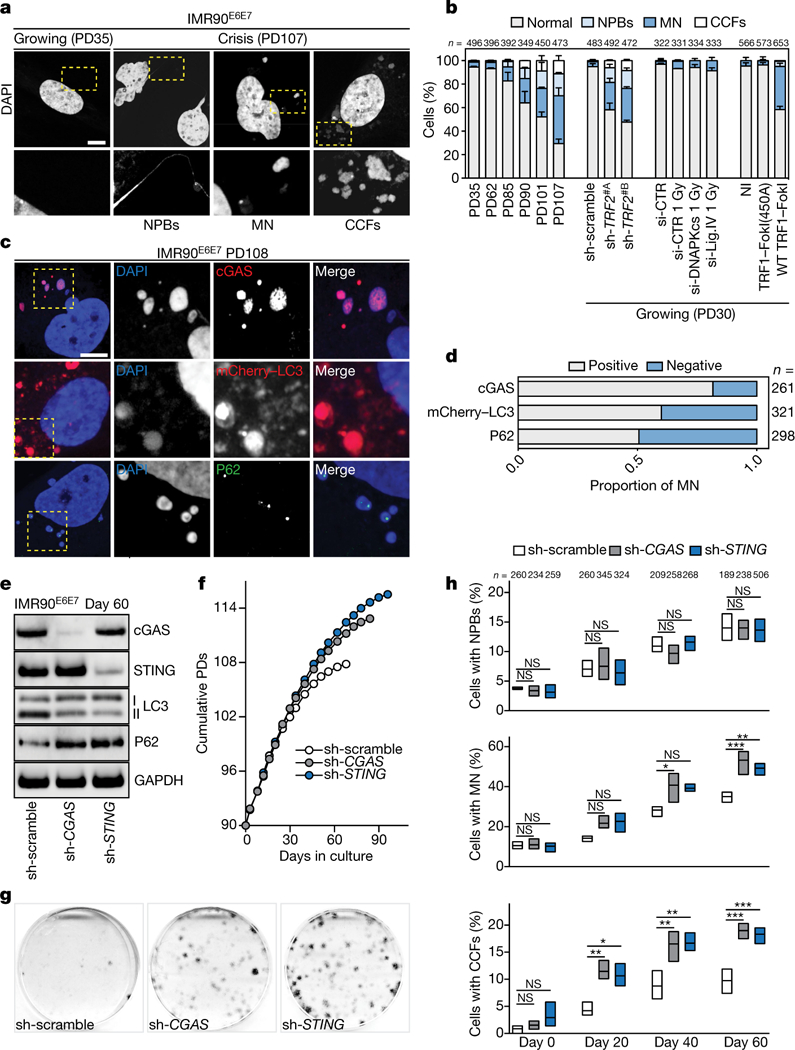
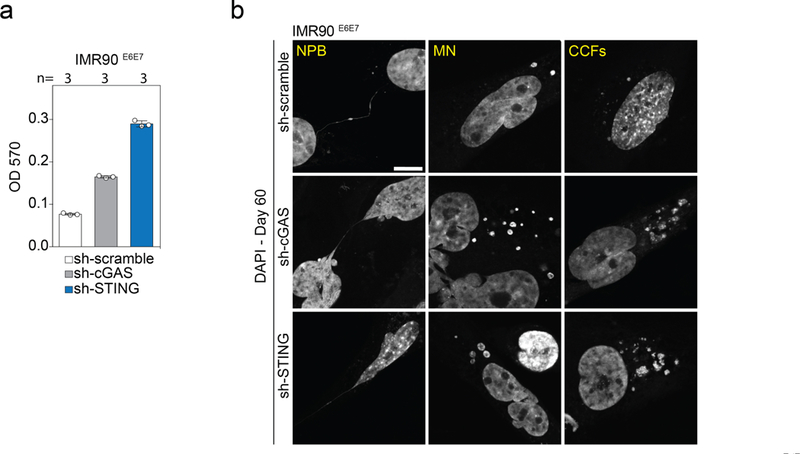
a, Confocal microscopy images of growing and crisis IMR90E6E7 cells stained with DAPI. Three independent experiments. Scale bar, 5 (μm. CCFs, cytoplasmic chromatin fragments; MN, micronuclei; NPBs, nucleoplasmic bridges. b, Grouped stacked bars showing the percentage of IMR90E6E7 cells with nucleoplasmic bridges, micronuclei and cytoplasmic chromatin fragments in cells approaching crisis, lacking TRF2 (sh-TRF2#A or sh-TRF2#B), challenged with intrachromosomal damage (ionizing radiation, IR) or telomeric damage (wild-type TRF1-FokI). Bars represent mean ± s.d. For intrachromosomal damage, cells were transfected with siRNA targeting DNAPKcs or ligase IV 48 h before damage. n shows number of cells analysed. Three independent experiments. c, Confocal microscopy images of crisis IMR90E6E7 cells expressing mCherry-LC3 or immunostained with antibodies against cGAS or P62. Two independent experiments. Scale bar, 5 μm. d, Grouped stacked bars showing the ratio of positive and negative micronuclei for each of the indicated stains. n shows number of micronuclei analysed. e, Immunoblotting of sh-scramble, sh-cGAS and sh-STING ImR90E6E7 cells at day 60 with GAPDH as loading control. One experiment. f, Growth curves of IMR90E6E7 cells expressing non-targeting control shRNA or shRNA against CGAS or sTlNG. g, Crystal violet cell viability assay of IMR90E6E7 cells expressing non-targeting shRNA or shRNA against CGAS or STING. One experiment. Quantification in Extended Data Fig. 10a. h, Floating bars showing the percentage of cells with nucleoplasmic bridges, micronuclei and cytoplasmic chromatin fragments. Centre line, mean; box limits, minimum and maximum. n shows number of cells analysed. Three independent experiments. One-way ANOVA; NS, not significant, *P < 0.05, **P < 0.01, ***P < 0.001. For gel source data, see Supplementary Fig. 1.
Cytoplasmic DNA can trigger the DNA-sensing cGAS-STING pathway, initiate the production of inflammatory cytokines22,23 and stimulate autophagy24. Cytosolic DNA in crisis cells colocalized with cGAS, mCherry-LC3 and P62 (Fig. 4c, d), and cGAS and STING were found to be essential for crisis, as IMR90E6E7 cells lacking cGAS or STING proliferated beyond crisis (Fig. 4e–g, Extended Data Fig. 10a). Bypass of crisis was associated with an attenuation of autophagy, indicated by a reduction in LC3-II and accumulation of P62 (Fig. 4e). The accumulation of micronuclei and cytoplasmic chromatin fragments was still significantly higher in cells lacking cGAS and STING, highlighting the hierarchy of the response to cytoplasmic DNA (Fig. 4h, Extended Data Fig. 10b).
Here we propose an essential role for the hyperactivation of autophagy in the death of cells during telomere crisis, probably through excessive elimination of vital cellular components. When autophagy or the ability to sense cytosolic DNA was inhibited, cells readily bypassed crisis and emerged as populations with unstable genomes and chromosomal aberrations. Autophagy has previously been implicated in preventing chromosomal instability and associated tumorigenesis25,26, which could be explained by our discovery that inhibition of autophagy prevents crisis and promotes genome instability. Considering that crisis represents the final barrier against the emergence of neoplastic cells and that autophagy is responsible for cell death in crisis, inhibition of autophagy as a cancer treatment could have the unwelcome side effect of increasing the frequency of neoplastic transformation.
METHODS
No statistical methods were used to predetermine sample size. The experiments were not randomized and the investigators were not blinded to allocation during experiments and outcome assessment.
Cell culture.
HMECs (CC-2551) and PrECs (CC-2555) were purchased as authenticated from Lonza. IMR90 (CCL-186) and WI38 (AG06814-N) cells were purchased as authenticated from ATCC and the Coriell Institute for Medical Research, respectively. HMECs were grown in the mammary epithelial cell medium complete kit (Lonza #C-21110) and PrECs in the prostalife medium complete kit (Lifeline Cell Technology #LL-0041). IMR90 and WI38 were grown in glutamax-Dulbecco’s modified Eagle’s medium (DMEM) (Gibco #10569–010) supplemented with 0.1 mM non-essential amino acids (Corning #25–025-Cl) and 15% fetal bovine serum (Fisher Scientific #SH3007103). Epithelial cells were grown at 5% CO2 and 3% O2 and fibroblasts at 7.5% CO2 and 3% O2. The number of PDs was calculated at each passage using the following equation: PD = log(number of counted cells/number of initial cells)/log2. Cells were tested and found to be free of mycoplasma.
Plasmids and transductions.
Non-coding untargeted shRNA (sh-scramble) was obtained from D. Sabatini through Addgene (plasmid 1864)27. shRNAs targeting ATG3, ATG5, ATG7, TRF2 (shRNA #A) and TRF1 were obtained in pLKO.1 from Sigma. sh-TRF2#B in pLKO.1 was obtained from Open Biosystems. The wild-type mCherry-EGFP-LC3B plasmid was obtained from J. Debnath through Addgene (plasmid 26477)28. The mCherry-GFP-LC3(G120A) construct was produced in our laboratory by site-directed mutagenesis PCR using the Quikchange II kit (Agilent #200523). The CDK4(R24C) plasmid was obtained from B. Weinberg through Addgene (plasmid #11254)29. Destabilization domain (DD)-oestrogen receptor (ER)-Flag-TRF1-FokIWT, wild-type DD-ER-mCherry-TRF1-FokI, DD-ER-mCherry-TRF1-FokI(450A) and DD-ER-AsiSI plasmids in pLVX-Ptuner were obtained from R. A. Greenberg15,17. HPV16E6E7, P53DD and SV40-LT plasmids in pLXSN3 were obtained from our laboratory2. Red fluorescent protein fused with a nuclear localization signal (RFP-NLS) in pLVXE plasmid was a gift from M. W. Hetzer, Salk Institute30.
Lentiviral particles encoding TRF1-FokI (wild type and 450A) and AsiSI were produced by the Gene Transfer, Targeting and Therapeutics (GT3) core at the Salk Institute. For the remaining plasmids, lentiviral and retroviral particles were produced by our laboratory. Production of lentivirus was performed as described31. In brief, 293FT cells were transfected with 7 μg DNA using the Lenti-X Packaging Single-Shot system (Clontech #631276). Forty-eight hours after transfection, viral supernatant was collected, supplemented with serum and used for transduction in the presence of Lenti-Blast (Oz Biosciences #LB00500).
For the production of retrovirus, cells were transfected with 20 μg DNA using 100 μM chloroquine. Five hours after transfection, fresh medium was added. Viral supernatant was collected 24 h later and used for transduction in the presence of polybrene (4 μg/ml). Forty-eight hours after infection, cells were washed and selected with 1 μg/ml puromycin, 600 μg/ml G418 (neomycin) or 90 μg/ml hygromycin. IMR90E6E7, WI38SV40 and PrECCDK4(R24C)/P53(DD) cells were subjected to long-term culturing under antibiotic selection.
Transfections.
DNA transfections were performed using Lipofectamine 3000 kit (Thermo Fisher #1857482) following the manufacturer’s instructions. siRNA transfections were performed using Lipofectamine RNAiMAX kit (Thermo Fisher #13778030) following the manufacturer’s instructions.
Western blotting.
Western blots were performed as described32. In brief, adherent and floating dead cells were lysed in NuPage LDS sample buffer (Invitrogen #NP0007) at 1 × 10⁴ cells per μl. Proteins were resolved using NuPage Bis-Tris gel electrophoresis (Invitrogen #NP0343, #NP0321, or #WG1402) and transferred to nitrocellulose membranes (Amersham #10600037). Secondary antibodies were peroxidase-conjugated anti-mouse IgG (Amersham #NXA931V) or anti-rabbit IgG (Amersham #NA934V). Peroxidase activity was detected using an ECL kit (Prometheus #20–302B) and Syngene G-Box imager. Primary antibodies are listed below.
Metaphase spreads for quantification of chromosome fusions.
Metaphase spreads were prepared as described33. In brief, cells were treated with 0.2 μg/ml colcemid (Gibco #15212–012) for 3 h, collected and incubated with hypotonic solution (75 mM KCl) for 7 min at 37 °C. The cell suspension was centrifuged, washed in fixative solution (3:1 methanol:glacial acetic acid), dropped on superfrost microscope slides (VWR #48311–703) and air-dried overnight.
For telomere and centromere double staining, cells were fixed in 4% formal-dehyde in PBS for 10 min, dehydrated in a series of ethanol baths (70%, 90% and 100%) for 3 min each and air-dried for 20 min. Cells were then covered in 0.3 ng/μl of the telomeric (PNA Bio #F1004) or centromeric (PNA Bio #F3002) PNA probes diluted in hybridization solution (70% deionized formamide; 0.25% blocking reagent (NEN), 10 mM Tris pH 7.5). Samples were heated for 5 min at 80 °C, incubated for 2 h at room temperature, washed twice in 70% formamide/10 mM TrisHCl pH 7.5 and three times in 50 mM TrisHCl pH 7.5/150 mM NaCl/0.08% Tween-20. Slides were finally mounted in ProLong Diamond with DAPI (Invitrogen #P36971).
Immunofluorescence and FISH (interphase nuclei and metaphase spreads).
For interphase nuclei, cells were seeded onto glass coverslips 24 h before the experiment as described33. Cells were washed in PBS, fixed in 4% formaldehyde in PBS for 10 min and permeabilized in 0.1% triton in PBS for 10 min. For metaphase spreads, cells were treated with 20 ng/ml colcemid (Gibco #15212–012) for 1 h, collected and incubated in hypotonic solution (27 mM KCl, 6.5 mM tri-sodium citrate) for 5 min. The cell suspension was cytocentrifuged, fixed in 4% formaldehyde in PBS for 10 min and permeabilized in KCM buffer (120 mM KCl, 20 mM NaCl, 10 mM Tris pH 7.5, 0.1% Triton) for 10 min.
In both settings, samples were incubated in blocking buffer (20 mM Tris pH 7.5, 2% BSA, 0.2% fish gelatin, 150 mM NaCl, 0.1% triton, 0.1% sodium azide, 100 μg/ml RNaseA) for 1 h at 37 °C. Cells were incubated with the primary antibody (γH2AX) for 2 h, washed in PBS and incubated with secondary antibody for 1 h at room temperature. Secondary antibodies used were AlexaFluor 568 anti-IgG mouse (ThermoFisher #A-11004) or AlexaFluor 647 anti-IgG mouse (ThermoFisher #A-21235). Samples were fixed in 4% formaldehyde in PBS before FISH.
Immunofluorescence.
Cells were seeded onto glass coverslips 24 h before the experiment. Cells were fixed in paraformaldehyde 4% PBS for 10 min, washed in PBS and incubated in blocking solution of BSA 5% PBS for 1 h at room temperature. Cells were then incubated with primary antibodies for 2 h, washed in PBS and incubated with secondary antibodies for 1 h at room temperature. Secondary antibodies used were AlexaFluor 488 anti-IgG rabbit (ThermoFisher #A-11034), AlexaFluor 488 anti-IgG goat (ThermoFisher #A-27012) and AlexaFluor 568 anti-IgG rabbit (ThermoFisher #A-10042). Samples were finally washed in PBS and mounted in ProLong Diamond with DAPI (Invitrogen #P36971). Imaging was performed using a Zeiss LSM 880 with Airyscan microscope and an Echo Revolve microscope (Echolabs). ZEN (Zeiss) and ImageJ softwares were used for microscope image analysis.
To assess autophagy flux, cells were either transiently transfected or transduced with retrovirus encoding wild-type mCherry-GFP-LC3 or mutant mCherry-GFP-LC3(G120A). Images were taken using an automated image acquisition and processing system and single-cell analysis was performed using ImageJ software. The number of autophagosomes was obtained by counting the number of GFP-LC3 dots. The number of autophagoslysosomes was obtained by subtracting the number of GFP-LC3 dots (autophagosomes) from the total number of mCherry-GFP-LC3 dots (autophagosomes and autolysosomes).
Mitotracker CMXRos mitochondrial staining.
Cells were seeded onto glass coverslips 24 h before the experiment. Mitotracker CMXRos (ThermoFisher #M7512) was added to the culture medium at a final concentration of200 nM and incubated for 20 min under tissue culture conditions. Following staining, cells were washed twice in pre-warmed PBS. Cells were then fixed in paraformaldehyde 4% PBS for 10 min and washed in PBS. Cells were then permeabilized using 0.02% v/v Triton-X 100/PBS to reduce background. Following a final wash with PBS, coverslips were mounted in ProLong Diamond with DAPI.
Crystal violet assay for determining cell viability.
Cells before crisis were seeded at low density (476 cells per cm2) and kept at 37 °C for 20 days before fixing with PFA 4% in PBS. Cells were then stained with 0.05% crystal violet in distilled water. Crystal violet was then re-dissolved in 2% SDS in distilled water and optical absorption was measured using the Infinite M1000 multifunctional microplate reader.
Telomere restriction fragment analysis.
The telomere restriction fragment (TRF) experiment was performed as described34. In brief, purified genomic DNA was digested with MboI and AluI (New England Biolabs), and separated by gel electrophoresis (0.6% agarose) in 0.5 × TBE buffer at 40 V overnight. For in-gel hybridization, the gel was dried at 50 °C for 2.5 h, denatured and neutralized. Hybridization was carried out in Church buffer containing a 32P-end-labelled TelG (TTAGGG)4 probe at 55 °C overnight. The gel was then washed 3 times for 30 min with 4 × SSC and once for 30 min with 4 × SSC + 0.1% SDS, exposed to a PhosphoImager screen and scanned in a Thyphoon 9400 PhosphoImager (Amersham, GE Healthcare). Finally, TRFs were analysed using ImageQuant software.
Transmission electron microscopy.
All cell types from different conditions were grown at about 70% confluence. Cell monolayers were fixed in 2% glutaraldehyde, 2% formaldehyde in 0.1 M sodium cacodylate, 2 mM CaCl2 under microwave irradiation (Pelco, BioWave Pro) for 10 s with a maximum temperature of 45 °C and an extra 20 min at room temperature. They were then post-fixed in buffered 1% osmium tetroxide for 30 min in the dark, scraped, pelleted and dehydrated with a graded acetone series (30%, 50%, 70%, 90%), ending with three washes at 100%. They were then embedded in Spurr epoxy resin (Ted Pella) and cured at 70 °C for 24 h. Ultrathin sections (50 nm) were obtained with a diamond knife (Diatome) in an ultramicrotome (Leica UC7) and collected on copper grids (300 mesh thin-bar). They were then post-stained with aqueous 1% uranyl acetate for 30 min in the dark before imaging in a Zeiss Libra 120 PLUS EF-TEM, operated at 120 kV. At least fifteen 4,000 × magnification images were taken from each experimental condition using a YAG CCD 2k camera at full resolution with Zemas Data Collection (Appfive) imaging software.
Annexin V/propidium iodide assay.
Annexin V/PI staining was performed as recommended by the supplier (V13242, Invitrogen). In brief, floating and adherent cells were collected and stained with annexin V and PI, and the percentage of dead cells (positive for both annexin V and PI) was measured by flow cytometry on BD-FACSCanto II. At least 10,000 events were collected in each analysis. Data analysis was performed using FlowJo software.
Chromosome painting.
M-FISH was performed as described35. In brief, seven pools of flow-sorted whole-chromosome painting probes were amplified and directly labelled using DEAC-, FITC-, Cy3-, TexasRed- and Cy5-conjugated nucleotides or biotin-dUTP and digoxigenin-dUTP, respectively, by degenerative oligonucleotide primed-PCR. Before hybridization, metaphase preparations were digested with pepsin (0.5 mg/ml; Sigma) in 0.2 M HCL (Roth) for 10 min at 37 °C, washed in PBS, post-fixed in 1% formaldehyde, dehydrated with a degraded ethanol series and air dried. Slides were denaturated in 70% formamide/1 × SSC/15% dextran sulfate for 2 min at 72 °C. A hybridization mixture consisting of 50% formamide, 2 × SSC, Cot1-DNA and labelled DNA probes was denaturated for 7 min at 75 °C, preannealed for 20 min at 37 °C and hybridized to the denaturated metaphase preparations. After 48 h incubation at 37 °C, slides were washed at room temperature in 2 × SSC (3 × 5 min), followed by 2 × 5 min in 0.2% SSC/0.2% Tween-20 at 56 °C. For indirect labelled probes, a two-step immunofu-orescence detection was carried out using biotinylated goat anti-avidin followed by streptavidin Laser Pro IR790, and rabbit anti-digoxin followed by goat antirabbit Cy5.5. Slides were washed in 4 × SSC/0.2% Tween-20, counterstained with 4.6-diamidino-2-phenylindole (DAPI) and covered with antifade solution. Images of 20 metaphase spreads were captured for each fluorochrome using highly specific filter sets (Chroma Technology), and processed using Leica MCK software (Leica Microsystems Imaging Solutions).
Cell cycle analysis.
BrdU (Sigma #B5002) was added to cell cultures at 30 μM for 30 min. Cells were fixed with 70% ethanol overnight at 4 °C, incubated with a freshly prepared pepsin solution (Sigma #P7000) for 20 min at 37 °C and incubated with 2 N HCl solution for 20 min at room temperature. After that, cells were washed in 1 × BU buffer (0.5% normal goat serum, 0.5% Tween 20, 20 mM HEPES) and incubated for 1 h at room temperature with rat anti-BrdU antibody (Bio-Rad #0BT0030). After washing with PBS, cells were incubated for 45 min with secondary antibody (anti-rat IgG-FITC conjugate, Southern Biotech #3030–02) diluted at 1:50 in BU buffer. Cells were finally incubated with PBS containing 4 μg ml−1 RNase A and 4 μg ml−1 PI for 30 min at 37 °C and then analysed by flow cytometry on BD-FACSCanto II. At least 10,000 events were collected in each analysis. Data analysis was performed using FlowJo software.
CytoPainter cell proliferation assay.
Staining was performed as recommended by the supplier (abcam #ab176735). In brief, cells were incubated with CytoLabelling green reagent and the median fluorescence intensity was measured by flow cytometry on BD-FACSCanto II at day 0 and day 3 post-labelling. At least 10,000 events were collected in each analysis. Data analysis was performed using FlowJo software.
Statistical analysis.
The number of independent experiments, the number of events and the statistical analysis for each figure are indicated in the legends. All statistical analyses were performed using GraphPad Prism 7 software and a oneway ANOVA test. ***P < 0.001, **P < 0.01, *P < 0.05, NS, non-significant.
Chemical reagents.
Staurosporine (Cell Signaling #9953); 4-OHT (Sigma #H7904); Shield1 (Clontech #632189); Bafilomycin A1 (Tocris #1334); MG132 (Selleckchem #S2619).
shRNAs.
Scramble (CCTAAGGTTAAGTCGCCCTCGCTCGAGCGAG GGCGACTTAACCTTAGG, pLKO.1, Addgene #1864); TRF#A (CCGGGCCAGAA TATCATTAGCGTTTCTCGAGAAACGCTAATGATATTCTGGCTTTTTG, pLKO.1, Sigma TRCN0000280026); TRF2#B (ACAGAAGCAGT GGTCGAAT C, pLK0.1,0pen Biosystems TRCN0000018358); TRF1 (CCGGTGAAAGCAGA ATACCTGTTTCCTCGAGGAAACAGGTATTCTGCTTTCATTTTTTG, pLKO.1, Sigma TRCN0000427961); ATG3 (CCGGCCTACCAACAGGCAAACAATTCT CGAGAATTGTTTGCCTGTTGGTAGGTTTTTG, pLKO.1, Sigma TRCN0000278562); ATG5 (CCGGGATTCATGGAATTGAGCCAATCTCG AGATTGGCTCAATTCCATGAATCTTTTTTG, pLKO.1, Sigma TRCN0000150645); ATG7 (CCGGGCTTTGGGATTTGACACATTTCTCGAGAAATGTGTCA AATCCCAAAGCTTTTT, pLKO.1, Sigma TRCN0000007586); CGAS (CCGGCGTGAAGATTTCTGCACCTAACTCGAGTTAGGTGCAGAAATC TTCACGTTTTTTG, pLKO.1, Sigma TRCN0000128706); STING (CCGGGCAGAGCTATTTCCTTCCACACTCGAGTGTGGAAGGAAATAG CTCTGCTTTTTTG, pLKO.1, Sigma TRCN0000163029).
siRNAs.
Non-targeting pool (UGGUUUACAUGUCGACUAA, UGGUUUACAU GUUGUGUGA, UGGUUUACAUGUUUUCUGA, UGGUUUACAUGUUU UCCUA); ATM (GCAAAGCCCUAGUAACAUA, GGUGUGAUCUUCA GUAUAU, GAGAGGAGACAGCUUGUUA, GAUGGGAGGCCUAGGAUUU); ligase IV (GCACAAAGAUGGAGAUGUA, GGGAGUGUCUCAUGUAAUA, GGUAUGAGAUUCUUAGUAG, GAAGAGGGAAUUAUGGUAA); DNAPKcs (GGAAGAAGCUCAUUUGAUU, GAGCAUCACUUGCCUUUAA, GCAGG ACCGUGCAAGGUUA, AGAUAGAGCUGCUAAAUGU); cGAS (GAAGAA ACAU GGCGGCUAU, AGGAAGCAACUACGACUAA, AGAACUAGAGU CACC CUAA, CCAAGAAGGCCUGCGCAUU); STING (UCAUAAACUUUGGAU GCUA, CGAACUCUCUCAAUGGUAU, AGCUGGGACUGCUGUUAAA, GCAGAUGACAGCAGCUUCU).
Antibodies.
TRF1, TRF2 (Karlseder laboratory), LC3 (Cell Signaling 2775 and 3868), caspase 3 (Cell Signalling 9662), cleaved caspase 3 (Asp175) (Cell Signalling 9661), PARP1 (Cell Signalling 9542), LAMP1 (Cell Signalling 15665), ATG3 (Cell Signalling 3415), ATG5 (Cell Signalling 2630), ATG7 (Cell Signalling 85585), P62 immunoblotting (Cell Signalling 5114), P62 immunofluorescence (Cell Signalling 7695), pRB (Cell Signalling 9309), P53 (Santa Cruz sc-126), P53 (Calbiochem PAb421), P21 (Cell Signalling DCS60), CDK4 (Cell Signalling 12790), P16 (Abcam ab51243), STING (Cell Signalling 13647), cGAS (Cell Signalling D1D3G), ligase IV (Cell Signalling 14649), ATM (Cell Signalling 2873), DNA-PKcs (Cell Signalling 4602), γH2AX (Millipore 05–636-I), LT (Cell Signalling D1E9E), lamin B1 (Santa Cruz sc-126), lamin A (Sigma L1293), γTubulin (Sigma T6657), GAPDH (Abnova PAB17013).
Extended Data
Extended Data Fig. 1 |. Characteristic features of fibroblasts and epithelial cells in crisis.
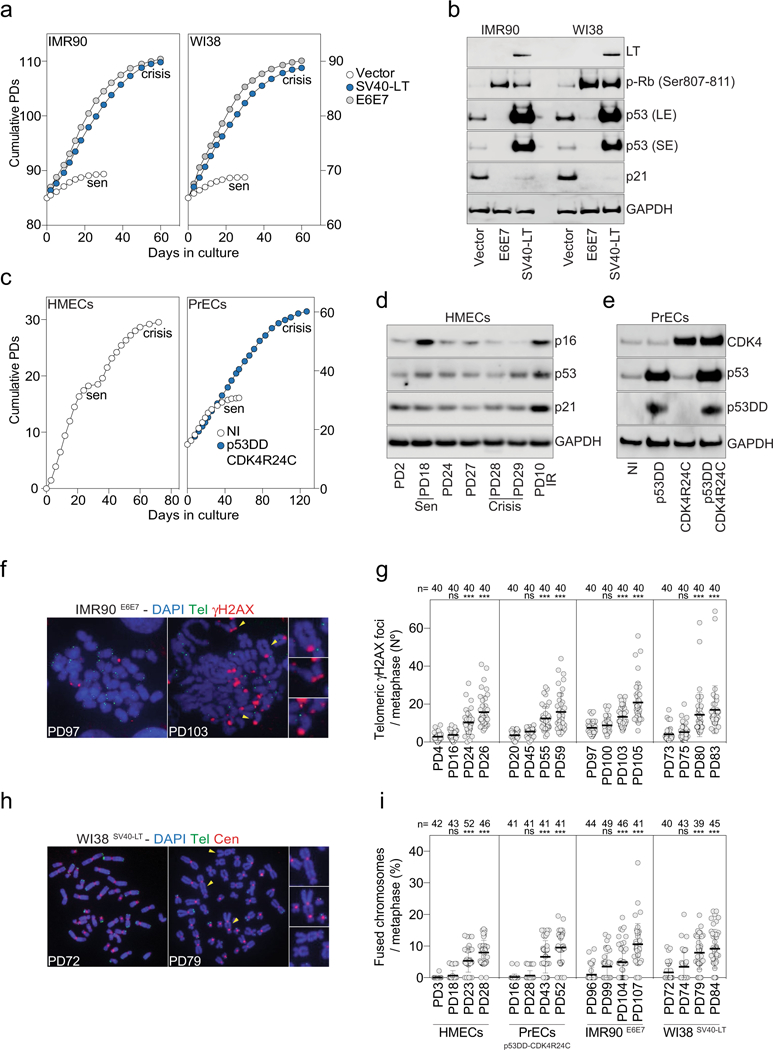
a, Growth curves of IMR90 and WI38 lung fibroblasts expressing empty vector or vectors encoding SV40-LT or HPV-16 E6E7. Senescence (sen) and crisis plateaus are indicated. b, Immunoblotting of IMR90 and WI38 lung fibroblasts upon expression of SV40-LT or HPV-16 E6E7 with GAPDH as loading control. Two independent experiments were performed. c, Growth curves of HMECs (left) and PrECs (right) expressing vectors encoding P53(DD) and CDK4(R24C). NI, non-infected PrECs. Senescence (sen) and crisis plateaus are indicated. d, Immunoblotting of HMECs that spontaneously bypass senescence (sen) and enter crisis with GAPDH as loading control. Two independent experiments were performed. e, Immunoblotting of PrECs upon expression of P53(DD) and CDK4(R24C) with GAPDH as loading control. Two independent experiments were performed. f, Metaphase chromosomes of growing (PD97) and pre-crisis (PD103) IMR90E6E7 cells. DAPI staining in blue, telomeres in green and γH2AX in red. Two independent experiments were performed. g, Scatter plot showing the number of telomeric γH2AX foci per metaphase. Centre line, mean; error bars, ± s.d. n shows number of metaphases analysed. Two independent experiments were performed. One-way ANOVA; ns, not significant, ***P < 0.001. h, Metaphase chromosomes of growing (PD72) and pre-crisis (PD79) WI38SV40 cells. DAPI staining in blue, telomeres in green and centromeres in red. Two independent experiments were performed. i, Scatter plot showing the number of fused chromosomes per metaphase. n shows number of metaphases analysed. Centre line, mean; error bars, ± s.d. n shows number of metaphases analysed. Two independent experiments were performed. One-way ANOVA; ns, not significant, ***P < 0.001. For gel source data, see Supplementary Fig. 1.
Extended Data Fig. 2 |. Cells in crisis show characteristics of autophagy and not apoptosis.
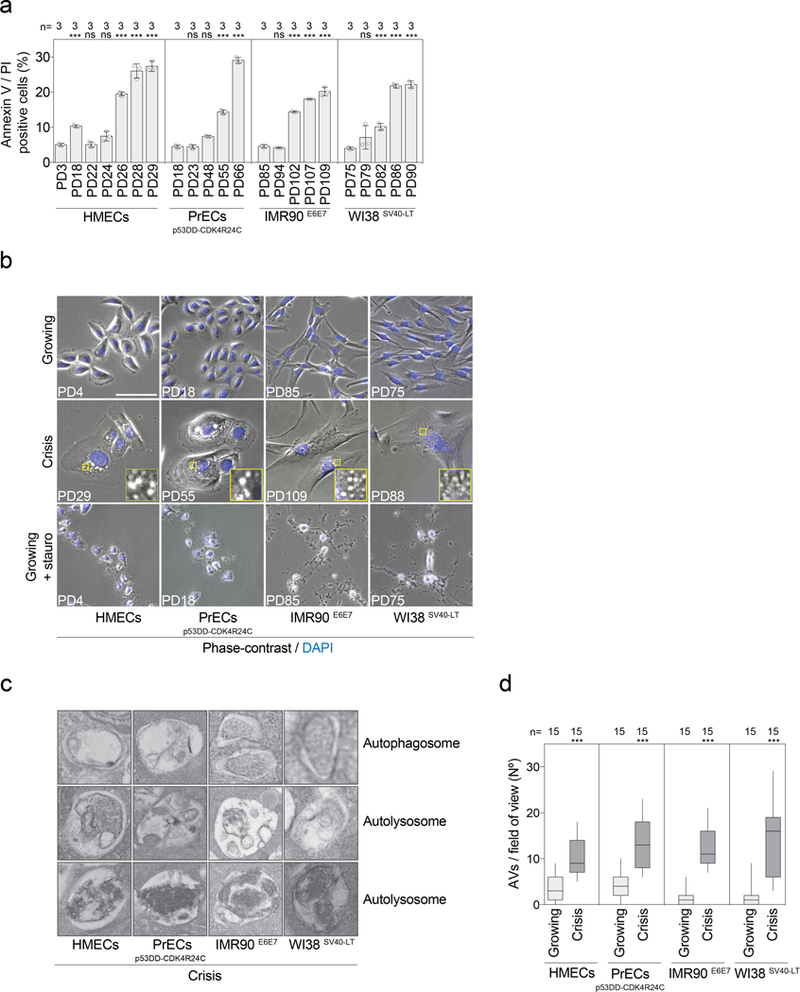
a, Cells at the indicated population doublings were stained with annexin V and PI and the percentages of double-positive cells were measured by flow cytometry. Scatter plot with bars showing the percentage of dying cells approaching crisis. Bars represent mean ± s.d. n indicates number of samples analysed. One experiment was performed. One-way ANOVA; ns, not significant, ***P < 0.001. b, Representative phase contrast and fluorescence images of growing, crisis, and staurosporine-treated growing cells (1 μM for 6 h). DAPI staining in blue. One experiment was performed. Scale bar, 50 μm. c, Representative electron micrographs of autophagy-related structures present in crisis fibroblasts and epithelial cells. The images show double-membraned autophagosomes and simple-membraned autolysosomes with cargo at different stages of digestion. Two experiments were performed. d, Box and whisker plots showing the number of autophagic vacuoles per field of view. Centre line, median; box limits, first and third quartiles; whiskers, minimum and maximum. n shows number of images analysed. One-way ANOVA; ***P < 0.001. AVs, autophagic vacuoles. For gel source data, see Supplementary Fig. 1.
Extended Data Fig. 3 |. Autophagy activation in crisis cells.
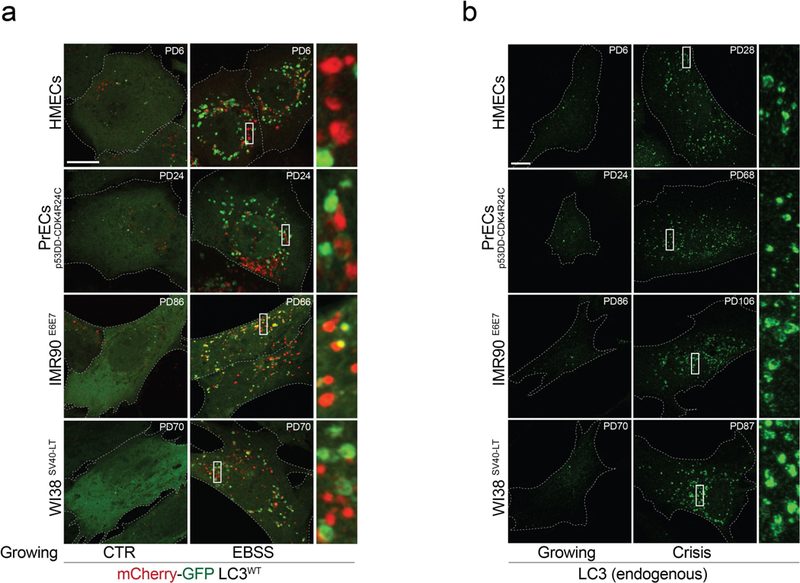
a, Representative confocal microscopy images of growing fibroblasts and epithelial cells expressing wild-type mCherry-GFP-LC3 (mCherry-GFP-LC3wt). Cells were grown in complete growth medium (CTR) or Earle’s balanced salt solution (EBSS) (1 h). One experiment was performed. Scale bar, 10 μm. b, LC3 immunofluorescence performed on growing and crisis fibroblasts and epithelial cells. Representative confocal microscopy images. One experiment was performed. Scale bar, 10 μm. For gel source data, see Supplementary Fig. 1.
Extended Data Fig. 4 |. Inhibition of autophagy promotes crisis bypass.
a, Immunoblotting of HMECs and IMR90E6E7 cells expressing non-targeting control shRNA or shRNA against ATG3, ATG5 or ATG7 with GAPDH as loading control. Two experiments were performed. b, Measurement of cell proliferation rates in growing HMECs (PD22) and IMR90E6E7 cells (PD90) expressing non-targeting control shRNA or shRNA against ATG3, ATG5 or ATG7. Cells were stained with CytoLabelling Green Reagent dye and the fluorescence intensity was measured by flow cytometry at day 0 and day 3 post-labelling. Left, plots showing the difference in fluorescence intensity between day 0 and day 3. Right, scatter plots with bars showing the difference in median fluorescence intensity between day 0 and day 3 in HMECs and IMR90E6E7 cells. Bars represent mean ± s.d. n shows number of independent experiments. One-way ANOVA; ns, not significant. c, Dot plots of cell cycle distribution of growing HMECs (PD22) and IMR90E6E7 cells (PD90) expressing non-targeting control shRNA or shRNA against ATG3, ATG5 or ATG7. Three experiments were performed. d, Scatter plots with bars showing the mean percentage of cells in G1, S and G2/M cell cycle phases. Bars represent mean ± s.d. n shows number of independent experiments. One-way ANOVA; ns, not significant. e, Quantification of crystal violet staining. Scatter plot with bars showing the optic density of crystal violet solutions. Bars represent mean ± s.d. n shows number of replicates. One experiment was performed. OD, optical density. For gel source data, see Supplementary Fig. 1.
Extended Data Fig. 5 |. Crisis bypass is associated with DNA damage signalling.
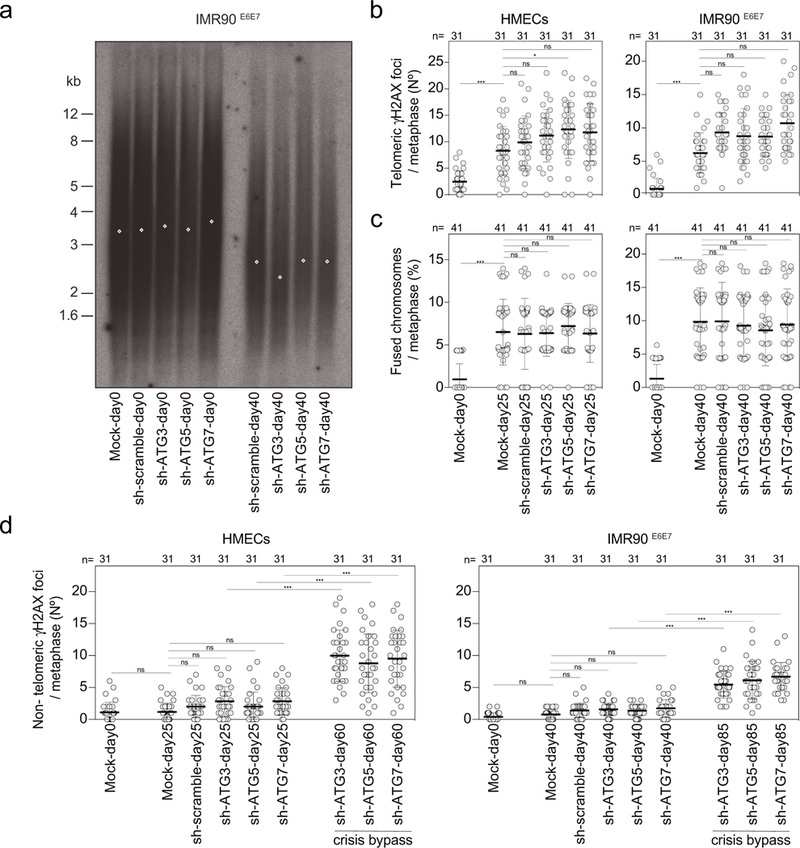
a, TRF analysis of IMR90E6E7 cells expressing non-targeting control shRNA or shRNA against ATG3, ATG5 or ATG7. Genomic DNA was prepared from parental cells (day 0) or cells before crisis (day 40). Two experiments were performed. b, Scatter plots showing the number of telomeric γH2AX foci per metaphase in HMECs and IMR90E6E7 cells expressing non-targeting control shRNA or shRNA against ATG3, ATG5 or ATG7. Centre line, mean; error bars, ± s.d. Samples were taken at the indicated days. n shows number of metaphases analysed. One experiment was performed. One-way ANOVA; ns, not significant, *P < 0.05, ***P < 0.001. c, Scatter plots showing the number of fused chromosomes per metaphase in HMECs and IMR90E6E7 cells expressing non-targeting control shRNA or shRNA against ATG3, ATG5 or ATG7. Centre line, mean; error bars, ± s.d. Samples were taken at the indicated days. n shows number of metaphases analysed. Two experiments were performed. One-way ANOVA; ns, not significant, ***P < 0.001. d, Scatter plots showing the number of non-telomeric γH2AX foci per metaphase in HMECs and IMR90E6E7 cells expressing non-targeting control shRNA or shRNA against ATG3, ATG5 or ATG7. Centre line, mean; error bars, ± s.d. Samples were taken at the indicated days. n shows number of metaphases analysed. One experiment was performed. One-way ANOVA; ns, not significant, *P < 0.05, ***P < 0.001. For gel source data see Supplementary Fig. 1.
Extended Data Fig. 6 |. Telomere dysfunction activates autophagy.
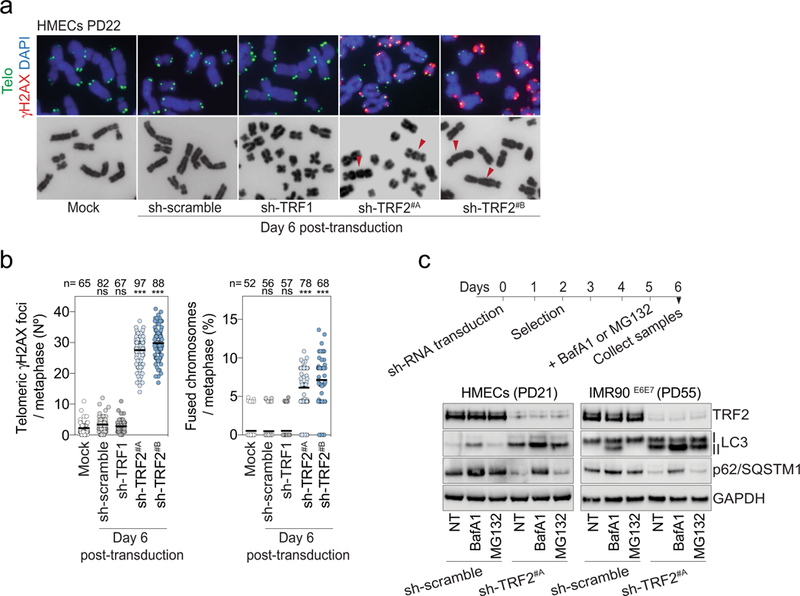
a, Metaphase chromosomes of post-senescent HMECs (PD22) expressing non-targeting control shRNA or shRNA against TRF1 or TRF2. Metaphases were prepared from cells at day 6 post-transduction. Mock represents non-transduced cells. DAPI staining in blue, telomeres in green and γH2AX in red. Arrowheads indicate chromosome fusion events. Two independent experiments were performed. b, Left, scatter plot showing the mean number of telomeric γH2AX foci per metaphase at day 6 post-transduction. Right, scatter plot showing the number of fused chromosomes per metaphase at day 6 post-transduction. Centre line, mean. n shows number of metaphases analysed. Two independent experiments were performed. One-way ANOVA; ns, not significant, ∗∗∗P < 0.001. c, LC3-II and P62 turnover assays. HMECs and IMR90E6E7 cells expressing non-targeting control shRNA or shRNA targeting TRF2 at day 6 post-transduction were treated for bafilomycin A1 (50 nM for 24 h) or MG132 (10 μM for 24 h). Top, experimental timeline. Bottom, immunoblotting of HMECs and IMR90E6E7 cells at day 6 posttransduction with GAPDH as loading control. One experiment was performed. For gel source data, see Supplementary Fig. 1.
Extended Data Fig. 7 |. Telomere dysfunction activates autophagy.

a, Box and whisker plots showing the number of telomeric and non-telomeric γH2AX foci per cell upon increasing doses of ionizing radiation (IR), bleocin, or Shield1-based AsiSI, catalytically inactive TRF1-FokI(450A), or wild-type TRF1-FokI 1 h after damage induction. Centre line, median; box limits, first and third quartiles; whiskers, 10th and 90th percentiles. Cells used are post-senescent HMECs (PD23). Two independent experiments were performed. n shows number of cells analysed. One-way ANOVA; ns, not significant, *P < 0.05, **P < 0.01, ***p < 0.001. b, Post-senescent HMECs (PD23) were transfected with non-targeting siRNA or siRNA targeting DNAPKcs or ligase IV 48 h before damage induction. Representative confocal images of cells before damage, and 1 h or 48 h post-damage. DAPI staining in blue, telomeres in green and γH2AX in red. Two independent experiments were performed. c, Box and whisker plots showing the number of γH2AX foci per cell at 1, 12, 24 and 48 h after damage induction, as in a. d, Immunoblotting of IMR90E6E7 cells (PD40) at 12, 24 and 48 h post-induction of TRF1-FokI(450A) or wild-type TRF1-FokI. Mock represents non-transduced cells. GAPDH loading control. Two independent experiments were performed. e, LC3-II and P62 turnover assays. Control (non-induced) and wild-type TRF1-FokI-expressing cells were treated with bafilomycin A1 (50 nM for 24 h) or MG132 (10 μM for 24 h). Top, experimental timeline. Bottom, immunoblotting of HMECs and IMR90E6E7 cells before and 48 h after induction of wild-type TRF1-FokI. GAPDH loading control. One experiment was performed. For gel source data, see Supplementary Fig. 1.
Extended Data Fig. 8 |. Crisis cells display cytosolic DNA species.
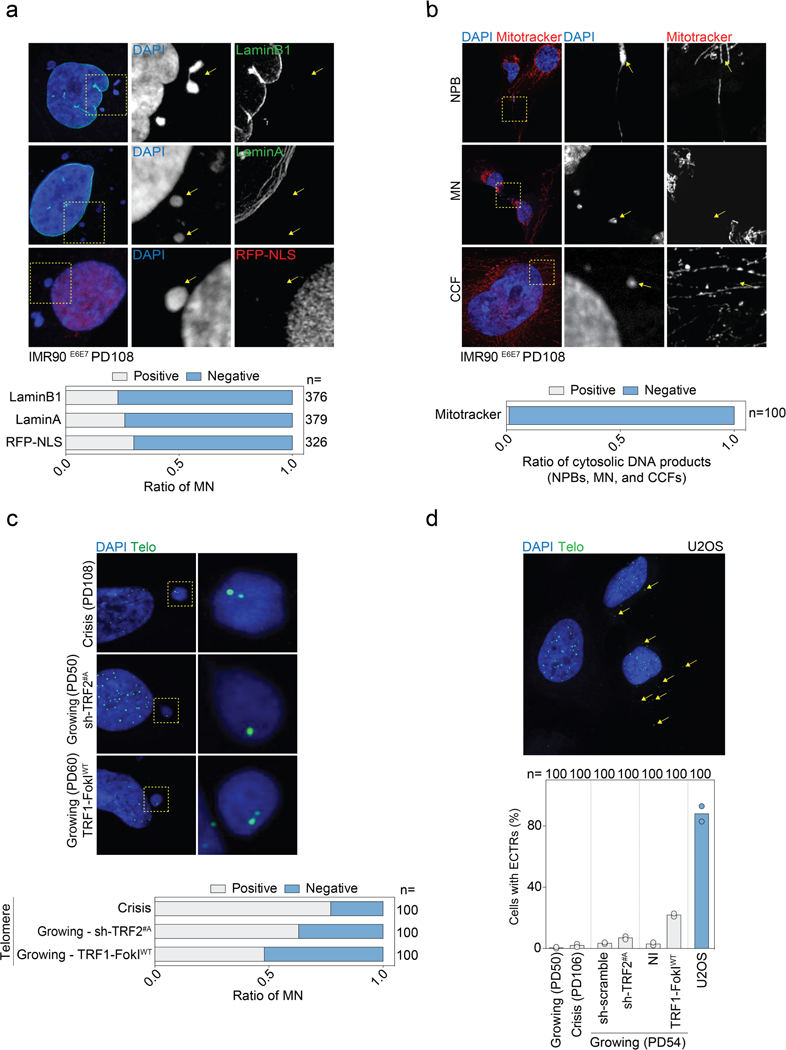
a, Top, representative confocal microscopy images of crisis IMR90E6E7 cells (PD108) expressing RFP-NLS or immunostained with antibodies against lamin A or lamin B1. Bottom, grouped stacked bars showing the ratio of positive and negative micronuclei for each of the indicated stains. n shows number of micronuclei analysed. b, Top, representative confocal microscopy images of crisis IMR90E6E7 cells (PD108) immunostained with mitotracker dye. Bottom, grouped stacked bars showing the ratio of positive and negative cytosolic DNA products for mitotracker staining. n shows number of cytosolic DNA products analysed. c, Top, representative confocal microscopy images of crisis IMR90E6E7 cells, growing IMR90E6E7 cells expressing shRNA targeting TRF2 (day 6 post-transduction) or growing IMR90E6E7 cells expressing wild-type TRF1-FokI (48 h post-induction). The corresponding population doublings are indicated. DAPI staining in blue, telomeres in green. Bottom, grouped stacked bars showing the ratio of positive and negative micronuclei for telomeres. n shows number of micronuclei analysed. d, Top, representative confocal image of U2OS cells displaying extrachromosomal telomeric repeat (ECTR) DNA. Bottom, scatter plot with bars showing the percentage of IMR90E6E7 and U2OS cells positive for ECTRs. Growing and crisis IMR90E6E7 cells, growing IMR90E6E7 cells expressing shRNA targeting TRF2 (day 6 post-transduction) and growing IMR90E6E7 cells expressing wild-type TRF1-FokI (48 h post-induction) were used. Bars represent mean. The corresponding population doublings are indicated. Two independent experiments were performed. n shows number of cells analysed. For gel source data, see Supplementary Fig. 1.
Extended Data Fig. 9 |. Telomere fusion is required for autophagy activation.
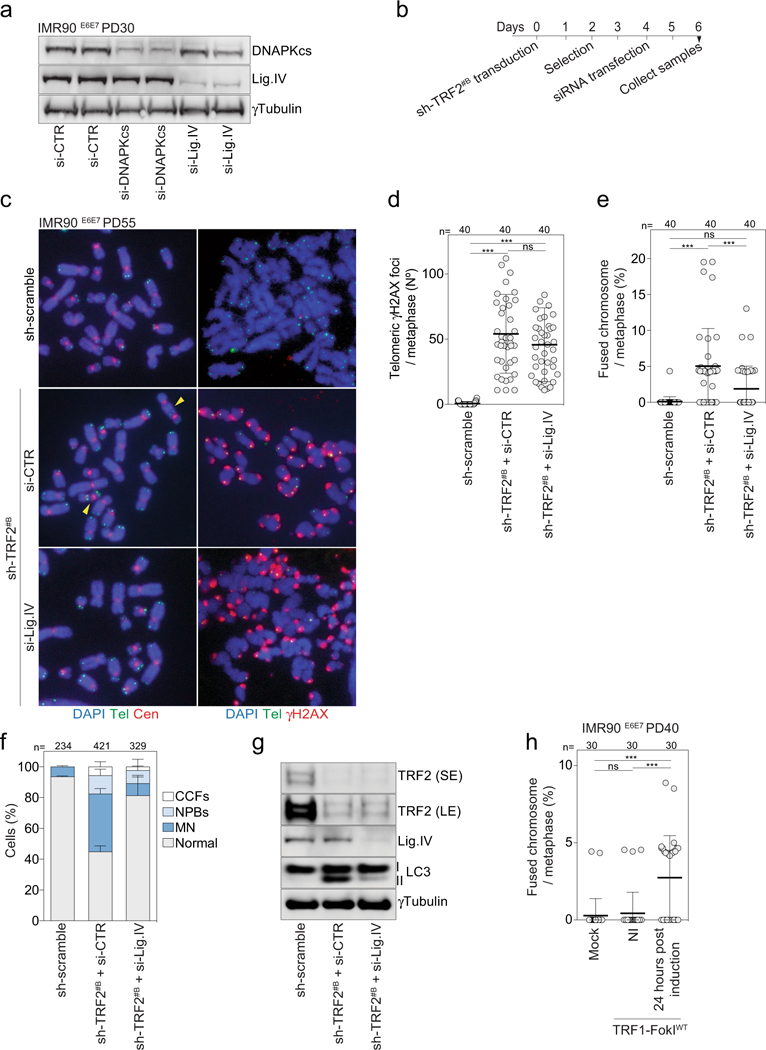
a, Immunoblotting of growing IMR90E6E7 cells (PD30) upon siRNA targeting DNAPKcs or ligase IV 48 h post-transfection (experiment in Fig. 4b). γTubulin loading control. Two independent experiments were performed. b, Experimental timeline for c-g. c, Metaphase chromosomes of growing IMR90E6E7 cells (PD55) upon shRNA targeting of TRF2 and siRNA targeting of ligase IV at day 6 post-transduction. Left, DAPI staining in blue, telomeres in green and centromeres in red. Arrowheads indicate chromosome fusion events. Two independent experiments were performed. d, Scatter plot showing the number of telomeric γH2AX foci per metaphase. Centre line, mean; error bars, ± s.d. n shows number of metaphases analysed. Two experiments were performed. One-way ANOVA, ns: not significant, ***P < 0.001. e, Scatter plots showing the number of fused chromosomes per metaphase, as in d. f, Grouped stacked bars showing the percentage of IMR90E6E7 cells with nucleoplasmic bridges, micronuclei and cytoplasmic chromatin fragments upon shRNA targeting TRF2 and siRNA targeting ligase IV. Bars represent mean ± s.d. n shows number of cells analysed. Three experiments were performed. g, Immunoblotting of IMR90E6E7 cells upon shRNA targeting TRF2 and siRNA targeting ligase IV with γtubulin as loading control. One experiment was performed. h, Scatter plot showing the number of fused chromosomes per metaphase 48 h after induction of wild-type TRF1-FokI, as in d. For gel source data, see Supplementary Fig. 1.
Extended Data Fig. 10 |. cGAS-STING pathway is required for telomere-driven autophagy.
a, Quantification of crystal violet staining. Scatter plot with bars showing the optic density of crystal violet solutions. Bars represent mean ± s.d. n shows number of replicates. One experiment was performed. b, Representative confocal microscopy images of IMR90E6E7 cells expressing sh-scramble or shRNA targeting CGAS or STING with DAPI staining. Three independent experiments were performed. Scale bar, 10 μm. For gel source data, see Supplementary Fig. 1.
Supplementary Material
Acknowledgements
Data are archived at the Salk Institute. We thank P Adams for discussions and U. Manor and L. Andrade in the Waitt Advanced Biophotonic Core for transmission electron microscopy experiments. J.N. was supported by EMBO (ALTF213–2016) and the Hewitt Foundation. R.R. was supported by the Paul F Glenn Center for Biology of Aging Research. The Salk Institute Cancer Center Core Grant (P30CA014195), the NIH (R01CA227934, GM087476, R01CA174942), the Donald and Darlene Shiley Chair and the Helmsley, Auen and Highland Street Foundations support J.K.
Footnotes
Reviewer information Nature thanks M. Narita and the other anonymous reviewer(s) for their contribution to the peer review of this work.
Competing interests The authors declare no competing interests.
Additional information
Extended data is available for this paper at https://doi.org/10.1038/s41586-019-0885-0.
Supplementary information is available for this paper at https://doi.org/10.1038/s41586-019-0885-0.
Publisher’s note: Springer Nature remains neutral with regard to jurisdictional claims in published maps and institutional affiliations.
Online content
Any methods, additional references, Nature Research reporting summaries, source data, statements of data availability and associated accession codes are available at https://doi.org/10.1038/s41586–019-0885–0.
Data availability
All data generated or analysed during this study are included in this published article (and its Supplementary Information files). Reagents are available from J.K. upon reasonable request.
References
- 1.Wei W & Sedivy JM Differentiation between senescence (M1) and crisis (M2) in human fibroblast cultures. Exp. Cell Res. 253, 519–522 (1999). [DOI] [PubMed] [Google Scholar]
- 2.Hayashi MT, Cesare AJ, Rivera T & Karlseder J Cell death during crisis is mediated by mitotic telomere deprotection. Nature 522, 492–496 (2015). [DOI] [PMC free article] [PubMed] [Google Scholar]
- 3.Maciejowski J & de Lange T Telomeres in cancer: tumour suppression and genome instability. Nat. Rev. Mol. Cell Biol. 18, 175–186 (2017). [DOI] [PMC free article] [PubMed] [Google Scholar]
- 4.Artandi SE & DePinho RA A critical role for telomeres in suppressing and facilitating carcinogenesis. Curr. Opin. Genet. Dev. 10, 39–46 (2000). [DOI] [PubMed] [Google Scholar]
- 5.Steinberg ML & Defendi V Transformation and immortalization of human keratinocytes by SV40. J. Invest. Dermatol. 81, 131s–136s (1983). [DOI] [PubMed] [Google Scholar]
- 6.Le Poole IC et al. Generation of a human melanocyte cell line by introduction of HPV16 E6 and E7 genes. In Vitro Cell. Dev. Biol. Anim. 33, 42–49 (1997). [DOI] [PubMed] [Google Scholar]
- 7.Romanov SR et al. Normal human mammary epithelial cells spontaneously escape senescence and acquire genomic changes. Nature 409, 633–637 (2001). [DOI] [PubMed] [Google Scholar]
- 8.Kiyono T et al. Both Rb/p16INK4a inactivation and telomerase activity are required to immortalize human epithelial cells. Nature 396, 84–88 (1998). [DOI] [PubMed] [Google Scholar]
- 9.Pankiv S et al. p62/SQSTM1 binds directly to Atg8/LC3 to facilitate degradation of ubiquitinated protein aggregates by autophagy. J. Biol. Chem. 282, 24131–24145 (2007). [DOI] [PubMed] [Google Scholar]
- 10.Yamamoto A et al. Bafilomycin A1 prevents maturation of autophagic vacuoles by inhibiting fusion between autophagosomes and lysosomes in rat hepatoma cell line, H-4-II-E cells. Cell Struct. Fund 23, 33–42 (1998). [DOI] [PubMed] [Google Scholar]
- 11.Bampton ET, Goemans CG, Niranjan D, Mizushima N & Tolkovsky AM The dynamics of autophagy visualized in live cells: from autophagosome formation to fusion with endo/lysosomes. Autophagy 1, 23–36 (2005). [DOI] [PubMed] [Google Scholar]
- 12.Tanida I et al. Consideration about negative controls for LC3 and expression vectors for four colored fluorescent protein-LC3 negative controls. Autophagy 4, 131–134 (2008). [DOI] [PubMed] [Google Scholar]
- 13.Takai H, Smogorzewska A & de Lange T DNA damage foci at dysfunctional telomeres. Curr. Biol. 13, 1549–1556 (2003). [DOI] [PubMed] [Google Scholar]
- 14.van Steensel B, Smogorzewska A & de Lange T TRF2 protects human telomeres from end-to-end fusions. Cell 92, 401–413 (1998). [DOI] [PubMed] [Google Scholar]
- 15.Cho NW, Dilley RL, Lampson MA & Greenberg RA Interchromosomal homology searches drive directional ALT telomere movement and synapsis. Cell 159, 108–121 (2014). [DOI] [PMC free article] [PubMed] [Google Scholar]
- 16.Caron P et al. Non-redundant functions of ATM and DNA-PKcs in response to DNA double-strand breaks. Cell Reports 13, 1598–1609 (2015). [DOI] [PMC free article] [PubMed] [Google Scholar]
- 17.Harding SM et al. Mitotic progression following DNA damage enables pattern recognition within micronuclei. Nature 548, 466–470 (2017). [DOI] [PMC free article] [PubMed] [Google Scholar]
- 18.Fumagalli M et al. Telomeric DNA damage is irreparable and causes persistent DNA-damage-response activation. Nat. Cell Biol. 14, 355–365 (2012). [DOI] [PMC free article] [PubMed] [Google Scholar]
- 19.Gisselsson D et al. Telomere dysfunction triggers extensive DNA fragmentation and evolution of complex chromosome abnormalities in human malignant tumors. Proc. Natl Acad. Sci. USA 98, 12683–12688 (2001). [DOI] [PMC free article] [PubMed] [Google Scholar]
- 20.Chen YA et al. Extrachromosomal telomere repeat DNA is linked to ALT development via cGAS-STING DNA sensing pathway. Nat. Struct. Mol. Biol. 24, 1124–1131 (2017). [DOI] [PubMed] [Google Scholar]
- 21.Doksani Y & de Lange T Telomere-internal double-strand breaks are repaired by homologous recombination and PARP1/Lig3-dependent end-joining. Cell Reports 17, 1646–1656 (2016). [DOI] [PMC free article] [PubMed] [Google Scholar]
- 22.Ishikawa H, Ma Z & Barber GN STING regulates intracellular DNA-mediated, type I interferon-dependent innate immunity. Nature 461, 788–792 (2009). [DOI] [PMC free article] [PubMed] [Google Scholar]
- 23.Sun L, Wu J, Du F, Chen X & Chen ZJ Cyclic GMP-AMP synthase is a cytosolic DNA sensor that activates the type I interferon pathway. Science 339, 786–791 (2013). [DOI] [PMC free article] [PubMed] [Google Scholar]
- 24.Comb WC, Cogswell P, Sitcheran R & Baldwin AS IKK-dependent, NF-κB-independent control of autophagic gene expression. Oncogene 30, 1727–1732 (2011). [DOI] [PMC free article] [PubMed] [Google Scholar]
- 25.Mathew R et al. Autophagy suppresses tumor progression by limiting chromosomal instability. Genes Dev. 21, 1367–1381 (2007). [DOI] [PMC free article] [PubMed] [Google Scholar]
- 26.Karantza-Wadsworth V et al. Autophagy mitigates metabolic stress and genome damage in mammary tumorigenesis. Genes Dev. 21, 1621–1635 (2007). [DOI] [PMC free article] [PubMed] [Google Scholar]
- 27.Sarbassov DD, Guertin DA, Ali SM & Sabatini DM Phosphorylation and regulation of Akt/PKB by the rictor-mTOR complex. Science 307, 1098–1101 (2005) [DOI] [PubMed] [Google Scholar]
- 28.N’Diaye E-N et al. PLIC proteins or ubiquilins regulate autophagy-dependent cell survival during nutrient starvation. EMBO Rep. 10, 173–179 (2009). [DOI] [PMC free article] [PubMed] [Google Scholar]
- 29.Hahn WC et al. Enumeration of the simian virus 40 early region elements necessary for human cell transformation. Mol. Cell. Biol. 22, 2111–2123 (2002). [DOI] [PMC free article] [PubMed] [Google Scholar]
- 30.Hatch EM, Fischer AH, Deerinck TJ & Hetzer MW Catastrophic nuclear envelope collapse in cancer cell micronuclei. Cell 154, 47–60 (2013). [DOI] [PMC free article] [PubMed] [Google Scholar]
- 31.Arnoult N et al. Regulation of DNA repair pathway choice in S and G2 phases by the NHEJ inhibitor CYREN. Nature 549, 548–552 (2017). [DOI] [PMC free article] [PubMed] [Google Scholar]
- 32.O’Sullivan RJ, Kubicek S, Schreiber SL & Karlseder J Reduced histone biosynthesis and chromatin changes arising from a damage signal at telomeres. Nat. Struct. Mol. Biol. 17, 1218–1225 (2010). [DOI] [PMC free article] [PubMed] [Google Scholar]
- 33.Cesare AJ et al. Spontaneous occurrence of telomeric DNA damage response in the absence of chromosome fusions. Nat. Struct. Mol. Biol. 16, 1244–1251 (2009). [DOI] [PubMed] [Google Scholar]
- 34.Karlseder J, Smogorzewska A & de Lange T Senescence induced by altered telomere state, not telomere loss. Science 295, 2446–2449 (2002). [DOI] [PubMed] [Google Scholar]
- 35.Geigl JB, Uhrig S & Speicher MR Multiplex-fluorescence in situ hybridization for chromosome karyotyping. Nat. Protocols 1, 1172–1184 (2006) [DOI] [PubMed] [Google Scholar]
Associated Data
This section collects any data citations, data availability statements, or supplementary materials included in this article.