Abstract
Background
Seasonal variations may exist in transitioning to dialysis, kidney transplantation and related outcomes among end-stage renal disease (ESRD) patients. Elucidating these variations may have major clinical and healthcare policy implications for better resource allocation across seasons.
Methods
Using the United States Renal Data System database from 1 January 2000 to 31 December 2013, we calculated monthly counts of transitioning to dialysis or first transplantation and deaths. Crude monthly transition fraction was defined as the number of new ESRD patients divided by all ESRD patients on the first day of each month. Similar fractions were calculated for all-cause and cause-specific mortality and transplantation.
Results
The increasing trend of the annual transition to ESRD plateaued during 2009–2012 (n = 126 264), and dropped drastically in 2013 (n = 117 372). Independent of secular trends, monthly transition to ESRD was lowest in July (1.65%) and highest in January (1.97%) of each year. All-cause, cardiovascular and infectious mortalities were lowest in July or August (1.32, 0.58 and 0.15%, respectively) and highest in January (1.56, 0.71 and 0.19%, respectively). Kidney transplantation was highest in June (0.33%), and this peak was mainly attributed to living kidney transplantation in summer months. Transplant failure showed a similar seasonal variation to naïve transition, peaking in January (0.65%) and nadiring in September (0.56%).
Conclusions
Transitioning to ESRD and adverse events among ESRD people were more frequent in winter and less frequent in summer, whereas kidney transplantation showed the reverse trend. The potential causes and implications of these consistent seasonal variations warrant more investigation.
Keywords: ESRD, hemodialysis, kidney transplantation, mortality, peritoneal dialysis
INTRODUCTION
Seasonal variations have been reported in various disease conditions, including infection, cardiovascular disease and mortality. During winter, there is a peak in the recurrence of respiratory infection host pathogens and in the incidence of associated sepsis [1], which may, in part, be explained by cold air, low humidity and host physiology [2–4]. Blood pressure rises in the winter, and drops in summer in relationship to ambient temperature, especially among the elderly [5]. High sympathetic nervous system activity is observed in winter, whereas cutaneous vasodilatation and loss of water and salt from sweating is the suggested mechanism for low blood pressure in summer [6]. The incidence of chronic heart failure, coronary heart disease and stroke are also highest in winter [7–11], and there may be a link between infection and cardiovascular disease through endothelial dysfunction and activation of the inflammatory and coagulation system [12–17]. Indeed, previous studies estimated that ∼10–20% of heart failure is attributable to respiratory disease [14–16], and another recent study from the USA also confirmed the association of influenza-like illness with cardiovascular mortality [17].
Patients with end-stage renal disease (ESRD) requiring dialysis treatment are at high risk of cardiovascular disease and infection. These conditions account for the first and second leading causes of death [18], and contribute to the higher mortality of this population compared with that of patients with cancer, congestive heart failure or acute myocardial infarction [19]. In addition to traditional risk factors, such as older age, hypertension and diabetes, several non-traditional, kidney disease-specific factors (i.e. oxidative stress, uremic toxins, compromised immunity, protein-energy wasting, hyperphosphatemia, vitamin D deficiency and fluid retention) may play roles in the development of these disease conditions and associated mortality risk [20–23]. Furthermore, cardiovascular and infectious events may also induce irreversible acute kidney injury in predialysis patients with advanced chronic kidney disease, resulting in the accelerated initiation of dialysis treatment in winter.
Understanding seasonal variations in patient outcomes may have major clinical and healthcare policy implications for better resource allocation across seasons of the years. It may also aid in more accurate interpretation of information collected in cohort studies and population surveys across different seasons. Indeed, several studies have demonstrated such seasonal variations in blood pressure, inter-dialytic weight gain and laboratory parameters [24–29]. However, only a few studies have shown that the incidence or mortality varies by seasons among patients with ESRD [29–31], and their study populations were restricted to hemodialysis patients. In this study using the entire US ESRD population from 2000 to 2013, we hypothesized that both the incidence of transition to ESRD and mortality would be consistently highest in winter and lowest in summer, irrespective of treatment modalities (i.e. hemodialysis, peritoneal dialysis and kidney transplantation). We also examined transplant failure fractions among those who received kidney transplantation.
MATERIALS AND METHODS
Study population and data source
This was a descriptive analysis of the entire United States Renal Data System (USRDS) database to evaluate seasonal variations in the (i) transition to ESRD, (ii) all-cause and cause-specific (cardiovascular and infectious) death and (iii) kidney transplantation among adult US Medicare ESRD patients from 1 January 2000 to 31 December 2013. We also examined seasonal variations in kidney transplant failure among patients with functioning transplants.
Statistical methods
Among patients who were treated with renal replacement therapy (i.e. dialysis or kidney transplantation), overall and modality-specific counts and frequencies of each outcome were calculated in each month. Dates of renal replacement therapy initiation (or transition to ESRD), death and kidney transplantation as well as primary causes of death (i.e. cardiovascular disease, infection and others) were abstracted from the ESRD Medical Evidence Reports (Centers for Medicare and Medicaid Services Form 2746). Cardiovascular and infectious deaths were defined as shown in Supplementary data, Table S1. Only the traditional USRDS 60-day collapsing rule was applied to patient modality; a patient must have received at least 60 days of a particular dialysis modality to be considered stable on this therapy, whereas kidney transplantation was considered to be a stable modality regardless of duration [32]. Modalities in the USRDS data file included hemodialysis, peritoneal dialysis, uncertain dialysis, discontinued dialysis, functioning transplantation, loss to follow-up and recovered kidney function. For modality-specific outcome, we focused on hemodialysis, peritoneal dialysis and functioning transplant, and examined monthly outcome events specific to particular modalities. Monthly outcome frequencies were then normalized based on days in a given month to account for the variation in the number of days within calendar months and years (i.e. 31 days in January and 28 days or 29 days in February) as follows: (normalized monthly outcome frequency) = (monthly outcome frequency) × ([365 × 3] + 366)/4/(days in a given month). Overall monthly fractions were calculated by dividing the normalized monthly counts by the number of all patients with renal replacement therapy, including kidney transplantation, on the first day of the month. In this calculation, we introduced the term ‘ESRD transition fraction’ to express the fraction of all incident patients who have newly transitioned to ESRD in that given month divided by all ESRD patients, including those with functioning kidney allograft on the first day of the month. This concept is similar to immigration metrics in demography. All-cause and cause-specific mortality fractions and kidney transplantation fractions were defined same way. Additionally, monthly kidney transplantation failure fractions were calculated by dividing the normalized monthly count of kidney transplantation failures by the number of patients with functioning transplants on the first day of the month. We also averaged those normalized fractions and counts over 14 years, and then calculated the ratio of maximum versus minimum values in monthly averages to examine the impact of seasonality on outcomes. All statistical analyses were carried out with SAS Enterprise, version 6.1 (SAS Institute, Inc., Cary, NC, USA).
RESULTS
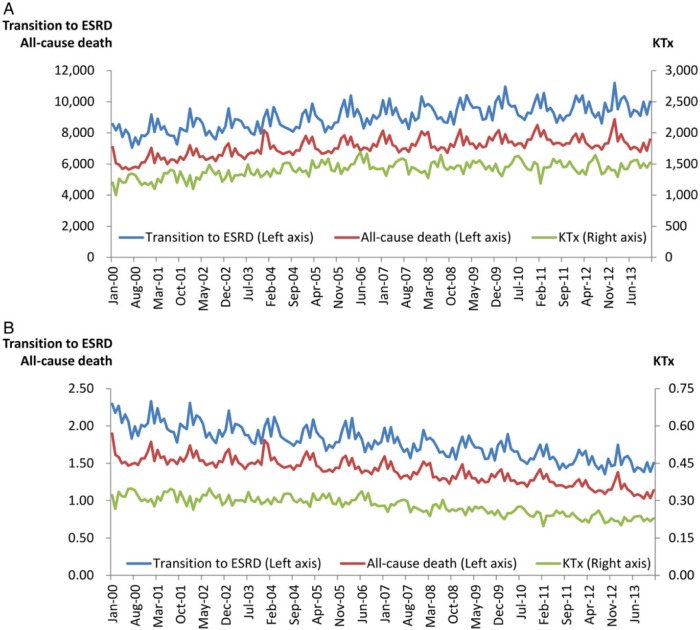
Figure 1 shows the crude monthly frequencies and fractions of transition to ESRD, all-cause death and kidney transplantation among ESRD patients in the USA from 2000 to 2013. While the total number of ESRD patients rose constantly each year, the increasing trend of the annual ESRD transition count appeared to have plateaued during 2009–2012, and exhibited a drastic decline in 2013 (Table 1). The annual death count peaked and plateaued during 2009–2011, with subsequent drop and stabilization in 2012–2013. Kidney transplantation count were relatively constant during 2005–2013.
FIGURE 1:
(A) Monthly counts and (B) crude monthly fractions of transition to ESRD, all-cause death and kidney transplantation (KTx) in the USA from 2000 to 2013.
Table 1.
Characteristics on 1 January and the annual events of each year among patients with ESRD in the USA from 2000 to 2013
| Year | Patient characteristics on January 1st of
each year |
Event frequencies in each
year |
||||||||
|---|---|---|---|---|---|---|---|---|---|---|
| Total ESRD | Total Dialysis | Age (year) | ≥65 yrs (%) | Female (%) | Blacks (%) | Diabetes (%) | Transition | Death | KTx | |
| 2000 | 373,091 | 278,897 | 56.0 ± 16.6 | 34% | 45% | 32% | 34% | 103,958 (28%) | 71,122 (19%) | 14,625 (4%) |
| 2001 | 394,136 | 294,395 | 56.3 ± 16.5 | 35% | 45% | 32% | 35% | 107,750 (27%) | 75,215 (19%) | 15,261 (4%) |
| 2002 | 414,259 | 308,674 | 56.5 ± 16.4 | 35% | 45% | 32% | 36% | 110,092 (27%) | 77,736 (19%) | 15,767 (4%) |
| 2003 | 433,912 | 322,108 | 56.8 ± 16.4 | 35% | 45% | 32% | 36% | 112,073 (26%) | 80,630 (19%) | 16,090 (4%) |
| 2004 | 452,357 | 334,822 | 57.0 ± 16.3 | 35% | 45% | 31% | 36% | 113,699 (25%) | 82,090 (18%) | 16,920 (4%) |
| 2005 | 470,963 | 346,660 | 57.3 ± 16.3 | 35% | 44% | 31% | 36% | 116,609 (25%) | 83,461 (18%) | 17,427 (4%) |
| 2006 | 490,153 | 358,858 | 57.5 ± 16.2 | 35% | 44% | 31% | 37% | 120,300 (25%) | 85,123 (17%) | 18,031 (4%) |
| 2007 | 511,143 | 372,719 | 57.7 ± 16.1 | 36% | 44% | 31% | 37% | 120,496 (24%) | 85,079 (17%) | 17,504 (3%) |
| 2008 | 531,685 | 386,419 | 57.9 ± 16.0 | 36% | 44% | 31% | 37% | 121,913 (23%) | 85,601 (16%) | 17,383 (3%) |
| 2009 | 553,086 | 401,124 | 58.1 ± 15.9 | 36% | 44% | 31% | 37% | 125,571 (23%) | 87,108 (16%) | 17,671 (3%) |
| 2010 | 576,003 | 417,651 | 58.4 ± 15.8 | 37% | 43% | 31% | 37% | 126,118 (22%) | 87,675 (15%) | 17,728 (3%) |
| 2011 | 598,722 | 434,052 | 58.6 ± 15.8 | 37% | 43% | 31% | 37% | 123,798 (21%) | 88,536 (15%) | 17,584 (3%) |
| 2012 | 618,857 | 447,908 | 58.8 ± 15.7 | 38% | 43% | 31% | 37% | 126,264 (20%) | 86,722 (14%) | 17,250 (3%) |
| 2013 | 642,020 | 465,404 | 59.1 ± 15.6 | 38% | 43% | 31% | 37% | 117,372 (18%) | 86,781 (14%) | 17,605 (3%) |
KTx, kidney transplantation.
Transition to ESRD
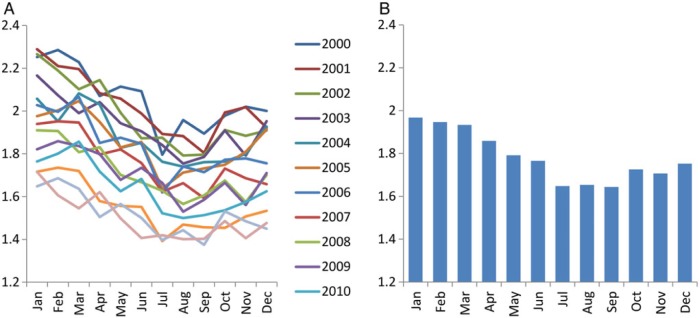
After normalization based on days in a given month, the overall transition fraction was lowest in July to September and highest in January to March of each year (Figure 2A). The 14-year averaged transition fraction to ESRD was lowest in July (1.65%) and highest in January (1.97%), the ratio of which was 1.19 (Figure 2B or Supplementary data, Figure S1A). A similar pattern was observed with the 14-year averaged frequency of hemodialysis as the first modality, which was lowest in July (n = 6767) and highest in January (n = 8054) with a ratio of 1.19 (Supplementary data, Figure S1B). Meanwhile, peritoneal dialysis and kidney transplantation as the first modality was most frequent in March (n = 726) and June (n = 255) and least frequent in December (n = 617) and April (n = 209), respectively (Supplementary data, Figure S1C and D). Ratios of the largest versus smallest outcome frequencies were 1.18 and 1.22 for peritoneal dialysis and kidney transplantation, respectively.
FIGURE 2:
(A) Monthly transition fraction to ESRD of each year and (B) their 14-year averages in the USA from 2000 to 2013. Values were normalized based on days of month.
All-cause and cause-specific mortality
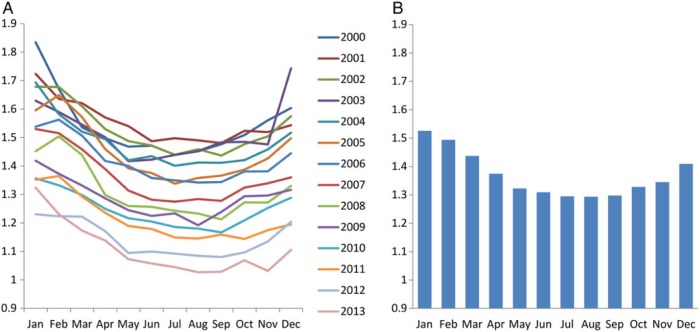
All-cause mortality was lowest in July to September and highest in December to February of each year, except for 2011 when the lowest mortality was observed in October (Figure 3A). The 14-year averaged all-cause mortality was lowest in August (1.32%) and highest in January (1.56%), in which the ratio was 1.18 (Figure 3B or Supplementary data, Figure S2A). The 14-year averaged frequency of all-cause death in hemodialysis, peritoneal dialysis and functioning kidney transplant was also lowest in July or August (n = 4887, 340 and 312, respectively) and highest in December or January (n = 5667, 397 and 369, respectively; Supplementary data, Figure S2B–D). Ratios of the largest versus smallest outcome frequencies were 1.16, 1.17 and 1.18 for hemodialysis, peritoneal dialysis and functioning kidney transplant, respectively.
FIGURE 3:
(A) Monthly mortality fraction of each year and (B) their 14-year averages among patients with ESRD from 2000 to 2013 in the USA. Values were normalized based on days of month.
Consistent trends were observed for cardiovascular death across modalities (Supplementary data, Figure S3). The 14-year averaged cardiovascular mortality was lowest in August (0.58%) and highest in January (0.71%) with a ratio of 1.23 (Supplementary data, Figure S3A). The 14-year averaged frequency of cardiovascular death in hemodialysis, peritoneal dialysis and functioning kidney transplantation was also observed with the lowest frequency in August or September (n = 2349, 165 and 40, respectively) and with the highest frequency in January (n = 2826, 198 and 54, respectively), with a ratio of 1.20, 1.20 and 1.33, respectively (Supplementary data, Figure S3B–D).
For infectious death, the 14-year averaged fraction was lowest in July (0.15%) and highest in January (0.19%), with a ratio of 1.25 (Supplementary data, Figure S4A). In hemodialysis and peritoneal dialysis, the 14-year averaged frequency of death due to infection was also lowest in July (n = 606 and 54, respectively) and highest in January (n = 731 and 68, respectively; Supplementary data, Figure S4B and C). Infectious death in functioning kidney transplantation also showed highest frequency in January (n = 28) but lowest frequency in May (n = 21; Supplementary data, Figure S4D). Ratios of the largest versus smallest frequencies were 1.21, 1.25 and 1.34 for hemodialysis, peritoneal dialysis and functioning kidney transplant, respectively.
Kidney transplantation and transplantation failure
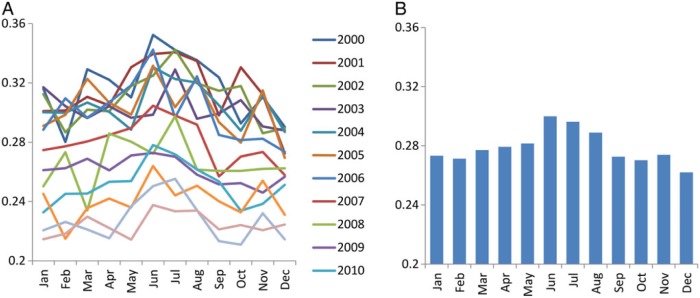
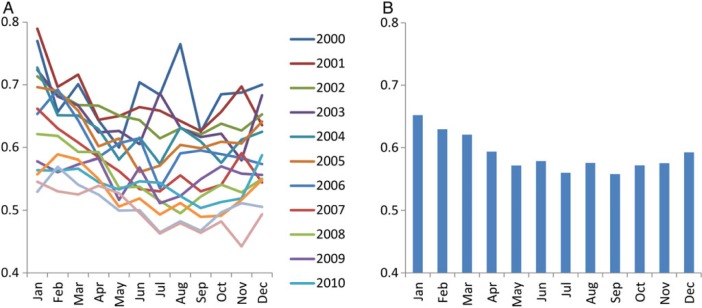
The 14-year averaged kidney transplantation fraction was lowest in December (0.26%) and highest in June (0.30%) among ESRD patients with renal replacement therapy (Figure 4 or Supplementary data, Figure S5A). Consistent trends were observed for both living donor and deceased donor kidney transplantation, but this variation was largely attributed to living donor rather than deceased donor transplantation; ratios of the largest versus smallest outcome frequencies were 1.23 and 1.11, respectively (Supplementary data, Figure S5B and C). The 14-year averaged kidney transplantation failure fraction among patients with functioning transplant was lowest in September (0.56%) and highest in January (0.65%) with a ratio of 1.17 (Figure 5 or Supplementary data, Figure S5D).
FIGURE 4:
(A) Monthly kidney transplantation fraction of each year and (B) their 14-year averages among patients with ESRD from 2000 to 2013 in the USA. Values were normalized based on days of month.
FIGURE 5:
(A) Monthly transplant failure fraction of each year and (B) their 14-year averages among patients with ESRD from 2000 to 2013 in the USA. Values were normalized based on days of month.
DISCUSSION
Consistent seasonal variations were observed in ESRD incidence, all-cause death, cardiovascular death, infectious death, kidney transplantation and transplantation failure among ESRD patients who were treated with renal replacement therapy in the USA. Both overall fractions and modality-specific frequencies of ESRD incidence and all-cause, cardiovascular and infectious death were highest in the winter season (i.e. December or January) and lowest in the summer season (i.e. July to September), whereas the month with the lowest frequency of infectious death in kidney transplantation was May. Kidney transplantation fractions were highest in June, and this peak appeared to be attributed mainly to living kidney transplantation rather than cadaveric transplantation. Transplantation failure fraction showed consistent seasonal variations with transition fractions and all-cause mortality, peaking in January and nadiring in September. These seasonal variations were consistently observed across years despite the secular changes in the characteristics of incident ESRD patients, such as age and diabetes.
The fraction of transition to ESRD and transplant failure showed almost the same seasonal variations with all-cause, cardiovascular and infectious death in this study using data from the USRDS. A previous study involving 15 056 patients from six states in the USA showed such variations to be consistent over different climatic regions, including the Mediterranean climate in coastal California [29]. The international Monitoring Dialysis Outcomes (MONDO) consortium of 87 399 hemodialysis patients in 31 countries from the USA, Europe, Asia Pacific and Latin America also found significant global seasonal variations in all-cause mortality, blood pressure and inter-dialytic weight gain in temperate climate zones, but not in tropical climate zones [31]. Another study from Okinawa, Japan, which has a subtropical climate, revealed seasonal variations in the incidence of ESRD [30]. However, these studies did not evaluate mortality and ESRD incidence at the same time. To the best of our knowledge, our 14-year USRDS database trend analyses have enabled us to examine and identify relatively robust seasonal variations in the incidence of ESRD, cause-specific death and kidney transplant failure simultaneously for the first time, with a far larger sample size. These results support our hypothesis that the winter peak in the incidence of transition to ESRD is, at least partly, attributed to cardiovascular disease and infections. Indeed, the 2015 USRDS Annual Data Report showed that patients with CKD have much higher incidence of hospitalization with acute kidney injury than those without CKD, and that acute kidney injury, hypertension and congestive heart failure are the top three causes of hospitalizations among incident ESRD patients transitioning to ESRD [33].
Although we do not know what leads to such consistent seasonal variations, it is possible that cardiovascular and infectious events contribute to more expeditious transition to ESRD and transplant failure in winter time. If so, these disease conditions are potential targets for intervention among both predialysis and post-transplantations [34, 35]. Given that the frequency of starting peritoneal dialysis as the first modality or preemptive kidney transplantation peaked in March and June, respectively, the development of cardiovascular disease and infection might have induced higher frequency of unanticipated initiation of renal replacement therapy with hemodialysis in winter. Also, these results suggest that seasonality should be accounted for in clinical studies of patients with any stage of chronic kidney disease (i.e. predialysis, dialysis and post-transplant period) when evaluating exposures that fluctuate over seasons.
Our study should be qualified by several limitations. First, the modality-specific outcomes may not reflect the effect of each modality, because this study did not consider patients who transitioned across renal replacement therapy modality over time. For example, some kidney transplant recipients who developed infections might have died soon after losing allograft function upon returning to dialysis modality. Additionally, if such patients died within 60 days after graft loss, they were categorized as ‘uncertain dialysis modality’. Whereas our analyses may not entail high precision in dialysis modality conversion data, our results are exceptionally robust pertaining to the ESRD transition, mortality and transplant counts and fractions. As another limitation, we did not examine seasonal variations across regions in the USA. Lastly, our results may not be extrapolated to other countries in different climates, such as tropical zones. Nevertheless, the strength of our study is that we used data from the entire USA, using the USRDS database, a national data system that comprehensively collects information about all treated ESRD in the USA.
In conclusion, the 14-year cumulative data from the USRDS (2000–2013) showed consistent seasonal variations in the transition to ESRD and all-cause, cardiovascular and infectious deaths, as well as kidney transplantation and transplant failure. We found a strikingly robust pattern of seasonal variation in that adverse events and transitioning to ESRD were more frequent in winter and less frequent in summer. Understanding these variations may allow for more efficient and cost-effective allocation of healthcare resources across seasons of the years, and have subsequent impact upon clinical practice and healthcare policy.
SUPPLEMENTARY DATA
Supplementary data are available online at http://ndt.oxfordjournals.org.
FUNDING
The work in this manuscript has been performed with the support of the National Institute of Diabetes, Digestive and Kidney Disease of the National Institute of Health research grants U01-DK102163 (K.K.-Z.), R01-DK95668 (K.K.-Z.), K24-DK091419 (K.K.-Z.) and R01-DK078106 (K.K.-Z.), and philanthropic grants from Mr Harold Simmons, Dr Joseph Lee and Mr Louis Chang. C.P.K. is supported by the National Institute of Diabetes, Digestive and Kidney Disease grants R01-DK096920 and U01-DK102163. C.M.R. is supported by the National Institute of Diabetes, Digestive and Kidney Disease grant K23-DK102903. Y.O. has been supported by the Shinya Foundation for International Exchange of Osaka University Graduate School of Medicine Grant. The funders had no role in the design and conduct of the study; collection, management, analysis and interpretation of the data; preparation, review or approval of the manuscript; or decision to submit the manuscript for publication.
CONFLICT OF INTEREST STATEMENT
K.K.-Z. has received honoraria from Abbott, Abbvie, Amgen, Fresenius, Genetech, Genzyme/Sanofi, Hospira, Keryx, Shire and Vifor.
Supplementary Material
ACKNOWLEDGEMENTS
The data reported here have been supplied by the USRDS. The interpretation and reporting of these data are the responsibility of the authors, and in no way should be seen as an official policy or interpretation of the US government.
REFERENCES
- 1. Danai PA, Sinha S, Moss M et al. . Seasonal variation in the epidemiology of sepsis. Crit Care Med 2007; 35: 410–415 [DOI] [PubMed] [Google Scholar]
- 2. Dowell SF. Seasonal variation in host susceptibility and cycles of certain infectious diseases. Emerg Infect Dis 2001; 7: 369–374 [DOI] [PMC free article] [PubMed] [Google Scholar]
- 3. Dowell SF, Ho MS. Seasonality of infectious diseases and severe acute respiratory syndrome-what we don't know can hurt us. Lancet Infect Dis 2004; 4: 704–708 [DOI] [PMC free article] [PubMed] [Google Scholar]
- 4. Kiank C, Koerner P, Kessler W et al. . Seasonal variations in inflammatory responses to sepsis and stress in mice. Crit Care Med 2007; 35: 2352–2358 [DOI] [PubMed] [Google Scholar]
- 5. Brennan PJ, Greenberg G, Miall WE et al. . Seasonal variation in arterial blood pressure. Br Med J (Clin Res Ed) 1982; 285: 919–923 [DOI] [PMC free article] [PubMed] [Google Scholar]
- 6. Hata T, Ogihara T, Maruyama A et al. . The seasonal variation of blood pressure in patients with essential hypertension. Clin Exp Hypertens 1982; 4: 341–354 [DOI] [PubMed] [Google Scholar]
- 7. Boulay F, Berthier F, Sisteron O et al. . Seasonal variation in chronic heart failure hospitalizations and mortality in France. Circulation 1999; 100: 280–286 [DOI] [PubMed] [Google Scholar]
- 8. Pell JP, Cobbe SM. Seasonal variations in coronary heart disease. QJM 1999; 92: 689–696 [DOI] [PubMed] [Google Scholar]
- 9. Kloner RA, Poole WK, Perritt RL. When throughout the year is coronary death most likely to occur? A 12-year population-based analysis of more than 220 000 cases. Circulation 1999; 100: 1630–1634 [DOI] [PubMed] [Google Scholar]
- 10. Sheth T, Nair C, Muller J et al. . Increased winter mortality from acute myocardial infarction and stroke: the effect of age. J Am Coll Cardiol 1999; 33: 1916–1919 [DOI] [PubMed] [Google Scholar]
- 11. Shinkawa A, Ueda K, Hasuo Y et al. . Seasonal variation in stroke incidence in Hisayama, Japan. Stroke 1990; 21: 1262–1267 [DOI] [PubMed] [Google Scholar]
- 12. Marshall RJ, Scragg R, Bourke P. An analysis of the seasonal variation of coronary heart disease and respiratory disease mortality in New Zealand. Int J Epidemiol 1988; 17: 325–331 [DOI] [PubMed] [Google Scholar]
- 13. Woodhouse PR, Khaw KT, Plummer M et al. . Seasonal variations of plasma fibrinogen and factor VII activity in the elderly: winter infections and death from cardiovascular disease. Lancet 1994; 343: 435–439 [DOI] [PubMed] [Google Scholar]
- 14. Chin MH, Goldman L. Factors contributing to the hospitalization of patients with congestive heart failure. Am J Publ Health 1997; 87: 643–648 [DOI] [PMC free article] [PubMed] [Google Scholar]
- 15. Bennett SJ, Huster GA, Baker SL et al. . Characterization of the precipitants of hospitalization for heart failure decompensation. Am J Crit Care 1998; 7: 168–174 [PubMed] [Google Scholar]
- 16. Stewart S, McIntyre K, Capewell S et al. . Heart failure in a cold climate. Seasonal variation in heart failure-related morbidity and mortality. J Am Coll Cardiol 2002; 39: 760–766 [DOI] [PubMed] [Google Scholar]
- 17. Nguyen JL, Yang W, Ito K et al. . Seasonal influenza infections and cardiovascular disease mortality. JAMA Cardiol 2016; 1: 274–281 [DOI] [PMC free article] [PubMed] [Google Scholar]
- 18. de Jager DJ, Grootendorst DC, Jager KJ et al. . Cardiovascular and noncardiovascular mortality among patients starting dialysis. J Am Med Assoc 2009; 302: 1782–1789 [DOI] [PubMed] [Google Scholar]
- 19. US Renal Data System, USRDS 2013 Annual Data Report: Atlas of Chronic Kidney Disease and End-Stage Renal Disease in the United States. Vol. 2015. Bethesda, MD: National Institutes of Health, National Institute of Diabetes and Digestive and Kidney Diseases, 2013
- 20. Obi Y, Qader H, Kovesdy CP et al. . Latest consensus and update on protein-energy wasting in chronic kidney disease. Curr Opin Clin Nutr Metab Care 2015; 18: 254–262 [DOI] [PMC free article] [PubMed] [Google Scholar]
- 21. Obi Y, Hamano T, Isaka Y. Prevalence and prognostic implications of vitamin D deficiency in chronic kidney disease. Dis Markers 2015; 2015: 868961. [DOI] [PMC free article] [PubMed] [Google Scholar]
- 22. Obi Y, Hamano T, Ichimaru N et al. . Vitamin D deficiency predicts decline in kidney allograft function: a prospective cohort study. J Clin Endocrinol Metab 2014; 99: 527–535 [DOI] [PubMed] [Google Scholar]
- 23. Obi Y, Kim T, Kovesdy C et al. . Current and potential therapeutic strategies for hemodynamic cardiorenal syndrome. Cardiorenal Med 2015; 6: 83–98 [DOI] [PMC free article] [PubMed] [Google Scholar]
- 24. Argiles A, Mourad G, Mion C. Seasonal changes in blood pressure in patients with end-stage renal disease treated with hemodialysis. N Engl J Med 1998; 339: 1364–1370 [DOI] [PubMed] [Google Scholar]
- 25. Sposito M, Nieto FJ, Ventura JE. Seasonal variations of blood pressure and overhydration in patients on chronic hemodialysis. Am J Kidney Dis 2000; 35: 812–818 [DOI] [PubMed] [Google Scholar]
- 26. Cheung AK, Yan G, Greene T et al. . Seasonal variations in clinical and laboratory variables among chronic hemodialysis patients. J Am Soc Nephrol 2002; 13: 2345–2352 [DOI] [PubMed] [Google Scholar]
- 27. Argiles A, Lorho R, Servel MF et al. . Seasonal modifications in blood pressure are mainly related to interdialytic body weight gain in dialysis patients. Kidney Int 2004; 65: 1795–1801 [DOI] [PubMed] [Google Scholar]
- 28. Yanai M, Satomura A, Uehara Y et al. . Circannual rhythm of laboratory test parameters among chronic haemodialysis patients. Blood Purif 2008; 26: 196–203 [DOI] [PubMed] [Google Scholar]
- 29. Usvyat LA, Carter M, Thijssen S et al. . Seasonal variations in mortality, clinical, and laboratory parameters in hemodialysis patients: a 5-year cohort study. Clin J Am Soc Nephrol 2012; 7: 108–115 [DOI] [PMC free article] [PubMed] [Google Scholar]
- 30. Iseki K, Morita O, Fukiyama K. Seasonal variation in the incidence of end-stage renal disease. Am J Nephrol 1996; 16: 375–381 [DOI] [PubMed] [Google Scholar]
- 31. Guinsburg AM, Usvyat LA, Etter M et al. . Seasonal variations in mortality and clinical indicators in international hemodialysis populations from the MONDO registry. BMC Nephrol 2015; 16: 139. [DOI] [PMC free article] [PubMed] [Google Scholar]
- 32. USRDS Coordinating Center, 2014 Researcher's Guide to the USRDS Database. Vol. 2015. https://www.usrds.org/2014/rg/USRDS_Researchers_Guide_Appendix_A_Products_Services_14.pdf (20 December 2015, date last accessed)
- 33. US Renal Data System, USRDS 2015 Annual Data Report: Atlas of Chronic Kidney Disease and End-Stage Renal Disease in the United States. Vol. 2015. Bethesda, MD: National Institutes of Health, National Institute of Diabetes and Digestive and Kidney Diseases, 2015
- 34. Kidney Disease: Improving Global Outcomes (KDIGO) Transplant Work Group. KDIGO clinical practice guideline for the care of kidney transplant recipients. Am J Transplant 2009; 9 (Suppl 3): S1–S157 [DOI] [PubMed] [Google Scholar]
- 35. Kidney Disease: Improving Global Outcomes (KDIGO) CKD Work Group. KDIGO 2012 clinical practice guideline for the evaluation and management of chronic kidney disease. Kidney Int Suppl 2013; 3: 1–150 [Google Scholar]
Associated Data
This section collects any data citations, data availability statements, or supplementary materials included in this article.


