Abstract
Anti-tumor immunity is driven by self vs. non-self discrimination. Many immunotherapeutic approaches to cancer have taken advantage of tumor neoantigens derived from somatic mutations. Here, we demonstrate that gene fusions are a source of immunogenic neoantigens that can mediate responses to immunotherapy. We identified an exceptional responder with metastatic head and neck cancer who experienced a complete response to immune checkpoint inhibitor therapy, despite a low mutational load and minimal pre-treatment immune infiltration in the tumor. Using whole genome sequencing (WGS) and RNA sequencing (RNA-seq), we identified a novel gene fusion, and demonstrated that it produces a neoantigen that can specifically elicit a host cytotoxic T cell response. In a cohort of head and neck tumors with low mutation burden, minimal immune infiltration, and prevalent gene fusions, we also identified gene fusion-derived neoantigens that generate cytotoxic T cell responses. Finally, analyzing additional datasets of fusion-positive cancers, including checkpoint inhibitor-treated tumors, we found evidence of immune surveillance resulting in negative selective pressure against gene fusion-derived neoantigens. These findings highlight an important class of tumor-specific antigens, and have implications for targeting gene fusion events in cancers that would otherwise be less poised for response to immunotherapy, including cancers with low mutational load and minimal immune infiltration.
The mammalian immune system has the ability to reject cancer cells through recognition of immunostimulatory neoantigens and T cell-mediated cytotoxicity1,2. This mechanism is the basis for major recent breakthroughs in cancer immunotherapies including immune checkpoint inhibitors3 and adoptive T cell therapy4. In addition, personalized RNA or peptide vaccines have been shown to prime host immunity against tumor cells5. However, the majority of patients do not experience clinical benefit from these therapies. Improved identification of tumor neoantigens that elicit T cell responses will be needed to increase the scope of benefit from cancer immunotherapy.
Response to immune checkpoint blockade is correlated with high tumor somatic mutational burden (TMB) and high clonality of mutation-associated neoantigens6–8. Some responses have been attributed to cancer germline antigens and viral antigens9–11. Several cancer types with low TMB are characterized by clonal oncogenic drivers that are products of gene fusions. Fusion peptides may generate effective tumor regression antigens, anticipated to be more immunologically foreign than missense mutations. However, it is currently unknown whether fusion proteins can mediate responses to immunotherapy, especially since fusion-positive cancers have lower TMB12.
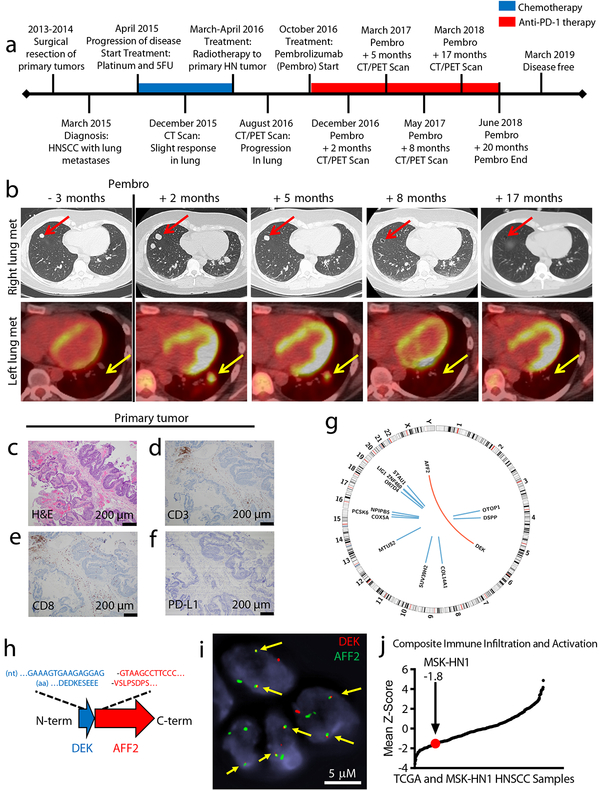
Patient MSK-HN1, an exceptional responder to immunotherapy, presented with a head and neck squamous cell carcinoma (HNSCC) arising at the skull base, with lung metastases. The primary tumor was not surgically resectable. After the discovery of distant metastases, the patient was treated with platinum and 5-fluorouracil chemotherapy, initially resulting in stable disease for 1 year, but followed by disease progression (Fig. 1a). Six months after the last chemotherapy treatment, the patient began treatment with an anti-PD-1 antibody (Pembrolizumab), which induced a radiographic response after 5 months, and complete regression of disease by 8 months (Fig. 1b). The patient was treated for an additional year, completed treatment at 20 months, and remains disease-free at 29 months.
Fig. 1 – Immunogenomic characterization of Patient MSK-HN1, an exceptional responder to anti-PD-1 immunotherapy.
a, Clinical timeline of Patient MSK-HN1 with major events indicated. Chemotherapy treatment is shown in blue and anti-PD-1 therapy is shown in red. b, Serial imaging of a lung metastasis in the right lower lobe (upper panels, CT scans images) and a metastasis in the left lower lobe (lower panels, fused PET/CT images). c, H&E staining of the primary tumor. Scans were done at the times indicated. c-f, Immunohistochemistry staining of the same tissue section for H&E (c), CD3 (d), CD8 (e), and PD-L1 (f). IHC staining was performed twice. g, Circos plot of genomic alterations in the tumor identified with whole-genome sequencing. Blue lines indicate SNVs and the red arc indicates the translocation fusing DEK and AFF2. h, Diagram of the in-frame DEK-AFF2 fusion with nucleotide (nt) and amino acid (aa) sequences surrounding the junction shown. i, FISH detection of the DEK-AFF2 fusion, performed in triplicates. Arrows indicate colocalization of DEK (red) and AFF2 (green). j, Plot of mean Z-scores across TCGA HNSCC samples (n = 521) and Patient MSK-HN1 tumor, representing the composite of eight immune metrics (see Methods).
The histology of the primary tumor prior to treatment was consistent with squamous cell carcinoma (Fig. 1c) and was negative for all (n = 28) human papillomavirus (HPV) serotypes tested by RNA in situ hybridization (Supplementary Fig. 1). The tumor microenvironment demonstrated low immune cell infiltration (Supplementary Fig. 2), most of which were CD3+ CD8+ T cells (Fig. 1d, e). The primary tumor and a lung metastasis were both negative for PD-L1 staining (Fig. 1f, Supplementary Figure 2). Whole genome sequencing of DNA from a frozen sample of the primary tumor (obtained prior to immunotherapy) revealed a low nonsynonymous mutation rate (0.47 mutations/MB; 14 single nucleotide variants (SNVs) in 12 genes), and a novel in-frame DEK-AFF2 gene fusion (Fig. 1g–h; Supplementary Table 1).
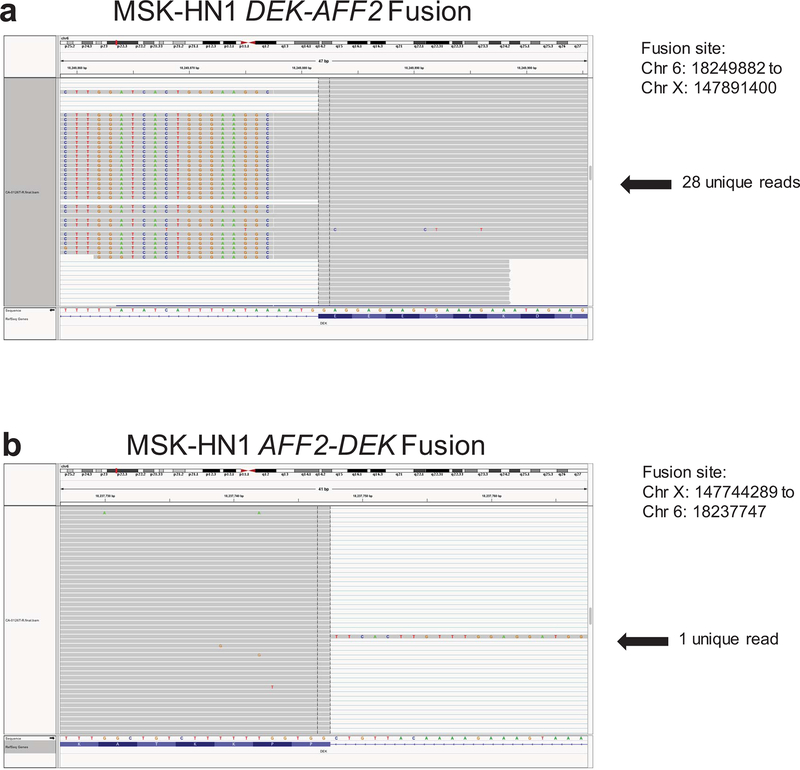
DEK has been previously demonstrated to have oncogenic properties in HNSCC and other cancer types13, and the DEK-NUP214 fusion (in acute myeloid leukemia) is sufficient to transform hematopoietic progenitor cells14. The DEK-AFF2 fusion was the likely driver event in this tumor, since none of the mutated genes are included in the COSMIC Cancer Gene Census, or highly recurrent in sequenced tumors15 (Supplementary Table 1). There were also no areas of significant copy number alteration or structural variants across the genome (Supplementary Fig. 3). We confirmed the presence of the DEK-AFF2 fusion with RNA-seq (Extended Data Fig. 1) and by fluorescence in situ hybridization (FISH) in tumor tissue (Fig. 1i). We confirmed a lack of viral (HPV or other) DNA by examining unmapped and partially mapped reads from WGS using GEM Mapper.
To place the immune microenvironment of this tumor in context, we analyzed RNA-seq data from this tumor and 521 other HNSCC tumors in the TCGA dataset to deconvolve infiltrating immune cells and measure markers of T cell activation (Fig. 1j; Supplementary Fig. 4)16. Consistent with the immunohistochemical data, the MSK-HN1 tumor ranked toward the lower end (12th percentile) of the range of immune infiltration scores observed in HNSCC.
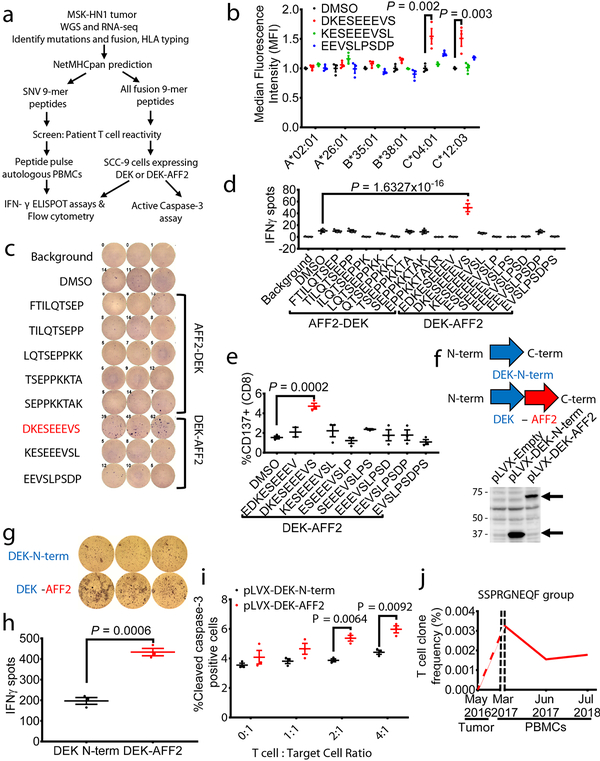
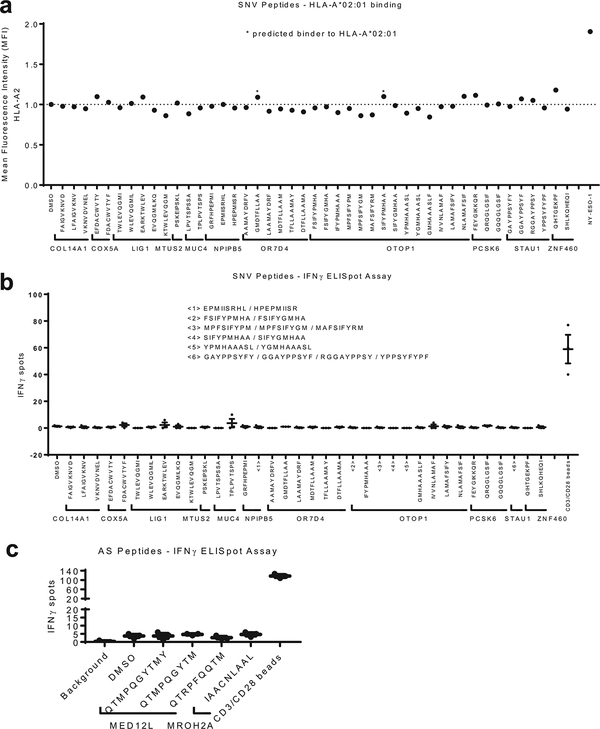
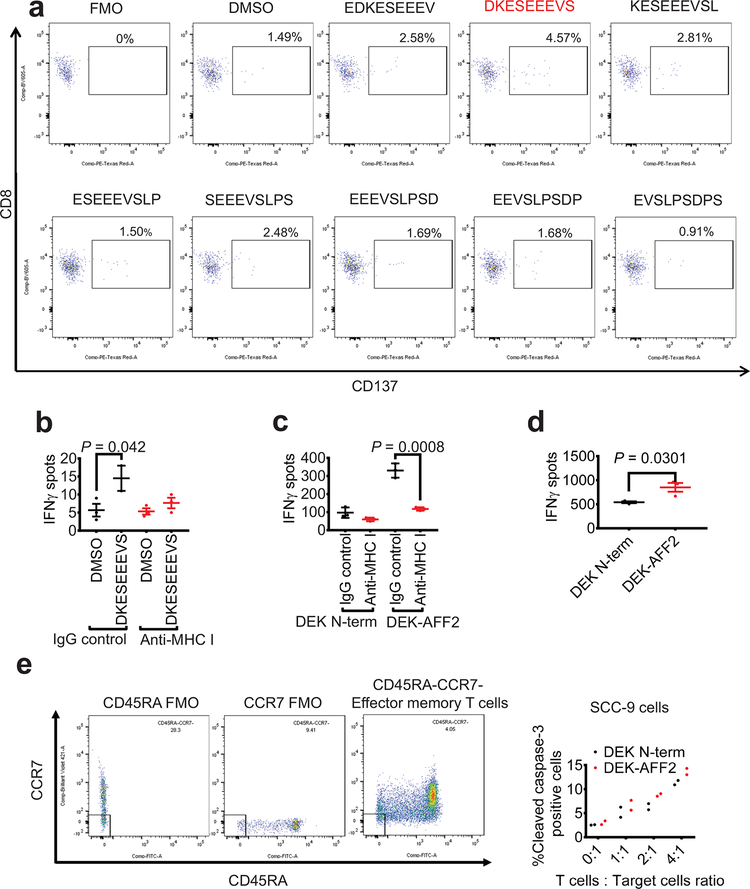
To dissect potential mechanisms underlying the beneficial clinical response to anti-PD-1 treatment, we investigated whether neoantigens derived from SNVs or the fusion DEK-AFF2 could elicit immunostimulatory T cell responses (Fig. 2a). We used NetMHCpan4.0 to identify SNV-derived (Supplementary Table 2) and DEK-AFF2 fusion-derived (Supplementary Table 3) peptides of 9-amino acid-length predicted to bind to patient specific HLAs (A*02:01, A*26:01, B*35:01, B*38:01, C*04:01, and C*12:03). Since Patient MSK-HN1 was positive for HLA-A*02:01, we first tested whether mutation-derived peptides could stabilize the HLA molecule on T2 cells. There was no significant peptide binding to HLA-A*02:01 (Extended Data Fig. 2a). However, when HLA-C*04:01 or HLA-C*12:03 were expressed in T2 cells, a DEK-AFF2-derived peptide (DKESEEEVS) stabilized these HLA molecules (p = 0.002, p = 0.003, respectively) (Fig. 2b). When presented on autologous MSK-HN1 peripheral blood mononuclear cells (PBMCs), DKESEEEVS stimulated T cell activation, as indicated by interferon-gamma (IFN-γ) secretion (p = 1.63×10⁻¹⁶) (Fig. 2c, d) and CD137-positive staining of CD8+ T cells (p = 0.0002) (Fig. 2e and Extended Data Fig. 3a). Moreover, DKESEEEVS-stimulated T cell activation was abrogated when PBMCs were treated with anti-MHC Class I antibody (Extended Data Fig. 3b), indicating that DKESEEEVS neoantigen presentation is MHC Class I-dependent. None of the other tested SNV- or fusion-derived peptides elicited these responses (Fig. 2d; Extended Data Fig. 2b).
Fig. 2 – DEK-AFF2 generates an immuno-stimulatory peptide recognized by autologous T cells.
a, Experimental scheme for testing immunogenicity of mutation- and fusion-associated peptides from Patient MSK-HN1. b, HLA stabilization assay of DEK-AFF2-derived peptides on T2 cells without (HLA-A*02:01) or with transfection of patient-specific HLAs (A*26:01, B*35:01, B*38:01, C*04:01, C*12:03) (n=3). (one-way ANOVA followed by Dunnett’s correction for multiple comparisons. C*04:01 group: 95%CI=−0.8325 to −0.255, Effect size Eta Squared=0.814, DF=8, P=0.002; C*12:03 group: 95%CI=−0.8048 to −0.2115, Eta Squared=0.798, DF=8, P=0.003) c, IFN-γ ELISpot assays of MSK-HN1 T cells (from peripheral blood collected 5 months after initiation of anti-PD-1 therapy) after co-culture with autologous PBMCs (n=3) pulsed with 10 μM AFF2-DEK-derived or DEK-AFF2-derived peptides. 10,000 T cells were used in 1:1 ratio with PBMCs. d, Quantification of IFN-γ spots shown in (c) along with results for additional peptides. (one-way ANOVA followed by Dunnett’s correction for multiple comparisons. 95%CI=−51.52 to −27.14, Effect size Eta Squared=0.934, DF=37, P=1.6×10⁻¹⁶) e, Flow cytometry analysis of CD137 expression of MSK-HN1 T cells after co-culture with autologous PBMCs (n=3) pulsed with 10 μM AFF2-DEK-derived or DEK-AFF2-derived peptides. (one-way ANOVA followed by Dunnett’s correction for multiple comparisons. 95%CI=−4.804 to −1.556, Effect size Eta Squared=0.783, DF=17, P=0.0002). f, Diagram representation of the DEK-N-term and DEK-AFF2 constructs expressed in SCC-9 cells and validation by immunoblotting for DEK. Reference protein molecular weights are indicated (kDa). g, IFN-γ ELISpot assays of MSK-HN1 T cells after co-culture with SCC-9 cells expressing DEK-N-term or DEK-AFF2. The T cell to SCC-9 cell ratio was 1:1. h, Quantification of IFN-γ spots shown in (g) (n=3). (one-way ANOVA followed by Dunnett’s correction for multiple comparisons. 95%CI=169.2 to 304.2, Effect size Eta Squared=0.959, P=0.0006) i, Active caspase-3 staining of SCC-9 target cells expressing either DEK-N-term or DEK-AFF2 fusion after 3 hr incubation with MSK-HN1 T cells at the indicated ratios. T cells were expanded in three rounds on autologous PBMCs pulsed with 10 μM DKESEEEVS peptide prior to culture with 20,000 SCC-9 cells at the indicated ratios. (one-way ANOVA followed by Dunnett’s correction for multiple comparisons. T cell: Target cell ratio 2:1 group: 95%CI=0.7984 to 2.195, Effect size Eta Squared=0.939, P=0.0064; T cell: Target cell ratio 4:1 group: 95%CI=0.7093 to 2.404, Effect size Eta Squared=0.909, P=0.0092) j, DEKSEEEVS-specific T cell clone frequencies in patient tissue/bloods before and during anti-PD1 treatment. All data are representative of two independent experiments. Means ± s.e.m. are plotted, with sample n representing the number of independently treated samples.
To further confirm this, we cloned the region of DEK N-terminal to the fusion breakpoint (DEK-N-term), or DEK fused to an equal length of AFF2 C-terminal to the breakpoint (DEK-AFF2) into pLVX-puro (Supplementary Table 4), and transduced SCC-9 cells, which are HLA-C*04:01-positive17 (Fig. 2f). Expression of DEK-AFF2 induced a cytotoxic T cell response against SCC-9 cells, as measured by IFNγ ELISpot assay (p = 0.0006) which was inhibited when SCC-9 cells were treated with anti-MHC Class I antibody. (Fig. 2g–h; Extended Data Fig. 3c). A similar response was observed for COS-7 cells co-transfected with HLA-C*04:01 and pLVX-DEK-N-term or pLVX-DEK-AFF2 (p = 0.0301) (Extended Data Fig. 3d). DEK-AFF2 expression increased target cell apoptosis, as indicated by active caspase-3 staining (p = 0.0064, 0.0092 for T cell:target cell of 2:1 and 4:1, respectively) (Fig. 2i). In addition, effector memory T cells also induced further target cell apoptosis (Extended Data Fig. 3e) indicating that experienced neoantigen-reactive T cells were present in this patient’s blood. Taken together, these data indicate that the immunodominant epitope underlying regression of the patient’s metastatic tumors was most likely derived from the DEK-AFF2 fusion, rather than a missense mutation.
We then asked whether there was evidence for a DEK-AFF2 specific T cell response in this patient during response to immunotherapy. We first profiled the T cell clones associated with the DEK-AFF2 fusion, by sequencing the T cell receptor β-chain complementarity determining region 3 (CDR3) in DKESEEEVS-reactive T cells, compared to an unselected T cell population. We additionally performed TCR sequencing in DNA obtained from the patient’s pre-treatment tumor biopsy and on-treatment PBMCs. The CDR3s in the patient’s blood were significantly enriched for DKESEEEVS-reactive T cell CDR3s, compared to bulk CDR3s (p = 0.016). The most prevalent T cell clone identified in both DKESEEEVS-reactive T cells and patient blood (SSPRGNEQF; comprising 28% of overlapping CDR3s), or a highly similar CDR3 (SSPRGDEQF; GLIPH sequence clustering, CRG score = 2.01 × 10⁻¹³) were not identified in pre-treatment tumor, but were detected in the blood at the first on-therapy timepoint (5 months), declined in the blood as the tumor responded, but remained detectable at 21 months on-therapy (Fig. 2j; Supplementary Table 5). These data are consistent with a DEK-AFF2 neoantigen-specific T cell response occurring during tumor regression. As has been described previously, tumor-reactive T cells are often undetectable in the intratumoral TCR repertoire18, but can become apparent during immunotherapy-mediated tumor regression8.
We cannot rule out other unexamined sources of neoantigens, such as cancer germline antigens aberrantly expressed due to epigenetic alterations. However, in this tumor, none of the 27 well-described cancer germline antigens were highly expressed, making this less likely (Supplementary Table 6). There were no other structural variants identified on WGS. We identified and tested neoepitopes resulting from possible alternative splicing events (Supplementary Table 7), none of which elicited a T cell response in patient PBMCs (Extended Data Fig. 2c). Therefore, in this tumor, other than the fusion neoantigen, we could not find evidence for any other tumor regression antigens such as mutation, viral, germline, or alternative splicing-associated antigens.
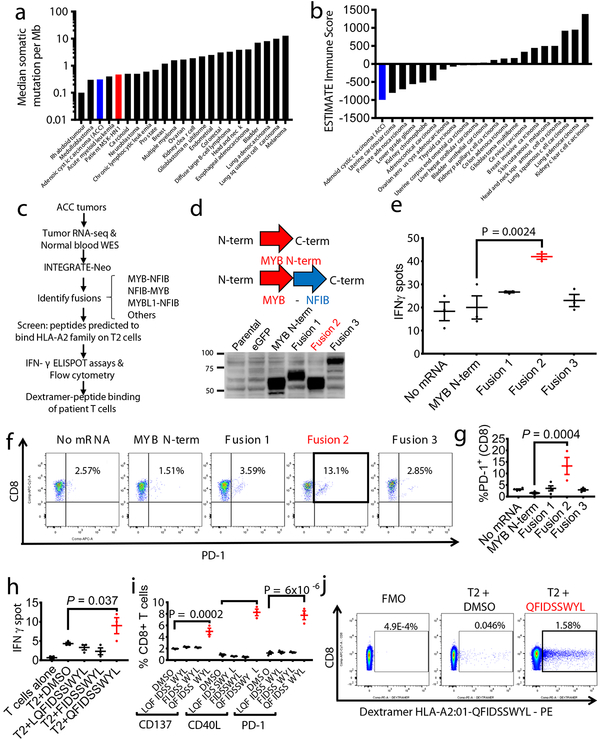
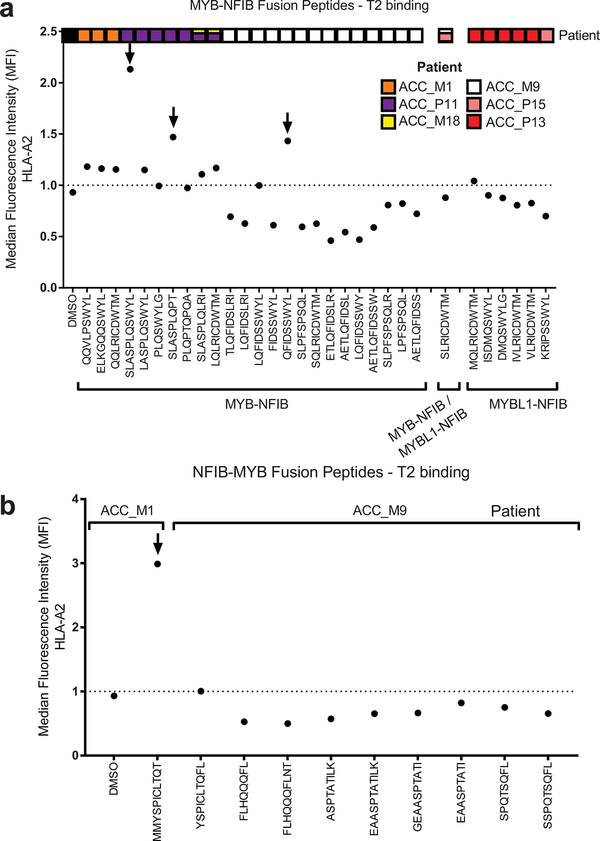
We then sought to determine whether fusion-associated neoantigens might be able to stimulate T cell responses in similar cancers with low TMB and minimally immune-infiltrated microenvironments. ACCs are a type of head and neck cancer with these characteristics: low TMB (median 0.31/megabase) (Fig. 3a), lower immune infiltration than other major cancer types (Fig. 3b), and prevalent MYB-NFIB gene fusions, which occur in approximately 60% of cases19. We performed RNA-seq of 20 frozen head and neck ACC tumors and utilized INTEGRATE-Neo to call gene fusion transcripts and predict HLA binding affinity (NetMHC 4.0) (Fig. 3c). There were 13 tumors with MYB-NFIB or MYBL1-NFIB fusion genes, of which 7 patients had the HLA-A2 genotype. We tested the ability of predicted HLA-A2 family binding peptides (Supplementary Table 8) to stabilize HLA-A*02:01 on the surface of T2 cells (Extended Data Fig. 4). We found three MYB-NFIB-derived peptides (SLASPLQSWYL, SLASPLQPT, QFIDSSWYL) and one NFIB-MYB-derived peptide (MMYSPICLTQT) were able to bind HLA-A*02:01. We first focused on the nonamer QFIDSSWYL from the tumor of a patient from whom we were able to obtain fresh blood samples.
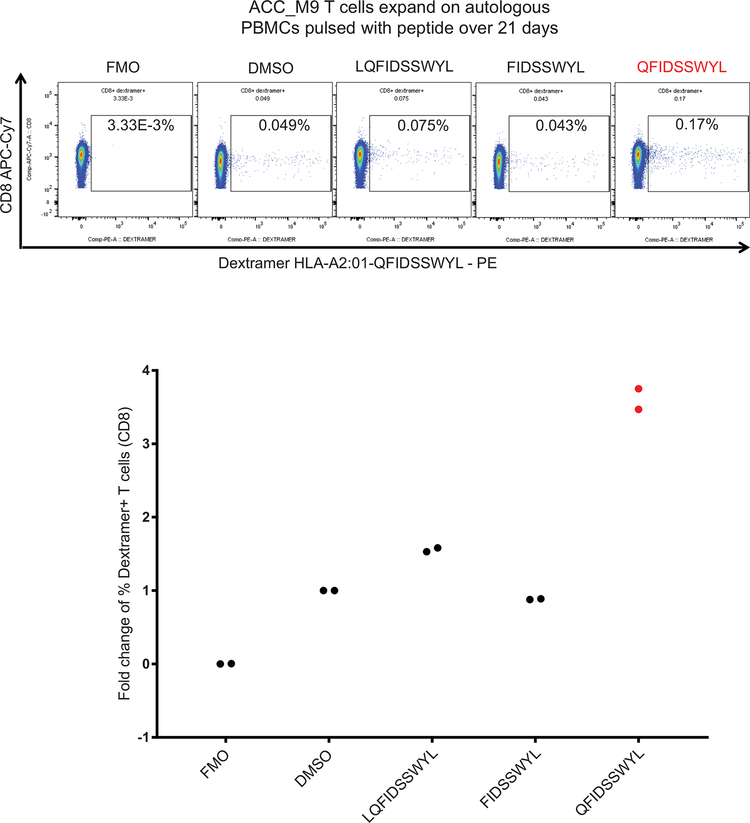
Fig. 3 – MYB-NFIB generates an immuno-stimulatory peptide recognized by autologous T cells.
a, Plot of median tumor mutational burden across 21 TCGA cancer types, adenoid cystic carcinomas32,33, and Patient MSK-HN1. b, Plot of mean ESTIMATE Immune Scores across 21 TCGA cancer types and adenoid cystic carcinomas. c, Experimental scheme for testing immunogenicity of MYB-NFIB fusion peptides from ACC patients. d, Diagram representation of the MYB-N-term and MYB-NFIB constructs expressed in HEK293 cells and validation by immunoblotting for MYB. Data are representative of two independent experiments. e, Quantification of IFN-γ spots produced by patient T cells after 18 hr co-culture with healthy donor (“HD1”; HLA-A*02:01-positive) DCs (n=3) electroporated with mRNA. (one-way ANOVA followed by Dunnett’s correction for multiple comparisons, 95%CI=−34.96 to −9.044, Effect size Eta Squared=0.782, DF=10, P=0.0024) f, Flow cytometry analysis of PD-1 expression on T cells used in (e). g, Quantification of CD3+ or CD8+ T cells used in (e) that are PD-1+ (n=3). (one-way ANOVA followed by Dunnett’s correction for multiple comparisons, 95%CI=−17.58 to −5.877, Effect size Eta Squared=0.742, DF=13, P=0.0004) h, Quantification of IFN-γ spots produced by patient T cells after 18 hr co-culture with T2 cells (n=3) pulsed with 10 μM of the indicated peptides. (one-way ANOVA followed by Dunnett’s correction for multiple comparisons, 95%CI= −9.061 to −0.2724, Effect size Eta Squared=0.773, DF=10, P=0.037) i, Quantification of PD-1, CD40L, and CD137 expression on patient T cells after 18 hr co-culture with autologous PBMCs pulsed with the indicated peptides, measured by flow cytometry. (one-way ANOVA followed by Dunnett’s correction for multiple comparisons, CD137 group: 95%CI= −4.132 to −1.882, Effect size Eta Squared=0.909, DF=8, P=0.0002; CD40L group: 95%CI=−8.569 to −6.158, Effect size Eta Squared=0.984, DF=8, P=2×10⁻⁷; PD-1 group: 95%CI=−8.176 to −4.917, Effect size Eta Squared=0.961, DF=8, P=6×10⁻⁶) Data are representative of three independent experiments. j, Patient CD8+ T cells that specifically bind to HLA-A*02:01-presented QFIDSSWYL peptide proliferate over 21 days during co-culture with irradiated peptide-pulsed T2 cells. Peptide-specific T cells were detected with phycoerythrin (PE)-labeled dextramer staining. Fluorescence minus one (FMO) was used to guide the gating strategy. All data are representative of at least two independent experiments. Means ± s.e.m. are plotted, with sample n representing the number of independently treated samples.
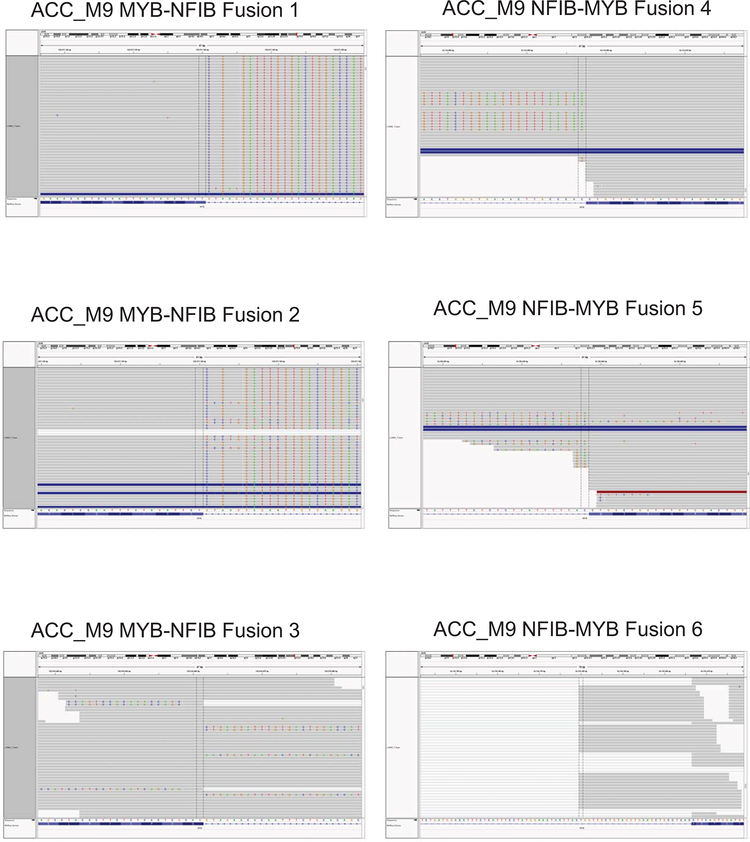
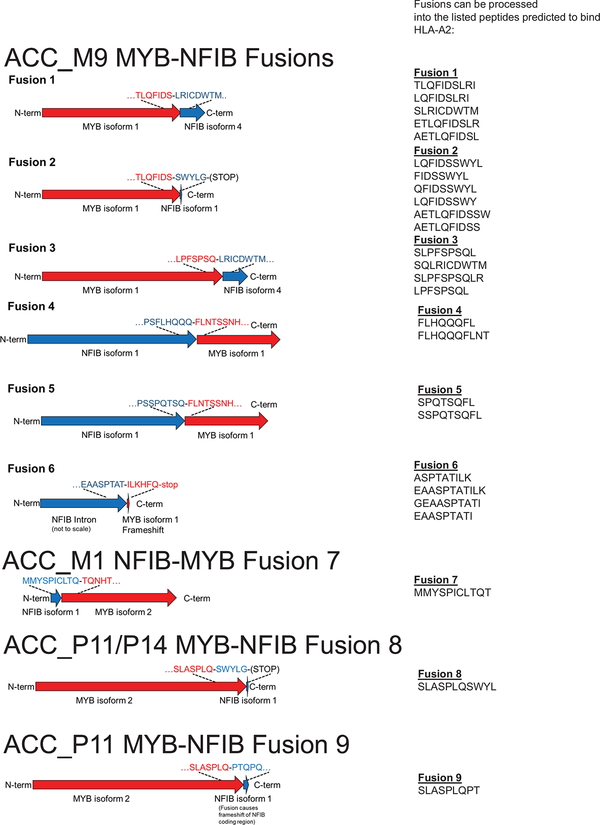
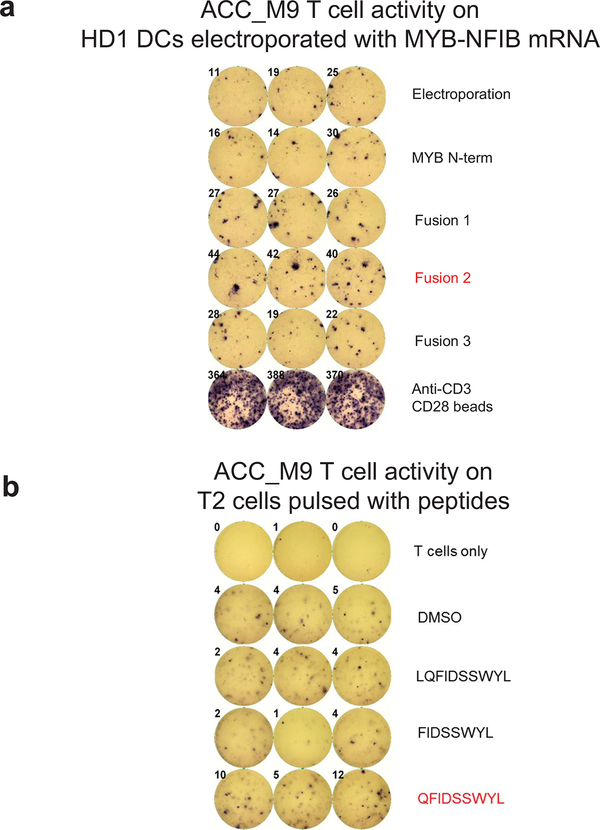
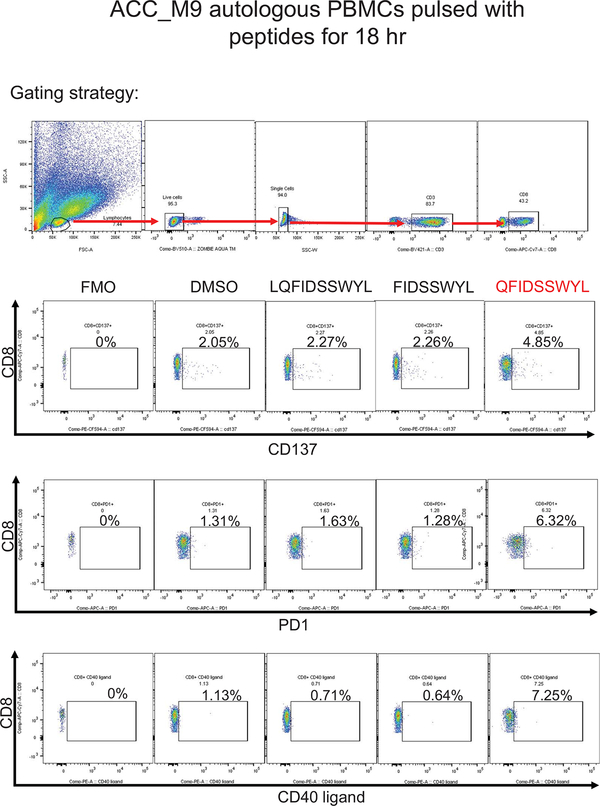
Patient ACC_M9 presented with a head and neck ACC tumor (Supplementary Fig. 5), and multiple lung metastases, and has not been treated with immunotherapy. RNA-seq identified three MYB-NFIB fusions and the reciprocal NFIB-MYB fusion (Extended Data Fig. 5 and 6). Whole exome sequencing of peripheral blood confirmed the HLA-A*02:01 genotype (Optitype). We cloned the three MYB-NFIB fusions found in the patient’s tumor (Fig. 3d; Supplementary Table 9) and expressed them in HLA-A*02:01-positive dendritic cells. MYB-NFIB Fusion 2, which encompasses the QFDISSWYL peptide, induced IFN-γ secretion by patient T cells (p = 0.002) (Fig. 3e; Extended Data Fig. 7a) and induced expression of the T cell activation marker PD-1, on CD3+ and CD8+ cells (Fig. 3f, g). Furthermore, T2 cells pulsed with QFIDSSWYL peptide, but not the related 8-mer (FIDSSWYL) or 10-mer (LQFIDSSWYL) peptides, stimulated a significant T cell response (p = 0.037) (Fig. 3h; Extended Data Fig. 7b). Lastly, QFIDSSWYL peptide pulsed onto patient autologous PBMCs was able to induce the T cell activation markers PD-1, CD40L, and CD137 (Fig. 3i; Extended Data Fig. 8).
To determine whether peptide-specific T cells can be selectively expanded, patient T cells were co-cultured with peptide-pulsed T2 cells or peptide-pulsed patient PBMCs for 21 days. In both cases, staining with QFIDSSWYL-dextramer-phycoerythrin (PE) demonstrated peptide-specific CD8+ T cell expansion (Fig. 3j; Extended Data Fig. 9).
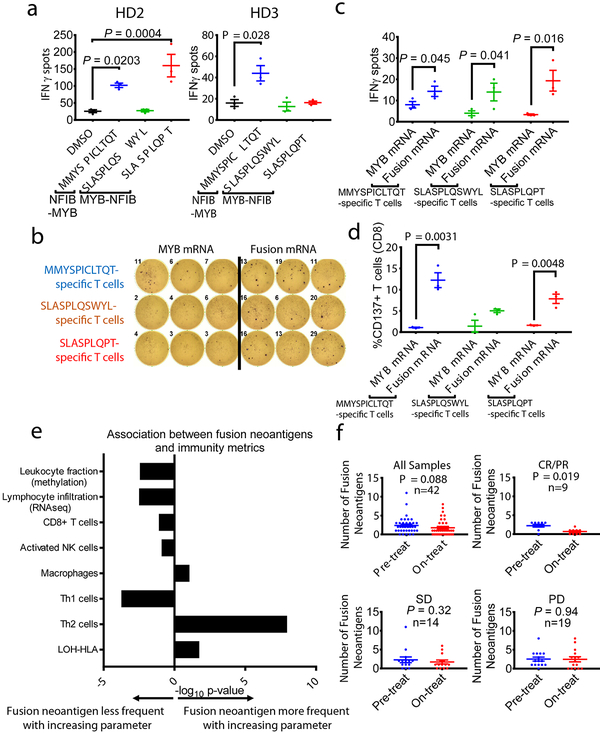
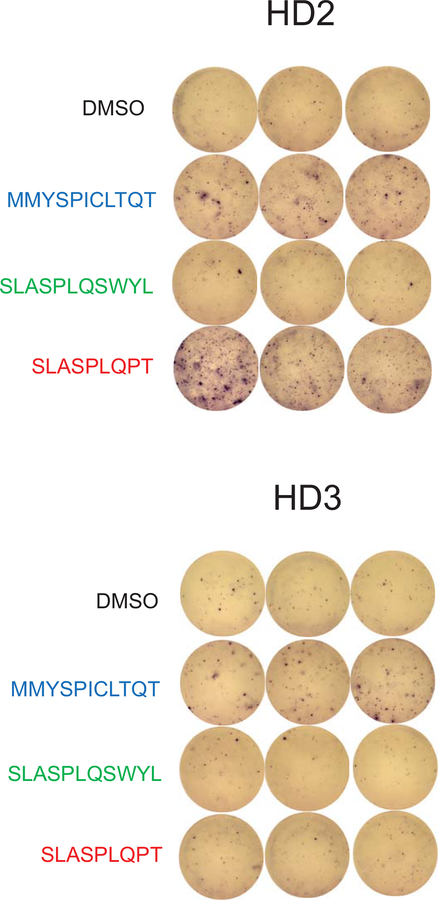
For other fusion-associated neoantigens confirmed to bind HLA-A*02:01 (MMYSPICLTQT, SLASPLQSWYL, SLASPLQPT), we did not have access to corresponding blood samples because patients were no longer alive. We therefore tested whether HLA-A*02:01-positive healthy donor T cells have intrinsic immunoreactivity towards the peptides. Healthy donor (“HD2”) T cells were stimulated by MMYSPICLTQT and SLASPLQPT presented on T2 cells (p =0.0203, p = 0.0004), and healthy donor (“HD3”) T cells were stimulated by MMYSPICLTQT, as demonstrated by IFN-γ secretion (p = 0.028) (Fig. 4a; Extended Data Fig. 6).
Fig. 4 – Donor T cells are stimulated by MYB-NFIB-derived and NFIB-MYB-derived peptides.
a, Quantification of IFN-γ spots produced by healthy donor HD2 and HD3 T cells after 18 hr co-culture with T2 cells (n=3) pulsed with 10 μM of the indicated peptides. P value was calculated using one-way ANOVA followed by Dunnett’s correction for multiple comparisons (In HD2 group, DMSO vs. MMYSPICLTQT: 95%CI=−140.40 to −12.26, Effect size Eta Squared=0.846, DF=10, P=0.0203; DMSO vs. SLASPLQPT: 95%CI=−198.4 to −70.26, Effect size Eta Squared=0.846, DF=10, P=0.0004; In HD3 group, DMSO vs. MMYSPICLTQT: 95%CI=−52.86 to −3.142, Effect size Eta Squared=0.638, DF=10, P=0.028). b, IFN-γ ELISpot assay of peptide-specific HD2 T cells (expanded by co-culturing with peptide-pulsed T2 cells for 21 days), stimulated by co-culturing with autologous DCs electroporated with mRNA encoding the MYB-N-terminus or the corresponding MYB-NFIB fusions. c, Quantification of IFN-γ spots shown in (b) (n=3). (one-tailed t-tests, MMYSPICLTQT-specific T cells group: 95%CI=−1.574 to 14.24, Effect size Eta Squared=0.553, P=0.045; SLASPLQSWYL-specific T cells group: 95%CI=−1.996 to 22, Effect size Eta Squared=0.573, P=0.041; SLASPLQPT-specific T cells group: 95%CI= 2.335 to 29.66, Effect size Eta Squared=0.725, P=0.016). d, Quantification of CD137+ CD8+ T cells measured by flow cytometry (n=3). (two-tailed t-tests, MMYSPICLTQT-specific T cells group: 95%CI=6.304 to 16.03, Effect size Eta Squared=0.910, P=0.0031; SLASPLQPT-specific T cells group: 95%CI=3.181 to 9.292, Effect size Eta Squared=0.889, P=0.0048). e, Associations between immune paramaters (immune cell subsets and immune activity) and the presence of a fusion neoantigen across 5825 fusion-positive cancers. Logistic regression assessing the probability of observing a fusion neoantigen was performed, with immune parameters, cancer type, mutation load, and tumor purity as covariates. Two tailed P-values are shown for the immune parameter. f, A decrease in the number of fusion neoantigens during therapy was observed in melanoma patients (n=42) responding to anti-PD-1 treatment (n=9), but not in patients with stable disease (n=14) or progressing disease (n=19). (two-tailed Wilcoxon test, all samples group: Z= −1.709, P=0.088; CR/PR group: Z=−2.345, P=0.019; SD group: Z=−0.99, P=0.32; PD group: Z=−0.071, P=0.94). Means ± s.e.m. are plotted, with sample n representing the number of independently treated samples.
We tested whether fusion transcripts encompassing MMYSPICLTQT and SLASPLQPT are translated and processed in cells by cloning the fusions into pcRNA6SL (Extended Data Fig. 6; Supplementary 6). These constructs were expressed in autologous DCs, which stimulated corresponding peptide-specific HD2 T cells, whereas DCs expressing the MYB-N-terminus did not (Fig. 4b–c; Extended Data Fig. 10). The stimulated CD8+ T cells demonstrated induced CD137 expression (Fig. 4d). These data indicate that neoantigen-specific T cell responses to cancer-associated fusion peptides can be induced in the T cell repertoire of healthy donors, similar to findings for mutation-derived neoantigens in melanoma. This implies that fusion-derived neoantigens may engender T cell responses from independent sources, even if the patient’s autologous T cells do not demonstrate detectable reactivity20.
To understand the broader implications of fusion peptide antigenicity, we analyzed RNA-seq data to describe the immune microenvironment in 30 TCGA cancer types with gene fusions, and determine whether there was an association between measures of immune surveillance and the presence of a fusion neoantigen. Of 5,825 fusion-positive cancer samples, 1,404 (24%) tumors had a gene fusion neoantigen predicted to bind to patient-specific HLA12. In multivariable logistic regression analysis controlling for TMB, cancer histology and tumor purity, tumors with higher leukocyte fraction (p = 0.004), higher lymphocyte infiltration (p = 0.003), and higher Th1 cell infiltration (p = 0.0002) had a significantly lower likelihood of harboring a fusion neoantigen. For example, for each 10% increase in leukocyte fraction, there was a 7.5% decrease in the odds of observing a fusion neoantigen, adjusting for TMB, cancer type and tumor purity (Fig. 4e; Supplementary Fig. 7; Supplementary Table 10). These findings are potentially consistent with a process of immunoediting leading to negative selection of fusion neoantigens2. Another characteristic of tumors linked to immune evasion is somatic loss of heterozygosity of the HLA gene locus (LOH-HLA)21. We used FACETS to analyze TCGA exome data, identifying LOH-HLA in 18.4% of cases (Supplementary Table 11). LOH-HLA was associated with a higher likelihood of a fusion neoantigen being present (p = 0.018, Supplementary Table 10). While the determinants of the tumor immune microenvironment are complex and multifactorial, these results reveal a significant inverse association between measures of adaptive immunity and the presence of a fusion neoantigen. Fusion neoantigens were more frequent in tumors with more immune-depleted microenvironments or HLA loss. An important caveat is that these analyses are based on in silico predictions of neoantigen binding, and therefore cannot prove that immunoediting is the causal mechanism. Nevertheless, these data are similar to observations that the adaptive immune system can edit, or restrict the emergence of, immunogenic mutations in tumors. Prior studies have shown that somatic mutations and neoantigens are most likely to emerge in the context of low CD3+/CD8+ T cell infiltration scores, HLA Class I gene mutations, or poor HLA Class I presentation22,23,24,. It will be of interest to determine whether immunotherapies can overcome the often unfavorable immune environment in tumors with fusion neoantigens.
Finally, to assess whether there was evidence of immunoediting of fusion neoantigens during immunotherapy, we analyzed a cohort of tumors with matched pre- and on-treatment biopsies. In these melanomas treated with anti-PD-1 therapy25, we analyzed RNA-seq data for HLA typing and fusion neoantigen prediction. There were 38 matched pre- and on-therapy (at 4 weeks) pairs with a predicted fusion neoantigen present at one or both timepoints. When comparing all samples pre- to on-therapy, we observed a numerical contraction in the number of fusion neoantigens (mean 2.37 vs. 1.76, p = 0.088, Wilcoxon paired samples test). This difference was most pronounced among tumors experiencing response to therapy (2.22 vs. 0.67, p = 0.019), whereas there was no difference in tumors that were stable (2.29 vs. 1.71, p = 0.32) or progressing (2.53 vs. 2.47, p = 0.94) (Fig. 4f; Supplementary Fig. 8; Supplementary Table 12). The contraction observed in responding tumors was limited to fusions predicted to generate neoantigens binding to MHC. In contrast, in responding tumors, there was no contraction of fusions not predicted to generate neoantigens (9.89 vs. 9.56, p = 0.67). These data provide supportive evidence of immune-mediated elimination of tumor cells containing fusion-derived neoantigens, whereas there was no contraction of non-neoantigen fusions. It is important to note that these tumors harbored many potential neoantigens and that the fusion was not necessarily the immunodominant antigen driving tumor regression.
The advantage of targeting fusions that are putative oncogenic drivers is that they are highly clonal, appear foreign to the immune system, and it would be disadvantageous for tumors to reduce their expression. The findings presented here have implications for other low mutation burden and/or fusion-driven cancers including EWS-FLI1 in Ewing sarcoma, EML4-ALK in lung adenocarcinoma, TMPRSS2-ERG in prostate cancer, ETV6-RUNX1, FGFR3-TACC3, TEL-AML1, and others including metastatic cancers and driver fusions12. There is some evidence that these findings are likely to gain traction in other cancer types, based on prior in vitro reports of cytotoxic T cell responses against fusion-derived peptides expressed in leukemias (PML-RARα26, BCR-ABL27, ETV6-AML128, and DEK-CAN29) and sarcomas (SYT-SSX30, PAX-FKHR31). Fusion-associated neoantigens represent an important source of tumor-specific neoantigens. Oncogenic fusions with breakpoints shared across patients may have particular relevance for vaccine or engineered T cell therapies.
Methods
Biological samples and whole genome, whole exome, and RNA sequencing
After written informed patient consent under an Institutional Review Board (IRB)-approved tumor biospecimen protocol, tumor samples were obtained from patients undergoing treatment at Memorial Sloan Kettering Cancer Center (MSKCC; protocol #11–195). Tumors were immediately frozen in liquid nitrogen at the time of surgical resection and stored at −80°C. Additional tumor was also fixed for paraffin embedding. Blood was drawn from Patient MSK-HN1 and Patient ACC_M9 during follow-up visits to the clinic and PBMCs were extracted immediately in the laboratory as described below.
DNA and RNA from Patient MSK-HN1 were extracted and underwent whole-genome sequencing (WGS) and RNA sequencing (RNA-seq) at the New York Genome Center (NYGC, New York, NY). WGS of Patient MSK-HN1 tumor DNA was performed with KAPA Hyper Library Preparation, which involves DNA shearing, repair of fragment ends, A-addition to 3’ ends, ligation to Illumina adapters, and PCR amplification with 4 cycles.
Library preparation of Patient MSK-HN1 tumor mRNA was performed with the Illumina TruSeq Stranded mRNA Sample Preparation Kit. This involves oligo-dT-mediated purification of polyadenylated mRNA, mRNA fragmentation, cDNA synthesis with Superscript III and random primers (strand-specificity maintained by addition of dUTP and RNA-dependent first strand synthesis by addition of Actinomycin D), A-tailing, Illumina adapter ligation, and PCR amplification with 10 cycles. Libraries were subjected to Illumina HiSeq X sequencing, with paired end 125 bp read lengths.
WGS data from Patient MSK-HN1 normal and tumor DNA were aligned to GRCh37 human reference genome using Burrows-Wheeler Aligner (www.maq.sourceforge.net), duplicate reads marked by NovoSort (www.novocraft.com), realignment around indels and base calibration with Genome Analysis Toolkit (GATK) (www.broadinstitute.org/gsa/wiki/index.php/The_Genome_Analysis_Toolkit). Structural variants were determined by NBIC-seq (www.compbio.med.harvard.edu/BIC-seq), Crest (www.stjuderesearch.org/site/lab/zhang), Delly (www.korbel.embl.de/software.html), and BreakDancer (http://breakdancer.sourceforge.net/). For Patient MSK-HN1 RNA-seq, reads were aligned to the GRCh37.p13 genome using STAR 2.4.2a. Genes were quantified vs. Gencode v18 (www.gencodegenes.org) annotation using featureCounts from the Subread package (v1.4.3-p1). FusionCatcher (v0.99.5a) was used to detect fusions (http://code.google.com/p/fusioncatcher/). The DEK-AFF2 fusion was identified in both WGS and RNA-seq and confirmed by inspection in IGV.
All high throughput sequencing results were high quality, and all normal and tumor tissue pairs were confirmed as concordant. Normal and tumor DNA from Patient MSK-HN1 had 145 million and 282 million reads, respectively, over 99% of which correctly aligned to the reference genome. Mean target coverage for MSK-HN1 was 60X for normal DNA and 90X for tumor DNA, using Picard CollectWgsMetrics. Patient MSK-HN1 tumor RNA-seq yielded over 50 million read pairs (125 bp in length per read), over 97% mapped reads, over 85% gene assignment rate (uniquely mapped reads assigned to exons), and 1.56% rRNA reads. GEM mapper was used to detect viral sequences from unmapped or partially mapped reads in WGS and RNA sequences (http://gemlibrary.sourceforge.net.).
Among the 20 adenoid cystic carcinoma (ACC) cases, 9 were primary tumors collected at the time of surgery, and 11 were biopsies of metastatic sites. All tumor-normal pairs were confirmed as concordant. Two pairs of ACCs were matched primary and metastatic tumors from two individual patients (ACC_P3 and ACC_M3 from one patient, and ACC_P12 and ACC_M12 from another patient). ACC tumor RNA was extracted and subjected to high throughput RNA sequencing at the MSKCC Integrated Genomics Operation core facility, as described34. Normal DNA from peripheral bloods from patients was also subjected to whole-exome sequencing (WES) at MSKCC.
WES of Patient ACC_M9 normal DNA produced approximately 60 million reads, 95% of which correctly aligned, and mean read length of 125. RNA-seq of Patient ACC_M9 tumor RNA produced approximately 200 million reads, 97% of which correctly aligned, with approximately mean read length of 94. The average of the read lengths for all ACC tumor RNA-seq samples is approximately 94 (range 92–97), the average number of reads is 94, and the average number of correctly aligned reads is 95%.
HLA calling, mutation calling, alternative splicing event calling, and neoantigen-HLA binding predictions
Patient human leukocyte antigens (HLAs) were determined by OptiType (https://github.com/FRED-2/OptiType) and Polysolver23 calling from normal DNA exome sequencing data. SNV calling was performed using Somatic Sniper version 1.0.5.0 (http://gmt.genome.wustl.edu/packages/somatic-sniper/), VarScan v2.4.0 (http://varscan.sourceforge.net), Strelka v2 (https://github.com/Illumina/strelka), MuTect v 1.1.7 (http://www.broadinstitute.org/cancer/cga/mutect), and Platypus (http://www.well.ox.ac.uk/platypus). Mutations were annotated using SnpEffect and SnpSift version 4.3 (http://snpeff.sourceforge.net/). SNVs with an allele read count of less than 4 or with corresponding normal coverage of less than 7 reads were filtered out. Copy number alterations were assessed by FACETS 0.5.6 (https://sites.google.com/site/mskfacets/) with cval of 300. For alternative splicing (AS) event calling, junction coordinates corresponding to non-annotated transcripts were extracted from the STAR alignment results and categorized according to the one of the following alternative splicing events: exon-skipping, alternative 5’, alternative 3’, mutually exclusive event. Translational effect (in-frame, or out-of-frame) were inferred based on the annotation. A database of novel junctions identified in GTeX and TCGA was used to estimate the prevalence of these junctions. AS events absent in GTex or TCGA data, and with high PSI (percentage spliced inclusion; indicating the percentage of transcripts with the event) of 10% or greater were included.
For Patient MSK-HN1, all possible neoantigen peptides (9-amino acids in length) encompassing the mutated residues (for SNVs), fusion breakpoint (for gene fusions) or alternative splicing events were queried for patient-specific HLA binding by NetMHCpan 4.0 (http://www.cbs.dtu.dk/services/NetMHCpan/). Predicted peptide binding to HLA with < 2 %Rank is considered significant. All SNV nonamers predicted to bind patient HLA and all fusion peptides regardless of predicted HLA binding were tested for ability to stimulate patient T cell secretion of IFN-γ.
Neoantigen-HLA binding predictions for MYB-NFIB, NFIB-MYB, and MYBL1-NFIB fusions in ACC samples, and for melanoma samples in the study of Riaz, et al25, were generated from the INTEGRATE-Neo algorithm, which identifies transcripts spanning two genes (gene fusion transcripts) from RNA-seq data and queries fusion-derived peptides for HLA binding by using NetMHC 4.0 (https://github.com/ChrisMaherLab/INTEGRATE-Neo). HLAs were identified from RNA-seq data by the HLAminer algorithm (http://www.bcgsc.ca/platform/bioinfo/software/hlaminer), which can call more than 6 HLAs per sample due to sequence similarity among HLA subtypes, and with seq2HLA. Predicted peptide binding to HLA with < 500 nM affinity is considered significant. For the samples from Riaz, et al25, a total of 43 tumors had complete pre-therapy and on-therapy matched pairs with RNA-seq data available, of which 38 had a fusion neoantigen predicted in at least one sample.
Analysis of immune metrics
TCGA RNA-seq and purity data were downloaded from the NCI GDC Repository (https://portal.gdc.cancer.gov/repository?facetTab=files).
RNA-seq data were aligned to the hg19 genome using STAR aligner, counted with Rsamtools v1.28 (https://bioconductor.org/packages/release/bioc/html/Rsamtools.html), and annotated with UCSC hg19.knownGene (http://genome.ucsc.edu). The Union counting mode was used for mapped reads only, and Fragments Per Kilobase Of Exon Per Million Fragments Mapped (FPKM) were obtained with DESeq2 (http://www.bioconductor.org/packages/release/bioc/html/DESeq2.html). Read count capture was performed with Rsamtools and GenomicAlignments package35. Several orthogonal tools for the deconvolution of immune infiltration from RNA-seq data were implemented: Immune Infiltration Score (IIS) and T cell Infiltration Score (TIS) using single sample gene set enrichment analysis (ssGSEA)36, ESTIMATE Immune Score (ImmuneScore)37, Cytolytic Score (CYT)38, Cibersort Absolute Score (http://cibersort.stanford.edu/), and Reactome Interferon gamma39, (Reactome.org). The complete TCGA dataset of head and neck squamous cell carcinoma (HNSC) were analyzed by immune deconvolution methods and were ranked along with normalized PD-1 and PD-L1 expression levels to generate a composite z-score.
For analysis of TCGA cases with gene fusions, fusion data was downloaded from Gao, et al12 and immune metrics were downloaded from Thorsson, et al40. Analysis was limited to 5,825 samples with a fusion gene identified, representing 30 cancer types. We excluded hematologic malignancies (DLBC, LAML) and non-malignant paragangliomas (PCPG). Loss of heterozygosity of HLA class I genes (LOH-HLA) was determined by using FACETS of TCGA whole exome sequencing data with default settings (cbioportal.org). Briefly, segments within the chromosome 6p locus containing the HLA-A, -B, and -C loci were identified, and loss of heterozygosity (LOH) was defined as a minor allele copy number estimate of 0 for any of the HLA loci using the expectation-maximization model41,42. Cancer type and somatic mutational burden were each significantly associated with fusion neoantigen status in univariate analysis, and these were included as covariates in multivariable analysis. Multivariable logistic regression was used to evaluate the association of the presence of a fusion neoantigen with leukocyte fraction (from methylation data), lymphocyte infiltration (from RNA-seq data), the proportions of infiltrating CD8+ T cells, activated NK cells, macrophages, Th1 cells, and Th2 cells40, measures of immune cell activation such as the CYT score38 and IFNγ response pathway, and LOH-HLA, in all cases including tumor histology and tumor mutational burden as covariates.
Reagents
Peptides were synthesized by Genscript and resuspended in DMSO. Recombinant human β2-microglobulin was purchased from BD (cat# 551089). Fluorescent peptide-dextramer-phycoerythrin (QFIDSSWYL-dextramer-PE) complexes were synthesized by Immudex. Cytofix/Cytoperm (BD cat #51–2090KZ) and Perm/wash 10X Buffer (BD cat# 51–2091KZ) were used according to the manufacturer’s instructions. Cell Trace Far Red was purchased from Thermo (cat# C34564). Anti-CD3/CD28 beads were purchased from Gibo (cat# 11131D). Recombinant human IL-2 (cat# 402-ML-020), Recombinant human IL-15 (cat# 447-ML-010) and IFN-γ ELISpot plates were purchased from R&D Systems. Recombinant human GM-CSF (cat# 300–03) and recombinant human IL-4 (cat# 200–04) were purchased from Peprotech. All cell media were purchased from Thermo. Human serum was purchased from Sigma (cat# H3667).
For RNA in situ hybridization of MSK-HN1 tumor samples, probes against high-risk HPV subtypes 16, 18, 26, 31, 33, 35, 39, 45, 51, 52, 53, 56, 58, 59, 66, 68, 73, and 82 (HS-HPV HR18), low-risk HPV subtypes 6, 11, 40, 43, 44, 54, 69, 70, 71, and 74 (HPV LR10), probes against HPV E6 and E7 genes, and RNAScope® 2.5 LS Reagent Kit - Brown were purchased from Advance Cell Diagnostics.
For immunohistochemical staining of MSK-HN1 tumor samples, the antibodies are listed with the supplier, catalogue number, and dilution: anti-CD3 (Leica cat# NCL-L-CD3–565, 1:100), anti-CD8 (Ventana, cat#790–4460, no dilution), anti-CD45 (Ventana cat# 760–2505, no diution), and anti-PD-L1 (Cell Signaling ca# 13684, 1:800).
For cell-based assays, the antibodies used are listed with the supplier, catalogue number, and dilution: PE-anti-HLA-A2 clone BB7.2 (BD cat # 343306, 1:500), Alexa Fluor 594 anti-HLA-A clone EP1395Y (Abcam cat# 207872, 1:1,000), polyclonal anti-HLA-B (Invitrogen cat# PA5–35345, 1:1,000), anti-HLA-C clone DT9 (Biolegend cat# 373302, 1:1,000), PE-Cy5.5-F(ab’)2-goat anti-mouse-IgG H+L (Invitrogen cat# M35018, 1:200), PE-F(ab’)2-goat anti-rabbit IgG H+L (Invitrogen cat#31864, 1:200), Alexa Fluor 405 anti-CD3e Clone UCHT1 (Thermo cat# CD0326, 1:100), PerCP/Cy5.5 anti-CD4 Clone A161A1 (Biolegend cat# 357414, 1:100), APC-H7 anti-CD8 Clone SKI (BD cat# 560179, 1:100), APC anti-PD-1 Clone M1H4 (eBioscience cat# 17–9969–42, 1:100), PE/Dazzle 594 anti-CD137 Clone 4B4–1 (Biolegend cat# 309825, 1:100), PE anti-CD40L Clone 24–31 (Biolegend cat# 310805, 1:100), Aqua Live/Dead (cat# L34966, 1:1,000), PE anti-active caspase-3 (BD cat# 550821, 1:50), anti-c-Myb Clone D2R4Y (Cell Signaling cat# 12319, 1:1,000), anti-DEK Clone E1L3V (Cell Signaling cat# 13962, 1:1,000), anti-HLA-ABC Monoclonal Antibody Clone W6/32 (Memorial Sloan Kettering Cancer Center antibody and bioresource core facility).
Histology and immunohistochemistry
Histopathologic analyses were conducted by subspecialty pathologists (R.G. and N.K.). Hematoxylin and eosin (H&E) staining of formalin-fixed paraffin-embedded (FFPE) slides was performed by standard histology techniques. Immunohistochemical staining for CD45, CD3, CD8, and PD-L1 was performed on FFPE slides using standard techniques.
Fluorescent in situ Hybridization (FISH) to detect the DEK-AFF2 fusion
FISH analysis was performed at Molecular Cytogenetics Core Facility at MSKCC, on FFPE slides using a probe mix that consisted of BAC clones spanning DEK (6p22; RP11–204B7, RP11–298J15, RP11–95C19; labeled with Red-dUTP) and AFF2 (Xq28; RP11–64L19, RP11–480N18, RP11–1031A22, RP11–75A14; labeled with Green-dUTP). Slides were scanned using a Zeiss Axioplan 2i epifluorescence microscope equipped with CoolCube 1 CCD camera controlled by Isis 5.5.10 imaging software (MetaSystems Group Inc, Waltham, MA).
Cells
Peripheral blood mononuclear cells (PBMCs) were isolated from blood samples by centrifugation in CPT tubes at 1,500g for 20 min without brakes and extraction of the white cell layer. PBMCs were cultured in complete IMDM (IMDM supplemented with GlutaMax and 10% human serum, 100 U/ml penicillin, and 100 μg/ml streptomycin).
Immature DCs were isolated from healthy donor or patient PBMCs using the plastic-adherence method, as described by Tran, et al43 in AIM-V media supplemented with GM-CSF (1,000 U/ml) and IL-4 (200 U/ml) over 6 days. Cell media was replenished on the third day.
T cells were isolated from PBMCs by pan-expansion using anti-CD3/anti-CD28 beads, IL-2 (30 U/ml), and IL-15 (10 ng/ml) and cultured in complete IMDM media. Cytokines were replenished every 3 days.
T2 cells, which are TAP-deficient, were cultured in IMDM supplemented with 10% fetal bovine serum (FBS), 100 U/ml penicillin, and 100 μg/ml streptomycin.
SCC-9 cells were cultured in DME:F12 (1:1) supplemented with 1.2 g/L sodium bicarbonate, 2.5 mL L-glutamine, 15 mM HEPES, 0.5 mM sodium pyruvate, 400 ng/ml hydrocortisone, and 10% fetal bovine serum.
COS-7 and HEK293 cells were cultured in DMEM supplemented with 10% FBS.
Fusion construct cloning and expression
RNA extracted from Patient MSK-HN1 FFPE slides were used as a template for reverse transcription with oligo-dT primers. PCR primer sequences and cloning strategies are listed in Supplementary Table 4. DEK N-terminus (non-neoantigenic control) and DEK-AFF2 fusion were cloned into pcRNA6SL (a kind gift from Dr. Steven Rosenberg, NIH, Bethesda, MD) and pLVX-Puro (Clontech) via EcoRI and BamHI restriction sites. Similarly, the MYB N-terminus, and MYB-NFIB and NFIB-MYB fusions were cloned from patient cDNA and inserted into pcRNA6SL by Golden Gate cloning strategies described in Supplementary Table 9. Plasmid inserts were fully sequenced to confirm proper cloning.
HEK293 cells were transiently transfected with pcRNA-MYB-N-terminus or pcRNA-MYB-NFIB constructs. Whole-cell lysate was collected after 48 hr to confirm the expression of the constructs by immunoblotting with anti-MYB antibody. Full scan of immunoblotting is available at https://figshare.com/s/8f7da692902f1239ccf0.
Lentiviruses were generated by co-transfection of HEK293 cells with pLVX constructs, psPAX2, and pMD2.G, and used to infect SCC-9 target cells using standard techniques. Infected SCC-9 cells were selected in 1.5 μg/ml puromycin. Expression of DEK and DEK-AFF2 was confirmed by immunoblotting with anti-DEK antibody. Full scan of immunoblotting is available at https://figshare.com/s/8eede6b3f4ad46bd6b39.
HLA stabilization assays
100,000–500,000 T2 cells or patient PBMCs were resuspended in 200 μl complete IMDM with 5 μg/ml recombinant human β2 microglobulin, and incubated with 10 μM of the indicated peptides for 18 hr at 37°C in 96-well plates (peptide pulse). Cells were stained with fluorescent anti-HLA antibodies for 30 min in the dark at 4°C.
To test peptide binding to Patient MSK-HN1 HLAs that are not HLA-A*02:01, T2 cells were individually electroporated with 2 μg pcDNA3.1-HLA-P2A-eGFP constructs (HLA sequences synthesized by Genscript) encoding each HLA and GFP by a single electric pulse of 150V for 10 ms (ECM 830, BTX Harvard Bioscience) in OptiMEM. Cells were incubated in complete media for 3 days, and then GFP+ cells were sorted by the Flow Cytometry Core Facility at MSKCC. Transfected cells were pulsed with 10 μM of the indicated peptides for 18 hr at 37°C, and then stained with direct immunofluorescence (incubate with fluorophore-conjugated anti-HLA antibodies for 30 min in the dark at 4°C), or indirect immunofluorescence (incubate with anti-HLA antibodies for 30 min in the dark at 4°C, washed, and then incubated with the secondary antibody. Cell surface HLA levels were measured by flow cytometry analysis (Fortessa, BD) of the mean fluorescence intensity (MFI) signal from the fluorescent antibodies.
IFN-γ enzyme-linked immunospot (ELISpot) and flow cytometry co-culture assays
Dendritic cells, T2 cells, or PBMCs were used antigen presenting cells (APCs). For dendritic cells, mRNA was produced by in vitro transcription with a 5’ cap analog and 3’ polyadenylation using the HiScribe T7 ARCA mRNA with tailing Kit (New England Biolabs) and purified NotI-linearized pcRNA6SL constructs as template. 1 × 10⁶ DCs were resuspended in 200 μl OptiMEM and 2 μg of in vitro synthesized mRNA, and received a single electric pulse 150V for 10 ms. The DCs were allowed to recover in complete IMDM media supplemented with 200 U/ml IL-4 at 37°C overnight, and were then washed with serum free RPMI, and co-cultured with T cells. Alternatively, T2 cells or PBMCs were pulsed with peptide, as described above, irradiated with 50 Gy, and then co-cultured with T cells. 20,000 T cells were co-cultured with APCs at 1:1 ratio (unless otherwise stated) in complete IMDM overnight at 37°C on the IFN-γ ELISpot plates (R&D Systems).
T cells were then extracted from the ELISpot plates, washed with FACS buffer (PBS with 2% FBS), and stained with fluorophore-conjugated antibodies targeting cell surface proteins (CD4, CD8, PD-1) for 30 min in the dark at 4°C. Cells were washed three times with FACS buffer and analyzed by flow cytometry. IFN-γ ELISpot plates were developed according to the manufacturer’s instructions. Statistical testing was performed with two-tailed t-test, or single-tailed t-test if a directional hypothesis was tested in a second orthogonal experiment.
Expansion and detection of fusion neoantigen peptide-specific T cells
PBMCs or T2 cells were pulsed with 10 μM peptides and irradiated with 50 Gy to serve as antigen presenting cells for T cell expansions. T cells were cultured with the irradiated cells in the presence of IL-2 (30 U/ml) and IL-15(10 ng/ml) and analyzed on day 21. The cytokines were replenished every 3 days. DKESEEEVS-reactive T cells were detected with IFN-γ secretion assay (Miltenyi Biotec) following the manufacture’s protocol. QFIDSSWYL-specific T cells were stained with QFIDSSWYL-dextramer-PE (diluted 1:50 in FACS buffer) for 30 min at room temperature in the dark. Neoantigen-specific T cells were then analyzed/sorted by flow cytometry.
Active-caspase-3 assay
SCC-9 cells expressing DEK-N-terminus or DEK-AFF2 were labeled by CellTrace Far Red and co-cultured with pan-expanded T cells from Patient MSK-HN1 for 3 hr and then fixed and permeabilized with Cytofix/Cytoperm, stained with PE-labeled anti-active-caspase-3 antibody and CellTrace Far Red, and analyzed by flow cytometry.
TCR-Vβ deep sequencing and statistical testing
TCR-Vβ deep sequencing was performed by immune repertoire sequencing (iRepertoire) on mRNA or immunoSEQ (Adaptive Biotechnologies) on genomic DNA isolated from FFPE tumor tissue, peripheral blood mononuclear cells and T cells. We reasoned that T cell receptors that are neoantigen-specific would be present at an appreciable frequency in the DKESEEEVS-stimulated IFNγ+ population and present in at least one of the patient tumor or blood populations. Of the 1525 T cell receptor beta chain CDR3s identified via our IFNγ capture assay, 121 overlapped with at least one of the patient sample populations. We tested whether the CDR3s identified in patient blood and tissue samples during immunotherapy were enriched for those in the IFNγ capture assay population, by comparing the overlap of patient sample CDR3s and IFNγ+ capture T cell CDR3s, compared to unselected (bulk population) CDR3s. Of the 763 clones present above median frequency in the IFNγ+ population, 71 were present in at least one of the blood sample populations. We conducted a permutation test sampling 763 random CDR3s from the bulk population and overlapping with the blood populations over 10,000 iterations, and found that only 16/10,000 (p = 0.016) iterations produced overlap greater than or equal to the observed overlap. Analyses were conducted in R version 3.5.0.
GLIPH TCR sequence clustering
GLIPH (grouping of lymphocyte interactions by paratope hotspots) clusters TCRs with a high probability of sharing specificity owing to both conserved motifs and global similarity of CDR3 sequences, that are predicted to bind the same MHC-restricted peptide antigen44. GLIPH TCR sequence clustering was performed using GLIPH (version 1.0rc) against a filtered background set consisting of CDR3s in the negative control (IFNγ+ population excluded from bulk poluplation).
Statistical analysis
For comparisons with multiple groups, one-way ANOVA relative to the control sample was performed with Dunnett’s correction for multiple comparisons. For comparisons between two groups, two-tailed t-tests, one-tailed t-tests for directional hypothesis testing in limited samples, two-tailed non-parametric Wilcoxon tests, for either independent or paired samples, were performed. All plots are shown as mean ± standard error of the mean.
Life Science Reporting Summary
Further information on experimental design is available in the Nature Research Reporting Summary linked to this article.
Data Availability
Whole exome and RNA sequencing data have been deposited in SRA and are available under project number PRJNA527992.
Extended Data
Extended Data Fig. 1. Visualization of DEK-AFF2 and AFF2-DEK gene fusions.
Visualization of the DEK-AFF2 (a) and AFF2-DEK (b) gene fusions in the primary tumor of Patient MSK-HN1 shown on IGV plots of RNA-seq data.
Extended Data Fig. 2. Screen of SNV-derived and alternative splicing-derived 9-mer peptides.
a. A screen for binding of SNV-derived 9-mer peptides (10 µM) to HLA-A*02:01 on T2 cells reveals no peptides with significant binding affinity. The MFI values are normalized to DMSO. NY-ESO-1 was used as a positive control. b. IFN-γ ELISpot assay of Patient MSK-HN1 T cells after 18 hr co-culture with autologous PBMCs (n=3) pulsed with 10 µM of indicated peptides derived from mutations. Due to limited numbers of autologous PBMCs, in several samples (<1>, <2>, <3>, <4>, <5>, and <6>), multiple mutant-derived peptides corresponding to a single wild-type peptide were pulsed together. The grouped peptides are indicated. c. IFN-γ ELISpot assay of Patient MSK-HN1 T cells after 18 hr co-culture with autologous PBMCs (n=3) pulsed with 10 µM of indicated peptides derived from potential alternative splicing events. Means ± s.e.m. are plotted, with sample n representing the number of independently treated samples.
Extended Data Fig. 3. DEK-AFF2 generates an immuno-stimulatory peptide recognized by autologous T cells.
a. Flow cytometry analysis of CD137 expression on CD8+ T cells after 18 hr co-culture with patient MSK-HN1 PBMCs pulsed with indicated peptides. Data are representative of two independent experiments. b. IFN-γ ELISpot assay of Patient MSK-HN1 T cells after 18 hr co-culture with autologous PBMCs (n=3) which have been pulsed with DMSO or DEKSEEEVS peptide, co-treated with either IgG control or anti-MHC Class I antibody overnight. (Two-tailed t-tests, 95%CI=-2.187 to 19.85, Effect size Eta Squared=0.685, P=0.042) c. IFN-γ ELISpot assay of Patient MSK-HN1 T cells after 18 hr co-culture with SCC-9 expressing DEK-N-term or DEK-AFF2 fusion (n=3). Cells are treated with either IgG control or anti-MHC Class I antibody. (Two-tailed t-tests, 95%CI= -278.3 to -147.7, Effect size Eta Squared=0.954, P=0.0008) d. IFN-γ ELISpot assay of Patient MSK-HN1 T cells after 18 hr co-culture with COS-7 cells (n=3) co-transfected with HLA-C*04:01 plasmid and pLVX-DEK-N-term or pLVX-DEK-AFF2. T cells and COS-7 cells were used at 6:1 ratio. (Two-tailed t-test, 95%CI=48.73 to 571.9, Effect size Eta Squared=0.731, P=0.0301). e. Active caspase-3 staining of SCC-9 target cells (n=2) expressing either DEK-N-term or DEK-AFF2 fusion after 3 hr incubation with MSK-HN1 CD8+ TEM cells (CCR7-CD45RA-) at the indicated ratios. Means ± s.e.m. are plotted, with sample n representing the number of independently treated samples.
Extended Data Fig. 4. Screen of HLA binding by fusion peptides predicted to bind to members of HLA-A2 alleles.
The graphs show stabilization of HLA-A*02:01 on the surface of T2 cells by MYB-NFIB and MYBL1-NFIB peptides (a) and NFIB-MYB peptides (b). The peptides in which we further tested are indicated by arrows. Data are representative of two independent experiments.
Extended Data Fig. 5. Validation of MYB-NFIB and NFIB-MYB fusions.
Validation of MYB-NFIB and NFIB-MYB fusions expressed in ACC_M9 by visualization on IGV plots of RNA-seq data.
Extended Data Fig. 6. Schematic of ACC_M9, ACC_M1, ACC_P11, ACC_P14-derived MYB-NFIB fusion constructs that were cloned into pcRNA6SL.
The amino acid sequences surrounding the junctions are shown. Predicted HLA-A2-binding peptides derived from each fusion are indicated.
Extended Data Fig. 7. MYB-NFIB generates an immuno-stimulatory peptide recognized by ACC_M9 T cells.
a. IFN-γ ELISpot assay of ACC_M9 T cells after 18 hr co-culture with healthy donor HD1 dendritic cells electroporated with 2 µg of in vitro transcribed mRNA as described in the methods. b. IFN-γ ELISpot assay of ACC_M9 T cells after 18 hr co-culture with T2 cells pulsed with 10 µM of indicated peptides. Data are representative of two independent experiments.
Extended Data Fig. 8. PD-1, CD40L, and CD137 expression on ACC_M9 T cells after 18 hr co-culture with autologous PBMCs pulsed with the indicated peptides.
Flow cytometry analysis of ACC_M9 PBMCs after 18 hr pulse with the indicated peptides (n=3). The immunogenic peptide QFIDSSWYL led to an increased fraction of CD8+ T cells that are CD137+, CD40L+, or PD-1+. Data are representative of three independent experiments.
Extended Data Fig. 9. Patient ACC_M9 CD8+ T cells that specifically bind to HLA-A*02:01-presented QFIDSSWYL peptide proliferate over 21 days during co-culture with irradiated peptide-pulsed T2 cells.
Patient ACC_M9 T cells were expanded on irradiated T2 pulsed with 10 µM of indicated peptides over 21 days and stained with QFIDSSWYL-dextramer-PE. A population of QFIDSSWYL-specific T cells are selectively expanded. Fold-change of dextramer-positive T cells from duplicate experiments were compared with two-tailed t-tests. Data are representative of two independent experiments.
Extended Data Fig. 10. Healthy donor T cells are stimulated by MYB-NFIB-derived and NFIB-MYB-derived peptides.
IFN-γ ELISpot assay of healthy donors HD2 and HD3 T cells after 18 hr co-culture with T2 cells pulsed with 10 µM of indicated peptides. Data are representative of two independent experiments.
Supplementary Material
Acknowledgments:
The authors wish to acknowledge our patients and their families who selflessly contributed time and samples to support this research, the patients and investigators who contributed to the TCGA studies analyzed here, members of the Timothy Chan Lab for insightful discussions, members of the MSKCC Immunogenomics and Precision Oncology Platform, and the Molecular Cytology Core Facility of MSKCC.
Funding: This work was supported by the NIH/NCI Cancer Center Support Grant P30 CA008748 (to MSKCC), Cycle for Survival (R.J.W., L.G.T.M., T.A.C.), The Frederick Adler Chair at MSKCC, The Jayme Flowers Fund, The Sebastian Nativo Fund, The Damon Runyon Cancer Research Foundation, NIH K08 DE024774, NIH R01 DE027738 (L.G.T.M.), The Adenoid Cystic Carcinoma Cancer Research Foundation, (T.A.C., A.L.H., L.G.T.M.), NIH R01 CA205426, NIH R35 CA232097, The Pershing Square Sohn Cancer Research Alliance, the STARR Cancer Consortium, and The PaineWebber Chair at MSKCC (T.A.C.).
Footnotes
Competing interests:
K.-W.L. and J.S.S. are now full-time employees of Regeneron Pharmaceuticals. R.M.Srivastava received speaker fees and travel reimbursement from Innovent Biologics, Inc. A.L.H. receives research funding from Eisai, Bristol-Myers Squibb, Kura Oncology, AstraZeneca, Genentech Roche, Celldex, Pfizer, Lilly and Bayer; consulting fees from Bristol-Myers Squibb, Merck, Novartis, AstraZeneca, Regeneron, Sanofi Aventis, Sun Pharmaceuticals, Eisai, Genentech/Roche, Genzyme and Ayala Pharmaceuticals; and travel fees from Ignyta and Kura Oncology. J.J.H’s spouse is a full-time employee of Regeneron Pharmaceuticals. R.M.Samstein, T.A.C. and L.G.T.M. are inventors on a provisional patent application (62/569,053) filed by Memorial Sloan Kettering (MSK) relating to the use of TMB in cancer immunotherapy. D.C. and T.A.C. are inventors on a PCT patent application (PCT/US2015/062208) filed by MSK relating to the use of TMB in cancer immunotherapy. MSK and the inventors may receive a share of commercialization revenue from license agreements relating to these patent applications. TAC is a co-founder of Gritstone Oncology and holds equity. TAC acknowledges grant funding from Bristol-Myers Squibb, AstraZeneca, Illumina, Pfizer, An2H, and Eisai. TAC has served as an advisor for Bristol-Myers Squibb, Illumina, Eisai, and An2H. L.G.T.M. received consulting fees from Rakuten Aspyrian and speaker fees from Physician Educational Resources.
References
- 1.Coulie PG, Van den Eynde BJ, van der Bruggen P & Boon T Tumour antigens recognized by T lymphocytes: at the core of cancer immunotherapy. Nat Rev Cancer 14, 135–146, doi: 10.1038/nrc3670 (2014). [DOI] [PubMed] [Google Scholar]
- 2.Schreiber RD, Old LJ & Smyth MJ Cancer immunoediting: integrating immunity’s roles in cancer suppression and promotion. Science 331, 1565–1570, doi: 10.1126/science.1203486 (2011). [DOI] [PubMed] [Google Scholar]
- 3.Sharma P & Allison JP The future of immune checkpoint therapy. Science 348, 56–61, doi: 10.1126/science.aaa8172 (2015). [DOI] [PubMed] [Google Scholar]
- 4.Rosenberg SA & Restifo NP Adoptive cell transfer as personalized immunotherapy for human cancer. Science 348, 62–68, doi: 10.1126/science.aaa4967 (2015). [DOI] [PMC free article] [PubMed] [Google Scholar]
- 5.Ott PA et al. An immunogenic personal neoantigen vaccine for patients with melanoma. Nature 547, 217–221, doi: 10.1038/nature22991 (2017). [DOI] [PMC free article] [PubMed] [Google Scholar]
- 6.Snyder A et al. Genetic basis for clinical response to CTLA-4 blockade in melanoma. N Engl J Med 371, 2189–2199, doi: 10.1056/NEJMoa1406498 (2014). [DOI] [PMC free article] [PubMed] [Google Scholar]
- 7.McGranahan N et al. Clonal neoantigens elicit T cell immunoreactivity and sensitivity to immune checkpoint blockade. Science 351, 1463–1469, doi: 10.1126/science.aaf1490 (2016). [DOI] [PMC free article] [PubMed] [Google Scholar]
- 8.Samstein RM LC, Shoushtari AN, Hellmann MD, et al. Tumor mutational load predicts survival after immunotherapy across multiple cancer types. Nature Genet. 51, 202–206 (2019). [DOI] [PMC free article] [PubMed] [Google Scholar]
- 9.Ilyas S & Yang JC Landscape of Tumor Antigens in T Cell Immunotherapy. J Immunol 195, 5117–5122, doi: 10.4049/jimmunol.1501657 (2015). [DOI] [PMC free article] [PubMed] [Google Scholar]
- 10.Shukla SA et al. Cancer-Germline Antigen Expression Discriminates Clinical Outcome to CTLA-4 Blockade. Cell 173, 624–633 e628, doi: 10.1016/j.cell.2018.03.026 (2018). [DOI] [PMC free article] [PubMed] [Google Scholar]
- 11.Stevanovic S et al. Landscape of immunogenic tumor antigens in successful immunotherapy of virally induced epithelial cancer. Science 356, 200–205, doi: 10.1126/science.aak9510 (2017). [DOI] [PMC free article] [PubMed] [Google Scholar]
- 12.Gao Q et al. Driver Fusions and Their Implications in the Development and Treatment of Human Cancers. Cell Rep 23, 227–238 e223, doi: 10.1016/j.celrep.2018.03.050 (2018). [DOI] [PMC free article] [PubMed] [Google Scholar]
- 13.Adams AK et al. DEK promotes HPV-positive and -negative head and neck cancer cell proliferation. Oncogene 34, 868–877, doi: 10.1038/onc.2014.15 (2015). [DOI] [PMC free article] [PubMed] [Google Scholar]
- 14.Qin H, Malek S, Cowell JK & Ren M Transformation of human CD34+ hematopoietic progenitor cells with DEK-NUP214 induces AML in an immunocompromised mouse model. Oncogene 35, 5686–5691, doi: 10.1038/onc.2016.118 (2016). [DOI] [PMC free article] [PubMed] [Google Scholar]
- 15.Forbes SA et al. COSMIC: somatic cancer genetics at high-resolution. Nucleic Acids Res 45, D777–D783, doi: 10.1093/nar/gkw1121 (2017). [DOI] [PMC free article] [PubMed] [Google Scholar]
- 16.Cancer Genome Atlas N Comprehensive genomic characterization of head and neck squamous cell carcinomas. Nature 517, 576–582, doi: 10.1038/nature14129 (2015). [DOI] [PMC free article] [PubMed] [Google Scholar]
- 17.Scholtalbers J et al. TCLP: an online cancer cell line catalogue integrating HLA type, predicted neo-epitopes, virus and gene expression. Genome Med 7, 118, doi: 10.1186/s13073-015-0240-5 (2015). [DOI] [PMC free article] [PubMed] [Google Scholar]
- 18.Wouter Scheper SK, et al. Low and variable tumor reactivity of the intratumoral TCR repertoire in human cancers. Nature Medicine, doi: 10.1038/s41591-41018-40266-41595 (2018). [DOI] [PubMed] [Google Scholar]
- 19.Persson M et al. Recurrent fusion of MYB and NFIB transcription factor genes in carcinomas of the breast and head and neck. Proc Natl Acad Sci U S A 106, 18740–18744, doi: 10.1073/pnas.0909114106 (2009). [DOI] [PMC free article] [PubMed] [Google Scholar]
- 20.Stronen E et al. Targeting of cancer neoantigens with donor-derived T cell receptor repertoires. Science 352, 1337–1341, doi: 10.1126/science.aaf2288 (2016). [DOI] [PubMed] [Google Scholar]
- 21.McGranahan N et al. Allele-Specific HLA Loss and Immune Escape in Lung Cancer Evolution. Cell 171, 1259–1271 e1211, doi: 10.1016/j.cell.2017.10.001 (2017). [DOI] [PMC free article] [PubMed] [Google Scholar]
- 22.Marty R et al. MHC-I Genotype Restricts the Oncogenic Mutational Landscape. Cell 171, 1272–1283 e1215, doi: 10.1016/j.cell.2017.09.050 (2017). [DOI] [PMC free article] [PubMed] [Google Scholar]
- 23.Shukla SA et al. Comprehensive analysis of cancer-associated somatic mutations in class I HLA genes. Nat Biotechnol 33, 1152–1158, doi: 10.1038/nbt.3344 (2015). [DOI] [PMC free article] [PubMed] [Google Scholar]
- 24.Angelova MMB, Vasaturo A, et al. Evolution of Metastases in Space and Time under Immune Selection.. Cell 175(3):751–765. (2018). [DOI] [PubMed] [Google Scholar]
- 25.Riaz N et al. Tumor and Microenvironment Evolution during Immunotherapy with Nivolumab. Cell 171, 934–949 e915, doi: 10.1016/j.cell.2017.09.028 (2017). [DOI] [PMC free article] [PubMed] [Google Scholar]
- 26.Gambacorti-Passerini C et al. Human CD4 lymphocytes specifically recognize a peptide representing the fusion region of the hybrid protein pml/RAR alpha present in acute promyelocytic leukemia cells. Blood 81, 1369–1375 (1993). [PubMed] [Google Scholar]
- 27.Buzyn A et al. Peptides derived from the whole sequence of BCR-ABL bind to several class I molecules allowing specific induction of human cytotoxic T lymphocytes. Eur J Immunol 27, 2066–2072, doi: 10.1002/eji.1830270834 (1997). [DOI] [PubMed] [Google Scholar]
- 28.Yotnda P et al. Cytotoxic T cell response against the chimeric ETV6-AML1 protein in childhood acute lymphoblastic leukemia. J Clin Invest 102, 455–462, doi: 10.1172/JCI3126 (1998). [DOI] [PMC free article] [PubMed] [Google Scholar]
- 29.Makita M et al. Leukemia-associated fusion proteins, dek-can and bcr-abl, represent immunogenic HLA-DR-restricted epitopes recognized by fusion peptide-specific CD4+ T lymphocytes. Leukemia 16, 2400–2407, doi: 10.1038/sj.leu.2402742 (2002). [DOI] [PubMed] [Google Scholar]
- 30.Sato Y et al. Detection and induction of CTLs specific for SYT-SSX-derived peptides in HLA-A24(+) patients with synovial sarcoma. J Immunol 169, 1611–1618 (2002). [DOI] [PubMed] [Google Scholar]
- 31.van den Broeke LT, Pendleton CD, Mackall C, Helman LJ & Berzofsky JA Identification and epitope enhancement of a PAX-FKHR fusion protein breakpoint epitope in alveolar rhabdomyosarcoma cells created by a tumorigenic chromosomal translocation inducing CTL capable of lysing human tumors. Cancer Res 66, 1818–1823, doi: 10.1158/0008-5472.CAN-05-2549 (2006). [DOI] [PubMed] [Google Scholar]
- 32.Lawrence MS et al. Discovery and saturation analysis of cancer genes across 21 tumour types. Nature 505, 495–501, doi: 10.1038/nature12912 (2014). [DOI] [PMC free article] [PubMed] [Google Scholar]
- 33.Ho AS et al. The mutational landscape of adenoid cystic carcinoma. Nat Genet 45, 791–798, doi: 10.1038/ng.2643 (2013). [DOI] [PMC free article] [PubMed] [Google Scholar]
Methods-only References
- 34.Dalin MG et al. Multi-dimensional genomic analysis of myoepithelial carcinoma identifies prevalent oncogenic gene fusions. Nat Commun 8, 1197, doi: 10.1038/s41467-017-01178-z (2017). [DOI] [PMC free article] [PubMed] [Google Scholar]
- 35.Lawrence M et al. Software for computing and annotating genomic ranges. PLoS Comput Biol 9, e1003118, doi: 10.1371/journal.pcbi.1003118 (2013). [DOI] [PMC free article] [PubMed] [Google Scholar]
- 36.Senbabaoglu Y et al. Tumor immune microenvironment characterization in clear cell renal cell carcinoma identifies prognostic and immunotherapeutically relevant messenger RNA signatures. Genome Biol 17, 231, doi: 10.1186/s13059-016-1092-z (2016). [DOI] [PMC free article] [PubMed] [Google Scholar]
- 37.Yoshihara K et al. Inferring tumour purity and stromal and immune cell admixture from expression data. Nat Commun 4, 2612, doi: 10.1038/ncomms3612 (2013). [DOI] [PMC free article] [PubMed] [Google Scholar]
- 38.Rooney MS, Shukla SA, Wu CJ, Getz G & Hacohen N Molecular and genetic properties of tumors associated with local immune cytolytic activity. Cell 160, 48–61, doi: 10.1016/j.cell.2014.12.033 (2015). [DOI] [PMC free article] [PubMed] [Google Scholar]
- 39.Mandal R et al. The head and neck cancer immune landscape and its immunotherapeutic implications. JCI Insight 1, e89829, doi: 10.1172/jci.insight.89829 (2016). [DOI] [PMC free article] [PubMed] [Google Scholar]
- 40.Thorsson V et al. The Immune Landscape of Cancer. Immunity 48, 812–830 e814, doi: 10.1016/j.immuni.2018.03.023 (2018). [DOI] [PMC free article] [PubMed] [Google Scholar]
- 41.Shen R & Seshan VE FACETS: allele-specific copy number and clonal heterogeneity analysis tool for high-throughput DNA sequencing. Nucleic Acids Res 44, e131, doi: 10.1093/nar/gkw520 (2016). [DOI] [PMC free article] [PubMed] [Google Scholar]
- 42.Chowell D et al. Patient HLA class I genotype influences cancer response to checkpoint blockade immunotherapy. Science 359, 582–587, doi: 10.1126/science.aao4572 (2018). [DOI] [PMC free article] [PubMed] [Google Scholar]
- 43.Tran E et al. Immunogenicity of somatic mutations in human gastrointestinal cancers. Science 350, 1387–1390, doi: 10.1126/science.aad1253 (2015). [DOI] [PMC free article] [PubMed] [Google Scholar]
- 44.Jacob Glanville HH, et al. Identifying specificity groups in the T cell receptor repertoire. Nature 547(7661):94–98 (2017). [DOI] [PMC free article] [PubMed] [Google Scholar]
Associated Data
This section collects any data citations, data availability statements, or supplementary materials included in this article.
Supplementary Materials
Data Availability Statement
Whole exome and RNA sequencing data have been deposited in SRA and are available under project number PRJNA527992.


