

Abstract
Caveolae are 50–100 nm, nonclathrin-coated, flask-shaped plasma membrane microdomains that have been identified in most mammalian cell types, except lymphocytes and neurons. To date, multiple functions have been ascribed to caveolae, including the compartmentalization of lipid and protein components that function in transmembrane signaling events, biosynthetic transport functions, endocytosis, potocytosis, and transcytosis. Caveolin, a 21–24 kDa integral membrane protein, is the principal structural component of caveolae. We have initiated studies to examine the relationship of detergent-insoluble complexes identified in astrocytes to the caveolin–caveolae compartment detected in cells of peripheral tissues. Immunolocalization studies performed in astrocytes reveal caveolin immunoreactivity in regions that correlate well to the distribution of caveolae and caveolin determined in other cell types, and electron microscopic studies reveal multiple clusters of flask-shaped invaginations aligned along the plasma membrane. Immunoblot analyses demonstrate that detergent-insoluble complexes isolated from astrocytes are composed of caveolin-1α, an identification verified by Northern blot analyses and by the cloning of a cDNA using reverse transcriptase-PCR amplification from total astrocyte RNA. Using a full-length caveolin-1 probe, Northern blot analyses suggest that the expression of caveolin-1 may be regulated during brain development. Immunoblot analyses of detergent-insoluble complexes isolated from cerebral cortex and cerebellum identify two immunoreactive polypeptides with apparent molecular weight and isoelectric points appropriate for caveolin. The identification of caveolae microdomains and caveolin-1 in astrocytes and brain, as well as the apparent regulation of caveolin-1 expression during brain development, identifies a cell compartment not detected previously in brain.
Keywords: caveolae, caveolin, astroglial cells, nervous system proteins, plasmalemmal vesicles, membrane transport
Caveolae are a subset of nonclathrin-coated invaginations of the plasma membrane that have been identified in most mammalian cells (Palade, 1953; Yamada, 1955;Bretscher and Whytock, 1977; Anderson, 1993). Although a large repertoire of functions has been attributed to caveolae, several lines of evidence suggest that caveolae may compartmentalize lipid and protein components that participate in transmembrane signaling events (Anderson, 1993; Lisanti et al., 1994b). Among the spectrum of cell-signaling components identified within caveolae are G-protein-coupled receptors, glycosylphosphatidylinositol-anchored proteins, Gα and Gβ subunits of heterotrimeric GTP-binding proteins, Ras-related GTP-binding proteins, inositol 1,4,5-triphosphate receptors and receptor-like proteins, inositol 1,4,5-triphosphate-dependent calcium channel members of the Src tyrosine kinase family, Src homology 2 adapters, protein kinase Cα, and the ERK-2 isoform of MAP kinase (Brown and Rose, 1992;Fujimoto et al., 1992, 1995; Sargiacomo et al., 1993; Chang et al., 1994;. Lisanti et al., 1994a; Schnitzer et al., 1995b,c; Smart et al., 1995b).
Caveolin, a 21–24 kDa integral membrane protein, appears to be the principal structural protein of caveolae (Peters et al., 1985; Rothberg et al., 1992). Although the precise function(s) of caveolin remain to be clarified, studies reveal that caveolin binds directly with cholesterol, glycosphingolipids, and lipid-modified signaling molecules (Parton, 1994; Li et al., 1995, 1996; Murata et al., 1995; Song et al., 1996a). Accordingly, in addition to providing the structural scaffolding, caveolin may also modulate the compartmentalization of those components involved in cell-signaling events. Multiple forms of caveolin have been identified: caveolin-1α, caveolin-1β, caveolin-2, and caveolin-3, and although they show general similarities in structure and function, they differ in specific properties and tissue distribution (Scherer et al., 1995, 1996; Way and Parton, 1995;Song et al., 1996b; Tang et al., 1996).
Caveolin has not been detected as a resident component in detergent-insoluble complexes isolated from neurons, neuroblastoma cells, and brain (Gorodinsky and Harris, 1995; Olive et al., 1995;Bouillot et al., 1996). Furthermore, Northern blot analyses of poly(A+) RNA or total RNA isolated from adult mouse brain or from neuroblastoma cells, respectively, have not revealed caveolin message (Lisanti et al., 1994a; Shyng et al., 1994; Scherer et al., 1996; Song et al., 1996b). Because caveolin expression levels have been shown to correlate with morphologically identifiable caveolae (Koleske et al., 1995; Scherer et al., 1995, 1996), the extent to which the detergent-insoluble complexes isolated from brain represent a compositional and functional counterpart to the caveolae microdomains described for other cell types remains unclear. Additionally, available studies cannot rule out the possibility that known forms of caveolin are expressed in restricted windows during brain development, nor can they rule out the existence of caveolin forms that are brain-specific. To begin to evaluate these possibilities, we initiated studies to identify known and/or novel caveolin forms in astrocytes. In the present study, we demonstrate by indirect immunofluorescence and thin-section electron microscopy that astrocytes contain morphologically identifiable caveolae and, furthermore, that these caveolae contain caveolin 1α.
MATERIALS AND METHODS
Materials. Timed-pregnant and adult Sprague Dawley rats used in all experiments were obtained from Harlan Sprague Dawley (Indianapolis, IN). Tissue culture media and sera were purchased from Life Technologies (Gaithersburg, MD), and HL1 media supplement was purchased from Hycor (Irvine, CA). Fetal calf serum and fetal clone I were obtained from HyClone (Logan, UT). Monoclonal and polyclonal antibodies to caveolin were obtained from Transduction Laboratories (Lexington, KY); indocarbocyanine (Cy-3)-conjugated goat anti-mouse IgG antibodies were obtained from Jackson ImmunoResearch (West Grove, PA); and 125I-goat α-rabbit and goat α-mouse IgGs were from DuPont NEN (Boston, MA). Carrier ampholines were obtained from LKB Instruments (Gaithersburg, MD); molecular mass standards and other electrophoresis reagents were from Bio-Rad (Richmond, CA). Percoll was purchased from Pharmacia (Piscataway, NJ), and Optiprep was from Accurate Scientific (Westbury, NY). All other supplies were from general distributors.
Cells. All animal protocols were reviewed and approved by the Committee on Animal Use in Research and Education at the Medical College of Georgia. Primary cultures composed of mixed glial cells were prepared from cerebral cortices of <24 hr neonatal rats as described (Cameron and Rakic, 1994). Type 1 astrocytes were obtained according to the method of Levison and McCarthy (1991). Cell cultures were maintained at 37°C in a humidified atmosphere of 5% CO2. Primary cultures of hippocampal neurons were prepared from hippocampi of embryonic day 18 or 19 rats according to procedures described previously (Cameron et al., 1991).
Electron microscopy. Type 1 astroglial cells in culture dishes were fixed with 2.5% glutaraldehyde in 100 mmsodium phosphate, pH 7.4 [60 min at room temperature (RT)]. Washed cells (100 mm sodium cacodylate, pH 7.2) were collected by scraping, sedimented in a microfuge (15,000 × g for 10 min), and post-fixed in 1% OsO4 in 100 mmsodium cacodylate, pH 7.2, (3 hr at 0°C). Pellets were stained en bloc with 2% uranyl acetate in maleate (50 mm, pH 5.8), dehydrated in ethanol and propylene oxide, and embedded in Epon 812/Araldite. Samples of detergent-insoluble complexes were sedimented after isolation and fixed with 2.5% glutaraldehyde in 100 mm sodium phosphate, pH 7.4 (60 min at RT) and processed for morphological analyses as described for astrocytes. Thin sections were stained in both uranyl acetate and lead citrate. Micrographs were taken on a JEOL 1010 transmission electron microscope (JEOL USA, Peabody, MA).
Immunocytochemical procedures. For localizing antigens in astrocytes, monolayers of type 1 astrocytes were trypsinized, and dissociated cells were plated on poly-l-lysine-treated glass coverslips at 3 × 10⁴cells/cm2. Astrocyte cultures were fixed with 3% formaldehyde (freshly prepared from paraformaldehyde) in 120 mm sodium phosphate (RT, 20 min). Indirect immunofluorescence analyses were performed as described (Cameron et al., 1991). As an alternative to the use of 0.3% Triton X-100, saponin was added at 0.005% to all solutions. The distribution of antigens was visualized by the use of secondary antibodies: Cy-3-conjugated goat α-mouse IgG or Cy-3-conjugated goat α-rabbit IgG. Coverslips and slides were mounted in a freshly prepared solution containing 10 mm sodium phosphate, pH 7.4, 150 mm NaCl, 70% glycerol, and 1 mg/ml p-phenylenediamine. Cells were viewed through a Zeiss Axiophot microscope equipped with epifluorescent optics and photographed using Kodak (Rochester, NY) Tmax 100 film.
Isolation of low-density, Triton X-100-insoluble complexes.Detergent-insoluble complexes were prepared according to the procedure of Sargiacomo et al. (1993). All buffers and solutions were supplemented with protease inhibitors (0.4 mm PMSF and 10 μg/μl each of pepstatin A and leupeptin), and each step was performed at 4°C. Briefly, confluent monolayer cultures of type 1 astrocytes or Madin–Darby canine kidney (MDCK) cells were rinsed with minimum essential medium and scraped. Cells were sedimented by centrifugation, and pellets were resuspended in MBS buffer (25 mm MES, pH 6.5, and 150 mm NaCl) containing 1% Triton X-100 and 0.005% DNase. For preparation of detergent-insoluble complexes from adult lung and brain tissues, cerebral cortices and cerebellum were removed, dissected free of overlying meninges, and extracted in MBS containing 1% Triton X-100; lungs were excised, dissected free of connective tissue, and homogenized in MBS containing 1% Triton X-100 using a tissuemizer at 9500 rpm for 15 sec two times. Subsequent processing for both cell and tissue samples was performed in an identical manner. Samples were solubilized for 20 min at 4°C, dispersed by 10 up and down strokes with a tight-fitting Dounce homogenizer, solubilized for an additional 10 min, and dispersed a second time as described above. The homogenate was adjusted to 40% sucrose (checked by refractive index) by addition of 80% sucrose in MBS buffer, and 2.0–2.5 ml of the homogenate was overlaid by a 5–30% linear sucrose gradient in MBS that contained no Triton X-100. Centrifugation [188,000 × gav for 19–20 hr in an SW41 rotor (Beckman Instruments, Palo Alto, CA)] resulted in the appearance of an opaque band migrating between 10 and 20% sucrose. For subsequent analyses, either 1 ml fractions were collected across the gradient, or a band located within the 10–20% sucrose region of the gradient was collected, diluted with MBS buffer, and sedimented by centrifugation [117,000 × gav for 2.5 hr, 60 Ti rotor (Beckman)]. Collected fractions or the pellet, which was resuspended in MBS, were stored at −20°C.
Caveolin-enriched fractions were isolated in the absence of detergent according to either of two procedures (Smart et al., 1995a; Song et al., 1996a). All buffers and solutions were supplemented with protease inhibitors. In the first case, sodium carbonate replaced Triton X-100, and a sonication step was introduced to disrupt membranes more finely (Song et al., 1996a). In the second case, a plasma membrane fraction, isolated as described by Smart et al. (1995a), served as the starting membrane. After sonication, caveolin-containing microdomains were separated from residual plasmalemmal domains using two successive Optiprep gradients (Smart et al., 1995a).
PAGE and immunoblotting. For one-dimensional SDS-PAGE analyses, reduced protein samples were resolved in 12.5% acrylamide gels in a Laemmli (1970) buffer system. Two-dimensional PAGE was performed as described previously (Cameron and Rakic, 1994). Membrane samples (75 μg) were solubilized in 1% SDS and 40 mmdithiothreitol before isoelectric focusing. Second-dimension resolving gels were 12.5% acrylamide prepared in the Laemmli (1970) buffer system. Protein was determined according to the manufacturer’s instructions (Pierce, Rockford, IL) using bovine serum albumin as a standard. Fractionated polypeptides were transferred electrophoretically to nitrocellulose according to the procedure ofTowbin et al. (1979). Immunoblots were incubated in blocking buffer (5% nonfat dry milk, 10 mm Tris, and 150 mmNaCl, pH 7.5) for 60 min and subsequently overnight in blocking buffer containing primary antiserum (1 μg/ml). Bound antibodies were detected using iodinated goat anti-rabbit IgG or rabbit anti-mouse IgG (0.5 mCi/ml, 90 min). Immunoblots were exposed to Amersham (Arlington Heights, IL) Hyperfilm at −70°C with an intensifying screen for 24–72 hr.
Identification of GTP-binding proteins in caveolin-enriched fractions isolated from astrocytes. GTP-binding proteins were detected in fractions obtained from astrocytes resolved on Triton X-100/MBS gradients according to either of two procedures: by a modification of a GTP overlay procedure (Bhullar and Haslam, 1987;Lapetina and Reep, 1987), or by in situ labeling using periodate-oxidized [α-32P]GTP (Low et al., 1992; Peter et al., 1993; Huber and Peter, 1994). For GTP overlays, equal volumes of gradient fractions were resolved by one-dimensional SDS-PAGE, and proteins were transferred to nitrocellulose. The nitrocellulose replica was preincubated for 30 min at RT in buffer (50 mm Na phosphate buffer, pH 7.5, 10 mm MgCl2, 0.3% Tween 20, 2 mm DTT, and 4 μm ATP) and then incubated for 120 min at RT in buffer containing [α-32P]GTP (1 μCi/ml; specific activity, 3000 Ci/mmol). After washing (10 times for 3 min each) with ice-cold buffer, nitrocellulose blots were air-dried and exposed to Amersham Hyperfilm at RT for 2–6 hr. For competition experiments 1 μm of GTP or 1 μm of GDP was included in the buffer at each step. For in situlabeling using periodate-oxidized [α-32P]GTP, equal volumes of gradient fractions were diluted with MBS and centrifuged at 50,000 rpm for 60 min at 4°C using a TLA 100.3 rotor in a Beckman TLX centrifuge. Pellets were resuspended in labeling buffer (in mm: 20 HEPES, pH 7.8, 140 KCl, 10 NaCl, and 2.5 MgCl2). [α-32P]GTP (specific activity, 3000 Ci/mmol) was added to each sample at a final concentration of 130 nm and incubated for 30 min at 37°C. Nucleotides were oxidatively cleaved with 1 mm NaIO4 for 1 min at 37°C. Condensation products were reduced with 20 mmNaBH3 for 1 min at 37°C. To remove all free GTPoxi nucleotides, cells were treated with 20 mm NaBH4 on ice for 20 min. Samples were diluted by the addition of 2 ml of labeling buffer and centrifuged for 60 min at 50,000 rpm at 4°C using a TLA 100.3 rotor in a Beckman TLX centrifuge. Samples were resuspended in 20 mm HEPES, pH 7.8, and proteins were resolved by one-dimensional SDS-PAGE. Gels were stained with Coomassie blue, air-dried between two sheets of clear cellulose film (Promega, Madison, WI), and exposed to Amersham Hyperfilm at RT.
Identification of caveolin-1 from primary cultures of rat astrocytes. A full-length cDNA for rat astrocyte caveolin was amplified by reverse transcriptase-PCR from total cellular RNA extracted from primary cultures of rat astrocytes using TRIzol reagent (Life Technologies). First-strand cDNAs were generated using the cDNA cycle kit (Invitrogen, Carlsbad, CA) with oligo-dT as the primer and supplemented with reverse transcriptase XL (Life Sciences Inc., St. Petersburg, Fl). PCR was performed according to the manufacturer’s instructions with Pfu (Stratagene, La Jolla, CA). Oligonucleotides (sense primer, AGCATGTCTGGGGGTAAATACG; antisense primer, CCTCCATCCCTGAAATGTCACT) were chosen to amplify the entire open reading frame of rat caveolin-1α (GenBank accession number Z46614). Restriction enzyme digestion of the PCR product using NcoI,HaeIII, and TaqI generated fragments with the sizes expected for caveolin-1α. The gel-purified PCR product was cloned using the PCR-Script SK(+) cloning kit (Stratagene). DNA from a plasmid containing the cDNA was isolated using the Wizard kit (Promega) and used for sequence analysis and for the preparation of the probe used for Northern blot analyses. Identity of the cloned fragment was verified by double-stranded sequencing in both directions. Sequence analysis was performed using an ABI 377 automated sequencer (Perkin-Elmer, Norwalk, CT) by the Molecular Biology Core Facility at the Medical College of Georgia. The rat astrocyte nucleotide sequence differed from the reported rat caveolin-1α sequence (Genbank accession number Z46614). The sequence obtained altered the peptide sequence in six amino acids (amino acids: 120, Ala; 154, Thr; 161, Glu; 162, Ala; 171, Arg; and 176, Lys) but was identical to caveolin 1α sequenced from human, mouse, chick, and dog at these positions. In addition, the rat astrocyte sequence obtained had no Gly at nucleotide position 509, thereby keeping it in the same open reading frame as reported for the caveolin 1 sequences derived from other species.
Northern blot analysis. Total cellular RNA was extracted from primary cultures of rat astrocytes and from rat tissues (cerebellum, cortex, and lung) with TRIzol reagent (Life Technologies) according to the manufacturer’s instructions. RNA samples (15 μg) were separated on 1.2% GTG agarose (FMC Bioproducts, Rockland, ME) and 0.66 m formaldehyde gel and transferred in 10× SSC to GeneScreen membranes (DuPont NEN). Nylon membranes were prehybridized overnight at 65°C in Church buffer (Church and Gilbert, 1984) and hybridized with a random-primed, 32P-labeled cDNA caveolin fragment overnight in the same buffer. The full-length caveolin probe was generated as described above. After hybridization, the membrane was washed 4 times with 2× SSC and 0.1% SDS at room temperature and two times with 0.1× SSC and 0.1%SDS at 65°C for 30 min each and then exposed to Kodak XAR 5 film.
RESULTS
A monoclonal antibody to caveolin-1 labels astrocytes and oligodendrocytes
As a first means to determine whether caveolae could be present in astrocytes, we performed indirect immunofluorescent analyses on aldehyde-fixed primary cell cultures of neocortical type 1 astrocytes using a commercially available monoclonal antibody (mAb C060) that recognizes both the α and β isoforms of caveolin-1. The predominant cell class present (90–95%) in type 1 astrocyte cultures consists of cells of an epithelial-like morphology that are labeled by antibodies to glial fibrillary acidic protein (Cameron and Rakic, 1994). Caveolin immunoreactivity was distributed throughout the cytoplasm as prominent, intensely fluorescent puncta, which were particularly concentrated in the centrosomal region (Fig.1A). At the plasmalemmal surface, caveolin immunoreactivity was characterized by small puncta that were either scattered about individually or that were organized into prominent ring-shaped clusters (Fig.1B). We frequently observed regions on the cell surface where immunoreactivity was distributed in diffuse patches; these patches were especially evident at the free edges of cells or at the tips of elongated cell processes. To determine whether caveolin-1 expression was restricted to type 1 astrocytes or also detectable in other types of glial cells, aldehyde-fixed cultures of process-bearing astrocytes and oligodendrocytes were processed for indirect immunolocalization studies. For both process-bearing astrocytes (Fig.1C) and oligodendrocytes (Fig. 1D), caveolin immunoreactivity was dispersed in abundant levels about the region of the cell body and along the length of the extended processes.
Fig. 1.

Indirect immunofluorescent localization of caveolin-1 in primary cultures of glial cells using mAb C060. A, B, The staining pattern in type 1 astrocytes is characterized by intensely fluorescent puncta that are scattered throughout the cytoplasm, particularly in the perinuclear region (arrows in A) as well as at the cell surface. At the plasma membrane, immunoreactivity is frequently organized into ring-shaped clusters (arrows inB) and is present at elevated levels at the leading or free edges of cells. C, D, Process-bearing astrocytes (C) and oligodendrocytes (D) show a prominent level of immunoreactivity at the region of the cell body. Cytoplasmic processes are decorated by fine puncta with an accumulation observed at the tips (arrows in C, D). N, Nucleus. Scale bars: A, 10 μm; B, 6 μm; C, 10 μm; D, 10 μm.
Thin-section electron microscopy reveals clusters of caveolae in astrocytes
To determine whether the structures identified by indirect immunofluorescence corresponded to cell surface invaginations and/or populations of subplasmalemmal vesicles with the morphological features characteristic of caveolae described in other cell types, adherent astrocyte monolayers were processed for examination by thin-section electron microscopy. Flask-shaped invaginations of the plasma membrane, ∼80 nm in diameter, were detected in all cells examined. Typically, 10 or more caveolae were collected into clusters, which were observed along both plasmalemmal surfaces. (Figs.2A,3). Caveolae dispersed as singular entities were detected, but much less frequently. Individual caveolae appeared to be either in continuity with the plasmalemmal surface, and thus open to the extracellular space, or positioned just beneath the cell surface as free vesicles. The clusters of caveolae were observed frequently to overlay elements of the rough endoplasmic reticulum (Fig.2A). Abundant Golgi complexes were dispersed throughout the cell, and, although some revealed associated cell surface caveolae, most did not (Fig. 2C). Vesicles that resemble caveolae in appearance and size were often associated with smooth surface tubules (Fig. 3). These are most probably vesicular carriers of the exocytic pathway and likely correspond to the immunoreactive puncta detected throughout the cytoplasm by indirect immunofluorescent analyses. Striations on the cytoplasmic face, which are characteristic features of caveolae (Peters et al., 1985; Rothberg et al., 1992), were not particularly evident. On occasion, we observed caveolae that appeared stacked beneath the plasma membrane as distinct vesicles or in figure-eight profiles reminiscent of those contributing to the transendothelial channels described in capillaries (Figs.2B, 3A) (Simionescu et al., 1975).
Fig. 2.
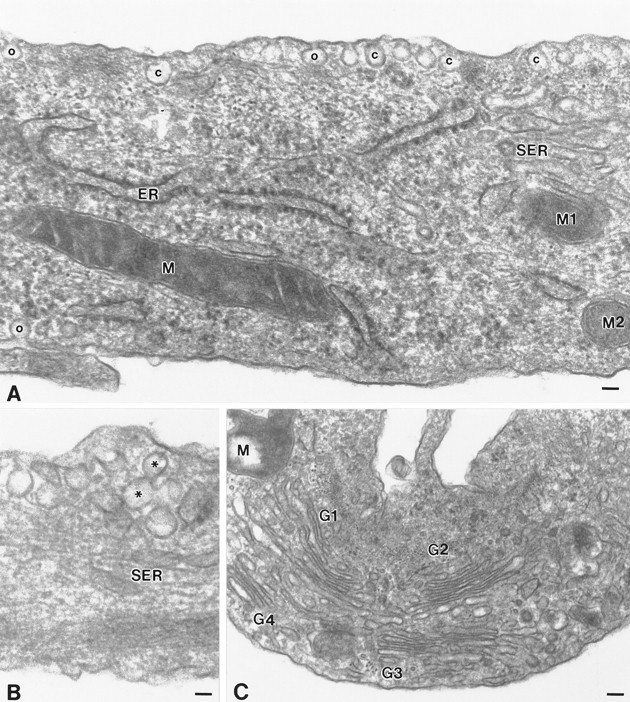
Localization of caveolae in type 1 astrocytes by electron microscopy. A, Large clusters of caveolae are distributed along the plasma membrane. Individual caveolae display a characteristic flask-shaped profile of ∼80 nm and are either open to the extracellular milieu (o) or are present as free vesicles beneath the plasma membrane (c). Frequently, the clusters of caveolae aligned along the plasma membrane appear to overlay elements of the rough endoplasmic reticulum.B, Occasionally, caveolae are detected in stacks located beneath the plasma membrane or display a figure-eight profile (*).C, The Golgi complex, although detected in abundance throughout the cell, are not typically associated with caveolae at the cell surface. ER, Endoplasmic reticulum; G1, G2, G3, G4, Golgi complex; M, M1, M2, mitochondria;SER, smooth surface tubules; o, caveolae in continuity with the plasma membrane; c, caveolae present as free vesicles beneath the cell surface. Scale bars:A, 60 nm; B, 45 nm; C, 90 nm.
Fig. 3.
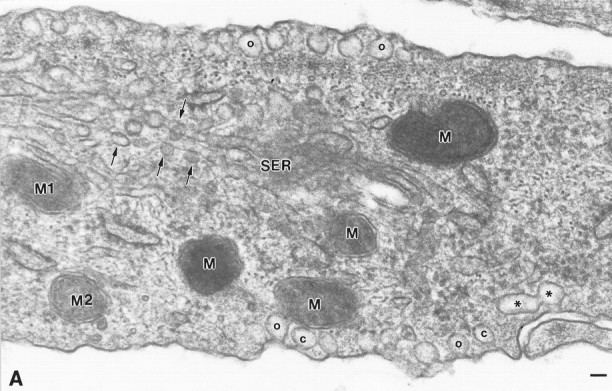
Caveolae localize to both cell surfaces in type 1 astrocytes. Coupled with Figure 2A (indicated by matching mitochondria M1 and M2), this electron micrograph reveals the great extent to which caveolae occupy both plasmalemmal surfaces. At either plasmalemmal surface, individual caveolae are either opened (o) or closed (c) to the extracellular environment. Stacks of caveolae often show figure-eight profiles (*). Intracellularly, vesicles that resemble caveolae in size and appearance are frequently observed in association with smooth surface tubules (arrows). These are most probably vesicular carriers of the exocytic pathway and likely correspond to the fluorescent puncta that are revealed throughout the cytoplasm by indirect immunofluorescence. M1, M2, Mitochondria that represent the position of overlap with Figure 2A;SER, smooth surface tubules; o, caveolae in continuity with the plasma membrane; c, caveolae present as free vesicles beneath the cell surface. Scale bar, 60 nm.
Detergent-insoluble complexes isolated from astrocytes are composed of caveolin
To determine whether caveolae detected in astrocytes by immunolabeling and morphological criteria displayed physical and compositional characteristics similar to those of caveolae isolated from other cell types, astrocyte monolayers were solubilized in Triton X-100, and detergent lysates were fractionated by equilibrium centrifugation on 5–30% linear sucrose gradients (Sargiacomo et al., 1993). A prominent band that floated to the region of 13–14% sucrose was collected and sedimented, and the polypeptides were resolved by one- and two-dimensional SDS-PAGE. We routinely recovered ∼0.5% of the homogenate protein in the sedimented fraction. The protein profile detected by silver staining of detergent-insoluble complexes isolated from astrocytes was similar to that detected for caveolae isolated from lung tissue (data not shown). One-dimensional immunoblot analyses performed with mAb C060 or the affinity-purified polyclonal antibody revealed a single immunoreactive band (Fig.4A, lanes 1, 2) with an electrophoretic mobility identical to that of the caveolin-1 α isoform identified in lung (Fig. 4A, lane 3). Immunoblot analysis of fractions collected across the entire gradient, using mAb C060 or mAb 2234 (Fig. 4B), or the affinity-purified polyclonal antibody against caveolin (Fig.4C) revealed that caveolin immunoreactivity peaked in those fractions that corresponded to the low-density, detergent-insoluble membrane fraction (10–20% sucrose) and accounted for ∼90% of the total cell-associated caveolin. On occasion, we have observed a second band that resolves at 18–20% sucrose. Although immunoblot analyses indicated that caveolin was also a prominent component of this second band, Coomassie blue-stained two-dimensional electrophoretograms revealed that the polypeptide spectrum was considerably more complex than that obtained for the lighter band (data not shown).
Fig. 4.

Isolation of caveolin-enriched, detergent-insoluble microdomains from type 1 astrocytes. Detergent-insoluble complexes were isolated from type 1 astrocytes and from lung tissue as described in Materials and Methods.A, Equal amounts of protein (20 μg/lane) were separated by SDS-PAGE and processed for immunoblot analysis using anti-caveolin mAb C060. In type 1 astrocytes, only the α isoform of caveolin-1 is detected (lanes 1, 2represent two separate astrocyte preparations). In complexes isolated from lung, both the α and β isoforms of caveolin-1 are detected (lane 3). B, C, Equal volumes of fractions collected across the gradient were resolved by SDS-PAGE and processed for immunoblot analyses using anti-caveolin mAb 2234 or anti-caveolin affinity-purified polyclonal antibody. The mAb 2234 recognizes a single faint band, predominantly located in fraction 5 (B; only 7 of the 11 fractions are shown), whereas the polyclonal antibody recognizes a single band that, although peaks in fraction 5, is detected in multiple fractions (C). Molecular mass × 10−3 is indicated vertically; fraction number is indicated horizontally.
Detergent-insoluble complexes comprise vesicles of heterogeneous size
To examine in detail the morphology of the detergent-insoluble complexes, the band that floated to the region of 13–14% sucrose was collected, sedimented, and processed for transmission electron microscopic analysis. These studies revealed that the isolated fraction comprised a heterogeneous population of vesicles ranging from 0.05–1.5 μm in diameter (Fig. 5). Although many of the isolated vesicles approximate the size of individual caveolaein situ, many are considerably larger.
Fig. 5.

Electron micrograph of the fraction containing detergent-insoluble complexes. The band of detergent-insoluble complexes that floated to the region of 13–14% sucrose was collected and processed for transmission electron microscopic analysis as described in Materials and Methods. The isolated fraction comprises a heterogeneous population of vesicles ranging from 0.05 to 1.5 μm in diameter. Scale bar, 1 μm.
Isolation of a caveolin-enriched fraction from astrocytes in the absence of detergent
Historically the isolation of caveolae has taken advantage of the insolubility of caveolae microdomains in nonionic detergents such as Triton X-100. However, the demonstration that the inclusion of detergent resulted in the loss or the redistribution of some caveolae-associated proteins led to the development of detergent-free fractionation schemes for the isolation of caveolae (Smart et al., 1995a; Song et al., 1996a). Accordingly, we determined whether astroglial cell caveolin-containing fractions isolated in the absence of nonionic detergent displayed a similar buoyant density as that determined for caveolae isolated from human fibroblasts and MDCK cells. To this end, we followed the distribution of caveolin subsequent to the fractionation of disrupted plasma membranes by velocity centrifugation in Optiprep (Smart et al., 1995a). The distribution of caveolin was determined by immunoblotting with mAb 2234 or the affinity-purified polyclonal antibody. In the first Optiprep gradient, caveolin was detected in every fraction, with the peak activity being localized to fractions 10 and 11 (Fig.6A). Fractions 1–6, 6–11, and 12–16 collected from the first gradient were combined into three separate pools. Centrifugation of each pool on a second discontinuous Optiprep gradient yielded a single fraction of caveolin (Fig. 6B).
Fig. 6.

Isolation of a caveolin-enriched fraction from type 1 astrocytes in the absence of detergent. A, B, Plasma membranes were purified from type 1 astrocytes on a Percoll gradient, sonicated, and loaded at the bottom of an Optiprep gradient as described in Materials and Methods. One-milliliter fractions were collected across the gradient, and fractions 1–6, 7–11, and 12–16 were pooled and subjected to a second Optiprep gradient. Equal volumes of gradient fractions collected across the first linear Optiprep gradient (A) and the second discontinuous Optiprep gradient (B) were separated by SDS-PAGE and processed for immunoblot analyses using anti-caveolin polyclonal antibody. Caveolin was detected in all fractions distributed across the first Optiprep gradient (A). In contrast, all of the caveolin was detected in a single gradient fraction in the second Optiprep gradient (B). C, Type 1 astrocytes were subjected to subcellular fractionation after homogenization in a buffer containing sodium carbonate as described in Materials and Methods. One-milliliter fractions were collected across the gradient, and equal volumes were separated by SDS-PAGE and processed for immunoblot analyses using anti-caveolin polyclonal antibody. A peak of caveolin immunoreactivity is detected in fractions 4 and 5, which corresponds to the position in the gradient where the opaque band was visualized. In all cases, fraction 1 represents the top of the gradient. Molecular mass × 10−3 is indicated vertically; fraction number is indicatedhorizontally.
As a second means of analysis, we determined the distribution of caveolin after fractionation of astrocytes that had been disrupted in the presence of sodium carbonate instead of Triton X-100 (Song et al., 1996a). After centrifugation in a discontinuous sucrose gradient, caveolin was detected, for the most part, at the 5/35% sucrose interface (Fig. 6C). In both cases, the distribution of caveolin-enriched fractions isolated from astrocytes was identical to that demonstrated previously for caveolae isolated in the absence of detergent from human fibroblasts and MDCK cells (Smart et al., 1995a;Song et al., 1996a).
Detergent-insoluble complexes from astrocytes display compositional similarities to caveolae characterized in cells of peripheral tissues
The subcellular fractionation studies demonstrate that the detergent-insoluble complexes obtained from astrocytes display biophysical and morphological characteristics analogous to those determined for caveolae/caveolin fractions isolated from other tissues and cell types. However, compositional analyses of endothelial caveolae obtained by immunoisolation indicate that detergent-insoluble complexes are likely contaminated by proteins derived from adjoining plasma membrane proper (Stan et al., 1997). Furthermore, immunolocalization studies (Fig. 1) reveal that caveolin is distributed through multiple subcellular compartments in astrocytes. Because most of the astrocyte-associated caveolin resolves to a single fraction (13–14% sucrose), the component composition of the detergent-insoluble fraction is likely of mixed origin. In consideration of these concerns, we performed only limited studies to identify compositional similarities between the detergent-insoluble fraction obtained from astrocytes to those derived from cells of peripheral tissues (Chang et al., 1994; Lisanti et al., 1994a,b). One-dimensional immunoblot analysis of fractions collected across a detergent gradient revealed an enrichment of FYN kinase, a member of the Src family of nonreceptor protein tyrosine kinases, in the caveolin-containing fractions (Fig.7A). [32P]GTP binding overlays of polypeptides resolved by one-dimensional SDS-PAGE for fractions collected across a detergent gradient detected multiple small GTP-binding proteins with mobilities corresponding to apparent molecular masses ranging from 22 to 31 kDa (Fig. 7B). The binding of [32P]GTP was abolished by the presence of excess cold GTP or GDP but not ATP (data not shown). The spectrum of labeled proteins identified revealed a preferential enrichment in the caveolin-enriched fractions of several small GTP-binding proteins (Fig. 7B). To evaluate high molecular weight GTP-binding proteins typically not identified by [32P]GTP binding overlays, we performed in situ labeling of gradient fraction polypeptides using periodate-oxidized [α-32P]GTP (Fig. 7C). The spectrum of polypeptides labeled by in situperiodate-oxidized GTP displayed apparent molecular masses ranging from 22 to >100 kDa (Fig. 7C). Although most of the labeled polypeptides remained in the load fractions, in situlabeling identified several GTP-binding proteins of apparent high molecular weight, in addition to those low molecular weight components also detected by GTP overlays, that enriched in the caveolin-containing fractions. However, to date, we have not performed analyses to determine the identity of these subsets of GTP-binding proteins.
Fig. 7.

The nonreceptor tyrosine kinase FYN and several low and high molecular weight GTP-binding proteins co-fractionate with caveolin-containing fractions. A, Equal volumes of fractions collected across a detergent gradient were resolved by SDS-PAGE and processed for immunoblot analyses using anti-FYN mAb. An immunoreactive band of 59 kDa is enriched in fraction 5, which corresponds to the peak gradient fraction of caveolin.B, Equal volumes of fractions collected across a detergent gradient were fractionated by SDS-PAGE, transferred to nitrocellulose, and probed with [32P]GTP. Labeled proteins are concentrated in the 22–31 kDa molecular weight range. Only one set of GTP-bound proteins appears to co-fractionate with the caveolae fractions (arrow). C, Equal volumes of fractions collected across a detergent gradient were labeledin situ using periodate-oxidized [α-32P]GTP, and polypeptides were separated by SDS-PAGE. In contrast to that observed in the GTP-overlays, multiple proteins of high apparent molecular weight are labeled. Although most of the labeled proteins remain in the load fractions, several high molecular weight proteins co-isolate with the caveolae fractions (arrows). Molecular mass × 10−3 is indicated vertically; fraction number is indicated horizontally.
Identification of caveolin-1 mRNA in astrocytes
To verify that the immunoreactive polypeptide identified by our immunolocalization and immunoblot analyses was caveolin-1, rather than a polypeptide with a shared epitope, a cDNA for rat astrocyte caveolin was cloned by reverse transcriptase-PCR amplification from total cellular RNA extracted from primary cultures of rat astrocytes using oligonucleotide primers that spanned the open reading frame of rat caveolin-1α (GenBank accession numberZ46614).
The full-length caveolin-1 fragment was purified and used as a probe for all Northern blot analyses of total cellular RNA. These analyses revealed that caveolin-1 mRNA was present in primary cultures of astrocytes as a 2.5 kb mRNA species that specifically hybridized at high stringency with the full-length caveolin-1 probe (Fig.8A, lane 1). As described previously, the caveolin-1 message was detected as a prominent ∼2.5 kb species in lung (Fig. 8A, lane 4). Interestingly, the level of mRNA expression observed in astrocytes was only slightly reduced in comparison to that determined for lung, a tissue that displays a high concentration of caveolae.
Fig. 8.

Northern blot analyses using a full-length caveolin-1 probe. Total cellular RNA was obtained as described in Materials and Methods, and 15 μg samples from cells and tissues as indicated were separated on agarose–formaldehyde gels, transferred to nylon, and hybridized with a random-primed,32P-labeled mRNA fragment for caveolin-1. Equal RNA loads were verified for all Northern analyses by ethidium bromide staining.A, A prominent band of ∼2.5 kb is detected in total RNA isolated from type 1 astrocytes (lane 1). The quantity and size of the message observed in astrocytes is identical to that detected in total RNA isolated from lung (lane 4). A band of identical size was detected in total RNA isolated from cerebellum (lane 2) and cerebral cortex (lane 3), although at significantly reduced levels.B, Astrocytes were maintained in culture from 0 to 18 d in vitro, and total cellular RNA was isolated for each time point. The level of message detected is slightly reduced for astrocytes maintained from 2 to 4 d in vitrobut thereafter remains constant. C, Total cellular RNA was obtained from primary cultures of astrocytes and from a homogeneous population of primary hippocampal neurons. The level of caveolin-1 message detected in hippocampal neurons (lane 2) is negligible in comparison to that determined for astrocytes (lane 1). D–F, Total cellular RNA was obtained at multiple developmental ages from cerebral cortex [embryonic day (E14) 14 to adult] and from cerebellum (newborn to adult). The peak level of caveolin-1 message is detected at postnatal day 12 (P12) for cerebral cortex (D) and at postnatal day 8 for cerebellum (E). The size of the message, ∼2.5 kb, is identical to that detected in total cellular RNA obtained from astrocytes (F; lanes 1, 2 represent independent astrocyte preparations). However, the level of caveolin-1 message observed is significantly reduced in brain tissues in comparison to that observed for quantitatively identical levels of RNA obtained from astrocytes. G–I, Corresponding ethidium bromide staining of the agarose–formaldehyde gel for which 15 μg samples of total cellular RNA obtained from cerebral cortex, cerebellum, and astrocytes were separated and processed for the Northern blot analyses shown in D–F.
Levels of caveolin-1 message in brain correlate to periods of development
Northern blot analysis of total RNA prepared from cerebellum and cortex of adult rat brain revealed a single band, the size of which correlated to the size of message determined for caveolin-1. However, the level of message was significantly reduced in comparison to that detected for astrocytes (Fig. 8A, compare lanes 2, 3 with lane 1). Accordingly, we performed studies to determine possible rationales for the low level of caveolin-1 message detected in brain in comparison to that observed in astrocytes.
To evaluate the possibility that the level of caveolin-1 message detected in astrocytes correlated with culture time, total RNA was extracted from primary astrocyte cultures that were maintained in vitro for 2, 4, 8, 11, 15, and 18 d and processed for Northern blot analysis. The level of caveolin-1 message detected at days 2 and 4 was slightly reduced in comparison to that detected at later days in vitro, although a relatively equivalent level was detected from days 8–18 (Fig. 8B). The reduced level of message observed for cell cultures at 2 and 4 d in vitro is likely a consequence of the heterogeneous population of mixed astrocytes and neurons at early time points after initial cell dissociation and plating. At later periods, the heterogeneous mixture of cells present initially are refined to a composition of principally type 1 astrocytes. Thus, the level of caveolin-1 message in astrocytes maintained in culture does not appear to be induced as a consequence of the culture conditions used, nor, evidently, is the level of caveolin expression modulated by the presence or absence of neurons.
To verify the apparent absence of caveolin-1 in neurons, we performed comparative Northern blot analyses using RNA isolated from primary cultures composed of a homogeneous population of hippocampal neurons prepared from embryonic day 18 hippocampi. Consistent with previous analyses of neuronal plasma membranes (Wu et al., 1997), caveolin-1 message was detected at a negligible level (Fig. 8C, lane 2). The level of caveolin-1 detected probably reflects a contribution of caveolin-1 by the small number of astrocytes that contaminate the hippocampal neuronal cell preparation.
To determine whether the level of message detected in brain varied according to the period of development, we performed Northern blot analyses using total cellular RNA extracted from cerebral cortex and cerebellum at multiple developmental ages. The data reveal that the level of caveolin-1 message peaked in both the cerebral cortex (Fig.8D) and the cerebellum (Fig. 8E) during late periods of development: postnatal day 12 in the cerebral cortex and postnatal day 8 for the cerebellum. However, analyses of equivalent loads of RNA (Fig. 8G,H,I) reveal that the level of caveolin-1 message detected for all ages of cerebral cortex or cerebellum was reduced in comparison to that determined for astrocytes (Fig. 8, compare D,E with F).
Multiple forms of caveolin are detected by affinity-purified polyclonal antibodies
To determine whether multiple forms of caveolin were present in astrocytes, we performed two-dimensional immunoblot studies of detergent-insoluble complexes isolated from astrocytes using an affinity-purified polyclonal antibody and monoclonal antibody 2234. The antigen profile detected by the polyclonal antibody revealed a cluster of four to six distinct polypeptides with apparent molecular masses between 22 and 31 kDa and isoelectric points centered at ∼6.0 (Fig.9A). In contrast, monoclonal antibody 2234 detected two species that showed near similar apparent molecular weights and isoelectric points (Fig. 9B). To assess the possibility that the multiple components identified by the polyclonal antibodies were specific to astrocytes, we performed two-dimensional immunoblot analyses of detergent-insoluble complexes isolated from MDCK cells and lung tissue. The spectrum of polypeptides identified by the polyclonal antibody for MDCK cells and lung tissue was quantitatively similar to that detected in astrocytes, although minor qualitative differences were noted (Fig. 9, compare Awith C,E). Similar to the antigen spectrum detected in astrocytes, mAb 2234 recognized a more simplified polypeptide profile, which ranged from a single species in the caveolae fraction obtained from MDCK cells (Fig. 9D) to two species in the caveolae fraction obtained from lung tissue (Fig. 9F). For all three cell types, the polypeptide profile revealed by mAb 2234 represented a subset of the polypeptides detected by the affinity-purified polyclonal antibody.
Fig. 9.

Affinity-purified anti-caveolin polyclonal antibody and anti-caveolin mAb 2234 recognize different spectrums of polypeptides by two-dimensional immunoblot analyses. Detergent-insoluble complexes isolated from type 1 astrocytes, MDCK cells, and lung tissue were separated by two-dimensional SDS-PAGE and processed for immunoblot analyses using either affinity-purified anti-caveolin polyclonal antibody (A, C, E) or anti-caveolin mAb 2234 (B, D, F). A complex antigen profile of apparent molecular mass between 22 and 31 kDa and isoelectric points ranging from pH ∼5 to 6.5 is detected by the polyclonal antibody in astrocytes (A), MDCK cells (C), and lung (E). A simplified antigen profile of apparent molecular mass between 22 and 31 kDa and of isoelectric points ranging from pH ∼5.5 to 6 is detected by mAb 2234 in astrocytes (B), MDCK cells (D), and lung (F). Molecular mass × 10−3 is indicatedvertically; pH values are indicatedhorizontally.
Different forms of caveolin in astrocytes can be separated by cell fractionation
The two-dimensional immunoblot analyses performed using the polyclonal antibody on detergent-insoluble complexes isolated from astrocytes revealed a complex antigen profile. Several lines of evidence suggest that caveolin-containing microdomains operate in multiple intracellular transport events (Dupree et al., 1993; Zurzolo et al., 1994; Smart et al., 1996). Therefore, we sought to determine whether any of the different forms of caveolin identified by the polyclonal antibody could be localized to different intracellular compartments or different subdomains of the plasma membrane. As a first approach, caveolin-containing fractions were isolated in the absence of detergent from isolated plasma membranes of astrocytes (Smart et al., 1995a). Polypeptides were separated by two-dimensional SDS-PAGE and processed for immunoblotting with the polyclonal antibody. The spectrum of caveolin forms detected varied according to the fraction analyzed. The antigen profile detected in the postnuclear supernatant fraction is reduced in complexity in comparison to that observed for the total cell (Fig. 10A) and reveals four species with apparent molecular masses ranging from 21 to 25 kDa and isoelectric points from ∼5.5 to 6.5 (Fig.10B). In the plasma membrane fraction, the two components identified represent a subset of those identified in the postnuclear supernatant (Fig. 10C), and the polypeptides identified appear similar to those detected by the monoclonal antibody (Fig. 9B). When the plasma membrane fraction was sonicated and subfractionated on a linear Optiprep gradient, caveolin was detected in most of the fractions collected across the gradient (Fig.6A). To determine whether different caveolin forms localized to distinct densities, fractions 1–6, 7–11, and 12–16 were pooled separately and concentrated into a single caveolin-containing band by a second discontinuous Optiprep gradient, and polypeptides were processed for immunoblot studies. The components identified in pooled fractions 7–11 (Fig. 10E) possess isoelectric points and apparent molecular masses identical to those detected in the plasma membrane fraction, whereas the caveolin band obtained from fractions 1–6 (Fig. 10D) and that obtained for fractions 12–16 (Fig. 10F) appear to represent a subset of the polypeptides identified in the plasma membrane. These data suggest that the caveolae isolated from the plasma membrane may be composed of a subset of the caveolin species present in the cell. Additionally, the separation of caveolin species that accompanies subfractionation of the astrocyte plasma membrane raises the possibility that not all caveolae in the plasma membrane are equivalent.
Fig. 10.

Different forms of caveolin are resolved by fractionation on Optiprep density gradients. Selected fractions were separated by two-dimensional SDS-PAGE and processed for immunoblot analyses using the anti-caveolin polyclonal antibody. Antigenic polypeptides detected in all fractions fractionate between 22 and 31 kDa. A, The most complex pattern of caveolin forms is observed in detergent-insoluble complexes isolated from the total cell homogenate. B, C, The complexity of the polypeptide pattern detected in the postnuclear supernatant (B) is simplified in comparison to that revealed by the homogenate, of which a subset is observed in the plasma membrane fraction (C). D–F, The plasma membrane fraction was sonicated and loaded at the bottom of a linear Optiprep gradient. One-milliliter fractions were collected across the gradient, and fractions 1–6, 7–11, and 12–16 were combined to form three separate pools. Each of the three pools was subjected to a second discontinuous Optiprep gradient. In each case, a single band that corresponded to the caveolin-enriched fraction was collected and processed for two-dimensional immunoblots. The spectrum of polypeptides observed for combined fractions 7–11 (E) is most similar to the spectrum of polypeptides detected in the plasma membrane fraction (C). The polypeptide profile detected for combined fractions 1–6 (D) and combined fractions 12–16 (F) appear to represent a subset of the plasma membrane (C). Molecular mass × 10−3 is indicated vertically; pH values are indicated horizontally.
Affinity-purified polyclonal antibodies identify a distinct immunolabeling pattern
The complexity of the profile determined by two-dimensional immunoblot analyses using the affinity-purified polyclonal antibodies against caveolin suggests that additional caveolin forms are present within astrocytes and, furthermore, that they may be localized to different subcellular compartments. To evaluate this possibility morphologically, we performed indirect immunofluorescent studies on aldehyde-fixed primary cell cultures of type 1 astrocytes using the affinity-purified polyclonal antibody against caveolin. Caveolin immunoreactivity was dispersed throughout the cytoplasm and at the cell surface in a punctate pattern. Interestingly, the immunoreactivity localized to the cytoplasm was not distributed randomly, but instead appeared to be organized into linear arrays that extended from the perinuclear area toward the peripheral cytoplasm (Fig.11A,B). Additionally, the immunoreactivity detected in the centrosomal region displayed a web-like organization (Fig. 11C), in contrast to the vesicular pattern of immunoreactivity demonstrated by mAb C060 (Fig.1A). Although the morphology of this network was best preserved when astrocytes were permeabilized with saponin, it was also observed for cells permeabilized with Triton X-100 or fixed and permeablized with methanol (data not shown).
Fig. 11.

Indirect immunofluorescent localization of caveolin in primary cultures of type 1 astrocytes using affinity-purified anti-caveolin polyclonal antibodies. Primary cultures of type 1 astrocytes were fixed and permeabilized with saponin.A, B, Immunoreactivity is distributed throughout the cytoplasm in a punctate manner but is particularly evident in the perinuclear region and along linear arrays that extend from the perinuclear region to the periphery of the cell (arrowsin A and B). The linear arrays of caveolin immunoreactivity appear to have a point of origin that circumscribes the nucleus (asterisked arrows inB). C, In the perinuclear region, caveolin immunoreactivity is organized about the nucleus in a network or web-like manner (arrows in C).N, Nucleus. Scale bars: A, 6 μm;B, 5 μm; C, 7 μm.
Polyclonal antibodies detect caveolin forms in brain tissue
In accordance with previous studies (Olive et al., 1995), we have not observed caveolin in immunoblots of detergent-insoluble complexes isolated from adult cerebral cortex and adult cerebellum using mAb C060 or mAb 2234. Immunoblots of fractions collected across detergent gradients demonstrated only high molecular weight components that remained in the load fraction (data not shown). Although these high molecular weight components may reflect caveolin oligomers (Sargiacomo et al., 1995), we have been unable to dissociate them into monomers. In contrast, immunoblot analyses of fractions collected across gradients performed with the affinity-purified polyclonal antibody detected polypeptides of apparent 21–31 kDa in both adult cerebellum (Fig.12A) and adult cerebral cortex (Fig. 12B). However, the fraction of detergent-insoluble complexes resolved in the 18–20% sucrose range, rather than the 13–14% sucrose range typically observed after fractionation of cultured cells (Fig. 12A,B). To determine whether the bands recognized in one-dimensional immunoblots corresponded to caveolin, polypeptides from the peak gradient fractions were separated by two-dimensional SDS-PAGE and subjected to immunoblot analyses using the affinity-purified polyclonal antibody. For both the cerebellum and the cerebral cortex, immunoreactive polypeptides displayed molecular mass and isoelectric points predicted for caveolin-1 (Fig. 12C,D).
Fig. 12.

Caveolin-related proteins are detected in detergent-insoluble complexes isolated from adult cerebellum and cortex. A, B, Detergent-insoluble complexes were isolated from adult cerebellum (A) and adult cortex (B) as described in Materials and Methods. Equal volumes of fractions collected across the gradients were separated by one-dimensional SDS-PAGE and processed for immunoblot analyses using the anti-caveolin polyclonal antibody. A single band of appropriate molecular mass for caveolin was detected for both cerebellum (A) and cerebral cortex (B) in a peak that corresponded to the position of the opaque band observed after centrifugation, ∼20% sucrose.C, D, Samples from the peak caveolin fraction (fraction 7) were resolved by two-dimensional SDS-PAGE and processed for immunoblot analyses using the anti-caveolin polyclonal antibody. The immunoreactive polypeptide profile observed for cerebellum (C) and cortex (D) was identical and comprised two major proteins between 22 and 31 kDa with isoelectric points between pH 5 and 6. Molecular mass × 10−3 is indicatedvertically; fraction numbers are indicatedhorizontally in A and B; pH values are indicated horizontally in Cand D.
DISCUSSION
One of the basic principles of mammalian brain development is that its constituent neurons are generated in proliferative zones that are located at a distance from their resident position in the adult brain (Sidman and Rakic, 1973). Exiting the mitotic cycle, postmitotic neurons preferentially recognize and adhere to the processes of radial glial cells and subsequently initiate an active cell movement to form mature brain structures. Most studies of neuronal cell migration have centered largely about the identification of the membrane components that mediate the physical aspects of cell adhesion (Cameron and Rakic, 1994; D’Arcangelo et al., 1995; Ogawa et al., 1995; Anton et al., 1996; Zheng et al., 1996; Cameron et al., 1997). Thus, an understanding of the signaling pathways and substrates that modulate migration has begun to emerge only recently (e.g., Komuro and Rakic, 1992, 1993;Hunter and Hatten, 1995; Patil et al., 1995; Kofuji et al., 1996;Marret et al., 1996). Several lines of evidence reveal that caveolae isolated from cells of non-neural tissues are composed of lipid and protein components that function in cell-signaling events (Lisanti et al., 1994b). Among the spectrum of cell-signaling components identified within isolated caveolae are glycophosphatidylinositol-anchored proteins. Importantly, multiple classes of cell adhesion proteins that function in the assembly of neural tissue during development have glycophosphatidylinositol anchors, e.g., F3 (Gennarini et al., 1989); LAMP (Pimenta et al., 1995); NCAM-120 (Hemperly et al., 1986); and TAG1 (Furley et al., 1990). To begin to evaluate the possibility that caveolae or caveolae-like microdomains could provide for a cell-signaling mechanism operative during brain development, we initiated studies to identify known and/or novel caveolin forms in astrocytes.
Previous studies of detergent-insoluble microdomains isolated from neurons, neuroblastoma cells, and multiple brain regions have not detected caveolin protein or message (Lisanti et al., 1994a,b; Shyng et al., 1994; Gorodinsky and Harris, 1995; Olive et al., 1995; Bouillot et al., 1996; Scherer et al., 1996; Song et al., 1996b; Wu et al., 1997). Because caveolin appears to form the structural and functional basis of caveolae (Koleske et al., 1995; Scherer et al., 1995, 1996), the extent to which the detergent-insoluble complexes isolated from brain represented a counterpart to the caveolae microdomains described for other tissues and cell types was unclear. Because our detection of caveolae and caveolin in astrocytes was not consistent with these previous findings, we performed extensive comparative characterization analyses (1) to demonstrate by indirect immunofluoresence and thin-section electron microscopy a caveolae compartment in astrocytes; (2) to verify the immunofluorescence and immunoblotting analyses by cloning a cDNA for rat astrocyte caveolin; (3) to show that the caveolin in astrocytes fractionates with a membrane compartment that displays buoyant density properties analogous to those determined previously for cell types in peripheral tissues, regardless of the fractionation procedure used: Triton X-100 solubilization, sodium carbonate solubilization, and Optiprep gradient fractionation; (4) to determine that caveolin-containing fractions isolated from astrocytes display compositional similarities with caveolae obtained from cells of peripheral tissues; and (5) to identify caveolin-related proteins in brain, although they are detected only by a commercially available affinity-purified polyclonal antibody but not by available monoclonal antibodies 2234 or C060. Taken together, our analyses support the interpretation that a caveolae–caveolin 1 compartment is present in astrocytes and brain and that they resemble caveolae identified in cells of peripheral tissues.
Distribution and possible function of caveolae in astrocytes
In cells of peripheral tissues, caveolin vesicles have been implicated in multiple pathways, including those involved in biosynthetic transport functions, endocytosis, and transcytosis (Dupree et al., 1993; Palade and Bruns, 1968; Smart et al., 1996). Multiple studies reveal that caveolae undergo regulated internalization and recycling (Parton et al., 1994; Smart et al., 1995b), and they appear to have the transport machinery necessary for budding, docking, and fusion (Schnitzer et al., 1995a,b).
In astrocytes, caveolin immunoreactivity is detected at the cell surface and in association with multiple intracellular vesicles. The distribution of cytoplasmic immunoreactivity reflects a pattern consistent with that for biosynthetic transport vesicles. Vesicles appear positioned in linear arrays that extend from the perinuclear region toward the peripheral plasma membrane, although future studies will be necessary to determine whether these arrays are dependent on microtubules, actin filaments, or both. At the astrocyte cell surface, caveolin immunoreactivity is organized into prominent ring-shaped clusters that are interspersed among individual immunoreactive puncta. This distribution of immunoreactivity correlates to the distribution of caveolae identified by electron microscopic studies. Caveolae are typically organized into clusters composed of 10 or more individual components that appear to overlay elements of the rough endoplasmic reticulum but not the Golgi complex. Although this apparent association is consistent with a role for caveolin in shuttling cholesterol between the endoplasmic reticulum and the plasma membrane (Smart et al., 1996), a role for caveolin in protein sorting in the trans-Golgi network has also been demonstrated (Dupree et al., 1993; Simons and Ikonen, 1997). Thus, future studies will be necessary to evaluate the possibility that these clusters reflect preferential zones of caveolae function or preferential sites for the integration of exocytic transport vesicles into the plasma membrane. Finally, clusters of caveolae are detected at both cell surfaces, and the caveolae located adjacent to the plasmalemmal surface often display a figure-eight profile, a profile that is reminiscent of those demonstrated in capillary endothelium (Palade, 1953; Palade and Bruns, 1968; Simionescu et al., 1975). Thus, caveolae in astrocytes may prove to participate in transcellular transport functions as demonstrated for endothelial cells (Ghitescu et al., 1986; Milici et al., 1987).
Do multiple forms of caveolin exist in astrocytes?
Two-dimensional immunoblotting analyses performed with affinity-purified anti-caveolin polyclonal antibodies suggest that multiple caveolin species are expressed in astrocytes. These species may comprise known or novel forms of caveolin (caveolin-related proteins) and/or may represent posttranslational modifications of caveolin-1. Recent work has shown the existence of a multigene family of caveolin-related proteins that share general similarities in structure and function but differ in specific properties and tissue distribution. At present, we have not evaluated critically the distribution of caveolin-2 or caveolin-3 message in astrocytes or in brain, nor have we performed studies of potential posttranslational modification of caveolin-1, e.g., phosphorylation. Interestingly, the complex pattern of caveolin species detected in astrocytes can be separated on the basis of density into pools comprising individual components, thereby suggesting that different forms of caveolin may distribute to different subcellular compartments. In agreement with this possibility, immunolocalization studies of the inositol triphosphate receptor and the plasma membrane Ca2+ATPase have suggested the existence of at least two populations of caveolae in the plasma membrane (Fujimoto et al., 1992; Fujimoto, 1993). Furthermore, immunolocalization studies demonstrate that the α and β isoforms of caveolin-1 are localized differentially within stably transfected Fischer rat thyroid cells (Scherer et al., 1995), and that caveolin-1 and caveolin-3 localize to distinct compartments in muscle cells (Parton et al., 1997).
Caveolin in brain tissue
In light of the negligible levels of message detected in primary cultures of hippocampal neurons as well as the absence of detectable antigens by immunoblotting, the caveolin-1 signal detected by Northern blot analysis in brain is probably attributable to that expressed by astrocytes, oligodendrocytes, and likely microglia. However, although the absence of detectable caveolin-1 message and protein in neurons is consistent with previous studies of detergent-insoluble complexes isolated from neurons, the possibility that select subpopulations of neurons within the brain may express significant levels of caveolin-1 cannot be ruled out by our analyses. Additionally, the Northern blot analyses suggest that caveolin-1 expression may correlate to events in late development and then subsequently be downregulated or potentially exchanged for a different caveolin form in the adult. Accordingly, in consideration of the demonstrated distribution of caveolin-1 expression in motile processes of cells in peripheral tissues, analyses of neuronal growth cones merits attention. Precedence for a temporal and spatial regulation of caveolin forms has been demonstrated recently during muscle development (Parton et al., 1997). Caveolin-1 is not detected in mature muscle cells, yet undifferentiated myoblasts express significant quantities of caveolin-1, and although caveolin-3 is a component of the developing T-tubule system, in mature muscle cells it shifts localization to the sarcolemma. Future studies will be necessary to determine whether caveolin forms in developing neural tissue are regulated in an analogous manner. Furthermore, the apparent absence of detectable caveolin-1 at embryonic time points in both the cerebral cortex and the cerebellum may not reflect the absence of caveolae but instead may point to the presence of unknown or embryonic forms of caveolin. However, at present, available anti-caveolin antibodies have not proved useful for pursuing immunolocalization studies during brain development.
The initial morphological and biochemical characterizations of detergent-insoluble complexes in type 1 astrocytes suggest that they are analogous to the caveolae compartment characterized in other tissues and cell lines. At present, however, the functional significance of a cell surface caveolae compartment in astrocytes remains unclear. The identification of caveolae-specific proteins and the development of dynamic assays will be necessary to identify potential functions for caveolae in astrocytes and as well as during brain development.
Footnotes
This research was supported by National Institutes of Health Grant NS34763 to R.S.C. We thank Kimberly Branch and Sherri Curtis for technical assistance.
Correspondence should be addressed to Richard S. Cameron at the above address.
REFERENCES
- 1.Anderson RGW. Caveolae: where incoming and outgoing messengers meet. Proc Natl Acad Sci USA. 1993;90:10909–10913. doi: 10.1073/pnas.90.23.10909. [DOI] [PMC free article] [PubMed] [Google Scholar]
- 2.Anton ES, Cameron RS, Rakic P. Role of neuron–glial junctional domain proteins in the maintenance and termination of neuronal migration across the embryonic cerebral wall. J Neurosci. 1996;16:2283–2293. doi: 10.1523/JNEUROSCI.16-07-02283.1996. [DOI] [PMC free article] [PubMed] [Google Scholar]
- 3.Bhullar RP, Haslam RJ. Detection of 23–27 kDa GTP-binding proteins in platelets and other cells. Biochem J. 1987;245:617–620. doi: 10.1042/bj2450617. [DOI] [PMC free article] [PubMed] [Google Scholar]
- 4.Bouillot C, Prochiantz A, Rougon G, Allinquant B. Axonal amyloid precursor protein expressed by neurons in vitro is present in a membrane fraction with caveolae-like properties. J Biol Chem. 1996;271:7640–7644. doi: 10.1074/jbc.271.13.7640. [DOI] [PubMed] [Google Scholar]
- 5.Bretscher MS, Whytock S. Membrane-associated vesicles in fibroblasts. J Ultrastruct Res. 1977;61:215–217. doi: 10.1016/s0022-5320(77)80088-9. [DOI] [PubMed] [Google Scholar]
- 6.Brown DA, Rose JK. Sorting of GPI-anchored proteins to glycolipid-enriched membrane subdomains during transport to the apical cell surface. Cell. 1992;68:533–544. doi: 10.1016/0092-8674(92)90189-j. [DOI] [PubMed] [Google Scholar]
- 7.Cameron PL, Sudhof TC, Jahn R, DeCamilli P. Co-localization of synaptophysin with transferrin receptors: implications for synaptic vesicle biogenesis. J Cell Biol. 1991;115:151–164. doi: 10.1083/jcb.115.1.151. [DOI] [PMC free article] [PubMed] [Google Scholar]
- 8.Cameron RS, Rakic P. Identification of membrane proteins that comprise the plasmalemmal junction between migrating neurons and radial glial cells. J Neurosci. 1994;14:3139–3155. doi: 10.1523/JNEUROSCI.14-05-03139.1994. [DOI] [PMC free article] [PubMed] [Google Scholar]
- 9.Cameron RS, Ruffin JW, Cho NK, Cameron PL, Rakic P. Developmental expression, pattern of distribution, and effect on cell aggregation implicate a neuron-glial junctional domain protein in neuronal migration. J Comp Neurol. 1997;387:467–488. [PubMed] [Google Scholar]
- 10.Chang WJ, Ying Y-S, Rothberg KG, Hooper NM, Turner AJ, Gambliel HA, Gunzburg JD, Mumby SM, Gilman AG, Anderson RGW. Purification and characterization of smooth muscle caveolae. J Cell Biol. 1994;126:127–138. doi: 10.1083/jcb.126.1.127. [DOI] [PMC free article] [PubMed] [Google Scholar]
- 11.Church GM, Gilbert W. Genomic sequencing. Proc Natl Acad Sci USA. 1984;81:1991–1995. doi: 10.1073/pnas.81.7.1991. [DOI] [PMC free article] [PubMed] [Google Scholar]
- 12.D’Arcangelo G, Miao GG, Chen SC, Soares HD, Morgan JI, Curran T. A protein related to extracellular matrix proteins deleted in the mouse mutant reeler. Nature. 1995;374:719–723. doi: 10.1038/374719a0. [DOI] [PubMed] [Google Scholar]
- 13.Dupree P, Parton RG, Raposo G, Kurzchalia TV, Simons K. Caveolae and sorting in the trans-Golgi network of epithelial cells. EMBO J. 1993;12:1597–1605. doi: 10.1002/j.1460-2075.1993.tb05804.x. [DOI] [PMC free article] [PubMed] [Google Scholar]
- 14.Fujimoto T. Calcium pump of the plasma membrane is localized in caveolae. J Cell Biol. 1993;120:1147–1157. doi: 10.1083/jcb.120.5.1147. [DOI] [PMC free article] [PubMed] [Google Scholar]
- 15.Fujimoto T, Nakade S, Miyawaki A, Miksuhiko K, Ogawa K. Localization of inositol 1,4,5-triphosphate receptor-like protein in plasmalemmal caveolae. J Cell Biol. 1992;119:1507–1513. doi: 10.1083/jcb.119.6.1507. [DOI] [PMC free article] [PubMed] [Google Scholar]
- 16.Fujimoto T, Miyawaki A, Mikoshiba K. Inositol 1,4,5-triphosphate receptor-like protein in plasmalemmal caveolae is linked to actin filaments. J Cell Sci. 1995;108:7–15. doi: 10.1242/jcs.108.1.7. [DOI] [PubMed] [Google Scholar]
- 17.Furley A, Morton JS, Manalo BD, Karagogeos D, Dodd J, Jessell T. The axonal glycoprotein TAG1 is an immunoglobulin superfamily member with neurite outgrowth promoting activity. Cell. 1990;61:157–170. doi: 10.1016/0092-8674(90)90223-2. [DOI] [PubMed] [Google Scholar]
- 18.Gennarini G, Cibelli G, Rougon G, Mattei M, Goridis C. The mouse neuronal surface protein F3: a phosphatidylinositol-anchored member of the immunoglobulin superfamily related to the chick contactin. J Cell Biol. 1989;109:775–788. doi: 10.1083/jcb.109.2.775. [DOI] [PMC free article] [PubMed] [Google Scholar]
- 19.Ghitescu L, Fixman A, Simionescu M, Simionescu N. Specific binding sites for albumin restricted to plasmalemmal vesicles of continuous capillary endothelium: receptor mediated transcytosis. J Cell Biol. 1986;102:1304–1311. doi: 10.1083/jcb.102.4.1304. [DOI] [PMC free article] [PubMed] [Google Scholar]
- 20.Gorodinsky A, Harris DA. Glycolipid-anchored proteins in neuroblastoma cells form detergent-resistant complexes without caveolin. J Cell Biol. 1995;129:619–627. doi: 10.1083/jcb.129.3.619. [DOI] [PMC free article] [PubMed] [Google Scholar]
- 21.Hemperly JJ, Edelman GM, Cunningham BA. Sequence of the neural cell adhesion molecule (N-CAM) lacking a membrane-spanning region consistent with evidence for membrane attachment via a phosphatidylinositol intermediate. Proc Natl Acad Sci USA. 1986;83:9822–9826. doi: 10.1073/pnas.83.24.9822. [DOI] [PMC free article] [PubMed] [Google Scholar]
- 22.Huber LA, Peter ME. Mapping small GTP-binding proteins on high-resolution two-dimensional gels by a combination of GTP binding and labeling with in situ periodate- oxidized GTP. Electrophoresis. 1994;15:283–288. doi: 10.1002/elps.1150150148. [DOI] [PubMed] [Google Scholar]
- 23.Hunter KE, Hatten ME. Radial glial cell transformation to astrocytes is bidirectional: regulation by a diffusible factor in embryonic forebrain. Proc Natl Acad Sci USA. 1995;92:2061–2065. doi: 10.1073/pnas.92.6.2061. [DOI] [PMC free article] [PubMed] [Google Scholar]
- 24.Kofuji P, Hofer M, Millen KJ, Millonig JH, Davidson N, Lester HA, Hatten ME. Functional analysis of the weaver mutant GIRK2 K+ channel and rescue of weaver granule cells. Neuron. 1996;16:941–952. doi: 10.1016/s0896-6273(00)80117-8. [DOI] [PubMed] [Google Scholar]
- 25.Koleske AJ, Baltimore D, Lisanti MP. Reduction of caveolin and caveolae in oncogenically transformed cells. Proc Natl Acad Sci USA. 1995;92:1381–1385. doi: 10.1073/pnas.92.5.1381. [DOI] [PMC free article] [PubMed] [Google Scholar]
- 26.Komuro H, Rakic P. Selective role of N-type calcium channels in neuronal migration. Science. 1992;257:806–809. doi: 10.1126/science.1323145. [DOI] [PubMed] [Google Scholar]
- 27.Komuro H, Rakic P. Modulation of neuronal migration by NMDA receptors. Science. 1993;260:95–97. doi: 10.1126/science.8096653. [DOI] [PubMed] [Google Scholar]
- 28.Laemmli UK. Cleavage of structural proteins during the assembly of the head of bacteriophage T4. Nature. 1970;227:680–685. doi: 10.1038/227680a0. [DOI] [PubMed] [Google Scholar]
- 29.Lapetina EG, Reep BR. Specific binding of [α-32P]GTP to cytosolic and membrane-bound proteins of human platelets correlates with the activation of phopholipase C. Proc Natl Acad Sci USA. 1987;84:2261–2265. doi: 10.1073/pnas.84.8.2261. [DOI] [PMC free article] [PubMed] [Google Scholar]
- 30.Levison SW, McCarthy KD. Astroglia in culture. In: Banker G, Goslin K, editors. Culturing nerve cells. Bradford/MIT; Cambridge, MA: 1991. pp. 309–336. [Google Scholar]
- 31.Li S, Okamoto T, Chun M, Sargiacomo M, Casanova JE, Hansen SH, Nishimoto I, Lisanti MP. Evidence for a regulated interaction between heterotrimeric G proteins and caveolin. J Biol Chem. 1995;270:15693–15701. doi: 10.1074/jbc.270.26.15693. [DOI] [PubMed] [Google Scholar]
- 32.Li S, Couet J, Lisanti MP. Src tyrosine kinases, Gα subunits, and H-ras share a common membrane-anchored scaffolding protein, caveolin. J Biol Chem. 1996;271:29182–29190. doi: 10.1074/jbc.271.46.29182. [DOI] [PMC free article] [PubMed] [Google Scholar]
- 33.Lisanti MP, Scherer PE, Vidugiriene J, Tang Z-L, Hermanowski-Visatka A, Tu Y-H, Cook RF, Sargiacomo M. Characterization of caveolin-rich membrane domains isolated from an endothelial-rich source: implication for human disease. J Cell Biol. 1994a;126:111–126. doi: 10.1083/jcb.126.1.111. [DOI] [PMC free article] [PubMed] [Google Scholar]
- 34.Lisanti MP, Scherer PE, Tang Z, Sargiacomo M. Caveolae, caveolin, and caveolin rich membrane domains: a signaling hypothesis. Trends Cell Biol. 1994b;4:231–235. doi: 10.1016/0962-8924(94)90114-7. [DOI] [PubMed] [Google Scholar]
- 35.Low A, Faulhammer HG, Sprinzl M. Affinity labeling of GTP-binding proteins in cellular extracts. FEBS Lett. 1992;303:64–68. doi: 10.1016/0014-5793(92)80478-y. [DOI] [PubMed] [Google Scholar]
- 36.Marret S, Gressens P, Evard P. Arrest of neuronal migration by excitatory amino acids in hamster developing brain. Proc Natl Acad Sci USA. 1996;93:15463–15468. doi: 10.1073/pnas.93.26.15463. [DOI] [PMC free article] [PubMed] [Google Scholar]
- 37.Milici AJ, Watrous NE, Stukenbrok H, Palade GE. Transcytosis of albumin in capillary endothelium. J Cell Biol. 1987;105:2603–2612. doi: 10.1083/jcb.105.6.2603. [DOI] [PMC free article] [PubMed] [Google Scholar]
- 38.Murata M, Peranen J, Schreiner R, Wieland F, Kurzchalia TV, Simons K. VIP21/caveolin is a cholesterol-binding protein. Proc Natl Acad Sci USA. 1995;92:10339–10343. doi: 10.1073/pnas.92.22.10339. [DOI] [PMC free article] [PubMed] [Google Scholar]
- 39.Olive S, Dubois C, Schachner M, Rougon G. The F3 neuronal glycosylphosphatidylinositol-linked molecule is localized to glycolipid-enriched membrane subdomains and interacts with L1 and Fyn kinase in cerebellum. J Neurochem. 1995;65:2307–2317. doi: 10.1046/j.1471-4159.1995.65052307.x. [DOI] [PubMed] [Google Scholar]
- 40.Ogawa M, Miyata T, Nakajima K, Yagyu K, Seike M, Ikenaka K, Yamamoto H, Mikoshiba K. The reeler gene-associated antigen on Cajal-Retzius neurons is a crucial molecule for laminar organization of cortical neurons. Neuron. 1995;14:899–912. doi: 10.1016/0896-6273(95)90329-1. [DOI] [PubMed] [Google Scholar]
- 41.Palade GE. Fine structure of blood capillaries. J Appl Physics. 1953;24:1424. [Google Scholar]
- 42.Palade GE, Bruns RR. Structural modulation of plasmalemmal vesicles. J Cell Biol. 1968;37:633–649. doi: 10.1083/jcb.37.3.633. [DOI] [PMC free article] [PubMed] [Google Scholar]
- 43.Parton RG. Ultrastructural localization of gangliosides; GM1 is concentrated in caveolae. J Histochem Cytochem. 1994;42:155–166. doi: 10.1177/42.2.8288861. [DOI] [PubMed] [Google Scholar]
- 44.Parton RG, Joggerst B, Simons K. Regulated internalization of caveolae. J Cell Biol. 1994;127:1199–1215. doi: 10.1083/jcb.127.5.1199. [DOI] [PMC free article] [PubMed] [Google Scholar]
- 45.Parton RG, Way M, Zorzi N, Stang E. Caveolin-3 associates with developing T-tubules during muscle differentiation. J Cell Biol. 1997;136:137–154. doi: 10.1083/jcb.136.1.137. [DOI] [PMC free article] [PubMed] [Google Scholar]
- 46.Patil N, Cox DR, Bhat D, Faham M, Myers RM, Peterson AS. A potassium channel mutation in weaver mice implicates membrane excitability in granule cell differentiation. Nat Genet. 1995;11:126–129. doi: 10.1038/ng1095-126. [DOI] [PubMed] [Google Scholar]
- 47.Peter ME, She J, Huber LA, Terhorst C. Labeling of adenine and guanine nucleotide-binding proteins in permeabilized cells with in situ periodate-oxidized nucleotides. Anal Biochem. 1993;210:77–85. doi: 10.1006/abio.1993.1153. [DOI] [PubMed] [Google Scholar]
- 48.Peters K-R, Carley WW, Palade GE. Endothelial plasmalemmal vesicles have a characteristic striped bipolar surface structure. J Cell Biol. 1985;101:2233–2238. doi: 10.1083/jcb.101.6.2233. [DOI] [PMC free article] [PubMed] [Google Scholar]
- 49.Pimenta AF, Zhukareva V, Barbe MF, Reinoso BS, Grimley C, Henzel W, Fischer I, Levitt P. The limbic-system associated protein is an Ig superfamily member that mediates selective neuronal growth and axon targeting. Neuron. 1995;15:287–297. doi: 10.1016/0896-6273(95)90034-9. [DOI] [PubMed] [Google Scholar]
- 50.Rothberg KG, Heuser JE, Donzell WC, Ying Y-S, Glenney JR, Anderson RGW. Caveolin, a protein component of caveolae membrane coats. Cell. 1992;68:673–682. doi: 10.1016/0092-8674(92)90143-z. [DOI] [PubMed] [Google Scholar]
- 51.Sargiacomo M, Sudol M, Tang Z-L, Lisanti MP. Signal transducing molecules and glycosyl-phosphatidylinositol-linked proteins form a caveolin-rich insoluble complex in MDCK cells. J Cell Biol. 1993;122:789–807. doi: 10.1083/jcb.122.4.789. [DOI] [PMC free article] [PubMed] [Google Scholar]
- 52.Sargiacomo M, Scherer PE, Tang Z-L, Kubler E, Song KS, Sanders MC, Lisanti MP. Oligomeric structure of caveolin: implications for caveolae membrane organization. Proc Natl Acad Sci USA. 1995;92:9407–9411. doi: 10.1073/pnas.92.20.9407. [DOI] [PMC free article] [PubMed] [Google Scholar]
- 53.Scherer PE, Tang Z-L, Chun M, Sargiacomo M, Lodish HF, Lisanti MP. Caveolin isoforms differ in their N-terminal protein sequence and subcellular distribution. J Biol Chem. 1995;270:16395–16401. doi: 10.1074/jbc.270.27.16395. [DOI] [PubMed] [Google Scholar]
- 54.Scherer PE, Okamoto T, Chun M, Nishimoto I, Lodish HF, Lisanti MP. Identification, sequence, and expression of caveolin-2 defines a caveolin gene family. Proc Natl Acad Sci USA. 1996;93:131–135. doi: 10.1073/pnas.93.1.131. [DOI] [PMC free article] [PubMed] [Google Scholar]
- 55.Schnitzer JE, Allard J, Oh P. NEM inhibits transcytosis, endocytosis, and capillary permeability: implication of caveolae fusion in endothelia. Am J Physiol. 1995a;268:H48–H55. doi: 10.1152/ajpheart.1995.268.1.H48. [DOI] [PubMed] [Google Scholar]
- 56.Schnitzer JE, Liu J, Oh P. Endothelial caveolae have the molecular transport machinery for vesicle budding, docking, and fusion including VAMP, NSF, SNAP, annexins and GTPases. J Biol Chem. 1995b;270:14399–14404. doi: 10.1074/jbc.270.24.14399. [DOI] [PubMed] [Google Scholar]
- 57.Schnitzer JE, Oh P, Jacobson BS, Dvorak AM. Caveolae from luminal plasmalemma of rat lung endothelium: microdomains enriched in caveolin, Ca2+-ATPase, and inositol triphosphate receptor. Proc Natl Acad Sci. USA. 1995c;92:1759–1763. doi: 10.1073/pnas.92.5.1759. [DOI] [PMC free article] [PubMed] [Google Scholar]
- 58.Shyng S-L, Heuser JE, Harris DA. A glycolipid-anchored prion protein is endocytosed via clathrin-coated pits. J Cell Biol. 1994;125:1239–1250. doi: 10.1083/jcb.125.6.1239. [DOI] [PMC free article] [PubMed] [Google Scholar]
- 59.Sidman RL, Rakic P. Neuronal migration with special reference to developing human brain: a review. Brain Res. 1973;62:1–35. doi: 10.1016/0006-8993(73)90617-3. [DOI] [PubMed] [Google Scholar]
- 60.Simionescu N, Simionescu M, Palade GE. Permeability of muscle capillaries to small hemepeptides: evidence for the existence of patent transendothelial channels. J Cell Biol. 1975;64:586–607. doi: 10.1083/jcb.64.3.586. [DOI] [PMC free article] [PubMed] [Google Scholar]
- 61.Simons K, Ikonen E. Functional rafts in cell membranes. Nature. 1997;387:569–572. doi: 10.1038/42408. [DOI] [PubMed] [Google Scholar]
- 62.Smart EJ, Ying Y-S, Mineo C, Anderson RGW. A detergent free method for purifying caveolae membrane from tissue culture cells. Proc Natl Acad Sci USA. 1995a;92:10104–10108. doi: 10.1073/pnas.92.22.10104. [DOI] [PMC free article] [PubMed] [Google Scholar]
- 63.Smart EJ, Estes K, Anderson RGW. Inhibitors that block both the internalization of caveolae and the return of plasmalemmal vesicles. Cold Spring Harb Symp Quant Biol. 1995b;60:243–248. doi: 10.1101/sqb.1995.060.01.028. [DOI] [PubMed] [Google Scholar]
- 64.Smart EJ, Ying Y-S, Donzell WC, Anderson RGW. A role for caveolin in transport of cholesterol from endoplasmic reticulum to the plasma membrane. J Biol Chem. 1996;271:29427–29435. doi: 10.1074/jbc.271.46.29427. [DOI] [PubMed] [Google Scholar]
- 65.Song KS, Li S, Okamoto T, Quilliam LA, Sargiacomo M, Lisanti MP. Co-purification and direct interaction of Ras with caveolin, an integral membrane protein of caveolae microdomains. Detergent free purification of caveolae membranes. J Biol Chem. 1996a;271:9690–9697. doi: 10.1074/jbc.271.16.9690. [DOI] [PubMed] [Google Scholar]
- 66.Song KS, Scherer PE, ZhaoLan T, Okamoto T, Li S, Chafel M, Chu C, Kohtz DS, Lisanti MP. Expression of caveolin-3 in skeletal, cardiac, and smooth muscle cells. J Biol Chem. 1996b;271:15160–15165. doi: 10.1074/jbc.271.25.15160. [DOI] [PubMed] [Google Scholar]
- 67.Stan R-V, Roberts WG, Predescu D, Ihida K, Saucan L, Ghitescu L, Palade GE. Immunoisolation and partial characterization of endothelial plasmalemmal vesicles (caveolae). Mol Biol Cell. 1997;8:595–605. doi: 10.1091/mbc.8.4.595. [DOI] [PMC free article] [PubMed] [Google Scholar]
- 68.Tang Z-L, Scherer PE, Okamoto T, Song K, Chu C, Kohtz DS, Nishimoto I, Lodish HF, Lisanti MP. Molecular cloning of caveolin-3, a novel member of the caveolin gene family expressed predominantly in muscle. J Biol Chem. 1996;271:2255–2261. doi: 10.1074/jbc.271.4.2255. [DOI] [PubMed] [Google Scholar]
- 69.Towbin H, Staehlin T, Gordin J. Electrophoretic transfer of pro- teins from polyacrylamide gels to nitrocellulose sheets: procedures and some applications. Proc Natl Acad Sci USA. 1979;76:4350–4354. doi: 10.1073/pnas.76.9.4350. [DOI] [PMC free article] [PubMed] [Google Scholar]
- 70.Way M, Parton RG. M-caveolin, a muscle-specific caveolin-related protein. FEBS Lett. 1995;376:108–112. doi: 10.1016/0014-5793(95)01256-7. [DOI] [PubMed] [Google Scholar]
- 71.Wu C, Butz S, Ying Y-S, Anderson RGW. Tyrosine kinase receptors concentrated in caveolae-like domains from neuronal plasma membrane. J Biol Chem. 1997;272:3554–3559. doi: 10.1074/jbc.272.6.3554. [DOI] [PubMed] [Google Scholar]
- 72.Yamada E. The fine structure of the gall bladder epithelium of the mouse. J Biophys Biochem Cytol. 1955;1:445–458. doi: 10.1083/jcb.1.5.445. [DOI] [PMC free article] [PubMed] [Google Scholar]
- 73.Zheng C, Heintz N, Hatten ME. CNS gene encoding astrotactin, which supports neuronal migration along glial fibers. Science. 1996;272:417–419. doi: 10.1126/science.272.5260.417. [DOI] [PubMed] [Google Scholar]
- 74.Zurzolo C, van’t Hof W, van Meer G, Rodriguez-Boulan E. VIP21/caveolin, glycosphingolipid clusters and the sorting of glycosylphosphatidylinositol-anchored proteins in epithelial cells. EMBO J. 1994;13:42–53. doi: 10.1002/j.1460-2075.1994.tb06233.x. [DOI] [PMC free article] [PubMed] [Google Scholar]