

Abstract
Clinical and experimental studies have shown that spinal sensory neurons become hyperexcitable after axonal injury, and electrophysiological changes have suggested that this may be attributable to changes in sodium current expression. We have demonstrated previously that sodium channel α-III mRNA levels are elevated and sodium channel α-SNS mRNA levels are reduced in rat spinal sensory neurons after axotomy. In this study we show that small (C-type) rat spinal sensory neurons express sodium currents with dramatically different kinetics after axotomy produced by sciatic nerve ligation. Uninjured C-type neurons express both slowly inactivating tetrodotoxin-resistant (TTX-R) sodium current and a fast-inactivating tetrodotoxin-sensitive (TTX-S) current that reprimes (recovers from inactivation) slowly. After axotomy, the TTX-R current density was greatly reduced. No difference was observed in the density of TTX-S currents after axotomy, and their voltage dependence was not different from controls. However, TTX-S currents in axotomized neurons reprimed four times faster than control TTX-S currents. These data indicate that axotomy of spinal neurons is followed by downregulation of TTX-R current and by the emergence of a rapidly repriming TTX-S current and suggest that this may be attributable to the upregulation of a sodium channel isoform that was unexpressed previously in these cells. These axotomy-induced changes in sodium currents are expected to alter excitability substantially and could underlie the molecular pathogenesis of some chronic pain syndromes associated with injury to the axons of spinal sensory neurons.
Keywords: sodium channel, sodium current, chronic pain, axotomy, dorsal root ganglion, excitability
Although chronic pain affects >60% of spinal cord injury patients (Knutsdottir, 1993; Levi et al., 1995; Subbarao et al., 1995), its pathophysiology is not well understood. One possibility is that nociceptive spinal sensory neurons generate inappropriate activity after injury. Spinal sensory neurons become hyperexcitable and generate spontaneous impulses after injury in experimental animals (Wall and Gutnick, 1974; Lisney and Devor, 1987; Matzner and Devor, 1994) and humans (Nystrom and Hagbarth, 1981; Nordin et al., 1984). Interestingly, anticonvulsants and local anesthetics have been used at concentrations known to act on sodium channels to manage chronic pain in humans (Boas et al., 1982; Chabal et al., 1989a; Chabal et al., 1992; Galer et al., 1993; Appelgren et al., 1996). Matzner and Devor (1992, 1994) proposed that the hyperexcitability associated with chronic pain results from an increase in sodium channel density at the site of injury. It also has been hypothesized that changes in the kinetics and voltage-dependent characteristics of sodium currents, possibly because of changes in the expression of sodium channel genes, contribute to the ectopic impulse generation and hyperexcitability of spinal sensory (dorsal root ganglion, DRG) neurons after nerve injury (Waxman et al., 1994; Rizzo et al., 1995, 1996).
DRG neurons possess a complicated mix of sodium currents (Caffrey et al., 1992; Black et al., 1996). Kostyuk et al. (1981) first reported that DRG neurons produced at least two types of sodium currents, including a fast TTX-sensitive (TTX-S) current and a slow TTX-resistant (TTX-R) current. Two groups recently cloned a sodium channel isoform (SNS) that is resistant to TTX and is proposed to underlie the TTX-R current in small neurons (Akopian et al., 1996; Sangameswaran et al., 1996). It is not clear which sodium channel isoform or isoforms underlie the TTX-S current. We have shown that normal DRG neurons can express as many as seven different sodium channel α-subunit mRNAs in situ and in vitro (Black et al., 1996), and, therefore, more than one sodium channel isoform might contribute to the TTX-S or the TTX-R component. However, it is not known what the physiological importance of the different isoforms is or if they have distinct kinetics.
Recently we demonstrated that axotomy induces an increase in the level of the type III and a decrease in SNS sodium channel mRNA in DRG C-type neurons (Waxman et al., 1994; Dib-Hajj et al., 1996), indicating that sodium current properties might be altered by axotomy. We hypothesized that axotomy increases a TTX-S current and decreases the TTX-R current in C-type DRG neurons, as previously demonstrated in large cutaneous afferent DRG neurons (Rizzo et al., 1995).
In this study we examined the effects of axonal injury on sodium current properties in small (18–25 μm) DRG C-type neurons (which include nociceptive and temperature-sensitive neurons) to determine whether the sodium currents of these neurons indeed do change after axotomy. Surprisingly, we found that axotomy is followed by the expression of a TTX-S current with different kinetic properties, especially recovery from inactivation, as well as downregulation of the TTX-R current in these cells. The axotomy-induced emergence of a sodium channel characterized by rapid repriming may provide a basis for hyperexcitability in injured DRG neurons.
MATERIALS AND METHODS
Sciatic nerve injury. Axotomy of the sciatic nerve was performed as previously described (Waxman et al., 1994). Under anesthetic, the right sciatic nerve of adult Sprague Dawley female rats was exposed, and a tight ligature was placed around the sciatic nerve near the sciatic notch proximal to the pyriform ligament. The nerve was sectioned with fine surgical scissors immediately distal to the ligature site, and the proximal nerve stump was fit into a silicone cuff. In some experiments the cuff contained 2 μl of an 8% Fluoro-gold solution for retrograde labeling, which facilitated definitive identification of axotomized neurons (Schmued and Fallon, 1986). The incision was closed, and the animals were allowed to recover.
Culture of spinal sensory neurons. DRG cells were studied after short-term culture (12–24 hr). The short-term culture (1) provided cells with truncated axonal processes that can be voltage-clamped readily and reliably, (2) allowed the cells sufficient time to adhere to the glass coverslip, and (3) was short enough to minimize changes in electrical properties that can occur in long-term cultures. The spontaneous electrical activity characteristic of DRG neurons after nerve injury can be observed in isolated injured neurons, but not in isolated control neurons (Study and Kral, 1996), demonstrating that the isolation procedure does not drastically alter the electrophysiological properties of the DRG neurons. Furthermore, adult rat DRG neurons maintained in vitro for 24 hr display a profile of sodium channel mRNA expression similar to that for DRG neurons in situ, indicating that short-term culture does not alter substantially the expression of sodium channel mRNAs in these cells (Black et al., 1996). It should be noted, however, that changes in both sodium currents and mRNA expression can be seen after 7 din vitro. The culture was performed as previously described (Caffrey et al., 1992). L4–L5 DRG neurons were cultured between 2 and 60 d postaxotomy (DPA). Only the right sciatic nerve was ligated, and the left L4–L5 DRG neurons were used as controls.
Whole-cell patch-clamp recordings. Whole-cell patch-clamp recordings were conducted at room temperature (∼21°C) with an EPC-9 amplifier. Data were acquired on an Macintosh Quadra 950 computer with the Pulse program (v 7.89, HEKA Electronic, Germany). Fire-polished electrodes (0.8–1.5 MΩ) were fabricated from 1.5 mm Drummond capillary glass by using a Sutter P-97 puller (Sutter Instruments, Novato, CA). To minimize space clamp problems, we selected only isolated cells with a soma size of 18–25 μm for recording. Cells were not considered for analysis if the initial seal resistance was <5 GΩ or if they had high leakage currents (holding current >1.0 nA at −80 mV), membrane blebs, or an access resistance >4 MΩ. Access resistance was monitored throughout the experiment, and data were not used if resistance changes of >20% occurred. The average access resistance was 2.1 ± 0.6 MΩ (mean ± SD, n= 113) for control cells and 2.0 ± 0.7 MΩ (n = 187) for axotomized cells. Voltage errors were minimized by using 70–80% series resistance compensation, and the capacitance artifact was canceled by using the computer-controlled circuitry of the patch-clamp amplifier. Linear leak subtraction, based on resistance estimates from four to five hyperpolarizing pulses applied before the depolarizing test potential, was used for all voltage-clamp recordings. Membrane currents usually were filtered at 5 kHz and sampled at 20 kHz. The pipette solution contained (in mm): 140 CsF, 1 EGTA, 10 NaCl, and 10 HEPES, pH 7.3. The standard bathing solution was (in mm): 140 NaCl, 3 KCl, 1 MgCl2, 1 CaCl2, 0.1 CdCl2, and 10 HEPES, pH 7.3. The liquid junction potential for these solutions was <8 mV; data were not corrected to account for this offset. The osmolarity of all solutions was adjusted to 310 mOsm (Wescor 5500 osmometer, Logan, UT). The offset potential was zeroed before patching the cells and checked after each recording for drift; if the drift was >10 mV/hr, the recording was discarded.
In situ hybridization. To compare the patch-clamp results with the expression of SNS mRNA in DRG neurons, we usedin situ hybridization results from adult rat DRG neurons at DPA5 (Dib-Hajj et al., 1996); this time point was chosen to correspond to electrophysiological recordings at DPA6, allowing for a 1 d lag between mRNA expression and the appearance of functional channels. The hybridization signal in small (<30 μm in diameter) DRG neurons was scored from 0 to +++, as described by Dib-Hajj et al. (1996).
RESULTS
Sodium currents were recorded from small (18–25 μm) DRG neurons with whole-cell patch-clamp techniques. Control neurons were cultured from the uninjured left L4–L5 DRG of each rat (116 cells were studied from 14 different cultures). To examine the effects of injury on sodium currents, we cultured neurons from the axotomized right L4–L5 DRGs of rats at 2, 6, 22, and 60 d postaxotomy (DPA2, DPA6, DPA22, DPA60). For each time point, 10–15 cells per culture were recorded from at least three different cultures. Because not all of the L4–L5 axons are transected at the level of sciatic nerve ligation (because of branching of the nerve proximal to the ligation site), it is estimated that only ∼70% of the neurons cultured actually were axotomized (Yip et al., 1984; Devor et al., 1985). In most experiments we did not use retrograde labeling and recorded from randomly chosen small C-type neurons. This provided a comparison with the previous study on mRNA expression (Dib-Hajj et al., 1996) in which it was not possible to identify axotomized neurons unequivocally. For some experiments (specified below), we studied fluorescently labeled axotomized neurons, which we could identify positively as axotomized neurons. Because the labeling was weak at DPA2 and DPA60, results on labeled cells are reported only for DPA6 and DPA22.
Sodium currents are altered after axotomy
Axotomy had a dramatic effect on the sodium currents of C-type neurons. Figure 1 shows recordings from a typical cell at each time point. The sodium currents in control neurons were similar to those previously described in small DRG neurons (Caffrey et al., 1992; Roy and Narahashi, 1992; Elliott and Elliott, 1993; Rizzo et al., 1994). Most control neurons expressed both fast-inactivating and slow-inactivating sodium currents (Table 1), which we refer to as “fast” and “slow,” respectively. Axotomy decreased the number of cells expressing predominantly (>70% of total) slow currents and increased the number expressing predominantly (>70% of total) fast currents (Table 1) in which the relative contributions were estimated by using the inflection point in the steady-state inactivation curves (Fig. 1).
Fig. 1.

Axotomy alters the inactivation kinetics and voltage dependence of inactivation of C-type DRG neurons. Left column, Families of traces from representative control and axotomized C-type neurons are shown. Faster inactivation kinetics are observed for the total sodium current in axotomized neurons. The currents were elicited by 20 msec test pulses to −10 mV after 500 msec prepulses to potentials over the range of −130 mV to −10 mV.Middle column, The corresponding steady-state inactivation curves are shown for each cell. Current is plotted as a fraction of peak current. In the control neuron the midpoint for steady-state inactivation (Vh) is −38 mV. At DPA2 Vh is −62 mV, and atDPA6 and DPA22 Vh is −65 mV. At DPA60 Vh is −50 mV. However, two current components can be resolved easily in the control, DPA2,DPA22, and DPA60 cells: a slowly inactivating component that has a relatively depolarized voltage dependence of inactivation and a fast-inactivating component that has a more negative Vh. The steady-state inactivation curves for these cells are bimodal because of the different inactivation properties of the two components (arrow in B indicates point of inflection). The DPA6 cell, on the other hand, appears to exhibit only fast-inactivating currents, and the steady-state inactivation is not inflected. Right column, Repriming (recovery from inactivation) is shown for each cell. Changes in repriming are described in detail in the text and in Figure 8.
Table 1.
Effect of axotomy on sodium current kinetics
| Cell type1-a | Current type (% of total) | Number of cells | ||
|---|---|---|---|---|
| Fast | Mixed | Slow | ||
| Control | 15 | 39 | 46 | 113 |
| Axotomized | ||||
| PDA2 | 32 | 48 | 20 | 40 |
| PDA6 | 71 | 29 | 0 | 31 |
| PDA22 | 73 | 21 | 6 | 33 |
| PDA60 | 50 | 35 | 15 | 54 |
Cells were categorized as displaying fast current if fast current constituted >70% of the total current and were categorized as displaying slow current if slow current constituted >70% of total current. Numbers are percentages of DRG neurons.
As has been shown by others, in control neurons the fast-inactivating current was sensitive to nanomolar concentrations of TTX, but the slow-inactivating current was resistant (Fig.2A,B). The relative TTX sensitivity of the fast and slow currents also was measured at DPA22 (n = 7) and DPA60 (n = 5) by using 100 nm TTX (Fig. 2C–F). For all cells in both groups the fast current was always sensitive and the slow current insensitive to TTX. As has been done in previous studies on DRG sodium currents (Roy and Narahashi, 1992; Elliott and Elliott, 1993; Jeftinija, 1994), we will refer to the fast-inactivating TTX-sensitive currents as the TTX-S component and the slow-inactivating TTX-resistant currents as the TTX-R component, although we did not always test the TTX sensitivity.
Fig. 2.

Tetrodotoxin (TTX) sensitivity of fast-inactivating and slowly inactivating currents in control neurons and neurons after axotomy. Representative current traces are shown for a control neuron (A, B) and neurons atDPA22 (C, D) and DPA60(E, F). C-type neurons were held at −100 mV and stepped to 0 mV for 50 msec. Current traces are shown before (solid trace) and after (dashed trace) 100 nm TTX (A, C, E). TheTTX-S component, obtained by using digital subtraction of the traces in A, C, and E, is shown in B, D, and F. The slow component is TTX-resistant, and the fast component is TTX-sensitive in all three groups.
For the majority of experiments, prepulse inactivation was used to separate the TTX-R and TTX-S current components (McLean et al., 1988; Roy and Narahashi, 1992). Prepulse inactivation takes advantage of the differences in the inactivation properties of the TTX-S and TTX-R currents and is simpler than TTX subtraction. TTX subtraction and prepulse inactivation give essentially the same results (Fig. 3).
Fig. 3.

Separation of TTX-S and TTX-R currents. Current traces were recorded from a control neuron before (A) and after (B) addition of 100 nm TTX to the bath solution. The currents were elicited by 20 msec test pulses to −10 mV after 500 msec prepulses to potentials over the range of −130 mV to −10 mV. C, The TTX-S component was obtained by digitally subtracting the data in B from A. D, The TTX-S currents were obtained by subtracting the data inA obtained with the −50 mV prepulse from the data inA obtained with more hyperpolarized prepulses.E, The steady-state inactivation (h∞) curve for the total current in A is shown (•). Theh∞ curves for the TTX-S and TTX-R components estimated with either TTX subtraction (□, TTX-R; ▵, TTX-S) or prepulse subtraction (▪, TTX-R; ▴, TTX-S) also are shown in E. Data were normalized to unity.
Inactivation kinetics and steady-state inactivation
The rate of sodium current inactivation was measured in control neurons and after axotomy. The inactivating phase for both the TTX-S and TTX-R component was well fit with a single decaying exponential. In control neurons the time constant for fast inactivation (test potential = 0 mV), using the prepulse inactivation protocol, was estimated to be 10-fold slower for the TTX-R current than for the TTX-S current (Table2). Similar values were obtained for the TTX-S and TTX-R components, respectively, in DRG neurons after axotomy (Table 2). However, because DRG neurons expressed predominantly the TTX-S current after axotomy, the total current inactivated faster in these neurons than in control neurons (see Fig. 1).
Table 2.
Inactivation of Na+ currents in C-type neurons
| Inactivation | ||||||
|---|---|---|---|---|---|---|
| TTX-R | TTX-S | |||||
| k (mV/efold) | Vh (mV) | τh (at 0 mV) (msec) | k (mV/efold) | Vh (mV) | τh (at 0 mV) (msec) | |
| Control (29) | 7.5 ± 2.4 | −30.9 ± 8.6 | 4.7 ± 1.9 | 6.4 ± 1.3 | −69.3 ± 6.6 | 0.48 ± 0.14 |
| Axotomized | ||||||
| DPA2 (11) | 8.7 ± 2.7 | −32.7 ± 5.3 | 4.5 ± 1.4 | 6.7 ± 1.6 | −68.4 ± 6.3 | 0.44 ± 0.13 |
| DPA6 (13) | 7.9 ± 2.6 | −30.3 ± 6.8 | 4.8 ± 0.9 | 6.1 ± 0.7 | −67.2 ± 4.1 | 0.55 ± 0.23 |
| DPA22 (15) | 6.4 ± 2.5 | −31.3 ± 6.7 | 4.7 ± 1.3 | 6.9 ± 1.3 | −66.6 ± 6.9 | 0.46 ± 0.12 |
| DPA60 (15) | 8.7 ± 2.7 | −32.7 ± 5.3 | 4.7 ± 1.5 | 6.5 ± 1.4 | −67.7 ± 5.1 | 0.53 ± 0.17 |
Numbers in parentheses indicate number of cells. Data are expressed as mean ± SD.
Similarly, although a striking difference was observed between control neurons and neurons after axotomy in terms of the voltage dependence of steady-state inactivation (see Fig. 1), this difference was attributable primarily to the downregulation of the TTX-R component after axotomy. In control neurons the midpoint of steady-state inactivation (Vh; 500 msec inactivating prepulses) was significantly different for TTX-S currents and TTX-R currents (Table 2, Fig. 3). Similar values were observed for the TTX-S and TTX-R currents, respectively, after axotomy (Table 2). Thus the TTX-S and TTX-R components showed similar voltage dependencies of inactivation in control neurons and neurons after axotomy. It should be noted, however, that interneuronal variation, as previously described for small DRG neurons by Rizzo et al. (1994), was observed in the midpoint of steady-state inactivation for all of the groups.
Sodium current activation
Prepulse inactivation/subtraction was used to separate the TTX-R and TTX-S components. In control neurons the TTX-S component activated at potentials ∼10 mV more negative than the TTX-R component (Table 3). The midpoints of activation (Vm) estimated with TTX (100 nm) subtraction also showed that the TTX-S component in control neurons activated ∼13 mV more negative than the TTX-R component.
Table 3.
Activation of Na+ currents in C-type neurons
| Activation | ||||
|---|---|---|---|---|
| TTX-R | TTX-S | |||
| k (mV/efold) | Vm (mV) | k (mV/efold) | Vm (mV) | |
| Control | 6.4 ± 1.5 | −15.7 ± 2.6 | 6.4 ± 1.5 | −27.6 ± 4.9 |
| Axotomized | ||||
| DPA6 (9) | 7.9 ± 1.2 | −16.9 ± 6.9 | 6.3 ± 1.7 | −21.8 ± 6.6 |
| DPA22 (14) | 6.8 ± 1.9 | −16.2 ± 4.0 | 4.8 ± 1.8 | −24.6 ± 5.5 |
Numbers in parentheses indicate number of cells. Data are expressed as mean ± SD.
We measured the voltage dependence of activation for the TTX-S current after axotomy at DPA6 and DPA22 (Table 3). TheVm for the TTX-S currents from these neurons after axotomy was within 6 mV of the Vmfor the TTX-S currents from control neurons. Similarly, theVm for the TTX-R currents after axotomy was very close to the Vm for the TTX-R currents from control neurons. In all of the groups, cell-to-cell variability, as originally reported by Rizzo et al. (1995), was observed for the voltage dependence of activation for TTX-R and TTX-S currents. It should be noted that precise measurements of activation in C-type DRG neurons are difficult because they have a high sodium current density. We used low-resistance patch pipettes and 70–80% series resistance compensation to minimize voltage errors. Our data on the voltage dependence of TTX-R and TTX-S current activation are similar to those reported by others (Roy and Narahashi, 1992; Elliott and Elliott, 1993; Ogata and Tatebayashi, 1993).
The TTX-R current is downregulated after axotomy
To quantitate the amount of TTX-R and TTX-S currents expressed in each cell, we used prepulse inactivation (McLean et al., 1988; Roy and Narahashi, 1992) to separate the TTX-S and TTX-R current components (Fig. 3). The estimates of the TTX-S and TTX-R current amplitudes obtained with prepulse inactivation were nearly identical to estimates obtained by using TTX subtraction from control and axotomized neurons (Table4).
Table 4.
Current amplitude: comparison of prepulse inactivation and TTX subtraction
| TTX-R | TTX-S | n | |||
|---|---|---|---|---|---|
| Prepulse inactivation | TTX subtraction | Prepulse inactivation | TTX subtraction | ||
| Control | 24.7 nA | 22.1 nA | 26.8 nA | 28.7 nA | 11 |
| ±3.5 | ±3.0 | ±4.7 | ±4.8 | ||
| DPA22 | 4.5 nA | 4.0 nA | 29.1 nA | 29.8 nA | 7 |
| ±1.8 | ±1.4 | ±3.4 | ±3.9 | ||
| DPA60 | 15.1 nA | 15.1 nA | 21.1 nA | 22.7 nA | |
| ±4.8 | ±5.0 | ±2.8 | ±3.3 | 5 | |
Data are expressed as mean ± SEM.
The TTX-R current amplitude and current density (amplitude normalized to cell capacitance) were significantly lower than control at all postaxotomy time points (Fig.4A). The lowest TTX-R current density (22% of control density) was observed at DPA6, with a gradual increase at DPA22 and DPA60, when it reached 46% of control levels. Surprisingly, axotomy had little effect on the current density of the TTX-S component (Fig. 4B). Cell capacitance, which provides an electrical estimate of surface area, essentially was unaffected by axotomy (Fig. 4C).
Fig. 4.

Axotomy decreases TTX-R current density. The TTX-S and TTX-R current densities were estimated in control (n = 113), DPA2 (n = 40), DPA6 (n = 30), DPA22 (n = 33), and DPA60 (n = 47) C-type neurons by using prepulse inactivation (500 msec prepulses) and a 0 mV test pulse. The TTX-R (A) and TTX-S (B) current densities were obtained by dividing the estimated peak current by the whole-cell capacitance. The TTX-R current density was significantly lower for the axotomized neurons at each time point (A). The TTX-S current density was not affected significantly by axotomy (B). Axotomy also did not alter cell capacitance significantly (C). Error bars indicate mean ± SD.
Under the conditions used in this study, both TTX-S and TTX-R currents were detected in most (95%) of the control neurons. Only 5 of 113 control cells expressed the TTX-S component alone, and only one expressed the TTX-R component in isolation. The ratio of the TTX-R amplitude to the TTX-S amplitude was 1.1 ± 0.8 (mean ± SD, n = 113) in control neurons. By contrast, the ratio of the TTX-R amplitude to TTX-S amplitude fell to 0.65 ± 0.09 (n = 40), 0.22 ± 0.05 (n = 31), 0.27 ± 0.06 (n = 33), and 0.45 ± 0.06 (n = 54) in neurons after axotomy at DPA2, DPA6, DPA22, and DPA60, respectively.
These patch-clamp data may be compared with the results of our previous study, which examined the expression of SNS and III mRNAs in DRG neurons after axotomy (Dib-Hajj et al., 1996). In that study the level of SNS mRNA expression in small DRG neurons was scored as undetectable, marginal/low, moderate, or high after nonisotopic in situhybridization (ISH). The ISH data are shown in Figure5A. To compare the ISH results with changes in TTX-R current expression, we classified small DRG neurons as having a TTX-R/TTX-S current ratio of <0.1, 0.1–0.5, 0.5–1.0, or >1.0 (Fig. 5B) or as having a TTX-R current density of <100, 100–200, 200–500, or >500 pA/pF (Fig.5C). The patterns for SNS mRNA expression (Fig.5A) and TTX-R current levels (Fig. 5B,C) in control neurons are similar; that is, a large percentage of the cells express moderate or high levels of SNS mRNA and also have >200 pA/pF TTX-R current. Conversely, at DPA5 a high percentage of the DRG neurons have undetectable or low/moderate levels of SNS hybridization signal and at DPA6 a vast majority of DRG neurons show <200 pA/pF TTX-R current. At DPA60, on the other hand, approximately one-half of the cells expressed moderate to high levels of TTX-R current, which is consistent with an observed partial recovery of SNS mRNA levels at DPA58 (Dib-Hajj et al., 1996).
Fig. 5.
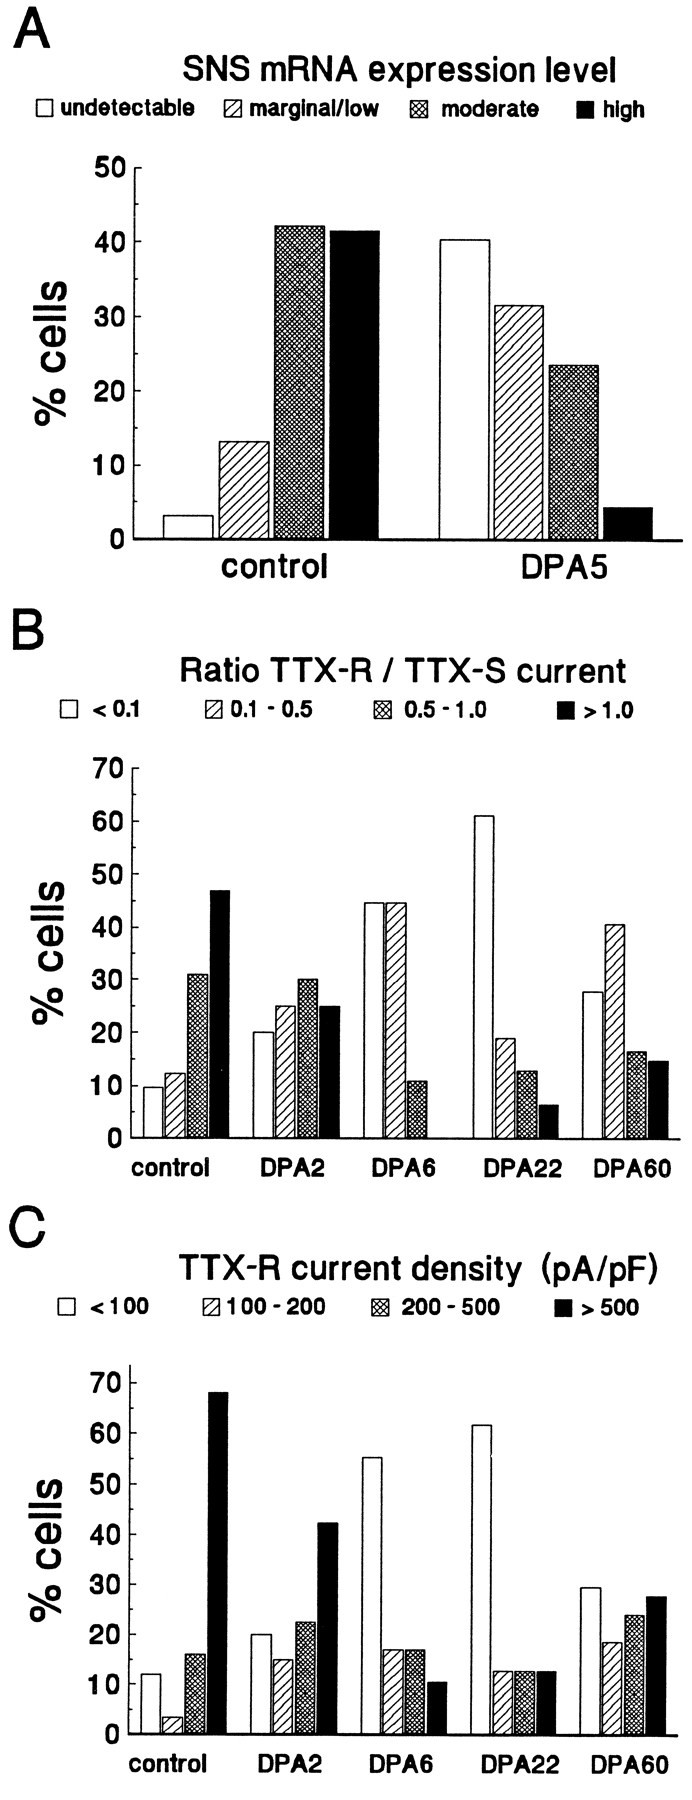
Axotomy has a similar effect on SNS mRNA expression and on TTX-R current expression. A, The relative magnitude of SNS expression was measured in culturedcontrol and DPA5 C-type neurons by in situ hybridization (Dib-Hajj et al., 1996). Expression was classified as either undetectable, marginal/low, moderate, or high.B, The ratio of the TTX-R current density to TTX-S current density is shown for control and axotomized neurons at DPA2, DPA6,DPA22, and DPA60. Cells were classified according to the ratio. C, Shown is the TTX-R current density for control and axotomized neurons atDPA2, DPA6, DPA22, andDPA60. Cells were assigned to one of four groups for each time point on the basis of TTX-R current density.
The TTX-R current is downregulated in labeled axotomized cells
Although the majority of cells at DPA6 and DPA22 exhibited predominantly TTX-S current (Table 1), five cells at DPA6 and six cells at DPA22 had a relatively high TTX-R current density (>500 pA/pF). It has been estimated that only 70% of L4–L5 neurons are axotomized when the sciatic nerve is transected at the midthigh level (Yip et al., 1984; Devor et al., 1985), and therefore the cells that expressed high densities of TTX-R current might be DRG neurons with axons that were not transected. To confirm that the TTX-R current was downregulated in axotomized cells, we did additional experiments in which axotomized neurons were identified unequivocally by selectively labeling with a fluorescent indicator (see Materials and Methods). Neurons were cultured at days 6 and 22 (DPA6 and DPA22). In these experiments all of the labeled cells expressed predominantly TTX-S currents. None of the labeled cells expressed >500 pA/pF of TTX-R current at either DPA6 (n = 16) or DPA22 (n = 14). The TTX-R to TTX-S ratio in labeled cells was 0.17 ± 0.04 (n = 16) at DPA6 and 0.15 ± 0.06 (n = 14) at DPA22. This clearly demonstrates that the TTX-R current is downregulated in axotomized C-type neurons.
Persistent currents are decreased after axotomy
Persistent currents (defined as the current remaining at the end of a 40 msec test depolarization) often were observed in small C-type neurons. Figure 6 shows persistent current expressed as a fraction of the peak current for control neurons and Fluoro-gold-labeled DPA6 and DPA22 axotomized neurons. Persistent currents in control neurons were large, often >10% of the peak current (Fig. 6A,B). Even when measured at the end of a 200 msec test pulse, the persistent current still averaged almost 10% of the peak current in control neurons (Fig.6A). In contrast, persistent currents after axotomy were small, typically <2% of the peak current (Fig.6B). We believe that the large persistent currents in control neurons were generated by TTX-R channels because (1) the persistent currents in control neurons were not sensitive to nanomolar concentrations of TTX, and large persistent currents were not observed in control neurons that expressed primarily TTX-S current (Fig. 6C); and (2) the persistent currents occurred in a fairly narrow, negative voltage region, where TTX-R window currents, resulting from overlap between steady-state activation and inactivation processes, might occur. On the other hand, the voltage dependence is also consistent with what has been reported for low-voltage-activated T-type calcium currents in newborn DRG neurons (Ogata and Tatebayashi, 1992). We do not believe that these persistent currents are calcium currents because (1) our bath solution contains 100 μm Cd2+ and our pipette solution contained fluoride, which should block calcium currents; and (2) in a previous study we were unable to detect low-voltage-activated calcium currents in small adult DRG neurons (Caffrey et al., 1992).
Fig. 6.

Axotomy decreases persistent currents in C-type neurons. A, Family of currents recorded from a control small DRG neuron. Current was elicited by test potentials from −75 to −25 in 10 mV steps. The peak current in this cell was 47 nA.B, Current–voltage relationship for the persistent current in small DRG neurons. Cells were held at −100 mV and stepped to step voltages from −80 to 40 mV for 40 msec. The average current measured from 38 to 40 msec was normalized to the maximum peak current for each cell and is plotted against the test voltage. Data are shown for control (▴, n = 12), DPA6 (•,n = 14), and DPA22 (▪, n = 14). Axotomized cells in the DPA6 and DPA22 groups were identified with a fluorescent label. For the control neurons the persistent current also was measured by using 200 msec test depolarizations (▵,n = 11). C, The persistent current in control neurons (n = 4) that express both TTX-S and TTX-R currents is shown before (▴) and after (▵) 100 nm TTX. In control neurons that express only TTX-S currents (n = 5), the persistent currents were small (□). Persistent currents were measured at 38–40 msec, as in A.
Axotomy upregulates a TTX-S current with rapid recovery from inactivation
Elliott and Elliott (1993) reported that in uninjured DRG neurons the TTX-R current recovered rapidly from inactivation and the TTX-S current recovered very slowly. We studied repriming in both control and axotomized small DRG neurons (Fig. 1, right column). We observed repriming kinetics similar to those reported by Elliott and Elliott (1993) in control neurons. The repriming kinetics in a typical control neuron are shown in Figure7, A and B. The time course was well fit with two exponentials. TTX was used to confirm that the slowly inactivating, rapidly repriming component was TTX-insensitive and that the fast-inactivating, slowly repriming component was TTX-sensitive (n = 10; Fig.7C). In control neurons that expressed both TTX-R and TTX-S currents, the TTX-R current recovered with a time constant of 1.0 ± 0.3 msec, and the TTX-S current recovered with a time constant of 60.5 ± 29.0 msec (mean ± SD,n = 45; recovery potential set at −100 mV). In some of the cells a small, ultraslow recovery component also was observed (τ ∼150–250 msec).
Fig. 7.

Recovery from inactivation has multiple components in control neurons. A, Data from a typical control C-type neuron are shown. The cell was held at −100 mV, stepped to 0 mV for 20 msec to inactivate channels, and then brought back to −100 mV for increasing durations before the test potential of 0 mV. Current traces shown in A correspond to specific time points in the recovery time course shown in B. The time course of recovery exhibited at least two components. The TTX-R component (traces1 and 2) recovered rapidly, with a time constant of 0.7 msec. The TTX-S component recovered slowly (traces5–7), with a time constant of 87 msec. C, Data from another control neuron are shown. The time course of recovery is shown for the total current (•) and for the separated TTX-R (□) and TTX-S components (▵). The TTX-R time course was obtained in the presence of 100 nm TTX. The TTX-S time course was obtained by subtracting the currents recorded with TTX from the data obtained without TTX.
Figure 8A shows the averaged recovery time course for 45 control neurons that displayed both TTX-S and TTX-R currents, with the rapid and the slow repriming components also shown separately for clarity. For the five control neurons that only expressed TTX-S current, the time constant for recovery from inactivation was intermediate (13.9 ± 9.9 msec, mean ± SD, n = 5) between the rapid and slow time constants described above (data not shown). Only 3 of the 45 cells that expressed both TTX-S and TTX-R currents exhibited a TTX-S component that recovered with a time course that might be considered as intermediate rather than slow.
Fig. 8.

The kinetics of recovery from inactivation for TTX-S current, but not for TTX-R current, are different in axotomized neurons. A, The averaged time course of recovery from inactivation for total current from control C-type neurons that expressed both TTX-S and TTX-R currents is shown (•, n = 45). At least two components can be distinguished. The time course of the rapid repriming component from control neurons with predominantly TTX-R (>75%) current is plotted separately (□, n = 11). The time course for the slow component (obtained by digitally subtracting the current recovered after 6 msec) in control cells expressing large TTX-S (>1nA/pF) currents also is shown (▵, n = 12).B, The repriming time course of the TTX-R component in an axotomized neuron (DPA6) is shown (□). For comparison, the averaged repriming time course of the TTX-R components from control neurons also is shown (dashed curve). Recovery from inactivation for the TTX-R current does not shift after axotomy. C, The time course of recovery from inactivation for injured DPA6 (○) and DPA22 (□) C-type neurons that expressed predominantly TTX-S currents is shown. For comparison, the repriming time course for the TTX-S current of control neurons also is shown (dashed curve). Note the leftward shift in the time course for recovery from inactivation for the TTX-S current after axotomy. D, The averaged time course for recovery of the TTX-S current from inactivation in Fluoro-gold-identified axotomized DPA6 and DPA22 neurons (n = 30) is shown (○). For comparison, the repriming time course for the TTX-S current of control neurons also is shown (dashed curve).
The repriming kinetics were measured in DRG neurons at all time points after axotomy. The TTX-R component recovered rapidly in all of the cells from rats with ligated nerves. However, in only 2 of the 30 Fluoro-gold-labeled axotomized neurons was the TTX-R component large enough to measure accurately the repriming kinetics (Fig.8B). In both of these cells, the TTX-R time constant for recovery from inactivation was near 0.9 msec, i.e., it remained close to control values.
In contrast, axotomy was followed by the emergence of a distinct TTX-S current, which we term the “rapidly repriming TTX-S” current. The time constant for recovery from inactivation for the rapidly repriming TTX-S current was shifted to dramatically shorter values. In all of the Fluoro-gold-labeled cells the TTX-S current reprimed with an intermediate time course (Fig. 8C,D), with a time constant of 14.3 ± 6.3 msec (mean ± SD, n = 16) measured at DPA6 and 15.8 ± 5.1 msec (n = 12) at DPA22. This time constant in axotomized neurons is much shorter than the slow recovery time constant measured for the TTX-S current in the majority of control cells that expressed both TTX-R and TTX-S currents.
In recordings from randomly chosen DPA6 neurons from experiments in which Fluoro-gold labeling was not used, the TTX-S current dominated in 21 of 30 cells, and again the repriming time course was well fit with a single intermediate exponential (τ = 14.9 ± 7.6 msec). Of the other nine DPA6 neurons in these experiments, six fit the pattern observed in control neurons with rapid (τ = 1.3 msec) and slow (τ = 72 msec) repriming kinetics corresponding to TTX-R and TTX-S components, and three had both fast (τ = 1 msec) and intermediate (τ = 20 msec) kinetics corresponding to TTX-R and TTX-S components. In the DPA22 experiments in rats in which Fluoro-gold labeling was not used, the TTX-S component dominated in 22 of 29 cells, and 21 of these had an intermediate time course for repriming (16.2 ± 6.8 msec). In the remaining predominantly TTX-S cell, repriming had a slow time constant of 58 msec. For the seven DPA22 cells in these experiments with TTX-S and TTX-R currents, five had both fast (τ = 1.0 msec) and slow (τ = 85 msec) recovery components, and two had fast (τ = 0.9 msec) and intermediate (τ = 16 msec) recovery components.
At DPA60, repriming kinetics was examined in 48 randomly chosen cells from experiments in which Fluoro-gold labeling was not attempted. Almost one-half of the cells exhibited predominantly TTX-S current. For these 21 TTX-S cells the time course showed intermediate kinetics (τ = 17.9 ± 6.6 msec). The other 27 DPA60 cells possessed both TTX-S and TTX-R currents. Sixteen of these cells displayed fast (τ = 1.3 msec) and slow (τ = 69 msec) components of repriming, six displayed fast (τ = 1.0 msec) and intermediate (τ = 19 msec) components, and five had multiple components. The repriming data indicate that axotomy results in the expression of TTX-S current with different properties, as well as downregulating the TTX-R current, and show that these changes persist for at least 60 d after axotomy.
TTX-S currents in normal and axotomized neurons display lidocaine sensitivity
Previous studies have indicated that lidocaine and other sodium channel inhibitors can block ectopic impulses in injured neurons at concentrations that are not sufficient to block normal nociception (Yaari and Devor, 1985; Chabal et al., 1989b; Devor et al., 1992). Roy and Narahashi (1992) reported that TTX-R currents were less sensitive to lidocaine than TTX-S currents (KD values of 200 μm and 50 μm, respectively). Therefore, we wanted to test the relative sensitivity of TTX-S currents in axotomized neurons. We applied 50 μm lidocaine to control and axotomized (labeled DPA8) neurons. Use-dependent lidocaine inhibition was measured by comparing the amplitude of the first and 20th pulse in a 10 Hz pulse train (10 msec, 0 mV depolarizations). Although the TTX-S component was inhibited by 62 ± 22%, the TTX-R component in control neurons was inhibited by only 11 ± 6% (n = 4). In the labeled DPA8 neurons the TTX-S current was inhibited by 53 ± 16% (n = 4). Thus the TTX-S components in both control and injured neurons were significantly more sensitive to therapeutic concentrations of lidocaine than the TTX-R component in control neurons. The sensitivity of the TTX-R current was not measured in DPA8 cells, because they exhibited only small TTX-R currents. Because the TTX-S current dominates in axotomized neurons, the total sodium current in axotomized neurons is relatively more sensitive to lidocaine than the current in uninjured neurons (Fig. 9).
Fig. 9.
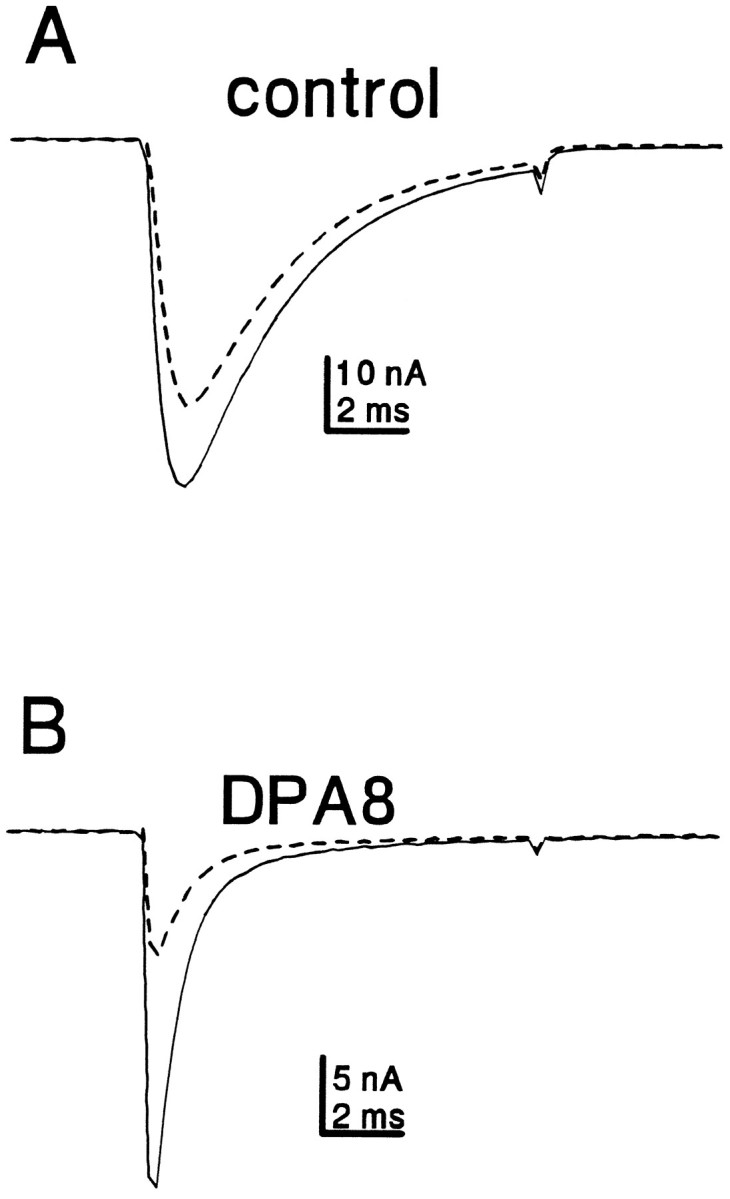
Axotomy increases the relative sensitivity of C-type neurons to frequency-dependent inhibition by lidocaine. Representative traces from a control (A) and DPA8 (B) neuron are shown. Cells were exposed to 50 μm lidocaine. After 5 min, the cells were stimulated with a 10 Hz train of 20 depolarizations (to 0 mV for 10 msec). The currents elicited by the first (solid trace) and 20th (dashed trace) depolarizations are shown.
DISCUSSION
We have studied the effects of axotomy on sodium currents in small C-type DRG neurons. Axotomy results in dramatic and complex changes in the sodium currents expressed in these neurons. Axotomy decreased the amount of slowly inactivating TTX-R current and resulted in increased expression of a distinct fast-inactivating/rapidly repriming TTX-S current. These changes were still evident 60 d after axotomy. The results presented here, in conjunction with our previous studies that examined sodium channel mRNA expression in axotomized DRG neurons, provide new insights into the molecular pathophysiology of peripheral nerve injury and may have implications for understanding chronic pain syndromes.
Axotomy downregulates TTX-R current and SNS mRNA levels
One striking effect of axotomy was the downregulation of TTX-R current density. It has been proposed that the TTX-R current is encoded by the SNS transcript (Akopian et al., 1996; Sangameswaran et al., 1996). Our data support this proposal. ISH demonstrated that ∼90% of small neurons express SNS α-subunit mRNA (Black et al., 1996). This closely correlates with the observation presented here that 101 of 113 control neurons expressed significant levels (>50 pA/pF) of TTX-R current. Furthermore, the effect of axotomy on SNS mRNA levels at DPA5 is similar to the effect on TTX-R current density at DPA6 (Fig. 5). With the use of RT-PCR of the whole ganglion, it has been demonstrated that SNS mRNA partially recovers toward control levels by 58 d after axotomy (Dib-hajj et al., 1996). In agreement with the recovery of SNS levels at later times postaxotomy, we observed an increase in TTX-R current density between DPA6 and DPA60.
It has been suggested that axotomy might cause a reversion to an embryonic mode of sodium channel expression (Iwahashi et al., 1994;Waxman et al., 1994). The loss of TTX-R current is consistent with an embryonic mode of sodium channel expression. Fedulova et al. (1994) reported that only 24% of embryonic (E17) DRG neurons express TTX-R currents and observed a TTX-R current density in E17 cells that was comparable to our results from DPA6 and DPA22 axotomized neurons.
Axotomy upregulates rapidly repriming TTX-S current and type III mRNA levels
In contrast to the effect on SNS mRNA levels, axotomy induces expression of type III mRNA in DRG neurons (Waxman et al., 1994). Surprisingly, we did not see a significant change in the TTX-S current density after axotomy. However, the TTX-S current components in control and injured neurons displayed significantly different rates of recovery from inactivation. Axotomized neurons express a TTX-S current that recovers much faster than in control neurons (Fig. 8). The emergence of a TTX-S current with different repriming kinetics could result from upregulation of type III channels and downregulation of a TTX-S channel that is expressed in uninjured neurons. This axotomy-induced change in repriming kinetics is also consistent with a reversion to an earlier developmental mode of sodium channel expression (Ogata and Tatebayashi, 1992).
Our data raise the intriguing possibility that different channel isoforms may show important differences in terms of repriming kinetics. Surprisingly little electrophysiological difference has been observed to date among the different brain sodium channel isoforms, leading some to ask why so many channel isoforms exist. Differences in repriming kinetics could have important implications for excitability and repetitive firing properties. Changes in repriming kinetics also could have pathophysiological importance. Indeed, some of the skeletal muscle sodium channel mutations associated with hereditary forms of paramyotonia congenita increase the rate of recovery from inactivation (Yang et al., 1994), which can contribute to hyperexcitability of affected skeletal muscle by reducing the refractory period (Chahine et al., 1994).
If the slow- and fast-recovering TTX-S currents are encoded by distinct isoforms, then our results predict that other mRNAs besides SNS are downregulated by axotomy. If so, what α-subunit produces the TTX-S current in control neurons? We found that all but 1 of 113 control neurons expressed >50 pA/pF of TTX-S current. Using ISH, Black et al. (1996) found that virtually all small neurons express an mRNA that hybridized to the hNE-Na probe. Except for the SNS probe, no other transcript was nearly so abundant in uninjured small neurons. Recombinant hNE-Na channels expressed in HEK-293 cells seem to have fast inactivation decay kinetics and are TTX-sensitive (Klugbauer et al., 1995), but the repriming kinetics have not yet been characterized. Thus, the hNE-Na isotype is a candidate for encoding the TTX-S current with slow recovery from inactivation.
Physiological implications
We show in Figure 3 that control neurons express approximately the same amount of TTX-S and TTX-R current when held at −100 mV for prolonged periods. However, the resting potential of DRG neurons is reported to be approximately −60 mV (Caffrey et al., 1992;Jeftinija, 1994). At this potential much of the TTX-S current in C-type neurons (Vh approximately equal to −69 mV; see Table 2) might be inactivated. Indeed, Rizzo et al. (1994)studied C-type DRG neurons, using −60 mV as the holding potential, and observed virtually no TTX-S currents. This seems to indicate that control neurons produce high densities of TTX-S channels that are not available for activation. An alternative explanation is that small DRG neurons have a bistable resting potential, as has been reported for other types of excitable cells (Gola and Niel, 1993;O’Donnell and Grace, 1995). TTX-R persistent currents might play a role in setting the resting potential, as demonstrated in optic nerve axons (Stys et al., 1993). Under some circumstances the C-type neurons may reside at more negative potentials from which the TTX-S currents are available for activation. However, because the TTX-S current reprimes very slowly in control neurons, the TTX-S currents probably would be involved only in the initial response to a given stimulus. After the initial response the TTX-R currents probably dictate the repetitive firing properties.
Our results suggest that the situation in injured neurons is significantly different. In the labeled neurons at DPA6 and DPA22, the predominant sodium current was a TTX-S current with intermediate repriming kinetics. Downregulation of the TTX-R current should result in relatively rapid inactivation during spike electrogenesis, which would produce narrow action potentials. Axotomy also greatly reduces the TTX-R persistent currents, which could affect resting potential and thus might increase the relative amount of TTX-S current that is available for activation. Because the TTX-S current after axotomy reprimes relatively rapidly, the injured neurons would be expected to sustain higher firing frequencies.
Chronic pain
This study, in conjunction with our previous studies on mRNA expression (Dib-Hajj et al., 1996), shows that axotomy causes a decrease in expression of the SNS channel and the TTX-R sodium current in small spinal sensory neurons. Thus the hyperexcitability observed in these cells after axotomy, which is believed to underlie some chronic pain syndromes, is not attributable to an increase in SNS/TTX-R current expression. On the other hand, our data show the emergence of a TTX-S current with rapid recovery from inactivation after axotomy (Fig. 8) and suggest that rapidly repriming TTX-S currents contribute to inappropriate firing in C-type neurons. Our results also show that type III mRNA expression is upregulated after axotomy (Waxman et al., 1994; Dib-Hajj et al., 1996).
Lidocaine and other sodium channel blockers have been used in the treatment of chronic pain (Boas et al., 1982; Chabal et al., 1989a). An expanding body of evidence suggests that it is possible pharmacologically to block some types of sodium channels while leaving other types unblocked; for example, it is possible pharmacologically to block the persistent sodium current that mediates damaging sodium influx in the anoxic optic nerve while leaving the fast sodium current, which underlies action potential electrogenesis, unblocked (Stys et al., 1992). Similarly, some sodium channel blockers inhibit ectopic activity in peripheral nerves at concentrations that do not block nociception (Yaari and Devor, 1985; Burchiel, 1988; Chabal et al., 1989b; Devor et al., 1992). Matzner and Devor (1994) found that high concentrations (3–300 μm) of TTX blocked ectopic impulses in chronically injured DRG neurons, providing additional evidence that sodium channels underlie hyperexcitability after nerve injury, although their results did not identify the channel subtype or subtypes involved. Interestingly, the recombinant SNS channel expressed in Xenopus oocytes is only weakly sensitive to lidocaine and phenytoin (Akopian et al., 1996). Consistent with this, Roy and Narahashi (1992) reported that the TTX-R channel is relatively insensitive to lidocaine (KD ∼0.2 mm), and we have confirmed that result. Our data (Fig. 9), on the other hand, show that the predominant TTX-S current in axotomized neurons is sensitive to lidocaine.
Our data on sodium current (this study) and mRNA expression levels (Waxman et al., 1994; Dib-Hajj et al., 1996) indicate that altered expression of TTX-S sodium channel isoforms, in addition to or rather than an alteration in SNS and TTX-R currents, plays a predominant role in generating hyperexcitability, which underlies pain after injury to DRG neurons. Moreover, our results demonstrate that the TTX-S sodium channel that is expressed in spinal sensory neurons after axotomy exhibits rapid recovery from inactivation and suggest that this rapid repriming predisposes these cells to abnormal firing, which underlies chronic pain. Drugs targeted at the sodium channel isoforms producing rapidly repriming currents (possibly type III isoform) therefore may be appropriate for the treatment of some types of chronic pain.
Footnotes
This work was supported in part by the Medical Research Service, Department of Veterans Affairs. T.R.C. was supported in part by a fellowship from the Eastern Paralyzed Veterans Association and by a grant from the Paralyzed Veterans of America Spinal Cord Research Foundation. We thank Drs. Joel Black, Sulayman Dib-Hajj, and Marco Rizzo for helpful discussions.
Correspondence should be addressed to Dr. Stephen G. Waxman, Department of Neurology, LCI 707, Yale University School of Medicine, 333 Cedar Street, P.O. Box 3333, New Haven, CT 06510.
REFERENCES
- 1.Akopian AN, Sivilotti L, Wood JN. A tetrodotoxin-resistant voltage-gated sodium channel expressed by sensory neurons. Science. 1996;379:257–262. doi: 10.1038/379257a0. [DOI] [PubMed] [Google Scholar]
- 2.Appelgren L, Janson M, Nitescu P, Curelaru I. Continuous intracisternal and high cervical intrathecal bupivacaine analgesia in refractory head and neck pain. Anesthesiology. 1996;84:256–272. doi: 10.1097/00000542-199602000-00003. [DOI] [PubMed] [Google Scholar]
- 3.Black JA, Dib-Hajj S, McNabola K, Jeste S, Rizzo MA, Kocsis JD, Waxman SG. Spinal sensory neurons express multiple sodium channel α-subunit mRNAs. Mol Brain Res. 1996;43:117–132. doi: 10.1016/s0169-328x(96)00163-5. [DOI] [PubMed] [Google Scholar]
- 4.Boas RA, Covino BG, Shahnarian A. Analgesic responses to i.v. lignocaine. Br J Anaesth. 1982;54:501–505. doi: 10.1093/bja/54.5.501. [DOI] [PubMed] [Google Scholar]
- 5.Burchiel KJ. Carbamazepine inhibits spontaneous activity in experimental neuromas. Exp Neurol. 1988;102:249–253. doi: 10.1016/0014-4886(88)90101-x. [DOI] [PubMed] [Google Scholar]
- 6.Caffrey JM, Eng DL, Black JA, Waxman SG, Kocsis JD. Three types of sodium channels in adult rat dorsal root ganglion neurons. Brain Res. 1992;592:283–297. doi: 10.1016/0006-8993(92)91687-a. [DOI] [PubMed] [Google Scholar]
- 7.Chabal C, Jacobson L, Russell LC, Burchiel KJ. Pain responses to perineuronal injection of normal saline, gallamine, and lidocaine in humans. Pain. 1989a;36:321–325. doi: 10.1016/0304-3959(89)90091-2. [DOI] [PubMed] [Google Scholar]
- 8.Chabal C, Russell LC, Burchiel KJ. The effect of intravenous lidocaine, tocainide, and mexiletine on spontaneously active fibers originating in rat sciatic neuromas. Pain. 1989b;38:333–338. doi: 10.1016/0304-3959(89)90220-0. [DOI] [PubMed] [Google Scholar]
- 9.Chabal C, Jacobson L, Mariano A, Chaney E, Britell CW. The use of oral mexiletine for the treatment of pain after peripheral nerve injury. Anesthesiology. 1992;76:513–517. doi: 10.1097/00000542-199204000-00005. [DOI] [PubMed] [Google Scholar]
- 10.Chahine M, George AL, Zhou M, Ji S, Sun W, Barchi RL, Horn R. Sodium channel mutations in paramyotonia congenita uncouple inactivation from activation. Neuron. 1994;12:281–294. doi: 10.1016/0896-6273(94)90271-2. [DOI] [PubMed] [Google Scholar]
- 11.Devor M, Govrin-Lippmann R, Frank H, Raber P. Proliferation of primary sensory neurons in adult rat dorsal root ganglion and the kinetics of retrograde cell loss after sciatic nerve section. Somatosens Res. 1985;3:139–167. doi: 10.3109/07367228509144581. [DOI] [PubMed] [Google Scholar]
- 12.Devor M, Wall PD, Catalan N. Systemic lidocaine silences ectopic neuroma and DRG discharge without blocking nerve conduction. Pain. 1992;48:261–268. doi: 10.1016/0304-3959(92)90067-L. [DOI] [PubMed] [Google Scholar]
- 13.Dib-Hajj SD, Black JA, Felts P, Waxman SG. Down-regulation of transcripts for Na channel α-SNS in spinal sensory neurons following axotomy. Proc Natl Acad Sci USA. 1996;93:14950–14954. doi: 10.1073/pnas.93.25.14950. [DOI] [PMC free article] [PubMed] [Google Scholar]
- 14.Elliott AA, Elliott JR. Characterization of TTX-sensitive and TTX-resistant sodium currents in small cells from adult rat dorsal root ganglia. J Physiol (Lond) 1993;463:39–56. doi: 10.1113/jphysiol.1993.sp019583. [DOI] [PMC free article] [PubMed] [Google Scholar]
- 15.Fedulova SA, Kostyuk PG, Veselovsky NS. Comparative analysis of ionic currents in the somatic membrane of embryonic and newborn rat sensory neurons. Neuroscience. 1994;58:341–346. doi: 10.1016/0306-4522(94)90040-x. [DOI] [PubMed] [Google Scholar]
- 16.Galer BS, Miller KV, Rowbatham MC. Response to intravenous lidocaine infusion differs based on clinical diagnosis and site of nervous system injury. Neurology. 1993;43:1233–1235. doi: 10.1212/wnl.43.6.1233. [DOI] [PubMed] [Google Scholar]
- 17.Gola M, Niel JP. Electrical and integrative properties of rabbit sympathetic neurones re-evaluated by patch clamping non-dissociated cells. J Physiol (Lond) 1993;460:327–349. doi: 10.1113/jphysiol.1993.sp019474. [DOI] [PMC free article] [PubMed] [Google Scholar]
- 18.Iwahashi Y, Furuyama T, Inagaki S, Morita Y, Takagi H. Distinct regulation of sodium channel types I, II, and III following nerve transection. Mol Brain Res. 1994;22:341–345. doi: 10.1016/0169-328x(94)90064-7. [DOI] [PubMed] [Google Scholar]
- 19.Jeftinija S. The role of tetrodotoxin-resistant sodium channels of small primary afferent fibers. Brain Res. 1994;639:125–134. doi: 10.1016/0006-8993(94)91772-8. [DOI] [PubMed] [Google Scholar]
- 20.Klugbauer N, Lacinova L, Flockerzi V, Hofmann F. Structure and functional expression of a new member of the tetrodotoxin-sensitive voltage-activated sodium channel family from human neuroendocrine cells. EMBO J. 1995;14:1084–1090. doi: 10.1002/j.1460-2075.1995.tb07091.x. [DOI] [PMC free article] [PubMed] [Google Scholar]
- 21.Knutsdottir S. Spinal cord injuries in Iceland, 1973-1989. A follow-up study. Paraplegia. 1993;31:68–72. doi: 10.1038/sc.1993.10. [DOI] [PubMed] [Google Scholar]
- 22.Kostyuk PG, Veselovsky NS, Tsyndrenko AY. Ionic currents in the somatic membrane of rat dorsal root ganglion neurons. I. Sodium currents. Neuroscience. 1981;6:2423–2430. doi: 10.1016/0306-4522(81)90088-9. [DOI] [PubMed] [Google Scholar]
- 23.Levi R, Hultling C, Nash MS, Seiger A. The Stockholm spinal cord injury study. I. Medical problems in a regional SCI population. Paraplegia. 1995;33:308–315. doi: 10.1038/sc.1995.70. [DOI] [PubMed] [Google Scholar]
- 24.Lisney SJW, Devor M. Afterdischarge and interactions among fibers in damaged peripheral nerve in the rat. Brain Res. 1987;415:122–136. doi: 10.1016/0006-8993(87)90275-7. [DOI] [PubMed] [Google Scholar]
- 25.Matzner O, Devor M. Na+ conductance and the threshold for repetitive neuronal firing. Brain Res. 1992;597:92–98. doi: 10.1016/0006-8993(92)91509-d. [DOI] [PubMed] [Google Scholar]
- 26.Matzner O, Devor M. Hyperexcitability at sites of nerve injury depends on voltage-sensitive Na+ channels. J Neurophysiol. 1994;72:349–359. doi: 10.1152/jn.1994.72.1.349. [DOI] [PubMed] [Google Scholar]
- 27.McLean MJ, Bennett PB, Thomas RM. Subtypes of dorsal root ganglion neurons based on different inward currents as measured by whole-cell voltage clamp. Mol Cell Biochem. 1988;80:95–107. doi: 10.1007/BF00231008. [DOI] [PubMed] [Google Scholar]
- 28.Nordin M, Nystrom B, Wallin U, Hagbarth KE. Ectopic sensory discharges and paresthesiae in patients with disorders of peripheral nerves, dorsal roots, and dorsal columns. Pain. 1984;20:231–245. doi: 10.1016/0304-3959(84)90013-7. [DOI] [PubMed] [Google Scholar]
- 29.Nystrom B, Hagbarth KE. Microelectrode recordings from transected nerves in amputees with phantom limb pain. Neurosci Lett. 1981;27:211–216. doi: 10.1016/0304-3940(81)90270-6. [DOI] [PubMed] [Google Scholar]
- 30.O’Donnell P, Grace AA. Synaptic interactions among excitatory afferents to nucleus accumbens neurons: hippocampal gating of prefrontal cortical input. J Neurosci. 1995;15:3622–3639. doi: 10.1523/JNEUROSCI.15-05-03622.1995. [DOI] [PMC free article] [PubMed] [Google Scholar]
- 31.Ogata N, Tatebayashi H. Comparison of two types of Na+ currents with low-voltage-activated T-type Ca2+ current in newborn rat dorsal root ganglia. Pflügers Arch. 1992;420:590–594. doi: 10.1007/BF00374638. [DOI] [PubMed] [Google Scholar]
- 32.Ogata N, Tatebayashi H. Kinetic analysis of two types of Na+ channels in rat dorsal root ganglia. J Physiol (Lond) 1993;466:9–37. [PMC free article] [PubMed] [Google Scholar]
- 33.Rizzo MA, Kocsis JD, Waxman SG. Slow sodium conductances of dorsal root ganglion neurons: intraneuronal homogeneity and interneuronal heterogeneity. J Neurophysiol. 1994;72:2796–2815. doi: 10.1152/jn.1994.72.6.2796. [DOI] [PMC free article] [PubMed] [Google Scholar]
- 34.Rizzo MA, Kocsis JD, Waxman SG. Selective loss of slow and enhancement of fast Na+ currents in cutaneous afferent dorsal root ganglion neurons following axotomy. Neurobiol Dis. 1995;2:87–96. doi: 10.1006/nbdi.1995.0009. [DOI] [PubMed] [Google Scholar]
- 35.Rizzo MA, Kocsis JD, Waxman SG. Mechanisms of paraesthesiae, dysaethesiae, and hyperaesthesiae: role of Na channel heterogeneity. Eur Neurol. 1996;36:3–12. doi: 10.1159/000117192. [DOI] [PubMed] [Google Scholar]
- 36.Roy ML, Narahashi T. Differential properties of tetrodotoxin-sensitive and tetrodotoxin-resistant sodium channels in rat dorsal root ganglion neurons. J Neurosci. 1992;12:2104–2111. doi: 10.1523/JNEUROSCI.12-06-02104.1992. [DOI] [PMC free article] [PubMed] [Google Scholar]
- 37.Sangameswaran L, Delgado SG, Fish LM, Koch BD, Jakeman LB, Stewart GR, Sze P, Hunter JC, Eglen RM, Herman RC. Structure and function of a novel voltage-gated tetrodotoxin-resistant sodium channel specific to sensory neurons. J Biol Chem. 1996;271:5953–5956. doi: 10.1074/jbc.271.11.5953. [DOI] [PubMed] [Google Scholar]
- 38.Schmued LC, Fallon JH. Fluoro-gold: a new fluorescent retrograde axonal tracer with numerous unique properties. Brain Res. 1986;377:147–154. doi: 10.1016/0006-8993(86)91199-6. [DOI] [PubMed] [Google Scholar]
- 39.Study RE, Kral MG. Spontaneous action potential activity in isolated dorsal root ganglion neurons from rats with a painful neuropathy. Pain. 1996;65:235–249. doi: 10.1016/0304-3959(95)00216-2. [DOI] [PubMed] [Google Scholar]
- 40.Stys PK, Ransom BR, Waxman SG. Tertiary and quaternary local anesthetics protect CNS white matter from anoxic injury at concentrations that do not block excitability. J Neurophysiol. 1992;67:236–240. doi: 10.1152/jn.1992.67.1.236. [DOI] [PubMed] [Google Scholar]
- 41.Stys PK, Sontheimer H, Ransom BR, Waxman SG. Noninactivating, tetrodotoxin-sensitive Na+ conductance in rat optic nerve axons. Proc Natl Acad Sci USA. 1993;90:6976–6980. doi: 10.1073/pnas.90.15.6976. [DOI] [PMC free article] [PubMed] [Google Scholar]
- 42.Subbarao JV, Klopfstein J, Turpin R. Prevalence and impact of wrist and shoulder pain in patients with spinal cord injury. J Spinal Cord Med. 1995;18:9–13. doi: 10.1080/10790268.1995.11719374. [DOI] [PubMed] [Google Scholar]
- 43.Wall PD, Gutnick M. Ongoing activity in peripheral nerves: the physiology and pharmacology of impulses originating from a neuroma. Exp Neurol. 1974;43:580–593. doi: 10.1016/0014-4886(74)90197-6. [DOI] [PubMed] [Google Scholar]
- 44.Waxman SG, Kocsis JD, Black JA. Type III sodium channel mRNA is expressed in embryonic, but not adult spinal sensory, neurons and is reexpressed following axotomy. J Neurophysiol. 1994;72:466–470. doi: 10.1152/jn.1994.72.1.466. [DOI] [PMC free article] [PubMed] [Google Scholar]
- 45.Yaari Y, Devor M. Phenytoin suppresses spontaneous ectopic discharge in rat sciatic nerve neuromas. Neurosci Lett. 1985;58:117–122. doi: 10.1016/0304-3940(85)90339-8. [DOI] [PubMed] [Google Scholar]
- 46.Yang N, Ji S, Zhou M, Ptacek LJ, Barchi RL, Horn R, George AL. Sodium channel mutations in paramyotonia congenita exhibit similar biophysical phenotypes in vitro. Proc Natl Acad Sci USA. 1994;91:12785–12789. doi: 10.1073/pnas.91.26.12785. [DOI] [PMC free article] [PubMed] [Google Scholar]
- 47.Yip HK, Rich KM, Lampe PA, Johnson EM. The effects of nerve growth factor and its antiserum on the postnatal development and survival after injury of sensory neurons in rat dorsal root ganglia. J Neurosci. 1984;4:2986–2992. doi: 10.1523/JNEUROSCI.04-12-02986.1984. [DOI] [PMC free article] [PubMed] [Google Scholar]