

Abstract
Lateral suprasylvian cortex (LS) is an important source of visual projections to both the striatum and superior colliculus. Although these two LS efferent systems are likely to be involved in different aspects of visual processing, little is known about their functional properties. In the present experiments, 86 neurons in halothane-anesthetized, paralyzed cats were recorded along the posterior aspects of the medial and lateral banks of LS (PMLS and PLLS). Neurons were selected for analysis on the basis of antidromic activation from electrodes chronically implanted in the superior colliculus and caudate nucleus. The segregated nature of corticostriatal and corticotectal neurons was apparent; in no instance could a neuron be antidromically activated from both the superior colliculus and the caudate nucleus. Many common features were revealed between corticotectal and corticostriatal neurons; the majority of neurons in both populations were binocular and contralaterally dominant, showed similar responses to stationary flashed light, and expressed within-field spatial summation and surround inhibition. However, a number of information-processing features distinguished between corticotectal and corticostriatal neurons; the former were generally tuned to lower velocities than were the latter, and, for a given eccentricity in visual space, corticotectal neurons had smaller receptive fields than did corticostriatal neurons. Moreover, most corticotectal neurons displayed a marked preference for movements toward temporal visual space, whereas corticostriatal neurons revealed no specialization for a particular direction of movement. In addition, whereas corticotectal neurons were selective for receding stimuli, corticostriatal neurons were selective for approaching stimuli. The presence of these two corticofugal pathways is discussed in relation to their presumptive functional roles in the facilitation of attentive and orientation behaviors.
Keywords: basal ganglia, caudate, lateral suprasylvian, orientation behavior, striatum, superior colliculus
An extrastriate cortical area surrounding the suprasylvian sulcus of the cat was described initially by Marshall et al. (Marshall et al., 1943) and later by Clare and Bishop (Clare and Bishop, 1954) as visually responsive. This area corresponds closely to the anatomically designated lateral suprasylvian cortex (LS) of Heath and Jones (1971) and, more recently, is believed to consist of six visuotopically organized subregions (Palmer et al., 1978). At least part of the functional role of LS in visual processes is expressed via its connections with the deeper aspects of the superior colliculus, a midbrain structure intimately involved in visual attentive and orientation behaviors (Stein and Meredith, 1991). The deep superior colliculus receives its major visual input from ipsilateral LS (Kawamura et al., 1978; Baleydier et al., 1983; Segal and Beckstead, 1984; Berson, 1985; Norita et al., 1991) and influences eye, ear, and head movements via its tectospinal projections (Huerta and Harting, 1984). Not surprisingly, then, deactivation (Ogasawara et al., 1984; Payne et al., 1996) or removal (Hardy and Stein, 1988) of LS not only severely compromises the visual responsiveness of these superior colliculus neurons but also results in a pronounced absence of eye, ear, and head orientation to contralateral visual stimuli. This contralateral visual neglect is quite similar to that produced by a lesion of the superior colliculus itself (Sprague, 1966; Hardy and Stein, 1988; Payne et al., 1996).
Although most of the emphasis on LS–superior colliculus relationships focuses on the direct corticotectal projection, several lines of evidence suggest that there is also an “indirect” corticotectal pathway whereby LS (and possibly other visual cortical areas) can access the superior colliculus via the basal ganglia and substantia nigra (for full references, see McHaffie et al., 1993a). Both the direct and presumptive indirect corticotectal pathways arise from neurons interspersed along the medial and lateral banks of the posterior regions of the LS (Kawamura et al., 1978; Battaglini et al., 1982; Berman and Payne, 1982; Baleydier et al., 1983; Segal and Beckstead, 1984; Burchinskaya et al., 1988; Norita et al., 1991;Updyke, 1993). LS targets regions in the striatum that project, in turn, to regions of the substantia nigra (Royce and Laine, 1984) that connect to the superior colliculus (i.e., via nigrotectal projections; for review, see Harting et al., 1988). It is because nigrotectal neurons are known to contact (Karabelas and Moschovakis, 1985; Tokuno and Nakamura, 1987; Williams and Faull, 1988) and modulate (Anderson and Yoshida, 1980; Chevalier et al., 1981, 1984; Hikosaka and Wurtz, 1983) deep laminae tectospinal neurons that serious consideration has been given to the possibility that a corticostriatonigrotectal pathway can provide an indirect route through which LS can modulate visual activity in the superior colliculus and, in turn, superior colliculus-mediated behaviors (for review, see McHaffie et al., 1993a). Consistent with this concept are the observations that converging inputs from LS and basal ganglia modulate the visual responsiveness of tectospinal neurons (Dunning et al., 1990) and that similar attentive and orientation defects are produced by basal ganglia and superior colliculus lesions (Gybels et al., 1967; Reeves and Hagamen, 1971;Marshall et al., 1974; Feeney and Wier, 1979).
Despite the recent surge in interest in the basal ganglia and its role in sensorimotor integration, nothing is known regarding the specific information conveyed by LS corticostriatal neurons. Similarly, there have been no attempts to assay the properties of LS corticotectal neurons. Recently, we have shown, with double retrograde labeling techniques, that corticotectal and corticostriatal projections arise from segregated populations of LS corticofugal neurons (Norita et al., 1991; McHaffie et al., 1993a). Although such an anatomical segregation implies that the information carried via these two corticofugal routes is different, there are no physiological data with which to evaluate the likelihood of this postulate. The present experiments were initiated, therefore, to examine the response properties of antidromically identified corticotectal and corticostriatal neurons.
Preliminary results of parts of this paper have been published previously in abstract form (Niida et al., 1992; Niida and McHaffie, 1993).
MATERIALS AND METHODS
All procedures were performed in compliance with the Guide for the Care and Use of Laboratory Animals (National Institutes of Health publication 91-3207) in facilities accredited by the American Association for Accreditation of Laboratory Animal Care (AAALAC). All protocols received previous approval by the Institutional Animal Care and Use Committee.
Surgical preparation. Nine adult cats of either sex weighing from 2.5 to 3.2 kg were prepared for chronic extracellular single-unit recording. Seven to ten days before the first recording session, each animal underwent a sterile surgical procedure. The animal was anesthetized with sodium pentobarbital (38 mg/kg, i.p.) and placed in a stereotaxic head holder. Small craniotomies were made to expose the cortex overlying the superior colliculus and caudate nucleus, and the dura was reflected. A linear array of four varnish-coated, tungsten monopolar stimulating electrodes (tip exposure, 150–300 μm; electrode separation, 1 mm) oriented rostral to caudal was lowered into the left superior colliculus to a point 2 mm below the first site at which vigorous visual responses were initially recorded. Two such electrode arrays were also stereotaxically implanted in the left caudate nucleus [Horsley–Clark coordinates, anterior (A) 12.0 to A15.0, lateral (L) 4.5, and height (H) 6.2; A12.5 to A15.5, L5.5, and H4.7], spanning the area where dense terminal labeling could be seen after LS cortical injections (Norita et al., 1991; McHaffie et al., 1993b; Updyke, 1993). Each of these electrode arrays was used to antidromically activate corticofugal neurons. A stainless-steel recording well was positioned over a craniotomy to allow access to the lateral suprasylvian cortex. Finally, a head-holding device was mounted over the right half of the skull so that the animal’s head could be held without any pressure points (McHaffie and Stein, 1983). The stimulating electrodes, recording well, and head holder were anchored to the skull with screws and dental acrylic. The skin around the incision was sutured shut, and all wound margins were treated with an antiseptic. After surgery, the animal received systemic injections of analgesics (butorphanol tartrate, 1 mg every 6 hr for 24–48 hr) and antibiotics (penicillin G, 250,000 U/d for 1 week).
On the day of recording, preanesthesia was induced with ketamine hydrochloride (25 mg/kg, i.m.) and acepromazine maleate (0.5 mg/kg, i.m), with atropine sulfate (0.04 mg/kg, i.m.) administered to reduce bronchial secretions. After endotracheal intubation, anesthesia was induced and maintained throughout the remainder of the experiment with halothane (0.5–1%). The animals were paralyzed with pancuronium bromide (an initial bolus of 0.3 mg/kg, i.v., followed by continuous infusion of 0.1 mg/kg/hr in lactated Ringer’s solution) and artificially ventilated. End tidal CO2 was maintained at ∼4.0% by manipulating inspiratory rate and/or volume. The level of anesthesia was routinely assessed by periodically allowing the animal to recover from paralysis and monitoring corneal blink reflexes. Core body temperature was maintained at 37°C with a circulating hot water pad. The inside of the recording well was flushed with a mixture of 10% povidone–iodine and penicillin at the beginning and end of each recording session. The pupils were dilated by topical application of 1% atropine sulfate, and the nictitating membranes and eyelids were retracted with 2.5% phenylephrine hydrochloride. The refractive state of each eye was measured by direct ophthalmoscopy, and contact lenses of the appropriate powers (0 to +3 diopters) were fitted to focus the eyes on a translucent Plexiglass hemisphere placed 57 cm in front of the animal’s eyes. Ocular alignment was adjusted to within 2° with Risley prisms, and the positions of the optic disk and area centralis of each eye were plotted onto the dome by means of reverse ophthalmoscopy.
Electrophysiological recording. Extracellular recordings were made with glass-insulated tungsten microelectrodes (tip exposure, 5–12 μm; impedance, >1 MΩ at 1 kHz) (Levick, 1972). The electrode was angled 30–40° from the horizontal to traverse one bank of the sulcus from top to bottom. After electrode positioning, the recording well was filled with agar gel to minimize pulsations, and the electrode was advanced through a small durotomy with a hydraulic microdrive. All electrode penetrations were made at 0.5 mm intervals to sample the areas designated posterior medial lateral suprasylvian cortex (PMLS) and posterior lateral lateral suprasylvian cortex (PLLS) by Palmer et al. (1978), extending from approximately A+1 to A+7.5. Neuronal responses were bandpass amplified, fed into a window discriminator, and subsequently fed to a computer for storage and subsequent analysis. The computer was used to count impulses and to construct peristimulus time histograms and rasters. Neurons with waveshapes indicative of axon recordings (Hubel, 1960; Bishop et al., 1962) were excluded from analysis. At the end of a recording session, anesthetics and paralytics were discontinued, and after the recovery of stable respiration and locomotion, the animal was returned to its home cage.
Electrical stimulation. Neurons were selected for study on the basis of antidromic activation from stimulating electrodes chronically implanted in the caudate nucleus or superior colliculus (see above). Search stimuli consisted of single rectangular, constant-current pulses of 0.15 msec duration and of either polarity delivered at 600 μA; these stimuli were delivered sequentially between adjacent pairs of electrodes at every 50–100 μm step in the traverse of the recording electrode through LS. When an antidromically activated neuron was encountered, its threshold (defined as the minimum current required for activation on at least 50% of the trials) was determined. The criteria for antidromic activation included low latency jitter (<0.2 msec), high frequency after activation (>300 Hz), and a “collision” of ascending and descending impulses (Bishop et al., 1962; Fuller and Schlag, 1976).
Visual stimulation. Receptive field mapping and initial qualitative evaluation of the response properties of LS neurons were conducted using spots or bars of light projected from a hand-held pantoscope. For quantitative assessment, light stimuli of various shapes and sizes were projected onto the hemisphere with a Prado projector. The stimuli could be flashed on and off with an electronic shutter or moved via an electronically controlled, galvanometer-driven mirror system that allowed precise control of stimulus velocity, amplitude, and direction. Stimuli were presented repeatedly (n = 8) and at low iterative rates (16 sec). Stimuli intended to replicate a visual “flow field” (Rauschecker et al., 1987) were generated by varying the size of an iris diaphragm placed in front of the projector lamp. Each LS neuron was qualitatively and quantitatively evaluated for its responsiveness to stationary flashed light, ocular dominance, changes in stimulus size, velocity preference, and directional selectivity.
Quantifying directional selectivity. Directional selectivity in LS corticofugal neurons was quantified using vector averaging from a method outlined previously (Goldberg and Brown, 1969; Yin and Greenwood, 1992). Data from a single direction of stimulus movement were considered a vector, the direction and magnitude of which corresponded to the direction of stimulus movement and the mean number of spikes evoked in eight stimulus presentations, respectively. The following convention was used to specify the direction of stimulus movement as seen from the perspective of the animal: nasal movements (i.e., toward the ipsilateral hemifield) were defined as 0°, superior movements as 90°, temporal movements (i.e., into the contralateral visual hemifield) as 180°, and inferior movements as 270°. The sine and cosine terms of each individual vector are:
The n vectors characterizing each direction of stimulus movement are treated as a distribution on a unit circle, and the mean vector is calculated. The preferred direction of stimulus movement θ is given by:
The mean magnitude of the resultant vector, indicating the vigor of the directional selectivity, is given by:
and referred to as the directional selectivity index (DSI). The value of the DSI varies between 0 and 1 such that 0 is assigned to a neuron with no overall directional selectivity, and 1 corresponds to a neuron that responded to movement in a single direction. Normalization of the value of the DSI with the total number of impulses was used to calculate the statistically significant level of directional selectivity (Mardia, 1972). A significant advantage of this type of analysis is that both the strength of directional selectivity (i.e., DSI) and preferred direction are determined by an average of the responses over the full range of directions examined.
Axial direction preference (ADP) (Rauschecker et al., 1987) was calculated; this value represents the angular difference between the preferred direction and a vector originating at the geometric center of the receptive field of a neuron and directed toward the area centralis. Thus, when the ADP is close to 180°, the neuron has a preference for centrifugal movements; when it is close to 0 or 360°, it has a centripetal preference. In addition, the width of direction tuning was quantified by calculating a half-maximal tuning angle (HMA) (Yin and Greenwood, 1992) for each neuron. It was defined by the angle that subtended responses exceeding 50% of the maximum response.
Histology. One to three small electrolytic lesions (10–12 μA for 15 sec; electrode tip negative) were made along each electrode track. After the last recording session, direct current (15–20 μA for 20 sec) was passed through each of the stimulating electrodes to mark their positions. The animal was then given a lethal dose of sodium pentobarbital and perfused transcardially with 0.9% saline followed by 10% formalin. The brain was blocked stereotaxically, removed, and placed for several days in fixative with 30% sucrose added. Serial frozen sections through the superior colliculus, caudate, and LS were cut at 50 μm and counterstained with neutral red. The positions of recorded neurons in the cortex and stimulating electrodes in the caudate and superior colliculus were reconstructed by reference to the electrolytic lesions. Each cortical recording site was assigned to PMLS or PLLS using the fundus of the middle suprasylvian sulcus as the PMLS–PLLS border (Palmer et al., 1978).
RESULTS
The receptive field properties of 86 neurons in LS, selected on the basis of their efferent status to the superior colliculus or caudate nucleus, were evaluated quantitatively with precisely controlled visual stimuli. The electrode penetrations were made within a 6-mm-long region of LS between A1.0 and A7.0 (Fig.1). Sixty-three neurons (31 in PMLS and 32 in PLLS) were activated antidromically from the superior colliculus and were thus defined as corticotectal. Twenty-three neurons (12 in PMLS and 11 in PLLS) were antidromically activated from the caudate nucleus and defined as corticostriatal (Fig. 1). All of the corticotectal, and the overwhelming majority of corticostriatal, neurons were located in lamina V (Fig.2). Because not all of these neurons could be held long enough to evaluate the entire complex of receptive field properties, the sample sizes are slightly different in each of the categories considered below. A small population of corticotectal neurons (n = 6) was unresponsive to visual stimuli and is excluded from the following analyses.
Fig. 1.

The distribution of antidromically identified corticotectal and corticostriatal neurons is depicted within an “unfolded” schematic of PMLS and PLLS. The dotted lines indicate the approximate anterior and posterior borders between PMLS and PLLS and the more rostral (AMLS, anterior medial lateral suprasylvian cortex; ALLS, anterior lateral lateral suprasylvian cortex) and caudal (DLS, dorsal lateral suprasylvian cortex;VLS, ventral lateral suprasylvian cortex) subdivisions, respectively. Note the absence of corticostriatal neurons in the more posterior aspects. LSS, Lateral suprasylvian sulcus;A, anterior; P, posterior.
Fig. 2.

The laminar distribution of corticotectal and corticostriatal neurons is depicted on four representative sections (A–D) through PMLS and PLLS. Note that the overwhelming majority of corticotectal and corticostriatal neurons were located in lamina V. AP, Anteroposterior;D, dorsal; L, lateral.
Antidromic activation
Whenever an LS neuron was isolated that could be antidromically activated from a particular structure, the effectiveness of the remaining pairs of electrodes in that array was also evaluated. The most effective electrode combination was then used for further evaluation. Characteristic examples of corticotectal and corticostriatal LS neurons are presented in Figure3, along with a schematic diagram of the experimental paradigm. Although corticofugal neurons were usually activated across several electrode pairs within a structure, in no case was a neuron antidromically activated from both the superior colliculus and caudate.
Fig. 3.

The experimental paradigm is depicted schematically along with representative examples of corticofugal LS neurons. Traces in each panel are five superimposed recordings. A corticostriatal neuron (left) was activated via the caudal electrode in the caudate (A12.5, A13.5, and L5.5). Stimulation sites for the corticotectal neuron (right) were localized in the intermediate gray layer (lamina IV) of the central portion (A1.2, A2.2, and L2.6) of the colliculus. The current thresholds for antidromic activation as well as the latency values are indicated. Note the latency invariance in the responses. The mean thresholds for corticotectal neurons (n = 63) and corticostriatal neurons (n = 23) were 280 and 340 μA, respectively. All antidromically activated neurons reliably followed high frequency pulse trains (≥300 Hz). Antidromically evoked impulses were extinguished by spontaneous or visually evoked impulses. Arrows denote the position of the annihilated impulse. In no case was it possible to activate a neuron antidromically from both the superior colliculus (SC) and striatum (ST).
Antidromic latencies
The antidromic latencies of corticotectal (range, 0.6–3.8 msec; mean of PMLS = 1.19 msec; mean of PLLS = 1.35 msec; population mean = 1.27 msec) and corticostriatal (range, 0.6–2.8 msec; mean of PMLS = 1.44 msec; mean of PLLS = 1.41 msec; population mean = 1.43 msec) neurons were not significantly different (Kolmogorov–Smirnov two-sample test) (Fig.4). Given that there are two possible direct corticotectal routes from LS to superior colliculus, a brachial route of ∼26 mm and a longer, pedunculotegmental route that is ∼33 mm (R. Segal, personal communication), these latencies correspond to a range of conduction velocities of 6.8–43.3 m/sec (mean = 20.4 m/sec via the brachium of the superior colliculus; mean = 26.0 m/sec via a pedunculotegmental trajectory). If a conduction distance of 16 mm from LS to the caudate is assumed, conduction velocities of corticostriatal neurons ranged from 5.7 to 55 m/sec (mean = 11.2 m/sec). These values all correspond to conduction velocities indicative of myelinated fibers (Waxman and Bennett, 1972).
Fig. 4.

Histograms depicting the antidromic latencies for corticotectal (upper) and corticostriatal (lower) neurons. Data obtained from PMLS neurons are shown as white bars, whereas data from PLLS are shown assolid bars. Note that both populations had substantial overlaps of distribution and that the vast majority of corticotectal and corticostriatal neurons had latencies in the range of 0.6–2.0 msec. Arrowheads denote mean latencies for each population.
Sizes of receptive fields
Each receptive field was mapped by moving a bar of light inward from all directions until a closed area of responsiveness was delimited, and for virtually all LS neurons, this was an elliptical- or oval-shaped area. The area of each receptive field was approximated by multiplying its long and short axes (Barlow et al., 1967; Hubel and Wiesel, 1969), as delimited by stimulation through the dominant eye alone (Table 1). Comparison of the receptive field sizes of the two populations revealed that the mean area for corticotectal neurons was significantly smaller than that for corticostriatals (Mann–Whitney U test, p < 0.01). Part of these differences is presumably because of differences in the topographical representations of corticotectal and corticostriatal neurons (see below).
Table 1.
Mean spontaneous activity, mean receptive field size, and mean DSI for corticotectal and corticostriatal neurons
| n | Mean SA (impulses/sec) | Mean RF size | Directional selectivity | ||||
|---|---|---|---|---|---|---|---|
| No. of neurons tested | No. of DS neurons (p < 0.05) | Mean DSI | Mean HMA | ||||
| Corticotectal | |||||||
| PMLS | 31 | 6.3 ± 5.2 | 671 ± 615 | 28 | 22 (79%) | 0.30 ± 0.18 | 157 ± 68 |
| (n = 28) | (n = 31) | (n = 22) | |||||
| PLLS | 32 | 7.9 ± 4.8 | 1058 ± 898 | 29 | 24 (83%) | 0.24 ± 0.14 | 215 ± 95 |
| (n = 29) | (n = 32) | (n = 26) | |||||
| Corticostriatal | |||||||
| PMLS | 12 | 10.8 ± 7.9 | 1398 ± 1046 | 12 | 11 (92%) | 0.22 ± 0.15 | 206 ± 102 |
| (n = 12) | (n = 12) | (n = 10) | |||||
| PLLS | 11 | 9.5 ± 6.9 | 1847 ± 1929 | 11 | 9 (82%) | 0.22 ± 0.12 | 209 ± 77 |
| (n = 11) | (n = 11) | (n = 10) | |||||
Mean SA (impulse/sec) represents mean spontaneous activity, which was measured by eight blank trials with no stimulus present. Mean receptive field (RF) sizes for corticotectal and corticostriatal neurons in PLLS were much larger than those in PMLS. DSI and HMA are described in the text. Neurons the responses of which to any other direction never fell to <50% of the maximum were excluded.
Distribution of receptive fields
The geometric centers of most corticotectal and corticostriatal receptive fields were clustered near the representation of the area centralis, extending temporally along the horizontal meridian (Fig.5A,B). However, they tended to be differentially distributed so that far more corticotectal than corticostriatal neurons had their receptive field centers within the central 10° of visual space (23 of 57, 40%, vs 4 of 23, 17%). When the corticotectal and corticostriatal neurons were separated by banks, the majority (83%) of the PMLS neurons had receptive field centers below the horizontal meridian (mean elevations, −7.6° and −14.9°, respectively) (Fig. 5C), whereas those in PLLS were more broadly distributed (mean elevations, +11.6° and −12.7°, respectively) (Fig. 5D). Thus, the corticostriatal representation of visual space seems to be biased toward larger receptive fields and the lower aspects of the visual field.
Fig. 5.

Distributions of receptive field positions of corticotectal (CT) and corticostriatal (CS) neurons recorded in PMLS and in PLLS (A–D). The position of eachsymbol represents the geometric center of the receptive field of each neuron. The majority (83%) of neurons in PMLS had receptive fields below the horizontal meridian. The mean elevations for corticotectal neurons were −7.6° in PMLS (C;solid line) and +11.6° in PLLS (D;solid line). Those for corticostriatal neurons were −14.9° in PMLS (C; dotted line) and −12.7° in PLLS (D; dotted line). Forty percent of the receptive fields of corticotectal neurons were centered within 10° of the area centralis versus 17% of those of corticostriatal neurons. T, Temporal; N, nasal.
How receptive field size varied with eccentricity in visual space was determined by plotting the area of each receptive field on a semilogarithmic plot as a function of the location of its geometric center (Fig. 6). Receptive field size varied over >2 log units, from ∼30°2 for those most central to ∼6000°2 for those most peripheral, with the majority <3000°2. Comparisons of coefficients between linear regression functions revealed that the receptive fields of corticotectal neurons in PMLS were smaller than were their counterparts in PLLS (p < 0.0002). Similarly, corticostriatal neurons in PMLS were smaller than were those in PLLS (p < 0.04). Overall, corticotectal neurons, regardless of their efferent status, had statistically smaller receptive fields than did corticostriatal neurons (p < 0.001). Thus, the largest receptive fields were in PLLS, with the corticostriatal neurons in PLLS larger than any other category. Thus, at any given eccentricity, the smallest receptive field was likely to be associated with a corticotectal neuron in PMLS.
Fig. 6.

The relationships between receptive field (RF) sizes as a function of eccentricity (ecc) for corticotectal and corticostriatal neurons recorded in PMLS (circles) and PLLS (squares) are shown in this semilogarithmic plot. Calculated linear regression lines for corticotectal and corticostriatal neurons in PMLS are shown as dashed lines, and those in PLLS are shown as solid lines. Equations are given as follows: for corticotectal neurons, RF size = 26.2 × ecc (r = 0.83;p < 0.001) in PMLS; RF size = 50.3 × ecc (r = 0.86; p < 0.001) in PLLS; and for corticostriatal neurons, RF size = 49.3 × ecc (r = 0.86; p < 0.001) in PMLS; RF size = 94.4 × ecc (r = 0.82;p < 0.001) in PLLS.
Ocular dominance and binocular interactions
There was no apparent segregation among the various populations of LS neurons in terms of ocular preferences. All but two LS neurons, the receptive field centers of which were within the binocular segment of the visual field (i.e., central 90°), were binocular, and most were better activated from the contralateral than from the ipsilateral eye. The similarity in the ocular dominance histograms of corticotectal and corticostriatal neurons is shown in Figure7A. Interactions between inputs to the two eyes were examined in neurons the receptive fields of which were within the binocular segment of the visual field. A neuron was categorized as showing (1) binocular summation if simultaneous stimulation of the two eyes with the same stimulus evoked more impulses than did stimulation of either eye alone, (2) binocular facilitation if the number of impulses evoked was greater than the sum of that to the two eyes independently, and (3) binocular inhibition if the response was less than that evoked by stimulation of the dominant eye alone. Corticotectal and corticostriatal neurons fell into these different categories with similar frequencies. The majority of corticotectal (34 of 53, 64%) and corticostriatal (12 of 21, 57%) neurons, regardless of whether they were in PMLS or PLLS, showed binocular summation or facilitation, and comparatively few showed binocular inhibition (corticotectal, 9 of 53, 17%; corticostriatal, 3 of 21, 14%). The remaining neurons responded the same way to monocular and binocular stimulation, with no correlation between the type of binocular response evoked and receptive field position.
Fig. 7.
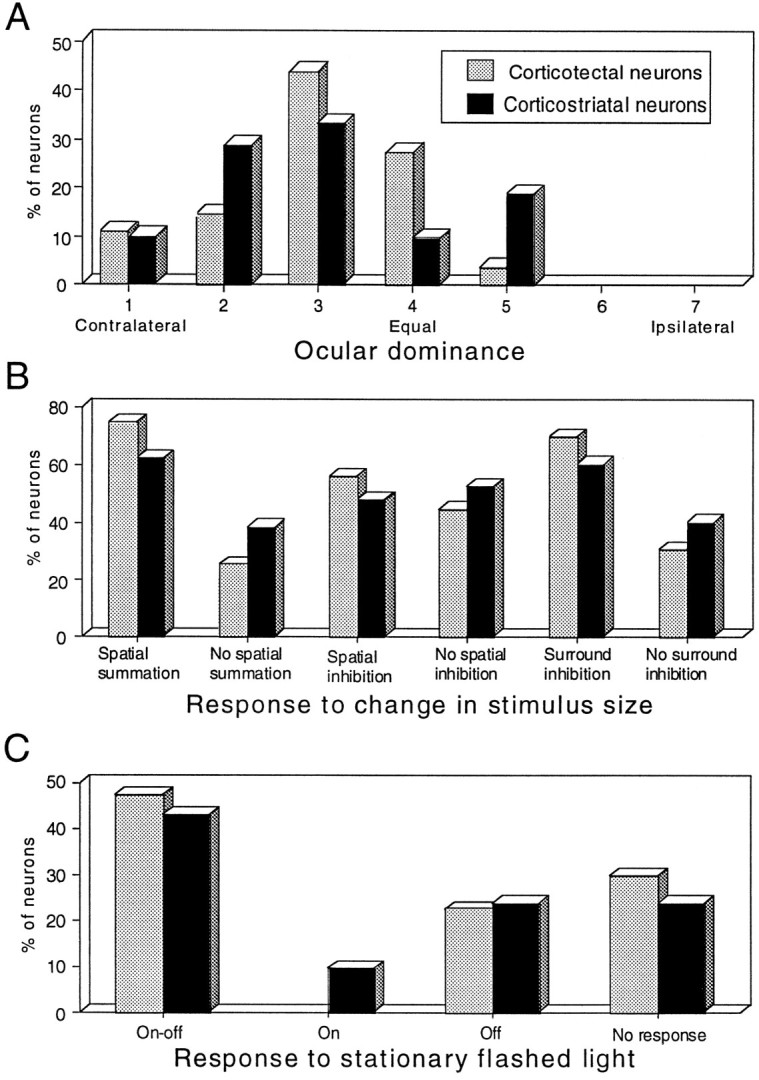
Some receptive field properties were indistinguishable between corticotectal and corticostriatal neurons.A, Ocular dominance histograms. Seven ocular dominance classes were defined as follows: class 1, exclusively dominated by the contralateral eye; class 2, predominantly dominated by the contralateral eye; class 3, slightly dominated by the contralateral eye; class 4, approximately equally dominated by either eye; class 5, slightly dominated by the ipsilateral eye; class 6, predominantly dominated by the ipsilateral eye; and class 7, exclusively dominated by the ipsilateral eye. B, Preference for responses to changes in stimulus size. C, Preference for responses to stationary flashed stimuli.
Spatial summation and inhibition
The majority of corticotectal and corticostriatal neurons reacted in similar ways to increasing stimulus size (Fig. 7B). Most of these neurons showed within-field spatial summation. For the majority (corticotectal, 42 of 63, 67%; corticostriatal, 13 of 23, 56%), spatial summation was apparent until an optimum stimulus size (mean diameter corticotectal = 3.2°; mean diameter corticostriatal 4.3°) was reached. This optimum was always smaller than the diameter of the receptive field. Increasing the size of the stimulus still further often resulted in inhibition (see Figs.11D, 12D). For a few neurons (total corticotectal and corticostriatal, 5 of 86, 6%), spatial summation increased until the stimulus covered the entire receptive field. More than half of corticotectal (39 of 63, 62%) and corticostriatal (14 of 23, 61%) neurons also showed surround inhibition such that the response decreased as the stimulus extended beyond the borders of the excitatory receptive field (see Fig. 11D). These different receptive field features were often found in the same neuron (i.e., corticotectal, 23 of 63, 37%; corticostriatal, 7 of 23, 30%).
Fig. 11.

The complement of response properties of a representative corticotectal neuron in PMLS (anteroposterior, +3.5).A, The position of the receptive field (dashed oval), the optic disk (OD), and an example of a stimulus (open box) moved through the receptive field (arrow) are illustrated.T, Temporal; N, nasal. B, The responses of the neuron to different velocities are shown.C, A polar plot illustrates the average responses (impulses/sec) for each direction of stimulus movement using the optimal stimulus size (see below) and velocity (125°/sec). The DSI, the preferred direction (θ), and the HMA(dashed arc) for this neuron are shown. The solid inner circle (dashed line in B) depicts the mean spontaneous activity (sa). Peristimulus time histograms are composed of eight epochs of 50 msec bins. Theelectronic traces for stimulus movement are above the histograms, and the arrows illustrate the directions of movement. T, Temporal; N, nasal; S, superior; I, inferior. D, The differential responses of the neuron to variations in stimulus size are shown.E, The response to an optimal stationary flashed stimulus is shown. F, Ocular dominance is shown.G, Responses to approaching versus receding stimuli are shown as stimulus size was varied from 0.5 to 30° in diameter.H, Five superimposed traces of the antidromic responses evoked from the ipsilateral superior colliculus are shown. S, Stimulation onset. Note the covariance of a comparatively small, inferior-temporal receptive field and a strong preference for movements toward temporal visual space at intermediate velocities. This neuron could be antidromically activated only from the superior colliculus and not from the striatum (data not shown).
Fig. 12.

Response properties of a representative corticostriatal neuron in PLLS (anteroposterior, +4.8). The same conventions described in Figure 11 are used here. Note the covariance of a comparatively large receptive field, centered along the horizontal meridian (at the same eccentricity as the example in Fig. 11), with a preference for high velocities and a strong bias for movements toward nasal visual space.
Response to stationary flashed light
Most corticotectal (44 of 63, 70%) and corticostriatal (17 of 23, 74%) neurons responded to stationary flashed light (Fig.7C) with discharges at light onset and offset (ON–OFF). Although the response vigor varied somewhat with stimulus position within the receptive field, there was no evidence of segregated ON, OFF, and/or ON–OFF subregions among these neurons. No differences were observed between corticotectal and corticostriatal neurons.
Orientation selectivity
Orientation selectivity was examined by comparing responses to the movement of a light bar in different orientations, presented at the optimal velocity and in the preferred direction. The length of the bar was always smaller than the diameter of the receptive field and had its axis of orientation changed in 45° increments: 0° (parallel to the preferred direction), 45°, 90° (perpendicular to the preferred direction), and 135°. Very few corticotectal (2 of 63, 3%) and no corticostriatal neurons responded selectively or preferentially to stimuli with particular orientations.
Velocity selectivity
Velocity was classified on a seven point scale, with neurons that responded equally well to a broad range of velocities (<20°/sec to >600°/sec) grouped together as wide range. As can be seen in Figure 8A, this latter group constituted a large subpopulation of both corticotectal and corticostriatal neurons. In the remainder of the neurons, in which an optimal velocity could be determined, responses were divided into six classes. In general, the velocity tuning for corticotectal neurons was skewed to lower velocities than was that for corticostriatal neurons, and these two populations were statistically distinct (χ2 = 18.8; p < 0.01). No differences were seen between neurons located in PMLS and PLLS.
Fig. 8.

Distributions of velocity preferences for corticotectal and corticostriatal neurons (A) and distributions of preferences of flow field vectors for corticotectal and corticostriatal neurons (B).Inset of B shows the distribution of neurons in PMLS and PLLS.
The correlation between the preferred velocity of a neuron and the distance between its receptive field center and area centralis was also evaluated. As indicated in Figure 9, there were clear positive relationships between preferred velocity and eccentricity for corticotectal neurons in PMLS (Pearsonr = 0.52; p < 0.005) and for corticostriatal neurons in PMLS (Pearson r = 0.58;p < 0.005), whereas the correlation was weaker for corticotectal neurons in PLLS (Pearson r = 0.29;p < 0.005) and corticostriatal neurons in PLLS (Pearson r = 0.06; p < 0.005). Thus, neurons with receptive field centers closer to central visual space responded best to slower velocities than did those with more eccentric receptive fields.
Fig. 9.

The preferred velocity as a function of eccentricity is shown for corticotectal (upper) and corticostriatal (lower) neurons. A positive relationship was seen for corticotectal (r = 0.52;p < 0.005) and corticostriatal (r = 0.58; p < 0.005) neurons in PMLS, whereas the correlation was weaker for corticotectal (r = 0.29; p < 0.005) and corticostriatal (r = 0.06; p < 0.005) neurons in PLLS.
Flow field vectors
Expanding and/or contracting annular stimuli were used to mimic approaching and receding stimuli (i.e., flow fields; see Rauschecker et al., 1987) and activated approximately half (28 of 57, 49%) of the corticotectal neurons and more than half (14 of 23, 61%) of the corticostriatal neurons (Fig. 8B). The corticotectal neurons in this sample tended to respond best to receding stimuli (28 vs 14%; 7% showing no preference), whereas corticostriatal neurons tended to respond best to approaching stimuli (35 vs 9%; 17% showing no preference). These differences among corticofugal neurons were significant (χ2 = 8.5; p < 0.05).
Directional selectivity
Inputs from LS are believed to be critical for the expression of directional selectivity in deep laminae superior colliculus neurons (Ogasawara et al., 1984). To quantify the specificity of this movement parameter and compare the preferences among corticotectal and corticostriatal LS neurons, we calculated vector averages and half-maximal angles (see Materials and Methods) for each neuron studied. For both populations, ∼80–90% showed statistically significant directional selectivity indices (see Table 1 for specific values). The locations of the receptive fields with the calculated directional selectivity index are displayed on the polar coordinate diagrams of Figure 10, A andB. Most (32 of 46, 70%) corticotectal neurons preferred movements toward temporal visual space (90–180°; only 30% preferred the opposite movements). When the distributions of axial direction preference (see Materials and Methods) were calculated (Fig.10C,D), the pronounced movement bias became more obvious. No such preference for the direction of movement was noted for corticostriatal neurons. Interestingly, corticotectal neurons the receptive field centers of which were in the upper hemifield often preferred superior-temporal (90–180°) movements, whereas neurons the receptive field centers of which were in the lower hemifield often preferred inferior-temporal (180–270°) movements. Because PMLS neurons most often had their receptive centers in the lower hemifield, there was also a relationship between LS location and directional preference.
Fig. 10.

Distributions of receptive field positions with preferred direction and DSI for corticotectal (A) and corticostriatal (B) neurons recorded in PMLS (circle) and in PLLS (square). Theposition of each symbol represents the geometric center of the receptive field for each neuron. Thedirection and length of thearrow denote the angle of the computed vector (θ) of the preferred direction and the value of the DSI, respectively (A, inset). Symbolswithout an arrow denote nondirectional neurons, the DSIs of which were not statistically significant (uniformity test,p > 0.05; see Mardia, 1972). C,D, Polar coordinate maps subdivided into eight direction categories displaying the distributions of ADP for corticotectal (C) and corticostriatal (D) neurons. ADP represents the preferred direction relative to the axis joining the receptive field center to the area centralis. Motion away from the area centralis (centrifugal movement) corresponds to 180°. Motion toward the area centralis (centripetal movement) corresponds to 0°. T, Temporal; N, nasal;S, superior; I, inferior.
In the majority of the neurons studied (80% of corticotectal and 83% of corticostriatal), the entire complement of receptive field properties was evaluated. This provided a comprehensive physiological profile of individual neurons, and the covariances of the various response properties described above are shown in two characteristic examples, one for a corticotectal neuron (Fig.11) and one for a corticostriatal neuron (Fig. 12). These examples underscore the general neuronal similarities and differences in the information-processing capabilities of these neuronal classes.
DISCUSSION
The present studies demonstrate that, although a number of physiological commonalities are present, there are physiological distinctions in the visual information-processing capabilities of antidromically identified corticotectal and corticostriatal LS neurons. Despite their intermingling in lamina V (Norita et al., 1991), these neurons form segregated output populations so that in no instance was the same neuron antidromically activated from both the superior colliculus and the caudate nucleus. These findings parallel anatomical demonstrations that corticotectal and corticostriatal neurons are distinguishable based on the sizes of their somas and their sublaminar distributions. They are also consistent with the absence of double-labeled LS neurons after injections of different retrograde tracers in the superior colliculus and caudate nucleus (Rhoades et al., 1982; Segal and Beckstead, 1984; Norita et al., 1991; McHaffie et al., 1993a; Updyke, 1993). Particularly germane in the present context is the possibility that the different signals transmitted along these two pathways may ultimately have complementary influences on the same target neurons in the midbrain.
Corticotectal and corticostriatal similarities
Early physiological descriptions of LS neurons emphasized the homogeneity of their response properties (Sherman and Spear, 1982). Indeed, the present data also revealed substantial similarities among corticotectal and corticostriatal LS populations in the proportions of binocular neurons, ocular dominance distributions, presence of within-field spatial summation and surround inhibition, lack of receptive field segregation into ON, OFF, and ON–OFF subregions, lack of orientation selectivity, and near linear increase in receptive field size with eccentricity in the visual field (Spear and Baumann, 1975;Turlejski, 1975; Camarda and Rizzolatti, 1976; Palmer et al., 1978;Smith and Spear, 1979; Gizzi et al., 1981; Blakemore and Zumbroich, 1987; Rauschecker et al., 1987). Even the conduction velocities of corticotectal and corticostriatal neurons were similar. This particular observation was surprising because the somas of corticotectal neurons are, on average, larger than those of corticostriatal neurons (Norita et al., 1991; McHaffie et al., 1993a), and one would expect that the latter would have slower conduction velocities than the former. However, the population differences obtained here were not statistically significant. Furthermore, despite suggestions that the corticostriatal projections are unmyelinated (Whitlock and Nauta, 1956;Bauswein et al., 1989), their conduction velocities fell well within the range of myelinated fibers (Waxman and Bennett, 1972), a finding paralleling data from recent studies of cat frontal eye fields (Weyand and Gafka, 1997). In contrast to these functional similarities, however, were substantial differences between corticotectal and corticostriatal neurons in the sizes and distributions of their receptive fields, directional selectivities, velocity preferences, and responses to approaching or receding stimuli.
Corticotectal and corticostriatal differences
Receptive field size and location
Both corticofugal populations were widely distributed in the medial (PMLS) and lateral (PLLS) banks of LS, and in both PMLS and PLLS, corticostriatal receptive fields were significantly larger than were their corticotectal counterparts. The visual representations in PMLS and PLLS are approximately mirror symmetric (Palmer et al., 1978;Zumbroich et al., 1986), although the representation is less precise in PLLS because of the nearly threefold increase in the receptive field sizes of its constituent neurons (Zumbroich et al., 1986; but seeRauschecker et al., 1987). Although no attempt was made here to reconstruct the high resolution visual maps presented by others (e.g.,Palmer et al., 1978), the possible biases inherent in restricting observations to neurons representing only a given region of visual space were minimized by deriving the antidromically studied population by sampling neurons along the entire rostrocaudal extent of both PMLS and PLLS.
Regardless of the location sampled, corticotectal and corticostriatal neurons in PLLS had receptive fields that were more frequently centered above the horizontal meridian than were their PMLS counterparts (Palmer et al., 1978; Zumbroich et al., 1986). However, there were also differences between corticotectal and corticostriatal neurons that superseded their location in LS. For example, the receptive fields of many more corticotectal than corticostriatal neurons were biased toward the central representation of visual space. This corticotectal bias has an obvious parallel in the expanded representation of central visual space in the superior colliculus (Feldon et al., 1972). The fact that no corticostriatal neurons were found in the most caudal aspects of PMLS or PLLS, where the area centralis is represented (Palmer et al., 1978; Grant and Shipp, 1991), is consistent with the observation that this region sends only sparse projections to the caudate nucleus (Updyke, 1993), and the coarse visuotopy along the horizontal meridian observed in the caudate (Updyke, 1993) may reflect, in part, the comparatively larger receptive fields of corticostriatal neurons in LS.
Directional selectivity
Directionally selective neurons have been shown to make a significant contribution to the perception of global motion (Pasternak et al., 1990; Rudolph et al., 1994), and the specific contribution of neurons in LS to this perception has been recently demonstrated (Rudolph and Pasternak, 1996). However, previous investigations have differed with respect to the directions of movement preferred by LS neurons. Some studies suggest that a plurality prefer centrifugal movements, although others emphasize that no preference for a single best direction of movement predominates (Hubel and Wiesel, 1969; Spear and Baumann, 1975; Camarda and Rizzolatti, 1976; Blakemore and Zumbroich, 1987; Rauschecker et al., 1987; von Grunau et al., 1987). The present observations suggest that both conclusions may be justified, depending on which neurons are included in the sample.
Using the vector-averaging technique of Yin and Greenwood (1992), we proved that the vast majority of corticotectal (81%) and corticostriatal (87%) neurons studied here were directionally selective, with similar values for the magnitude of directional bias (i.e., DSIs; see Yin and Greenwood, 1992). However, both the directional selectivity plots and the axial direction preference profiles of the two populations of neurons were very different. Overall, the population of corticotectal neurons showed a strong bias for centrifugal movements, thereby matching the preferences of their target neurons in the superior colliculus (Sterling and Wickelgren, 1969; Straschill and Hoffman, 1969; Stein and Arigbede, 1972;Rauschecker and Harris, 1983). Presumably, this centrifugal bias is imposed on superior colliculus neurons via the cortex (Wickelgren and Sterling, 1969), with the selectivity of deep laminae superior colliculus neurons specifically related to input derived from LS (Ogasawara et al., 1984). On the other hand, the population of corticostriatal neurons did not display any single best direction of movement. Although it is likely that striatal neurons also lack a single most-often-preferred direction of movement, the directional selectivity of striatal neurons remains to be detailed. The differences in the directional responses of corticotectal and corticostriatal neurons that were noted here are also consistent with the observations of Rauschecker et al. (1987), who noted that lamina V neurons in LS (the source of both corticotectal and corticostriatal projections;Norita et al., 1991; McHaffie et al., 1993a) most frequently preferred centrifugal movements, whereas those in laminae II/III (the source of corticostriatal projections) were evenly split between preferences for centrifugal and centripetal movements. Also consistent with Rauschecker et al. (1987) was the observation that many of these same neurons were preferentially activated by stimuli that mimicked approaching or receding objects, with more corticotectal neurons preferring receding stimuli and most corticostriatal neurons preferring approaching stimuli.
Velocity preferences
Although neither corticotectal nor corticostriatal neurons were exceedingly sensitive to the speed of motion, the majority were best activated within a narrow range of target speeds. Interestingly, the preference for high speeds in LS neurons is believed to covary positively with increasing eccentricity (Spear and Baumann, 1975;Camarda and Rizzolatti, 1976; Rauschecker et al., 1987; but seeTurlejski, 1975). Given that more corticotectal than corticostriatal neurons had their receptive field centers within more central regions of visual space, it followed that they were, as a population, more strongly biased toward selectivity for slower-moving stimuli. Similarly, corticostriatal neurons, with their more eccentric receptive fields, exhibited a greater preference for high velocity stimuli.
Convergence of LS corticotectal and corticostriatal activity
Compelling evidence has accumulated that LS plays an important role in modulating visually guided behaviors via its effects on the superior colliculus. First, it is the primary source of excitatory visual input to the deep layers of the ipsilateral superior colliculus (Kawamura et al., 1974; Baleydier et al., 1983; Ogasawara et al., 1984;Berson, 1985) in which such behaviors can be generated, and second, reversible deactivation of small regions of posterior LS induces both a profound “visual neglect” of contralateral visual space and a striking weakening of the visual responsiveness of ipsilateral superior colliculus neurons (Ogasawara et al., 1984; Hardy and Stein, 1988;Dunning et al., 1990). Furthermore, the visual neglect produced by compromising the integrity of LS is very similar to that produced by lesions of the superior colliculus itself (Payne et al., 1996), and in both cases the neglect can be reversed by removing the inhibitory influences conveyed via the intercollicular commissure (Sprague, 1966;Sherman, 1974; Hardy and Stein, 1988).
The most obvious route by which LS influences can be exerted on the superior colliculus is by its direct connection. The loss of its excitatory influence has commonly been held responsible for the visual neglect induced by LS lesions. However, an alternative route, through which superior colliculus neurons can be rendered more excitable (by the release from tonic inhibition), is likely to play an important complementary role. This multisynaptic indirect corticotectal route originates in LS. It is relayed from LS to striatum, from there to the substantia nigra, and from nigral neurons to the deep layers of the ipsilateral superior colliculus (for references, see McHaffie et al., 1993a). The corticostriatal projection from LS neurons is believed to constitute the most robust excitatory visual input into the striatum (Kolomiets, 1986). It terminates preferentially within the matrix of the caudate nucleus (McHaffie et al., 1993b), from which GABAergic projections to the substantia nigra originate (Oertel et al., 1981). When active, striatonigral neurons powerfully inhibit nigral neurons that contact output neurons (i.e., tectospinal) of the superior colliculus (Chevalier et al., 1981, 1984). Because tectospinal neurons normally are held in check by tonic nigrotectal inhibition, the phasic activation of striatal neurons by LS afferents ultimately releases tectospinal neurons from inhibition (for review, see McHaffie et al., 1993a). Consequently, when the integrity of LS is compromised, the ipsilateral superior colliculus loses two complementary influences, the excitation via the direct corticotectal pathway and the disinhibitory influences via the indirect pathway.
Functional integration of direct and indirect corticotectal influences: why are corticotectal and corticostriatal neurons segregated?
Normally, the inputs from these two converging pathways function cooperatively to facilitate attentive and orientation behaviors. Although the specific details of their synergistic relationship remain speculative, the manner in which the basal ganglia regulate the functional circuitry of the superior colliculus, via the indirect pathway, has obvious implications. According to recent concepts of basal ganglia function (Mink, 1996), the striatum itself does not generate voluntary movements. Rather, it acts to inhibit competing motor programs while simultaneously removing inhibition from a select group of neural elements involved in the production of desired movements. Consequently, when a motor program is initiated by cortex, activation of the striatum ultimately disinhibits a population of tectospinal neurons, via striatonigrotectal projections. The increased activity of these superior colliculus output neurons provides information to premotor and motor targets in the brainstem regarding the metrics of the eye and/or head movements. Before an actual movement is initiated, however, corticofugal information from LS, updating the current position, direction, and/or velocity of the target, may be relayed to a topographically appropriate subset of neurons within the disinhibited tectospinal population. Such concordant sensory input would produce an ensemble of differentially active tectospinal neurons with a core of highly active elements and a periphery of less active elements. This sort of population code has been shown to be applicable to superior colliculus-mediated saccadic eye movements (Lee et al., 1988). One advantage of such an organizational scheme is that a corrected movement vector would be derived from visual cortex immediately before the onset of brainstem premotor and motor activity. Although speculative, this concordance of striatal disinhibition and cortical excitation emphasizes the ongoing dynamic processes of neural events leading to sensorimotor transformations and would be particularly advantageous in the accurate localization of moving targets and/or when the organism itself is moving through the environment. It is interesting to note in this regard that the deleterious effects of LS lesions on orientation behaviors are most apparent when the animal must alter a motor program that is either about to be engaged or one that has been running previously (Hardy and Stein, 1988). The postulate of a rapid ongoing update via segregated corticotectal neurons is consistent with recent observations that LS is activated by visual stimuli earlier than, or in synchrony with, primary visual cortex (Katsuyama et al., 1996).
Footnotes
This work was supported by National Institutes of Health, National Institute of Neurological Diseases and Stroke, Grant NS35008
Correspondence should be addressed to Dr. John G. McHaffie, Department of Neurobiology and Anatomy, Bowman Gray School of Medicine, Wake Forest University, Medical Center Boulevard, Winston-Salem, NC 27157-1010.
REFERENCES
- 1.Anderson ME, Yoshida M. Axonal branching patterns and location of nigrothalamic and nigrocolliculuar neurons in the cat. J Neurophysiol. 1980;43:883–895. doi: 10.1152/jn.1980.43.4.883. [DOI] [PubMed] [Google Scholar]
- 2.Baleydier C, Kahungu M, Mauguiere F. A crossed corticotectal projection from the lateral suprasylvian area in the cat. J Comp Neurol. 1983;214:344–351. doi: 10.1002/cne.902140311. [DOI] [PubMed] [Google Scholar]
- 3.Barlow HB, Blakemore C, Pettigrew JD. The neural mechanism of binocular depth discrimination. J Physiol (Lond) 1967;193:327–342. doi: 10.1113/jphysiol.1967.sp008360. [DOI] [PMC free article] [PubMed] [Google Scholar]
- 4.Battaglini PP, Squatrito S, Galletti C, Maioli MG, Sanseverino ER. Bilateral projections from the visual cortex to the striatum in the cat. Exp Brain Res. 1982;47:28–32. doi: 10.1007/BF00235882. [DOI] [PubMed] [Google Scholar]
- 5.Bauswein E, Fromm C, Preuss A. Corticostriatal cells in comparison with pyramidal tract neurons: contrasting properties in the behaving monkey. Brain Res. 1989;493:198–203. doi: 10.1016/0006-8993(89)91018-4. [DOI] [PubMed] [Google Scholar]
- 6.Berman N, Payne BR. Contralateral corticofugal projections from the lateral suprasylvian and ectosylvian gyri in the cat. Exp Brain Res. 1982;47:234–238. doi: 10.1007/BF00239382. [DOI] [PubMed] [Google Scholar]
- 7.Berson DM. Cat lateral suprasylvian cortex: Y-cell inputs and corticotectal projection. J Neurophysiol. 1985;53:544–556. doi: 10.1152/jn.1985.53.2.544. [DOI] [PubMed] [Google Scholar]
- 8.Bishop PO, Burke W, Davis R. The identification of single units in central visual pathways. J Physiol (Lond) 1962;162:409–431. doi: 10.1113/jphysiol.1962.sp006942. [DOI] [PMC free article] [PubMed] [Google Scholar]
- 9.Blakemore C, Zumbroich TJ. Stimulus selectivity and functional organization in the lateral suprasylvian visual cortex of the cat. J Physiol (Lond) 1987;389:569–603. doi: 10.1113/jphysiol.1987.sp016673. [DOI] [PMC free article] [PubMed] [Google Scholar]
- 10.Burchinskaya LF, Zelenskaya VS, Cherkes VA, Kolomiets BP. Pathways for transmission of visual and auditory information to the cat caudate nucleus. Neirofiziol. 1988;19:385–393. [PubMed] [Google Scholar]
- 11.Camarda R, Rizzolatti G. Visual receptive fields in the lateral suprasylvian area (Clare–Bishop) of the cat. Brain Res. 1976;101:427–443. doi: 10.1016/0006-8993(76)90469-8. [DOI] [PubMed] [Google Scholar]
- 12.Chevalier G, Deniau JM, Thierry AM, Feger J. The nigro-tectal pathway. An electrophysiological reinvestigation in the rat. Brain Res. 1981;213:253–263. doi: 10.1016/0006-8993(81)90232-8. [DOI] [PubMed] [Google Scholar]
- 13.Chevalier G, Vacher S, Deniau JM. Inhibitory nigral influence on tectospinal neurons, a possible implication of basal ganglia in orienting behaviour. Exp Brain Res. 1984;53:320–326. doi: 10.1007/BF00238161. [DOI] [PubMed] [Google Scholar]
- 14.Clare MH, Bishop GH. Responses from an association area secondarily activated from optic cortex. J Neurophysiol. 1954;17:271–277. doi: 10.1152/jn.1954.17.3.271. [DOI] [PubMed] [Google Scholar]
- 15.Dunning DD, Stein BE, McHaffie JG. Effects of cortical and nigral deactivation on visual neurons in cat superior colliculus. Soc Neurosci Abstr. 1990;16:223. [Google Scholar]
- 16.Feeney DM, Wier CS. Sensory neglect after lesions of substantia nigra or lateral hypothalamus: differential severity and recovery of function. Brain Res. 1979;178:329–346. doi: 10.1016/0006-8993(79)90697-8. [DOI] [PubMed] [Google Scholar]
- 17.Feldon S, Feldon P, Kruger L. Topography of the retinal projection upon the superior colliculus of the cat. Vision Res. 1972;10:135–143. doi: 10.1016/0042-6989(70)90111-2. [DOI] [PubMed] [Google Scholar]
- 18.Fuller JH, Schlag JD. Determination of antidromic excitation by the collision test: problems of interpretation. Brain Res. 1976;112:283–298. doi: 10.1016/0006-8993(76)90284-5. [DOI] [PubMed] [Google Scholar]
- 19.Gizzi MS, Katz E, Movshon JA. Orientation selectivity in the cat’s lateral suprasylvian visual cortex. Invest Ophthalmol Vision Sci. 1981;20:149. [Google Scholar]
- 20.Goldberg JM, Brown PB. Response of binaural neurons of dog superior olivary complex to dichotic tonal stimuli: some physiological mechanisms of sound localization. J Neurophysiol. 1969;32:613–636. doi: 10.1152/jn.1969.32.4.613. [DOI] [PubMed] [Google Scholar]
- 21.Grant S, Shipp S. Visuotopic organization of the lateral suprasylvian area and of an adjacent area of the ectosylvian gyrus of cat cortex: a physiological and connectional study. Vis Neurosci. 1991;6:315–338. doi: 10.1017/s0952523800006568. [DOI] [PubMed] [Google Scholar]
- 22.Gybels JM, Meulders M, Callens M, Cole J. Disturbances of visuomotor integration in cats with small lesions of the caudate nucleus. Arch Int Physiol Biochem. 1967;75:283–302. doi: 10.3109/13813456709089577. [DOI] [PubMed] [Google Scholar]
- 23.Hardy SC, Stein BE. Small lateral suprasylvian cortex lesions produce visual neglect and decreased visual activity in the superior colliculus. J Comp Neurol. 1988;273:527–542. doi: 10.1002/cne.902730408. [DOI] [PubMed] [Google Scholar]
- 24.Harting JK, Huerta MF, Hashikawa R, Weber JT, Van Lieshout DP. Neuroanatomical studies of the nigrotectal projection in the cat. J Comp Neurol. 1988;278:615–631. doi: 10.1002/cne.902780412. [DOI] [PubMed] [Google Scholar]
- 25.Heath CJ, Jones EG. The anatomical organization of the suprasylvian gyrus of the cat. Ergeb Anat Entwicklungsgesch. 1971;45:3–64. [PubMed] [Google Scholar]
- 26.Hikosaka O, Wurtz RH. Visual and oculomotor function of monkey substantia nigra pars reticulata. IV. Relation of substantia nigra to superior colliculus. J Neurophysiol. 1983;49:1285–1301. doi: 10.1152/jn.1983.49.5.1285. [DOI] [PubMed] [Google Scholar]
- 27.Hubel DH. Single unit activity in lateral geniculate body and optic tract of unrestrained cats. J Physiol (Lond) 1960;150:91–104. doi: 10.1113/jphysiol.1960.sp006375. [DOI] [PMC free article] [PubMed] [Google Scholar]
- 28.Hubel DH, Wiesel TN. Visual area of the lateral suprasylvian gyrus (Clare–Bishop area) of the cat. J Physiol (Lond) 1969;202:251–260. doi: 10.1113/jphysiol.1969.sp008808. [DOI] [PMC free article] [PubMed] [Google Scholar]
- 29.Huerta MF, Harting JK. The mammalian superior colliculus: studies of its morphology and connections. In: Vanegas H, editor. Comparative neurology of the optic tectum. Plenum; New York: 1984. pp. 687–773. [Google Scholar]
- 30.Karabelas AB, Moschovakis AK. Nigral inhibitory termination of efferent neurons of the superior colliculus: an intracellular horseradish peroxidase study in the cat. J Comp Neurol. 1985;239:309–329. doi: 10.1002/cne.902390305. [DOI] [PubMed] [Google Scholar]
- 31.Katsuyama N, Tsumoto T, Sato H, Fukuda M, Hata Y. Lateral suprasylvian visual cortex is activated earlier than or synchronously with primary visual cortex in the cat. Neurosci Res. 1996;24:431–435. doi: 10.1016/0168-0102(95)01019-x. [DOI] [PubMed] [Google Scholar]
- 32.Kawamura K, Konno T, Chiba M. Cells of origin of corticopontine and corticotectal fibers in the medial and lateral banks of the middle suprasylvian sulcus in the cat. An experimental study with the horseradish peroxidase method. Neurosci Lett. 1978;9:129–135. doi: 10.1016/0304-3940(78)90060-5. [DOI] [PubMed] [Google Scholar]
- 33.Kawamura S, Sprague JM, Niimi K. Corticofugal projections from the visual cortices to the thalamus, pretectum and superior colliculus in the cat. J Comp Neurol. 1974;158:339–362. doi: 10.1002/cne.901580308. [DOI] [PubMed] [Google Scholar]
- 34.Kolomiets BP. Involvement of visual specific and association cortex input in the shaping of neostriatal neuron response to visual stimulation in unanesthetized cats. Neirofiziol. 1986;17:444–450. [Google Scholar]
- 35.Lee C, Rohrer WH, Sparks DL. Population coding of saccadic eye movements by neurons in the superior colliculus. Nature. 1988;332:357–360. doi: 10.1038/332357a0. [DOI] [PubMed] [Google Scholar]
- 36.Levick WR. Another tungsten microelectrode. Med Biol Eng. 1972;10:510–515. doi: 10.1007/BF02474199. [DOI] [PubMed] [Google Scholar]
- 37.Mardia KV. Statistics of directional data. Academic; London: 1972. [Google Scholar]
- 38.Marshall JF, Richardson JS, Teitelbaum P. Nigrostriatal bundle damage and the lateral hypothalamic syndrome. J Comp Physiol Psychol. 1974;87:808–830. doi: 10.1037/h0037223. [DOI] [PubMed] [Google Scholar]
- 39.Marshall WH, Talbot SA, Ades HW. Cortical responses of the anesthetized cat to gross photic and electrical afferent stimulation. J Neurophysiol. 1943;6:1–15. [Google Scholar]
- 40.McHaffie JG, Stein BE. A chronic headholder minimizing facial obstructions. Brain Res Bull. 1983;10:859–860. doi: 10.1016/0361-9230(83)90220-4. [DOI] [PubMed] [Google Scholar]
- 41.McHaffie JG, Norita M, Dunning DD, Stein BE. Corticotectal relationships: direct and “indirect” corticotectal pathways. In: Hicks TP, Molotchinikoff S, Ono T, editors. Progress in brain research–The visually responsive neuron: from basic neurophysiology to behavior. Elsevier; Amsterdam: 1993a. pp. 139–150. [PubMed] [Google Scholar]
- 42.McHaffie JG, Hoshino K, Norita M, Stein BE. Corticostriatal projections from the lateral suprasylvian cortex of the cat demonstrated with biocytin and calbindin immunohistochemistry. Soc Neurosci Abstr. 1993b;19:1434. [Google Scholar]
- 43.Mink JW. The basal ganglia: focused selection and inhibition of competing motor programs. Prog Neurobiol. 1996;50:381–425. doi: 10.1016/s0301-0082(96)00042-1. [DOI] [PubMed] [Google Scholar]
- 44.Niida T, McHaffie JG. The response properties of corticostriatal and corticotectal neurons in the feline lateral suprasylvian cortex. Neurosci Res [Suppl] 1993;18:S180. [Google Scholar]
- 45.Niida T, Stein BE, McHaffie JG. Response properties of corticotectal neurons in the lateral suprasylvian cortex of cat. Soc Neurosci Abstr. 1992;18:1031. doi: 10.1523/JNEUROSCI.17-21-08550.1997. [DOI] [PMC free article] [PubMed] [Google Scholar]
- 46.Norita M, McHaffie JG, Shimizu H, Stein BE. The corticostriatal and corticotectal projections of the feline lateral suprasylvian cortex demonstrated with anterograde biocytin and retrograde fluorescent techniques. Neurosci Res. 1991;10:149–155. doi: 10.1016/0168-0102(91)90037-y. [DOI] [PubMed] [Google Scholar]
- 47.Oertel WH, Schmechel DE, Brownstein MJ, Tappaz ML, Ranson DH, Kopin JJ. Decrease of glutamate decarboxylase (GAD) immunoreactive nerve terminals in the substantia nigra after kainic acid lesion of the striatum. J Histochem Cytochem. 1981;29:977–980. doi: 10.1177/29.8.7024401. [DOI] [PubMed] [Google Scholar]
- 48.Ogasawara K, McHaffie JG, Stein BE. Two corticotectal systems in the cat. J Neurophysiol. 1984;52:1226–1245. doi: 10.1152/jn.1984.52.6.1226. [DOI] [PubMed] [Google Scholar]
- 49.Palmer LA, Rosenquist AC, Tusa RJ. The retinotopic organization of the lateral suprasylvian visual areas in the cat. J Comp Neurol. 1978;177:237–256. doi: 10.1002/cne.901770205. [DOI] [PubMed] [Google Scholar]
- 50.Pasternak T, Albano JE, Harvitt DM. The role of directionally selective neurons in the perception of global motion. J Neurosci. 1990;10:3079–3086. doi: 10.1523/JNEUROSCI.10-09-03079.1990. [DOI] [PMC free article] [PubMed] [Google Scholar]
- 51.Payne BR, Lomber SG, Geeraerts S, Vandergucht E, Vandenbussche E. Reversible visual hemineglect. Proc Natl Acad Sci USA. 1996;93:290–294. doi: 10.1073/pnas.93.1.290. [DOI] [PMC free article] [PubMed] [Google Scholar]
- 52.Rauschecker JP, Harris LR. Auditory compensation of the effects of visual deprivation in the cat’s superior colliculus. Exp Brain Res. 1983;50:69–83. doi: 10.1007/BF00238233. [DOI] [PubMed] [Google Scholar]
- 53.Rauschecker JP, von Grunau MW, Poulin C. Centrifugal organization of directional preferences in the cat’s lateral suprasylvian visual cortex and its relation to flow field processing. J Neurosci. 1987;7:943–958. doi: 10.1523/JNEUROSCI.07-04-00943.1987. [DOI] [PMC free article] [PubMed] [Google Scholar]
- 54.Reeves AG, Hagamen WD. Behavioral and EEG asymmetry following unilateral lesions of the forebrain and midbrain in cats. Electroencephalogr Clin Neurophysiol. 1971;30:83–86. doi: 10.1016/0013-4694(71)90208-2. [DOI] [PubMed] [Google Scholar]
- 55.Rhoades RW, Kuo DC, Polcer JD, Fish SE, Voneida TJ. Indirect visual cortical input to the deep layers of the hamster’s superior colliculus via the basal ganglia. J Comp Neurol. 1982;208:239–254. doi: 10.1002/cne.902080304. [DOI] [PubMed] [Google Scholar]
- 56.Royce G, Laine E. Efferent connections of the caudate nucleus, including cortical projections of the striatum and other basal ganglia: an autoradiographic and horseradish peroxidase investigation in the cat. J Comp Neurol. 1984;226:28–49. doi: 10.1002/cne.902260104. [DOI] [PubMed] [Google Scholar]
- 57.Rudolph KK, Pasternak T. Lesions of cat lateral suprasylvian cortex affect the perception of complex motion. Cereb Cortex. 1996;6:814–822. doi: 10.1093/cercor/6.6.814. [DOI] [PubMed] [Google Scholar]
- 58.Rudolph KK, Ferrera VP, Pasternak T. A reduction in the number of directionally selective neurons extends the spatial limit for global motion perception. Vision Res. 1994;34:3241–3251. doi: 10.1016/0042-6989(94)90063-9. [DOI] [PubMed] [Google Scholar]
- 59.Segal RL, Beckstead RM. The lateral suprasylvian corticotectal projection in cats. J Comp Neurol. 1984;225:259–275. doi: 10.1002/cne.902250210. [DOI] [PubMed] [Google Scholar]
- 60.Sherman SM. Visual fields of cats with cortical and tectal lesions. Science. 1974;185:355–357. doi: 10.1126/science.185.4148.355. [DOI] [PubMed] [Google Scholar]
- 61.Sherman SM, Spear PD. Organization of visual pathways in normal and visually deprived cats. Physiol Rev. 1982;62:738–855. doi: 10.1152/physrev.1982.62.2.738. [DOI] [PubMed] [Google Scholar]
- 62.Smith DC, Spear PD. Effects of superior colliculus removal on receptive field properties of neurons in lateral suprasylvian visual area of the cat. J Neurophysiol. 1979;42:57–75. doi: 10.1152/jn.1979.42.1.57. [DOI] [PubMed] [Google Scholar]
- 63.Spear PD, Baumann TP. Receptive-field characteristics of single neurons in lateral suprasylvian visual area of the cat. J Neurophysiol. 1975;38:1403–1420. doi: 10.1152/jn.1975.38.6.1403. [DOI] [PubMed] [Google Scholar]
- 64.Sprague JM. Interactions of cortex and superior colliculus in mediation of visually guided behavior in the cat. Science. 1966;153:1544–1547. doi: 10.1126/science.153.3743.1544. [DOI] [PubMed] [Google Scholar]
- 65.Stein BE, Arigbede MO. A parametric study of movement detection properties of neurons in the cat’s superior colliculus. Brain Res. 1972;45:437–454. doi: 10.1016/0006-8993(72)90473-8. [DOI] [PubMed] [Google Scholar]
- 66.Stein BE, Meredith MA. Functional organization of the superior colliculus. In: Leventhal AG, editor. The neural basis of visual function. Macmillan; Hampshire, UK: 1991. pp. 85–110. [Google Scholar]
- 67.Sterling P, Wickelgren BG. Visual receptive fields in the superior colliculus of the cat. J Neurophysiol. 1969;32:1–15. doi: 10.1152/jn.1969.32.1.1. [DOI] [PubMed] [Google Scholar]
- 68.Straschill M, Hoffman K-P. Functional aspects of localization in the cat’s optic tectum. Brain Res. 1969;13:274–283. doi: 10.1016/0006-8993(69)90287-x. [DOI] [PubMed] [Google Scholar]
- 69.Tokuno H, Nakamura Y. Organization of the nigrotectospinal pathway in the cat: a light and electron microscopic study. Brain Res. 1987;436:76–84. doi: 10.1016/0006-8993(87)91558-7. [DOI] [PubMed] [Google Scholar]
- 70.Turlejski K. Visual responses of neurons in the Clare–Bishop area of the cat. Acta Neurobiol Exp. 1975;35:189–208. [PubMed] [Google Scholar]
- 71.Updyke BV. Organization of visual corticostriatal projections in the cat, with observations on visual projections to claustrum and amygdala. J Comp Neurol. 1993;327:159–193. doi: 10.1002/cne.903270202. [DOI] [PubMed] [Google Scholar]
- 72.von Grunau MW, Zumbroich TJ, Poulin C. Visual receptive field properties in the posterior suprasylvian cortex of the cat: a comparison between the areas PMLS and PLLS. Vision Res. 1987;27:343–356. doi: 10.1016/0042-6989(87)90083-6. [DOI] [PubMed] [Google Scholar]
- 73.Waxman SG, Bennett MVL. Relative conduction velocities of small myelinated and non-myelinated fibers in the central nervous system. Nature N Biol. 1972;238:217–219. doi: 10.1038/newbio238217a0. [DOI] [PubMed] [Google Scholar]
- 74.Weyand TG, Gafka AC (1997) Corticostriatal and corticotectal cells in area 6 of the cat during fixation and eye movements. Vis Neurosci, in press. [DOI] [PubMed]
- 75.Whitlock DG, Nauta WJH. Subcortical projections from the temporal neocortex in Macaca mulatta. J Comp Neurol. 1956;106:183–212. doi: 10.1002/cne.901060107. [DOI] [PubMed] [Google Scholar]
- 76.Wickelgren BG, Sterling P. Influence of visual cortex on receptive fields in the superior colliculus of the cat. J Neurophysiol. 1969;32:16–32. doi: 10.1152/jn.1969.32.1.16. [DOI] [PubMed] [Google Scholar]
- 77.Williams MN, Faull RLM. The nigrotectal projection and tectospinal neurons in the rat. A light and electron microscopic study demonstrating a monosynaptic nigral input to identified tectospinal neurons. Neuroscience. 1988;25:533–562. doi: 10.1016/0306-4522(88)90257-6. [DOI] [PubMed] [Google Scholar]
- 78.Yin TCT, Greenwood M. Visual response properties of neurons in the middle and lateral suprasylvian cortices of the behaving cat. Exp Brain Res. 1992;88:1–14. doi: 10.1007/BF02259124. [DOI] [PubMed] [Google Scholar]
- 79.Zumbroich TJ, von Grunau M, Poulin C, Blakemore C. Differences of visual field representation in the medial and lateral banks of the suprasylvian cortex (PMLS/PLLS) of the cat. Exp Brain Res. 1986;64:77–93. doi: 10.1007/BF00238203. [DOI] [PubMed] [Google Scholar]