Abstract
There is a growing body of evidence suggesting that patterns of gene expression vary within and between human populations. However, the impact of this variation in human diseases has been poorly explored, in part owing to the lack of a standardized protocol to estimate biogeographical ancestry from gene expression studies. Here we examine several studies that provide new solid evidence indicating that the ancestral background of individuals impacts gene expression patterns. Next, we test a procedure to infer genetic ancestry from RNA-seq data in 25 data sets where information on ethnicity was reported. Genome data of reference continental populations retrieved from The 1000 Genomes Project were used for comparisons. Remarkably, only eight out of 25 data sets passed FastQC default filters. We demonstrate that, for these eight population sets, the ancestral background of donors could be inferred very efficiently, even in data sets including samples with complex patterns of admixture (e.g., American-admixed populations). For most of the gene expression data sets of suboptimal quality, ancestral inference yielded odd patterns. The present study thus brings a cautionary note for gene expression studies highlighting the importance to control for the potential confounding effect of ancestral genetic background.
Keywords: RNA-seq, gene expression, transcriptomics, biogeographical ancestry, SNPs, genomics
INTRODUCTION
There is growing body of evidence indicating that ethnicity can impact gene expression. Human populations show millions of DNA polymorphisms and variable patterns of allele frequencies, and a number of these markers fall at regulatory DNA positions (Spielman et al. 2007), which could ultimately lead to differential gene expression patterns. The study by Spielman et al. (2007) based on the analysis of >4000 genes indicated that genetic variation among populations contributes to differences in gene expression phenotypes; most of the variation observed was due to allele frequency differences at cis-linked regulators. The subsequent study by Price et al. (2008) on “African-American” cell lines, however, indicated that both cis and trans markers have highly significant effects, although they estimated that ∼12% of all heritable variation in human gene expression was due to cis variants. The large-scale study by Stranger et al. (2007) confirmed that gene expression levels are hereditable and indicated an abundance of cis-regulatory variation in the human genome, whereas Storey et al. (2007) estimated that ∼17% of genes are differentially expressed among populations. Most recently, Serrano-Gómez et al. (2017) found five genes modulated by genetic ancestry in breast tumors from Colombian women.
A major hindrance for gene expression studies is that the most of them do not consider ethnicity or ancestral background to be a variable of interest in their analysis. There are only very few attempts at monitoring ancestry in transcriptomic studies; see, for example, Serrano-Gómez et al. (2017) on breast cancer patients and Barral-Arca et al. (2018) in an infectious disease context.
In contrast, procedures to infer biogeographical ancestry (BGA) from DNA data are very popular in human population genetics at continental or regional geographical scale (Galanter et al. 2012; Reich et al. 2012; Lazaridis et al. 2014; Pardo-Seco et al. 2014a. 2016), and in forensic genetics (e.g., investigation of crime scene evidence; Sánchez et al. 2006; Phillips et al. 2009; Pardo-Seco et al. 2014b). Usually, ancestry can be efficiently inferred using dense single nucleotide polymorphism (SNP) data derived from genotyping studies (Reich et al. 2012; Pardo-Seco et al. 2014a, 2016) or massive sequencing studies (Lazaridis et al. 2014; Salas et al. 2017), but also by genotyping panels of ancestry informative markers (AIMs) (Sánchez et al. 2006; Phillips et al. 2009) or a reasonable number of random SNPs uniformly distributed along the genome (Pardo-Seco et al. 2014b).
At the same time, although DNA polymorphisms are generally genotyped/sequenced, there are now bioinformatic procedures that allow inferring DNA variation indirectly from RNA data obtained from large-scale sequencing projects (RNA-seq). This strategy has two main advantages: It is inexpensive, and it can be applied when no DNA data is available (e.g., using RNA data sets retrieved from public repositories). However, these procedures are still uncommon in the field of gene expression studies. This might be due to a variety of factors, including: (i) the very little effort made to date at evaluating the efficiency of these procedures, and/or (ii) the trend to believe that ethnicity does not impact gene expression patterns, despite the existing evidence against this belief. To the best of our knowledge, our recent study, Barral-Arca et al. (2018) constitutes the only one where inferred DNA variation was used to estimate genome ancestry in a gene expression context. This study explored a 2-transcript host cell signature to distinguish viral from bacterial infections (Barral-Arca et al. 2018) in a RNA-seq Mexican data set (see also Herberg et al. 2016).
The aim of the present study is to formally test the preliminary procedures used in Barral-Arca et al. (2018) by way of exploring a broader set of RNA-seq data sets representing worldwide populations. In addition, we show new evidence clearly indicating the impact of ethnicity on modulating gene expression.
RESULTS
Characteristics of the data sets and quality control
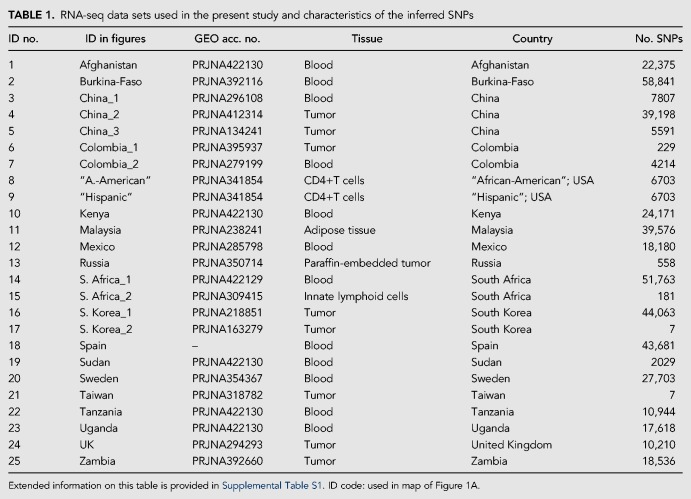
The quality of the gene expression data sets can have an important impact on the inference of SNP variation. Of the 25 data sets initially explored (Fig 1A; see Materials and Methods), only eight (32%) passed the default FastQC quality filters (https://www.bioinformatics.babraham.ac.uk/projects/fastqc/) (Supplemental Fig. S1; see also Conesa et al. 2016), while as many as 17 (68%) did not (Supplemental Fig. S2).
FIGURE 1.
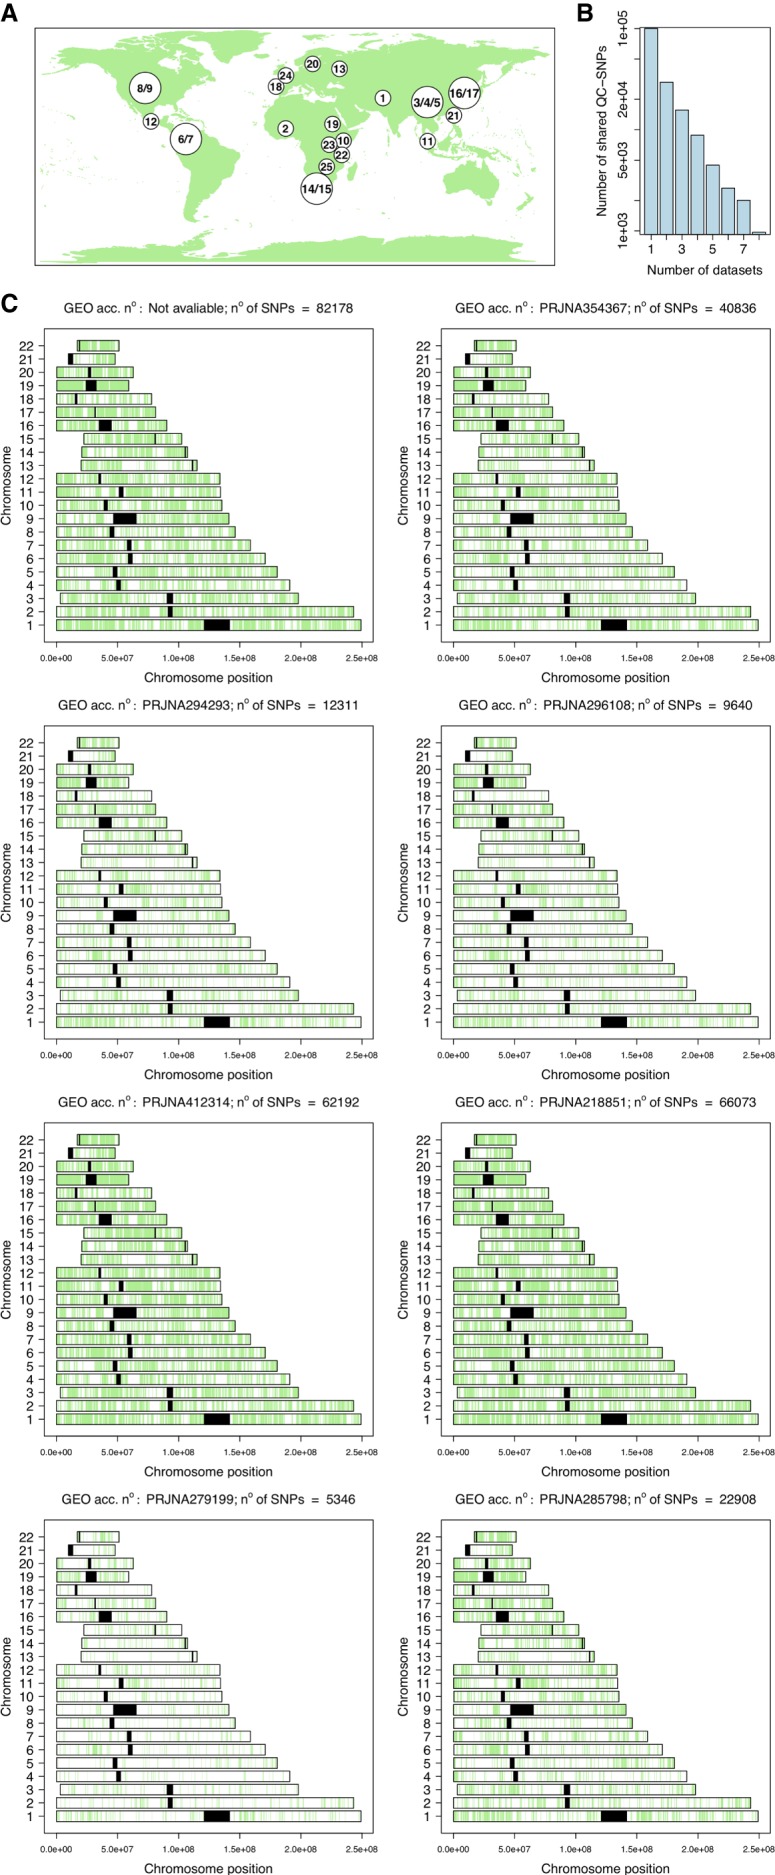
Gene expression data sets explored in the present study for the inference of ancestry. (A) The map shows the geographic location of the 25 RNA-seq data sets that were initially recruited from GEO; the correspondence between these ID codes and the GEO accession numbers, and the characteristics of the data sets are provided in Supplemental Table S1. (B) Only eight out of these 25 data sets passed all the quality filters, and these were used for the subsequent studies. The histogram shows the number of shared SNPs (the final set after applying all the filters) between data sets (see Supplemental Table S1 for more information). (C) Distribution of SNPs in chromosomes for the eight data sets used to infer the ancestry of donors (their GEO ID code is indicated; Supplemental Table S1).
The eight data sets that met all the quality requirements (Supplemental Fig. S1) represent populations from different continental regions and provided a high number of SNPs (>4000 after applying additional genome filters indicated above; Table 1; Supplemental Table S1). The small number of SNPs shared by all of these data sets (Fig. 1B; Supplemental Table S3) makes it inviable to process all the data sets for a common set of SNPs. Therefore, all the analyses were carried out by comparing each of the eight data sets individually against the reference continental populations. Figure 1C shows the distribution of the SNPs in chromosomes in the eight data sets.
TABLE 1.
RNA-seq data sets used in the present study and characteristics of the inferred SNPs
We further explored the data sets that did not satisfy the quality filters with the aim of evaluating the impact of low quality RNA-seq data on ancestry inference. Although the quality of the data was suboptimal for variant calling in 17 data sets, four of them still yielded patterns of ancestry according to expectations (see section below).
Ethnicity correlates with gene expression patterns
In contrast to genomic studies where matched ethnic samples are generally required, e.g., case-control studies (Martinón-Torres et al. 2016; Aung et al. 2017), only a few gene expression studies reported the ethnicity of the donors. For the sake of illustrating the role of the ancestral background in gene expression, we selected two studies on tuberculosis (TB) where ethnicity for individual samples was declared in the GEO database, and where more than one ethnic group was considered in the same study (hence using the same methodology).
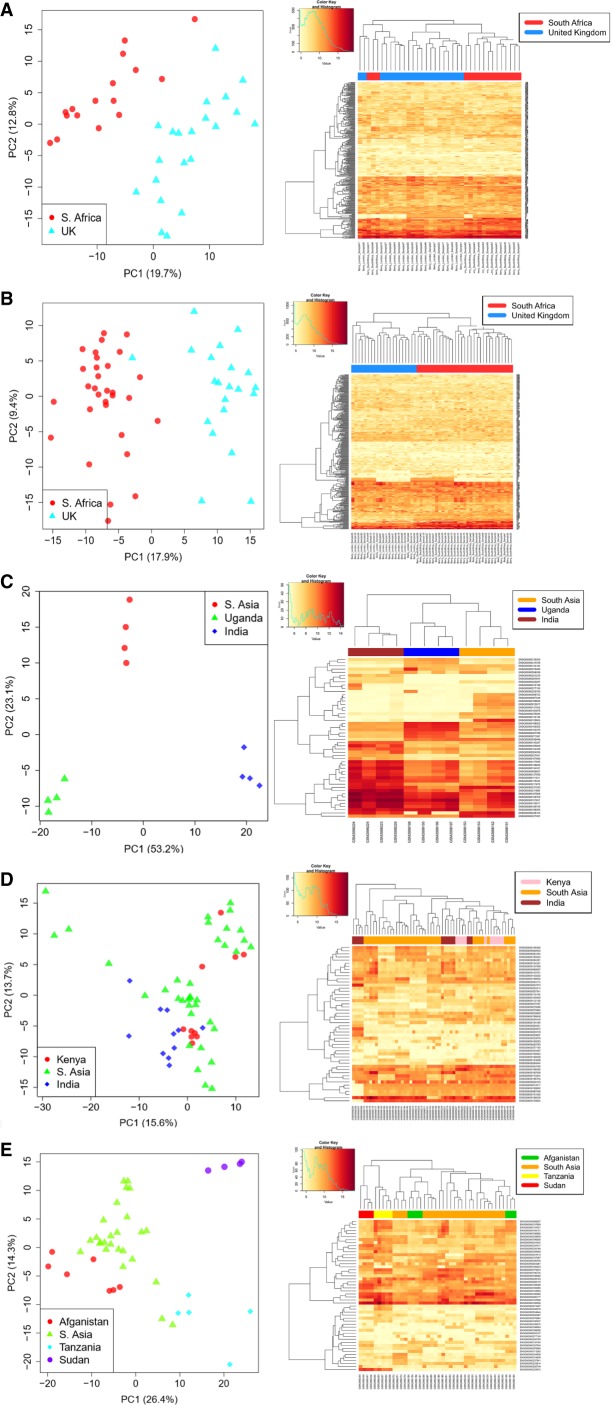
The study by Berry et al. (2010) investigated the immune response of patients infected by Mycobacterium tuberculosis (GEO: PRJNA422129). The MDS plot shows expression patterns of the active TB cohort (Fig. 2A); its Dimension 1 (accounting for ∼20% of the variation) is responsible for the major separation between South African and UK expression patterns, while Dimension 2 (which explains a notable 13% of the variation) separates a few UK cases from the rest. Their latent cohort of TB patients (Fig. 2B) was also ascribed to two well differentiated clusters in its Dimension 1 (accounting for ∼18% of the variation), which again clearly separates their gene expression patterns according to their different geographic origins.
FIGURE 2.
Analysis of gene expression patterns in two case studies where information on ethnicity was available, indicating that ethnicity status per se impacts gene expression patterns. For each study, we show a PCA plot (right) built with the most highly expressed genes between ethnic groups and using the Deseq function “plotPCA,” while the heatmaps were built using a minimum subset of the most highly expressed genes (including all is not possible because of space limitations) that allowed to visualize different patterns between population sets (left): (A) Active TB from Berry et al. (2010), (B) latent TB from Berry et al. (2010), (C) control female group from Singhania et al. (2018), (D) control male group from Singhania et al. (2018), and (E) male TB cases from Singhania et al. (2018).
In their follow-up study on TB infected patients (GEO: PRJNA422130), Singhania et al. (2018), used a similar sampling scheme, with some overlapping of samples with their previous study (Berry et al. 2010). There is a marked substructure of expression patterns in the control female group in the Singhania et al. (2018) study (Fig. 2C), which perfectly allocates the female controls in the vertex of an equilateral triangle according to ethnicity. In control males (Fig. 2D), the expression patterns of South Asians are much more dispersed than in Kenians and Indians. Their male cases included donors from Afghanistan, South Asia, Sudan and Tanzania. Dimension 1 (∼26% of the variance) differentiates these clusters by main continental ancestries; one pole is dominated by the African samples (Sudan and Tanzania), while Asian ones (Afghanistan and South Asia) plot on the opposite (Fig. 2E). Dimension 2 (∼14% of the variation) further distinguishes the two African samples and indicates a higher dispersion for the South Asian donors.
Finally, the effect of ethnicity is not only visible in RNA-seq data. For the sake of illustrating the same issue in expression arrays, we examined the study by Obermoser et al. (2013) in regard to influenza and pneumococcal vaccines. The effect of ethnicity is clear when examining (i) their control females, with a clear differentiation between “African-American” and “Caucasian” in Dimension 2 (∼8%; Supplemental Fig. S3A), (ii) their control males, with a similar pattern (Dimension 2; ∼11%) but this time separating Asians from “Caucasians” (Supplemental Fig. S3B), and (iii) their Pneumovax vaccinated males (Supplemental Fig. S3C) and females (Supplemental Fig. S3D), where Dimension 2 completely separates their “Caucasian” from their Asian donors again.
It is most remarkable that, although ethnicity information is clearly specified in the GEO repository, this information is not used at all, or not even mentioned in the main text of the associated publications.
Functional characteristics of the SNPs inferred from RNA-seq data
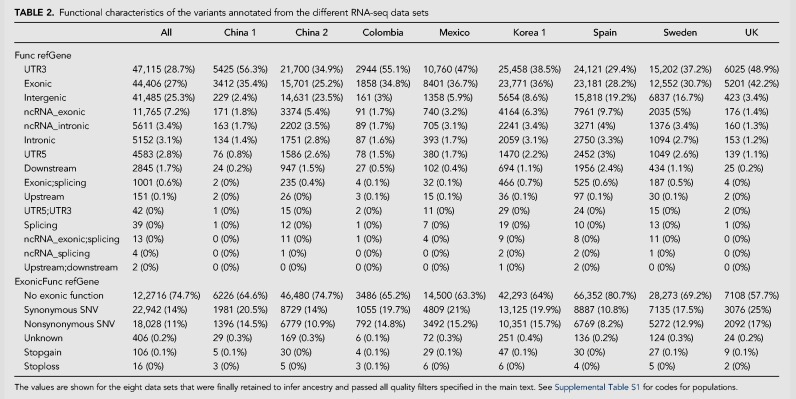
Eight population sets passed through all the quality filters specified above. We examined the functional characteristics of these data sets (Table 2). Since these SNPs were inferred from RNA-seq data, one could expect the main proportion of them to be located at exonic regions. Surprisingly, when considering all the SNPs from all the eight data sets together, 25.3% were intergenic, and only 3.1% fell at intronic regions. Furthermore, a total of 74% of them do not have exonic function. These percentages vary considerably depending on the data set considered (Table 2). To illustrate this phenomenon, we allocate the reads for the eight different studies corresponding to the housekeeping gene CHMO2A (charged multivesicular body protein 2A). Different studies have different coverages outside the exon regions (Supplemental Fig. S4). The same patterns are observed for other genes (data not shown).
TABLE 2.
Functional characteristics of the variants annotated from the different RNA-seq data sets
Inference of ancestry from RNA-seq data
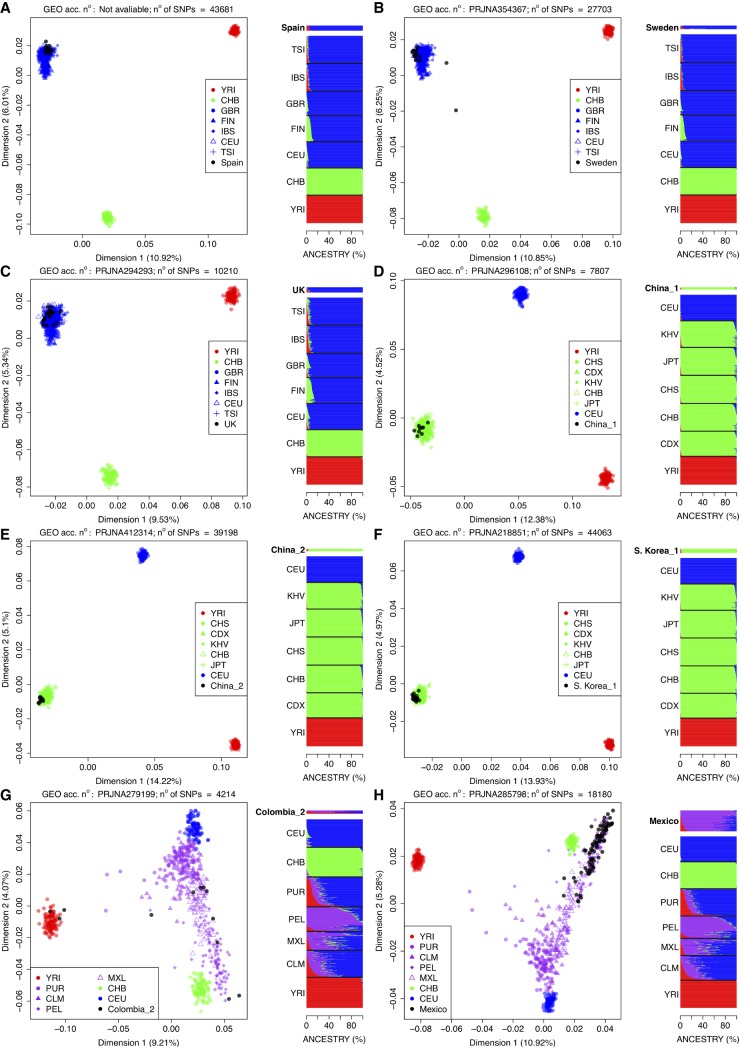
Figure 3 shows MDS plots and ancestry analysis for the eight populations that passed through all the quality filters specified above. Three European ancestry population sets, namely Spain (Salas et al. 2016), Sweden (GEO: PRJNA354367; Shchetynsky et al. 2017), and UK (GEO: PRJNA294293; Wood et al. 2016), are represented in Figure 3A–C. The three data sets fall within the cluster defined by the European populations in The 1000 Genomes Project (1000G) reference populations. In the case of Sweden, there is one individual that shares a visible proportion of ancestry membership with the East Asian population.
FIGURE 3.
MDS plots and ancestry analysis for each of the eight data sets that overcome all the quality filters; their GEO ID numbers are indicated on top of each MDS analysis together with the number of SNPs involved in each analysis. In the admixture barplots (right) the label of the test population is bolded and their ancestral memberships barplots slightly separated from the barplots of the reference continental populations (from 1000G). (A) Spain; (B) Sweden (GEO acc. no: PRJNA354367); (C) UK (GEO acc. no: PRJNA294293); (D) China_1 (GEO acc. no: PRJNA296108); (E) China_2 (GEO acc. no: PRJNA412314); (F) Korea_1 (GEO acc. no: PRJNA218851); (G) Colombia_2 (GEO acc. no: PRJNA279199); and (H) Mexico (GEO acc. no: PRJNA285798).
Three additional data sets represent gene expression data of patients from Asia, two of them from China (Fig. 3D–F), and one from Korea (Fig. 3G). In all three cases, the profiles fall within the East Asian clade defined by the reference 1000G populations. The plot built on data set China_1 consists of only 7807 SNPs (GEO: PRJNA296108; Yu et al. 2017); this explains a subtle but visible dispersion of the plots compared to, e.g., China_2 (a plot built on 39,198 SNPs; GEO: PRJNA412314 [Hong et al. 2018]). Korean profiles (GEO: PRJNA218851; Kim et al. 2014) fall also entirely within the Asian cluster.
Two additional data sets represent admixed populations: Colombia (GEO: PRJNA279199; Rojas-Peña et al. 2015) and Mexico (GEO: PRJNA285798; DeBerg et al. 2018). These two sample sets provide the opportunity to calibrate the method for the detection of complex patterns of admixture from gene expression data. From the MDS plot it is clear that the Colombians samples include patient profiles of different ancestries (Fig. 3G). For instance, three individuals have a clear African ancestry, which is not unusual given the impact of the transatlantic slave trade in America (Salas et al. 2004, 2005), and in this country in particular (Salas et al. 2008). The other individuals display a variable admixture contribution from a European and a Native American component (East Asia is used here as a surrogate ancestral population of Native Americans). Again, this pattern of admixture is common in South American populations (Reich et al. 2012). The Mexican data set has a different population admixture pattern (Fig. 3H). Thus, Mexican samples have a main Native American component (much higher than the Mexican sample from 1000G [MXL]), with a minor dispersion (of some of the samples) toward the European pole; this pattern is also expected according to different studies indicating an important Native American background in Mexican genomes with variable admixture with Europeans and minor sub-Saharan African influence (Sandoval et al. 2009).
Figure 4 summarizes the main ancestries observed in these eight data sets. The three European data sets show a main European ancestry, while the four Asian data sets show a predominant Asian ancestry. Conversely, the two American samples show both differential proportions of ancestry in agreement with their different patterns of admixture.
FIGURE 4.
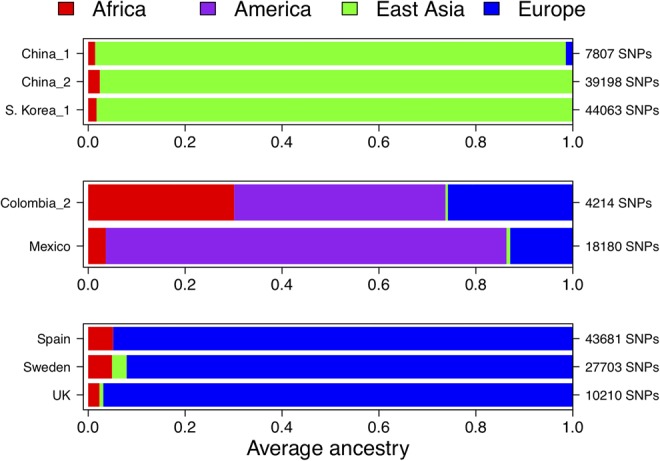
Summary of ancestral memberships for the eight data sets explored in the present study.
Four data sets did not pass the quality filters, but the patterns of ancestry could also be inferred (Supplemental Fig. S5). The Russian sample set (GEO: PRJNA350714; Supplemental Fig. S5A; Nikitina et al. 2017) only yielded 558 SNPs but still all the samples fall within the European cluster; the fact that this MDS plot is built on a few hundred SNPs explains the global scattering of the data points on the plot compared to other plots (e.g., in Fig. 3). Supplemental Figure S5B indicates patterns of ancestry for “Hispanic” and “African-American” data sets (GEO: PRJNA341854; Rastogi et al. 2018). Whatever the pseudo-ethnic category “Hispanic” means from the biological point of view (Salas et al. 2007), their patterns of genetic variation fit well with expectations: Most individuals have a three-way continental admixture pattern, with significant membership within the European cluster. On the other hand, some of the “African-American” samples fall within the African reference set, but others have a more variable and complex pattern of ancestry; it is also remarkable that one “African-American” profile falls neatly in the Asian pole of the plot. The South African sample (GEO: PRJNA422129; Supplemental Fig. S5C; Berry et al. 2010) falls entirely within the African cluster. The sample set from China (GEO: PRJNA134241; Huang et al. 2011) also fit completely within the East Asian cluster.
Finally, inferring ancestry from data sets that did not pass all the quality filters can lead to artifacts that are difficult to interpret from a genetic point of view. Supplemental Figure S6 displays all the MDS plots and ancestry barplots for 13 suboptimum data sets. Compared to expected patterns of variation (Fig. 3), these plots lack structure (e.g., Supplemental Fig. S6A,B) or the samples form outlier clusters clearly separated from the three main continental groups (e.g., Supplemental Fig. S6E–G) denoting artificial patterns of variation. Some data sets might represent real variability, as is the case of the samples from Malaysia (Supplemental Fig. S6K) or Afghanistan (Supplemental Fig. S6L), but the fact that the original RNA-seq data sets are in suboptimal conditions calls for caution with these patterns.
In general, it may be argued that these genetic/ancestry analyses themselves could also serve as an additional quality filter per se.
DISCUSSION
We provide new evidence suggesting that ancestral background can impact gene expression patterns. Notably, this evidence stands in contrast with the fact that only a very small number of gene expression studies control for ancestral background information in their experiments; when this information is available, it is not used at all. Thus, there are studies where cases entirely represent a given continental ancestry while their control group was recruited from another continental ancestral background. For instance, in the very recent study by Tian et al. (2017), the authors investigated the immune response of patients infected by dengue virus. Their patients were recruited in Sri Lanka, whereas their controls were sampled in San Diego (USA). The MDS plot in Supplemental Figure S7 indicates that these two groups differentiate clearly in Dimension 2 (23%). The extent to which the differences between cases and controls were due to ethnicity instead of the presence of the pathogen remains to be investigated.
Here we demonstrate that it is possible to infer DNA variation from RNA-seq data, and that this variation can be used to estimate ancestry background of patients. Although the DNA information from samples represents mainly coding region variation (which shows more evolutionary constraints and therefore less variation than noncoding region variants), the procedure performs well with only a few thousand SNPs available or even a few hundred, a finding that is consistent with those advanced by Salas (2019). Moreover, the procedure performs also correctly when analyzing populations with complex patterns of admixture, as is the case of many American populations.
A remarkable finding of the present study is that an important proportion of the investigated RNA-seq data sets shows deficiencies in terms of data quality. Exploring the consequences of this finding within the framework of each individual study is beyond the scope of the present study, but the issue deserves further attention in future investigations. We observed that low quality RNA-seq data produce unusual patterns of ancestry; this therefore led to the conclusion that unusual patterns of genetic variation inferred from RNA-seq data can be used as an additional quality control of the data.
Ancestral background is usually inferred in cases and controls by directly genotyping a set of SNPs (e.g., AIMs). However, here we demonstrate that ancestry can be deduced from RNA-seq data. This has several advantages for future gene expression studies. On the one hand, it avoids the need of obtaining ad hoc samples for DNA genomic analyses from donors (there could be many situations where only a RNA sample can be obtained). On the other hand, once the RNA-seq data have been generated, inferring DNA variation from expression patterns is inexpensive; it only requires the use of a few computational tools already available in the public domain.
MATERIALS AND METHODS
RNA-seq data sets and evaluations of data quality
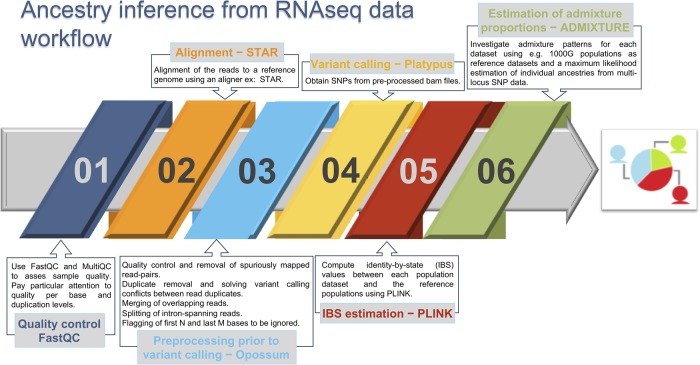
Figure 5 summarizes the process followed in the present study to infer ancestry proportions from RNA-seq data. First, gene expression data were retrieved from the GEO (Gene Accession Omnibus; https://www.ncbi.nlm.nih.gov/geo/) database (Edgar et al. 2002). The vast majority of RNA-seq studies do not record the population background of their samples. We manually searched for RNA-seq data sets that have information on ethnicity or sampling location available and rejected studies that used inaccurate ethnic terminology (e.g., “latin” people) (Salas et al. 2007). Finally, the databases were chosen with the idea to represent all the continents and different tissues. We initially collected data from 25 RNA-seq data sets (corresponding to 20 independent studies) representing populations from different continental regions (Table 1; Fig. 1A; Supplemental Tables S1, S2). Two out of 20 studies (Berry et al. 2010; Singhania et al. 2018) examined expression patterns of groups of individuals from different ethnicities at the same time; therefore, their sampling design allows us to evaluate the impact of ethnicity in gene expression patterns.
FIGURE 5.
Bioinformatic procedure to infer ancestry using RNA-seq data.
For variant calling analyses, it is particularly relevant to initially evaluate the quality of the data. We examined the quality of the RNA-seq data by way of exploring per base sequence quality plots and using FastQC (Brown et al. 2017) and MultiQC (Ewels et al. 2016) software. Quality score plots show the distribution of base quality values for each position in the input sequence.
A medium level of duplication might be unavoidable because some sequences occur more frequently than others. Therefore, to detect transcripts with extremely low expression level, it is necessary to over-sequence the library, which could generate large amounts of the most common sequences such as housekeeping genes. FastQC and MultiQC were used to produce duplication level plots. These plots show for each sample set the fraction of reads observed at different duplication levels. This procedure allows the identification of fragments of adapters remaining on the reads, contamination, or any kind of enrichment bias (due to, e.g., PCR over amplification). The software raises a warning (orange line) if duplicated sequences constitute more than 20% of the total library and it will report an error (red line) if they represent more than 50% of the total (Supplemental Figs. S1 and S2).
RNA-seq reads prior to variant calling were processed using Opossum (Oikkonen and Lise 2017). Although the Opossum software deals with duplicate sequences, we have empirically observed that when the duplication level is too high (>50% of the total), it yields weak results in terms of the SNPs inferred. This could be caused by: (i) Removal of duplicates from the library may lead to an extremely poor library, hence the SNPs inferred are very few, biased and not evenly distributed across the genome, and/or (ii) overamplification of the library increases the chances of PCR errors and artifacts.
Annotating DNA variation from RNA-seq data sets and statistical treatment of SNP data
Variants were inferred from the processed RNA-seq data using the variant caller software Platypus (Rimmer et al. 2014). The number of annotated markers inferred from the different data sets varies from a few hundred (PRJNA318782; Supplemental Table S1) to more than 4000K variants (PRJNA163279).
SNPs without rs code, low genotyping rate (below 10%), and in LD (r2 > 0.75) were removed from the analysis. Eliminating LD allows us to mitigate the effect of ascertainment bias which could be particularly important in genome data inferred from gene expression patterns.
SNP data from continental reference populations were retrieved from 1000G (http://www.internationalgenome.org). Reference genome data from 1000G were processed as per previous studies (Pardo-Seco et al. 2014a, 2016). Subsequently, each SNP population data set was individually intersected with SNP data from the 1000G reference populations.
Next, we computed identity-by-state (IBS) values between each population data set and the reference populations using the software PLINK (Purcell et al. 2007). Multidimensional scaling (MDS) analysis using this matrix of IBS values was used to represent the clustering gene expression patterns and geographical affinities between the test data and the reference continental populations. MDS plots were built using the function cmdscale (library stats) from R (http://www.r-project.org).
We additionally investigated admixture patterns for each data set using populations in 1000G as reference data sets representing main continental regions. Admixture proportions were obtained by using a maximum likelihood estimation of individual ancestries from multilocus SNP data and using the ADMIXTURE software (Alexander et al. 2009), and fixing the number of predefined clusters (K) to the number of continental regions considered for each analysis.
SUPPLEMENTAL MATERIAL
Supplemental material is available for this article.
Supplementary Material
ACKNOWLEDGMENTS
A.S. received support from the Instituto de Salud Carlos III (Proyecto de Investigación en Salud, Acción Estratégica en Salud: project GePEM ISCIII/PI16/01478/Cofinanciado FEDER). F.M.T. received support from project ReSVinext ISCIII/PI16/01569/Cofinanciado FEDER; Consellería de Sanidade, Xunta de Galicia (RHI07/2-intensificación actividad investigadora, PS09749 and 10PXIB918184PR), Instituto de Salud Carlos III (Intensificación de la actividad investigadora 2007–2012, PI16/01569), Fondo de Investigación Sanitaria (FIS; PI070069/PI1000540) del plan nacional de I + D + I and “fondos FEDER.” A.S. and F.M.T. received support from 2016-PG071 Consolidación e Estructuración REDES 2016GI-1344 G3VIP (Grupo Gallego de Genética Vacunas Infecciones y Pediatría, ED341D R2016/021). We would also like to acknowledge CESGA (Supercomputing Centre of Galicia, Santiago de Compostela, Spain) for the availability of supercomputing resources, web hosting, and support.
Footnotes
Article is online at http://www.rnajournal.org/cgi/doi/10.1261/rna.070052.118.
REFERENCES
- Alexander DH, Novembre J, Lange K. 2009. Fast model-based estimation of ancestry in unrelated individuals. Genome Res 19: 1655–1664. 10.1101/gr.094052.109 [DOI] [PMC free article] [PubMed] [Google Scholar]
- Aung T, Ozaki M, Lee MC, Schlötzer-Schrehardt U, Thorleifsson G, Mizoguchi T, Igo RP Jr, Haripriya A, Williams SE, Astakhov YS, et al. 2017. Genetic association study of exfoliation syndrome identifies a protective rare variant at LOXL1 and five new susceptibility loci. Nat Genet 49: 993–1004. 10.1038/ng.3875 [DOI] [PMC free article] [PubMed] [Google Scholar]
- Barral-Arca R, Pardo-Seco J, Martinón-Torres F, Salas A. 2018. A 2-transcript host cell signature distinguishes viral from bacterial diarrhea and it is influenced by the severity of symptoms. Sci Rep 8: 8043 10.1038/s41598-018-26239-1 [DOI] [PMC free article] [PubMed] [Google Scholar]
- Berry MP, Graham CM, McNab FW, Xu Z, Bloch SA, Oni T, Wilkinson KA, Banchereau R, Skinner J, Wilkinson RJ, et al. 2010. An interferon-inducible neutrophil-driven blood transcriptional signature in human tuberculosis. Nature 466: 973–977. 10.1038/nature09247 [DOI] [PMC free article] [PubMed] [Google Scholar]
- Brown J, Pirrung M, McCue LA. 2017. FQC Dashboard: integrates FastQC results into a web-based, interactive, and extensible FASTQ quality control tool. Bioinformatics 33: 3137–3139. 10.1093/bioinformatics/btx373 [DOI] [PMC free article] [PubMed] [Google Scholar]
- Conesa A, Madrigal P, Tarazona S, Gomez-Cabrero D, Cervera A, McPherson A, Szcześniak MW, Gaffney DJ, Elo LL, Zhang X, et al. 2016. A survey of best practices for RNA-seq data analysis. Genome Biol 17: 13 10.1186/s13059-016-0881-8 [DOI] [PMC free article] [PubMed] [Google Scholar]
- DeBerg HA, Zaidi MB, Altman MC, Khaenam P, Gersuk VH, Campos FD, Perez-Martinez I, Meza-Segura M, Chaussabel D, Banchereau J, et al. 2018. Shared and organism-specific host responses to childhood diarrheal diseases revealed by whole blood transcript profiling. PLoS One 13: e0192082 10.1371/journal.pone.0192082 [DOI] [PMC free article] [PubMed] [Google Scholar]
- Edgar R, Domrachev M, Lash AE. 2002. Gene Expression Omnibus: NCBI gene expression and hybridization array data repository. Nucleic Acids Res 30: 207–210. 10.1093/nar/30.1.207 [DOI] [PMC free article] [PubMed] [Google Scholar]
- Ewels P, Magnusson M, Lundin S, Käller M. 2016. MultiQC: summarize analysis results for multiple tools and samples in a single report. Bioinformatics 32: 3047–3048. 10.1093/bioinformatics/btw354 [DOI] [PMC free article] [PubMed] [Google Scholar]
- Galanter JM, Fernández-López JC, Gignoux CR, Barnholtz-Sloan J, Fernández-Rozadilla C, Via M, Hidalgo-Miranda A, Contreras AV, Figueroa LU, Raska P, et al. 2012. Development of a panel of genome-wide ancestry informative markers to study admixture throughout the Americas. PLoS Genet 8: e1002554 10.1371/journal.pgen.1002554 [DOI] [PMC free article] [PubMed] [Google Scholar]
- Herberg JA, Kaforou M, Wright VJ, Shailes H, Eleftherohorinou H, Hoggart CJ, Cebey-López M, Carter MJ, Janes VA, Gormley S, et al. 2016. Diagnostic test accuracy of a 2-transcript host RNA signature for discriminating bacterial vs viral infection in febrile children. JAMA 316: 835–845. 10.1001/jama.2016.11236 [DOI] [PMC free article] [PubMed] [Google Scholar]
- Hong W, Zhang CZ, Lu SX, Zhang MF, Liu LL, Luo RZ, Yang X, Wang CH, Chen SL, He YF, et al. 2018. A CCDC50 splice variant is modulated by SRSF3 and promotes hepatocellular carcinoma via the Ras signaling pathway. Hepatology 69: 179–195. [DOI] [PubMed] [Google Scholar]
- Huang Q, Lin B, Liu H, Ma X, Mo F, Yu W, Li L, Li H, Tian T, Wu D, et al. 2011. RNA-seq analyses generate comprehensive transcriptomic landscape and reveal complex transcript patterns in hepatocellular carcinoma. PLoS One 6: e26168 10.1371/journal.pone.0026168 [DOI] [PMC free article] [PubMed] [Google Scholar]
- Kim SK, Kim SY, Kim JH, Roh SA, Cho DH, Kim YS, Kim JC. 2014. A nineteen gene-based risk score classifier predicts prognosis of colorectal cancer patients. Mol Oncol 8: 1653–1666. 10.1016/j.molonc.2014.06.016 [DOI] [PMC free article] [PubMed] [Google Scholar]
- Lazaridis I, Patterson N, Mittnik A, Renaud G, Mallick S, Kirsanow K, Sudmant PH, Schraiber JG, Castellano S, Lipson M, et al. 2014. Ancient human genomes suggest three ancestral populations for present-day Europeans. Nature 513: 409–413. 10.1038/nature13673 [DOI] [PMC free article] [PubMed] [Google Scholar]
- Martinón-Torres F, Png E, Khor CC, Davila S, Wright VJ, Sim KS, Vega A, Fachal L, Inwald D, Nadel S, et al. 2016. Natural resistance to meningococcal disease related to CFH loci: meta-analysis of genome-wide association studies. Sci Rep 6: 35842 10.1038/srep35842 [DOI] [PMC free article] [PubMed] [Google Scholar]
- Nikitina AS, Sharova EI, Danilenko SA, Butusova TB, Vasiliev AO, Govorov AV, Prilepskaya EA, Pushkar DY, Kostryukova ES. 2017. Novel RNA biomarkers of prostate cancer revealed by RNA-seq analysis of formalin-fixed samples obtained from Russian patients. Oncotarget 8: 32990–33001. 10.18632/oncotarget.16518 [DOI] [PMC free article] [PubMed] [Google Scholar]
- Obermoser G, Presnell S, Domico K, Xu H, Wang Y, Anguiano E, Thompson-Snipes L, Ranganathan R, Zeitner B, Bjork A, et al. 2013. Systems scale interactive exploration reveals quantitative and qualitative differences in response to influenza and pneumococcal vaccines. Immunity 38: 831–844. 10.1016/j.immuni.2012.12.008 [DOI] [PMC free article] [PubMed] [Google Scholar]
- Oikkonen L, Lise S. 2017. Making the most of RNA-seq: pre-processing sequencing data with Opossum for reliable SNP variant detection. Wellcome Open Res 2: 6 10.12688/wellcomeopenres.10501.1 [DOI] [PMC free article] [PubMed] [Google Scholar]
- Pardo-Seco J, Gómez-Carballa A, Amigo J, Martinón-Torres F, Salas A. 2014a. A genome-wide study of modern-day Tuscans: revisiting Herodotus's theory on the origin of the Etruscans. PLoS One 9: e105920 10.1371/journal.pone.0105920 [DOI] [PMC free article] [PubMed] [Google Scholar]
- Pardo-Seco J, Martinón-Torres F, Salas A. 2014b. Evaluating the accuracy of AIM panels at quantifying genome ancestry. BMC Genomics 15: 543 10.1186/1471-2164-15-543 [DOI] [PMC free article] [PubMed] [Google Scholar]
- Pardo-Seco J, Llull C, Berardi G, Gómez A, Andreatta F, Martinón-Torres F, Toscanini U, Salas A. 2016. Genomic continuity of Argentinean Mennonites. Sci Rep 6: 36392 10.1038/srep36392 [DOI] [PMC free article] [PubMed] [Google Scholar]
- Phillips C, Prieto L, Fondevila M, Salas A, Gómez-Tato A, Álvarez-Dios J, Alonso A, Blanco-Verea A, Brión M, Montesino M, et al. 2009. Ancestry analysis in the 11-M Madrid bomb attack investigation. PLoS One 4: e6583 10.1371/journal.pone.0006583 [DOI] [PMC free article] [PubMed] [Google Scholar]
- Price AL, Patterson N, Hancks DC, Myers S, Reich D, Cheung VG, Spielman RS. 2008. Effects of cis and trans genetic ancestry on gene expression in African Americans. PLoS Genet 4: e1000294 10.1371/journal.pgen.1000294 [DOI] [PMC free article] [PubMed] [Google Scholar]
- Purcell S, Neale B, Todd-Brown K, Thomas L, Ferreira MA, Bender D, Maller J, Sklar P, de Bakker PI, Daly MJ, et al. 2007. PLINK: a tool set for whole-genome association and population-based linkage analyses. Am J Hum Genet 81: 559–575. 10.1086/519795 [DOI] [PMC free article] [PubMed] [Google Scholar]
- Rastogi D, Nico J, Johnston AD, Tobias TAM, Jorge Y, Macian F, Greally JM. 2018. CDC42-related genes are upregulated in helper T cells from obese asthmatic children. J Allergy Clin Immunol 141: 539–548 e537. 10.1016/j.jaci.2017.04.016 [DOI] [PMC free article] [PubMed] [Google Scholar]
- Reich D, Patterson N, Campbell D, Tandon A, Mazieres S, Ray N, Parra MV, Rojas W, Duque C, Mesa N, et al. 2012. Reconstructing Native American population history. Nature 488: 370–374. 10.1038/nature11258 [DOI] [PMC free article] [PubMed] [Google Scholar]
- Rimmer A, Phan H, Mathieson I, Iqbal Z, Twigg SRF, Consortium WGS, Wilkie AOM, McVean G, Lunter G. 2014. Integrating mapping-, assembly- and haplotype-based approaches for calling variants in clinical sequencing applications. Nat Genet 46: 912–918. 10.1038/ng.3036 [DOI] [PMC free article] [PubMed] [Google Scholar]
- Rojas-Peña ML, Vallejo A, Herrera S, Gibson G, Arévalo-Herrera M. 2015. Transcription profiling of malaria-naive and semi-immune Colombian volunteers in a Plasmodium vivax sporozoite challenge. PLoS Negl Trop Dis 9: e0003978 10.1371/journal.pntd.0003978 [DOI] [PMC free article] [PubMed] [Google Scholar]
- Salas A. 2019. The natural selection that shapes our genomes. Forensic Sci Int Genet 39: 57–60. 10.1016/j.fsigen.2018.12.003 [DOI] [PubMed] [Google Scholar]
- Salas A, Richards M, Lareu MV, Scozzari R, Coppa A, Torroni A, Macaulay V, Carracedo Á. 2004. The African diaspora: mitochondrial DNA and the Atlantic slave trade. Am J Hum Genet 74: 454–465. 10.1086/382194 [DOI] [PMC free article] [PubMed] [Google Scholar]
- Salas A, Richards M, Lareu MV, Sobrino B, Silva S, Matamoros M, Macaulay V, Carracedo Á. 2005. Shipwrecks and founder effects: divergent demographic histories reflected in Caribbean mtDNA. Am J Phys Anthropol 128: 855–860. 10.1002/ajpa.20117 [DOI] [PubMed] [Google Scholar]
- Salas A, Bandelt H-J, Macaulay V, Richards MB. 2007. Phylogeographic investigations: the role of trees in forensic genetics. Forensic Sci Int 168: 1–13. 10.1016/j.forsciint.2006.05.037 [DOI] [PubMed] [Google Scholar]
- Salas A, Acosta A, Álvarez-Iglesias V, Cerezo M, Phillips C, Lareu MV, Carracedo Á. 2008. The mtDNA ancestry of admixed Colombian populations. Am J Hum Biol 20: 584–591. 10.1002/ajhb.20783 [DOI] [PubMed] [Google Scholar]
- Salas A, Marco-Puche G, Triviño JC, Gómez-Carballa A, Cebey-López M, Rivero-Calle I, Vilanova-Trillo L, Rodríguez-Tenreiro C, Gómez-Rial J, Martinón-Torres F. 2016. Strong down-regulation of glycophorin genes: a host defense mechanism against rotavirus infection. Infect Genet Evol 44: 403–411. 10.1016/j.meegid.2016.07.044 [DOI] [PubMed] [Google Scholar]
- Salas A, Pardo-Seco J, Cebey-López M, Gómez-Carballa A, Obando-Pacheco P, Rivero-Calle I, Currás-Tuala MJ, Amigo J, Gómez-Rial J, Martinón-Torres F, et al. 2017. Whole exome sequencing reveals new candidate genes in host genomic susceptibility to Respiratory Syncytial Virus Disease. Sci Rep 7: 15888 10.1038/s41598-017-15752-4 [DOI] [PMC free article] [PubMed] [Google Scholar]
- Sánchez JJ, Phillips C, Børsting C, Balogh K, Bogus M, Fondevila M, Harrison CD, Musgrave-Brown E, Salas A, Syndercombe-Court D, et al. 2006. A multiplex assay with 52 single nucleotide polymorphisms for human identification. Electrophoresis 27: 13–24. 10.1002/elps.200500671 [DOI] [PubMed] [Google Scholar]
- Sandoval K, Buentello-Malo L, Peñaloza-Espinosa R, Avelino H, Salas A, Calafell F, Comas D. 2009. Linguistic and maternal genetic diversity are not correlated in Native Mexicans. Hum Genet 126: 521–531. 10.1007/s00439-009-0693-y [DOI] [PMC free article] [PubMed] [Google Scholar]
- Serrano-Gómez SJ, Sanabria-Salas MC, Garay J, Baddoo MC, Hernández-Suárez G, Mejía JC, García O, Miele L, Fejerman L, Zabaleta J. 2017. Ancestry as a potential modifier of gene expression in breast tumors from Colombian women. PLoS One 12: e0183179 10.1371/journal.pone.0183179 [DOI] [PMC free article] [PubMed] [Google Scholar]
- Shchetynsky K, Diaz-Gallo LM, Folkersen L, Hensvold AH, Catrina AI, Berg L, Klareskog L, Padyukov L. 2017. Discovery of new candidate genes for rheumatoid arthritis through integration of genetic association data with expression pathway analysis. Arthritis Res Ther 19: 19 10.1186/s13075-017-1220-5 [DOI] [PMC free article] [PubMed] [Google Scholar]
- Singhania A, Verma R, Graham CM, Lee J, Tran T, Richardson M, Lecine P, Leissner P, Berry MPR, Wilkinson RJ, et al. 2018. A modular transcriptional signature identifies phenotypic heterogeneity of human tuberculosis infection. Nat Commun 9: 2308 10.1038/s41467-018-04579-w [DOI] [PMC free article] [PubMed] [Google Scholar]
- Spielman RS, Bastone LA, Burdick JT, Morley M, Ewens WJ, Cheung VG. 2007. Common genetic variants account for differences in gene expression among ethnic groups. Nat Genet 39: 226–231. 10.1038/ng1955 [DOI] [PMC free article] [PubMed] [Google Scholar]
- Storey JD, Madeoy J, Strout JL, Wurfel M, Ronald J, Akey JM. 2007. Gene-expression variation within and among human populations. Am J Hum Genet 80: 502–509. 10.1086/512017 [DOI] [PMC free article] [PubMed] [Google Scholar]
- Stranger BE, Nica AC, Forrest MS, Dimas A, Bird CP, Beazley C, Ingle CE, Dunning M, Flicek P, Koller D, et al. 2007. Population genomics of human gene expression. Nat Genet 39: 1217–1224. 10.1038/ng2142 [DOI] [PMC free article] [PubMed] [Google Scholar]
- Tian Y, Babor M, Lane J, Schulten V, Patil VS, Seumois G, Rosales SL, Fu Z, Picarda G, Burel J, et al. 2017. Unique phenotypes and clonal expansions of human CD4 effector memory T cells re-expressing CD45RA. Nat Commun 8: 1473 10.1038/s41467-017-01728-5 [DOI] [PMC free article] [PubMed] [Google Scholar]
- Wood O, Woo J, Seumois G, Savelyeva N, McCann KJ, Singh D, Jones T, Peel L, Breen MS, Ward M, et al. 2016. Gene expression analysis of TIL rich HPV-driven head and neck tumors reveals a distinct B-cell signature when compared to HPV independent tumors. Oncotarget 7: 56781–56797. 10.18632/oncotarget.10788 [DOI] [PMC free article] [PubMed] [Google Scholar]
- Yu X, Gu P, Huang Z, Fang X, Jiang Y, Luo Q, Li X, Zhu X, Zhan M, Wang J, et al. 2017. Reduced expression of BMP3 contributes to the development of pulmonary fibrosis and predicts the unfavorable prognosis in IIP patients. Oncotarget 8: 80531–80544. 10.18632/oncotarget.20083 [DOI] [PMC free article] [PubMed] [Google Scholar]
Associated Data
This section collects any data citations, data availability statements, or supplementary materials included in this article.


