

Abstract
Cerebellar granule cells maintained in medium containing serum and 25 mm potassium undergo an apoptotic death within 96 hr when switched to serum-free medium with 5 mm potassium. Because large numbers of apparently homogeneous neurons can be obtained, this represents a potentially useful model of neuronal programmed cell death (PCD). Analysis of the time course and extent of death after removal of either serum or K+ alone demonstrated that a fast-dying (T1/2 = 4 hr) population (20%) responded to serum deprivation, whereas a slow-dying (T1/2 = 25 hr) population (80%) died in response to K+ deprivation. Taking advantage of the complete death after removing both K+ and serum, changes in metabolic events and mRNA levels were analyzed in this model. Glucose uptake, protein synthesis, and RNA synthesis fell to <35% of control by 9 hr after potassium/serum deprivation, a time when 85% of the cells were still viable. The pattern of the fall in these metabolic parameters was similar to that reported for trophic factor-deprived sympathetic neurons. Most mRNAs decreased markedly after K+/serum deprivation. Levels of c-jun mRNA increased fivefold in potassium/serum-deprived granule cells;c-jun is required for cell death of sympathetic neurons. mRNA levels of cyclin D1, c-myb,collagenase, and transin remained relatively constant in potassium/serum-deprived granule cells. These data demonstrate the existence of two populations of granule cells with respect to cell death and define common metabolic and genetic events involved in neuronal PCD.
Keywords: c-jun, protein synthesis, RNA synthesis, glucose uptake, chronic depolarization
Cell death is a widespread event during development (Oppenheim, 1991) that, in the nervous system, matches the size of neuronal populations with their targets. In vitromodels that recapitulate naturally occurring or programmed cell death (PCD) are essential for studying the molecular mechanisms underlying cell death. The only in vitro model of neuronal PCD, which has been extensively analyzed with respect to metabolic and genetic changes associated with PCD, is trophic factor deprivation of primary cultures of rat sympathetic neurons (Martin et al., 1988; Edwards et al., 1991; Deckwerth and Johnson, 1993; Edwards and Tolkovsky, 1994;Estus et al., 1994; Freeman et al., 1994; Greenlund et al., 1995). Although this system has several advantages (see Discussion), it has one major deficiency: only small numbers of cells (about 20,000) can be obtained per animal.
A potential model of neuronal PCD that does not share this quantity problem is dissociated cerebellar granule cells (20 million granule cells per animal). Dissociated cerebellar granule cells from early postnatal rats can be maintained in serum-containing medium by elevating extracellular potassium levels (25 mm) (Gallo et al., 1987) or adding low concentrations of NMDA to the culture medium (Balazs et al., 1988). Both NMDA and depolarization are presumed to mimic endogenous excitatory activity (Burgoyne et al., 1993). Cerebellar granule cells, in vitro, develop characteristics of mature cerebellar granule cells in vivo, including an extensive neuritic network, expression of excitatory amino acid receptors, and production and release of l-glutamate (Burgoyne et al., 1993). Removal of both potassium and serum from dissociated cerebellar granule cells triggers a cell death that is morphologically apoptotic, accompanied by DNA fragmentation, and dependent on macromolecular synthesis (D’Mello et al., 1993). This apoptotic cell death presumably mimics the naturally occurring death of 20–30% of granule cells (Caddy and Biscoe, 1979), which is important for matching the number of granule cells with Purkinje cells between the third and fifth weeks postnatally (Wetts and Herrup, 1983; Williams and Herrup, 1988).
We have initiated an analysis of PCD in cerebellar granule cells for two major reasons: (1) to determine the variables involved in producing PCD in granule cells, and (2) to determine the pattern of metabolic and genetic changes in granule cells undergoing PCD and to compare these events with those determined previously in sympathetic neurons. Our data show that removal of both K+ and serum is important for triggering PCD in this granule cell model. Furthermore, we have defined two populations of granule cells: one that responds to serum withdrawal and one that responds to K+ withdrawal. Our results provide a temporal analysis of changes in protein synthesis, RNA synthesis, glucose uptake, and mRNA levels of cell death-associated genes after K+/serum deprivation. A comparison of this CNS model to sympathetic neurons elucidates changes during neuronal PCD that may be part of a common death program.
Parts of this work have been reported in abstract form (Miller and Johnson, 1995).
MATERIALS AND METHODS
Sprague Dawley rats were obtained from Harlan (Indianapolis, IN). Four different media were used: K25 + S [Basal Medium Eagle (Life Technologies, Grand Island, NY) containing 10% dialyzed fetal bovine serum (Sigma, St. Louis, MO, 10,000 molecular weight cutoff), 25 mm KCl, 100 U/ml penicillin, and 100 μg/ml streptomycin]; K5 + S (Basal Medium Eagle containing 10% dialyzed fetal bovine serum, 5 mm KCl, 100 U/ml penicillin, and 100 μg/ml streptomycin); K25 − S (Basal Medium Eagle containing no serum, 25 mm KCl, 100 U/ml penicillin, and 100 μg/ml streptomycin); and K5 − S (Basal Medium Eagle containing no serum, 5 mm KCl, 100 U/ml penicillin, and 100 μg/ml streptomycin).
Cell culture. This cell culture protocol is a modification of that of Levi et al. (1984). Cerebella from two or three postnatal day 7 (P7) Sprague Dawley rats were dissected and placed in L-15 medium (Life Technologies). Meningeal layers and blood vessels were removed. The cerebella were sliced into pieces ∼1 mm2 in size, transferred to HBSS containing 0.30 mg/ml trypsin (Worthington Biochemical, Freehold, NJ) and incubated at 37°C for 15 min. The tissue was then washed once with K25 + S medium (5 ml) supplemented with 0.5 mg/ml trypsin inhibitor (Sigma) and then triturated 10 to 15 times in 5 ml of K25 + S medium with 0.5 mg/ml trypsin inhibitor by using a flame-polished Pasteur pipette. The remaining pieces were allowed to settle, and the supernatant containing dissociated cells was transferred to a fresh tube. The settled tissue was then processed two more times in the same manner, yielding a total of 15 ml containing dissociated cells. This resulting cell suspension was centrifuged at 500 × g for 6 min. The supernatant was removed, and 2 ml per cerebellum of fresh K25 + S medium was added to the pellet, which was then gently triturated. The cell suspension was filtered through a Nitex filter (size 3–20/14, Tetko, Elmsford, NY). The number of cells in a 1:10 dilution of the cell suspension was determined by trypan blue exclusion. Live cells (n = 400,000, 2.3 × 10⁵ cells/cm2) were plated in 0.5 ml of K25 + S medium in four-well dishes (Nunc). Before plating, dishes were coated with 0.1 mg/ml poly-l-lysine (Sigma, P2636) for 12–24 hr, washed three times with sterile water, and dried before use. The granule cells were kept at 35°C in a humidified incubator with 5% CO2/95% air for 1 week.
To reduce the number of non-neuronal cells, aphidicolin (3.3 μg/ml, Sigma) was added to the medium 24 hr after plating. At 7 din vitro, the number of non-neuronal cells was assessed after staining cultures with 1 μg/ml Hoechst 33258 (Molecular Probes, Eugene OR) to visualize nuclei and an antibody to glial fibrillary acidic protein (GFAP) (Incstar, Stillwater, MN) to identify astrocytes. The number of non-neuronal cells was 1–2% as determined by counting cells positive for GFAP. Therefore, the cultures were 98–99% pure granule cells, because the culture conditions do not support the survival of other neuronal cell types (Thangnipon et al., 1983;Kingsbury et al., 1985), and the non-neuronal contamination was 1–2%.
Treatment of cultures and quantification of cell viability.After 7 d in vitro, culture medium was replaced with K5 − S, K5 + S, or K25 − S medium after washing cells twice with the respective medium. Control cultures were treated identically with K25 + S medium. Aphidicolin (3.3 μg/ml) was added to all media. Note that “K+ deprivation” refers to switching the cells from 25 mm K+ (depolarizing conditions) to 5 mm K+ (normal). No granule cells were dividing in the cultures at the start of the experiments or after induction of apoptosis by K+/serum deprivation as assessed by lack of incorporation of 5-bromodeoxyuridine (data not shown).
Cell viability was quantified by taking photomicrographs of representative fields of cells labeled with calcein AM (Molecular Probes). Calcein AM, an acetomethoxy ester fluorescein derivative, is trapped inside living cells because of the nonspecific esterase activity within cells (Bozyczko et al., 1993). Cells were washed once with Locke’s solution containing (in mm): 154 NaCl, 5.6 KCl, 3.6 NaHCO3, 2.7 CaCl2, 1.2 MgCl2, 5.6 d-glucose, 5 HEPES, pH 7.4, and then labeled for 20 min in Locke’s solution containing 5 μmcalcein AM.
For each time point, 2 photomicrographs of representative fields were taken from four different wells for a total of 8 photomicrographs, except for zero-hour control time points for which 16 photomicrographs from eight wells were taken. The number of cells on each coded photomicrograph was counted by a naive observer. Each photomicrograph of control cultures contained ∼400 cells and was taken at 200× on a Nikon Diaphot inverted microscope. For three conditions in one experiment, a second naive observer counted the same photos. In a paired Student’s t test, the correlation coefficients were 0.99, 0.98, and 1.0 between the primary and the secondary observer.
To verify that the fields chosen for counting were representative of the whole culture, several fields were selected randomly and compared with the chosen representative fields. Random fields were selected by placing a grid on the bottom of the dish and selecting grid points based on a computer-generated random number list. Eight photomicrographs were taken for each of four wells for a total of 32 photomicrographs. One-fourth of the area of each of the 32 photomicrographs was counted and compared with the numbers obtained by photographing representative fields. For three different conditions, one control and two with ∼50% cell death, random fields had no significant difference from representative fields as assessed by an unpaired Student’s t test at the 95% confidence limits.
Graphs based on neuronal cell counts represent mean ± SEM from three independent experiments. Intraexperimental SDs were between 7 and 14% of measured value.
To determine whether the viability curve represented the summation of two individual populations of cells, the data were fit to the following equation by using the Marquardt-Levenberg algorithm: v= ae−k1(t−dt) + (100 −a)e−k2(t−dt), where v = viability, a = percentage of cells in population 1, 100 − a = percentage of cells in population 2, k1 = time constant 1,k2 = time constant 2, t = time, anddt = a delay time before cell loss occurs (see Results). Viability was set to 100% when the time was less than delay time. The best fit for a, k1, k2, anddt was determined (see Results).
Metabolic parameters. Assays were linear with respect to time during the indicated measuring period (data not shown). Experiments were performed in four-well dishes (Nunc) with ∼400,000 cells per well. After 7 d in vitro, culture medium was replaced with K5 − S or K25 + S medium (as described above). Data represent the mean ± range from two independent experiments, each based on four separate wells, except for the zero-hour control, which represents eight wells. Intraexperimental SDs for K5 − S-treated cultures were 6–15% for protein synthesis, 5–14% RNA synthesis, and 2–6% for glucose uptake of measured values. Detailed descriptions of the following methods may be found in Deckwerth and Johnson (1993).
Rate of protein synthesis. Neuronal cultures were labeled for 1 hr at 35°C with 10 μCi/mll-[4,5-3H]leucine (159 Ci/mmol, Amersham, Arlington Heights, IL) in K25 + S or K5 − S medium containing 10 μm unlabeled l-leucine. Cultures were lysed, precipitated with 10% trichloroacetic acid (TCA), filtered, and counted in a liquid scintillation counter (Beckman, Fullerton, CA).
Rate of RNA synthesis. Neuronal cultures were labeled for 1 hr at 35°C with 10 μCi/ml [5,6-3H]uridine (44 Ci/mmol, ICN, Costa Mesa, CA) in K25 + S or K5 − S medium. Cultures were lysed, precipitated with 10% TCA and 1% sodium pyrophosphate, filtered, and counted in a liquid scintillation counter.
Rate of 2-deoxyglucose uptake. Neuronal cultures were labeled for 30 min at 35°C with 2.5 μCi/ml [1,2-3H]2-deoxy-d-glucose (30 Ci/mmol, ICN) in K25 + S or K5 − S medium containing 500 μmd-glucose. Cultures were washed three times, lysed, added directly to liquid scintillation fluid, and counted.
Reverse transcription (RT)-PCR. Semiquantitative RT-PCR assays are based on those used for superior cervical ganglion neurons described in Freeman et al. (1994) and Estus et al. (1994) and extensively detailed by Estus (1996). Briefly, granule cells were switched to K5 − S for the indicated times. Polyadenylated RNA was isolated from 400,000 cerebellar granule cells by using an oligo-dT-cellulose mRNA purification kit as directed by the manufacturer (QuickPrep Micro Kit, Pharmacia, Piscataway, NJ). Half of the poly(A) RNA was converted to cDNA by RT with Moloney murine leukemia virus reverse transcriptase with random hexamers (16 μm) as primers. cDNA from ∼4000 cells was used in a 50 μl PCR reaction. After amplification, the PCR products were separated by electrophoresis on 10% polyacrylamide gels, visualized by autoradiography of the dried gels, and quantified with a PhosphorImager (Molecular Dynamics, Sunnyvale, CA). Preliminary experiments with cerebellar granule cell cultures validated that the RT-PCR technique was linear with respect to the amount of input RNA used for RT and with respect to the amount of cDNA used for PCR within the ranges used in these experiments. No product was amplified when purified RNA was used as input for a PCR reaction. Results were repeated in at least two independent RNA preparations. The sequences of the PCR products were confirmed previously by Estus et al. (1994) and Freeman et al. (1994). Primer sequences for cyclophilin, S-100, cyclin A, cyclin D1, cyclin D2, cyclin D3, cdk4, cdk5 and p53 are reported in Freeman et al. (1994). The other primer sequences are as follows:
actin (+2251) 5′-TCC GGA GAC GGG GTC ACC CA-3′
actin (−2329) 5′-GTC CAG ACG CAG GAT GGC AT-3′
nse (+209) 5′-ATC TTG GAC TCC CGT GGG AA-3′
nse (−263) 5′-TTT GGC AGT ATG GAG ATC CA-3′
c-fos (+573) 5′-AAT AAG ATG GCT GCA GCC AA-3′
c-fos (−689) 5′-TTG GCA ATC TCG GTC TGC AA-3′
fosB (+1799) 5′-GAG ATC GCC GAG CTG CAA AA-3′
fosB (−1857) 5′-TTG TGG GCC ACC AGG ACA AA-3′
fra1 (+530) 5′-GCC TTG AGC TGG TGC TGG AA-3′
fra1 (−705) 5′-ATG CAG TGC TTC CGG TTC AA-3′
fra2 (+646) 5′-GTG GGC GCT GTA GTG GTG AA-3′
fra2 (−735)-5′ ATG ACA GAG CGC TGG GCC TT-3′
c-jun (+635) 5′-ACT CAG TTC TTG TGC CCC AA-3′
c-jun (−699) 5′-CGC ACG AAG CCT TCG GCG AA-3′
junB (+396) 5′-GGG AAT TCA AAC CCA CCT TGG CGC TCA A-3′
junB (−449) 5′-GCG GAT CCG GAC CCT TGA GAC CCC GAT A-3′
junD (+313) 5′-GGG AAT TCC GGA TCT TGG TCT GCT CAA-3′
junD (−428) 5′-GGG GAT CCG CCA CCT TCG GGT AGA GGA A-3′
transin (+355) 5′-GGG AAT TCC TTT CCA GGT TCA CCC AA-3′
transin (−515) 5′-GCG GAT CCT TCA GAG ATC CTG GAG AA-3′
collagenase (+521) 5′-GGG AAT TCT GAC ATA ATG ATC TCC TT-3′
collagenase (−713) 5′-GCG GAT CCA AGT TCA TG2 GCA GCA AC-3′
MKP-1 (+695) 5′-GGG AAT TCG CCT ATC ACG CTT CTC GGA A-3′
MKP-1 (−799) 5′-GGG GAT CCT ACT GGT AGT TAC CCT CAA A-3′
RESULTS
Loss of cell viability and K+/serum rescue
To provide the necessary temporal framework for an analysis of metabolic and genetic changes associated with PCD of cerebellar granule cells, we determined the time course of loss of cell viability. The time course of cell death after K+/serum deprivation was determined by switching cultures to K5 − S medium for 6, 9, 12, 18, 24, 36, 48, or 96 hr and then assaying for the number of viable cells. Cell viability was assessed by counting the number of cells on photomicrographs of calcein AM-stained cultures (Fig.1A). Control cultures were maintained in 25 mm potassium with 10% dialyzed serum. Dialyzed serum was used in all experiments, because adding fresh medium containing nondialyzed serum to cerebellar granule cells is toxic. This sensitivity to nondialyzed serum develops after several days in culture and is because of the glutamate in the serum (Schramm et al., 1990). No cell loss occurred in the first 6 hr compared with control cultures maintained in both serum and potassium (Fig. 1A). Between 6 and 24 hr, ∼50% of the cells died. The remainder of the cells died more slowly over the next 72 hr. More than 95% of the cells were dead by 96 hr.
Fig. 1.
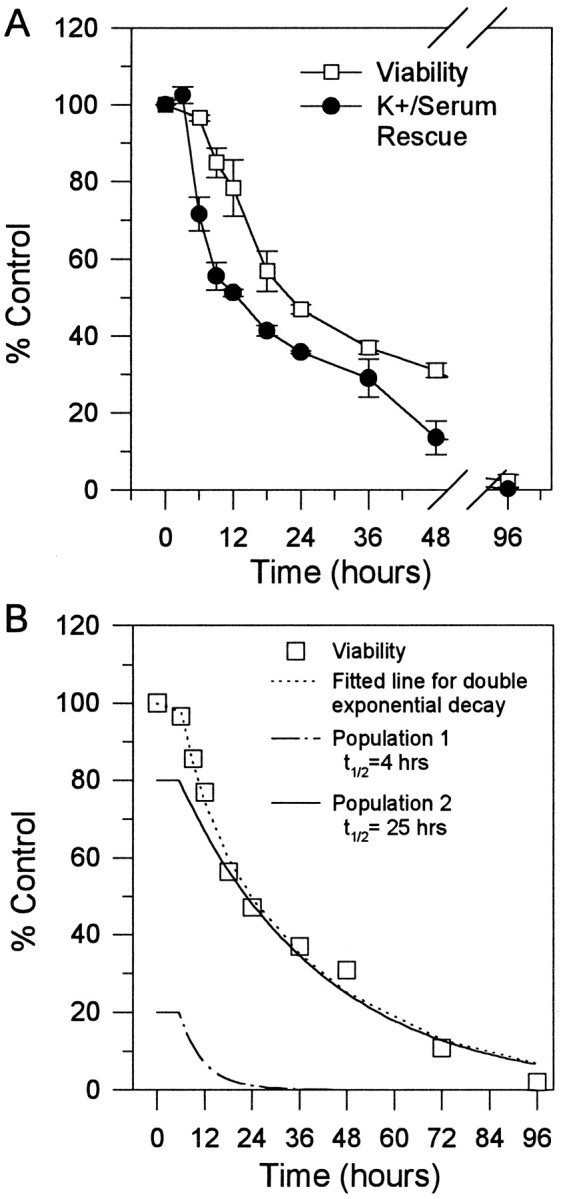
Time course of potassium/serum rescue and loss of viability of cerebellar granule cells. A, The viability curve (open squares) contains counts from cultures switched to K5 − S medium and counted by calcein AM staining after 6, 9, 12, 18, 24, 36, 48, or 96 hr, as described in Materials and Methods. For the time course of K+/serum rescue (filled circles), granule cells were switched to K5 − S medium at t = 0 and then switched back to K25 + S medium (trophic factor rescue) after 3, 6, 9, 12, 18, 24, 36, or 48 hr. At t = 96 hr, viability was assayed by calcein AM staining. Data represent mean ± SEM for three independent experiments for both curves. B, Data for viability were fitted to the equation v =ae−k1(t−dt) + (100 −a)e−k2(t−dt, where v = viability, a = percentage of cells in population one, 100 −a = percentage of cells in population 2,k1 = time constant 1, k2 = time constant 2, t = time, and dt = the delay time before any cell loss occurs;t1/2 = 0.69/time constant,dt = 6 hr. Open squares represent the original data as in A. The dotted line indicates the fitted curve. The solid lineand the dashed line represent the time course of the two theoretically distinct populations of granule cells based on the fitted curve.
The commitment point for PCD for a group of cells is defined as the time when 50% of the cells are irreversibly committed to die by the criterion that they can no longer be rescued by readdition of trophic support, i.e., K+/serum for granule cells. To determine the commitment point for K+/serum withdrawal, cultures were switched to K5 − S medium at zero hour and then switched back to K25 + S medium after 0, 3, 6, 9, 12, 18, 24, 36, or 48 hr. Cell viability was determined (Fig. 1A) after 96 hr. The commitment point was ∼12 hr. The loss of ability to be rescued by K25 + S preceded the loss of viability by ∼6-8 hr.
The data for the loss of cell viability appeared biphasic. The possibility that there are two populations of granule cells is important for interpretation of data produced by this cell death model. Therefore, the data were fit to an equation describing a double first-order exponential decay for two populations of cells with different rates of cell death (see Materials and Methods). The fitted line for the viability data matched closely with the original data (Fig. 1B). The solid line and the dashed line in Figure 1B demonstrate the predicted viability curves for the two populations based on the curve fit. According to the fitted viability data, after an initial 5.6 hr delay, ∼21% of the cells died quickly (t1/2 = 4 hr), whereas the other 79% died more slowly (t1/2 = 25 hr). Note thatt1/2 values apply after the 5.6 hr delay.
Removal of potassium or serum alone identifies two populations of granule cells
Although generally referred to as a K+-deprivation model of neuronal death, the published procedure (D’Mello et al., 1993) involves removal of two potential sources of survival-promoting activity: serum and K+-induced depolarization. To test directly the hypothesis raised by the curve fitting in Figure1B, i.e., that two populations exist, we determined whether the two populations of granule cells could be defined as responding separately to potassium or to serum. Granule cells were switched to medium containing either 25 mm potassium without serum (K25 − S) or 5 mm potassium with serum (K5 + S); viability was determined after 12, 24, 48, 72, or 96 hr (Fig.2A).
Fig. 2.
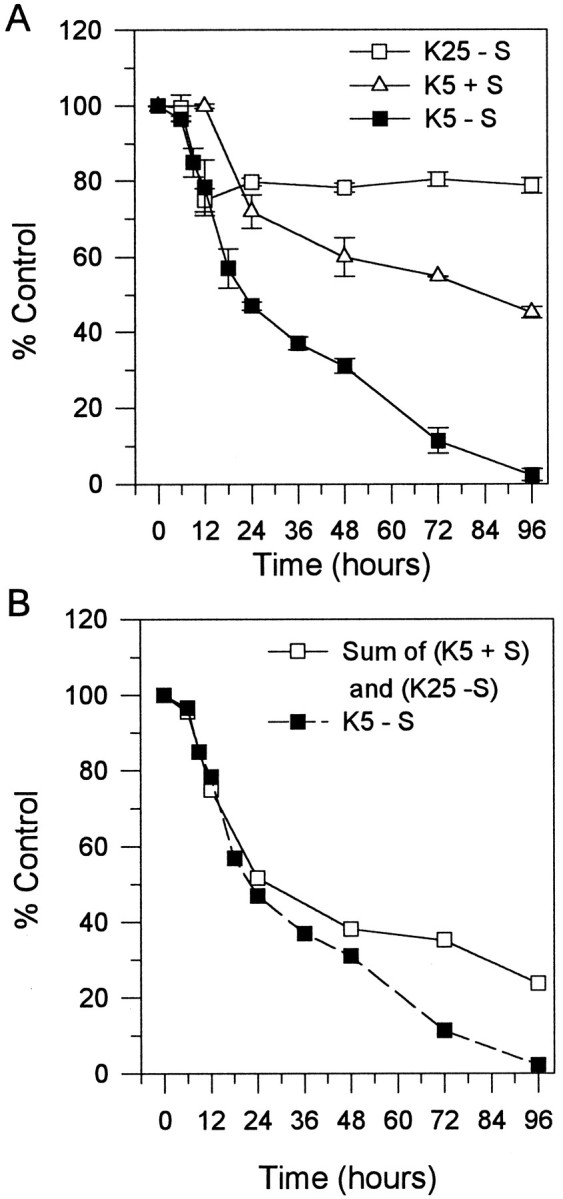
Time course of loss of viability after removal of serum alone or potassium alone. A, Cultures were switched to either K5 + S, or K25 − S medium for 12, 24, 48, 72, or 96 hr and counted by staining with calcein AM, as described in Materials and Methods. Open squares and open triangles represent the time course of loss of viability after switching cultures to K25 − S, K5 + S, respectively.Closed squares represent K5 − S time course, as presented in Figure 1A. Data represent the mean ± SEM of four independent experiments for K25 − S and the mean ± range of two independent experiments for K5 + S.B, Open squares represent the percentage of dead cells from the K5 + S time course summed together with percentage of dead cells from the K25 − S time course at 12, 24, 48, 72, and 96 hr. Closed squares represent K5 − S time course, as presented in Figure 1A.
Surprisingly, removal of serum alone led to the death of ∼20% of the cells within 12 hr and no subsequent loss of cells at 96 hr (Fig.2A). This time course of cell death and percentage of cell loss correspond with the fast-dying population predicted in Figure1B. In contrast, removal of potassium alone resulted in no cell loss for the first 12 hr and then a loss of ∼50% of the cells by 96 hr; this corresponds with the slow-dying population predicted in Figure 1B. Thus, the two populations of cells are defined by their relative sensitivity to removal of either potassium or serum alone. If, indeed, two distinct populations of cells exist, adding the cell loss from the K25 − S time course and the K5 + S time course should equal the total cell loss from removing both serum and potassium (K5 − S) at the same time. Figure2B shows the combination of cell loss from the K25 − S time course plus the K5 + S time course as well as the viability time course from Figure 1A. Indeed, over the first 48 hr, the combination of K25 − S and K5 + S corresponds precisely to the cell loss from removing both serum and potassium (K5 − S). At 72 and 96 hr, removing both serum and potassium (K5 − S) at the same time led to a greater amount of cell death than the sum of removing serum and potassium individually. Apparently, the presence of serum slightly slowed the death induced by removing potassium.
For all subsequent experiments, the K+/serum-deprivation model of cell death was used. This is the model initially characterized as apoptotic by D’Mello and colleagues (1993). Although K+/serum deprivation is complicated by removing two sources of trophic support simultaneously, this model of cerebellar granule cell PCD was adopted, because removing either K+ or serum alone leaves an unacceptably high background of cells that do not die (Fig. 2). Thus, we have analyzed metabolic and genetic changes after K+/serum deprivation.
Metabolic changes during PCD
To assess the metabolic changes during PCD in cerebellar granule cells and to determine to what extent sympathetic neurons and granule cells show similar changes, we determined the rates of protein synthesis, RNA synthesis, and glucose uptake after K+/serum deprivation. Cultures were switched to K5 − S medium for 2, 6, 9, 12, 24, 36, 48, or 96 hr and labeled for the last hr with 10 μCi/mll-[4,5-3H]leucine in K5 − S medium for protein synthesis or with 10 μCi/ml [5,6-3H]uridine in K5 − S medium for RNA synthesis. Control cultures were maintained and labeled in K25 + S medium. After K+/serum deprivation, protein synthesis rates declined quickly to <20% of control by 12 hr and subsequently declined to <5% of control by 96 hr (Fig.3A). RNA synthesis fell more slowly than did protein synthesis in the first 6 hr in the absence of both serum and potassium (K5 − S), then decreased quickly to <20% of control by 12 hr (Fig. 3B). RNA synthesis, similar to protein synthesis rates, declined slowly to <5% of control between 12 and 96 hr in K5 − S medium.
Fig. 3.
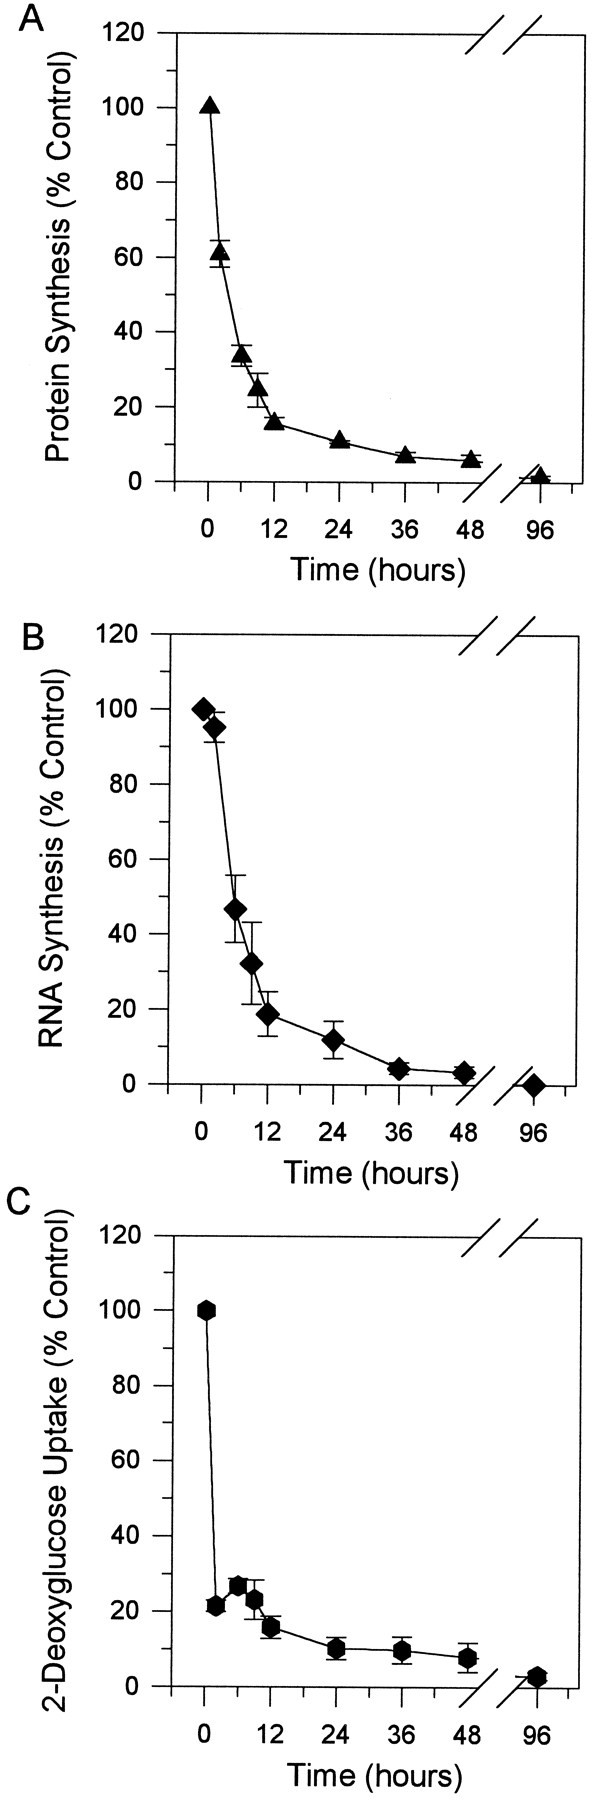
Time courses of metabolic changes during PCD. A, Time course of protein synthesis. Cultures were switched to K5 − S for 2, 6, 9, 12, 24, 36, 48, or 96 hr and labeled for the last hour at 35°C with 10 μCi/mll-[4,5-3H]leucine in K5 − S medium. Cultures were lysed, precipitated with 10% TCA, filtered, and counted in a liquid scintillation counter. B, Time course of RNA synthesis. Cultures were switched to K5 − S medium for 2, 6, 9, 12, 24, 36, 48, or 96 hr and then labeled for the last hour at 35°C with 10 μCi/ml [5,6-3H]uridine in K5 − S medium. Cultures were lysed, precipitated with 10% TCA, filtered, and counted in a liquid scintillation counter. C, Time course of 2-deoxyglucose uptake. Cultures were switched to K5 − S medium for 2, 6, 9, 12, 24, 36, 48, or 96 hr and labeled for the last 30 min at 35°C with 2.5 μCi/ml [1,2-3H]2-deoxy-d-glucose in K5 − S medium. Cultures were washed three times, lysed, added directly to liquid scintillation fluid, and counted. Control cultures were maintained and labeled in K25 + S medium. Data represent the mean ± range of two independent experiments.
Glucose uptake in K+/serum-deprived cerebellar granule cells was assessed by measuring 2-deoxyglucose uptake. Cultures were switched to K5 − S for 2, 6, 9, 12, 24, 48, or 96 hr and labeled for the last 30 min with 2.5 μCi/ml [1,2-3H]2-deoxy-d-glucose in K5 − S medium. Control cultures were maintained and labeled in K25 + S medium. Glucose uptake declined precipitously to <30% of control within the first 2 hr of K+/serum deprivation and slowly declined to <5% of control by 96 hr (Fig. 3C). Therefore, glucose uptake, protein synthesis, and RNA synthesis decreased rapidly after K+/serum deprivation. This dramatic decrease in metabolic parameters occurred before any significant loss of viability (see Fig. 5).
Fig. 5.

Summary of metabolic changes during PCD.A, Cerebellar granule cells in K5 − S medium (summary of Figs. 1, 3). B, Sympathetic neurons deprived of NGF (Deckwerth and Johnson, 1993).
Analysis of gene expression
PCD of many cell types (Freeman et al., 1993) including cerebellar granule cells (D’Mello et al., 1993) is markedly attenuated by inhibitors of macromolecular synthesis, implying that transcription and translation of new gene products are important in macromolecular synthesis-dependent models of PCD. Therefore, strategies that identify genes in which transcription is increased during PCD should help identify those gene products that may influence PCD. A number of genes with induced transcription in other PCD models was analyzed by RT-PCR in cerebellar granule cells deprived of both serum and potassium. At 1, 3, 6, 9, 12, 15, 24, or 36 hr after K+/serum deprivation, mRNA was isolated from cells and reverse transcribed, and the cDNA was probed by PCR. Note that at 36 hr, ∼70% of cells were committed to die (Fig. 1A), so that all genes increased as part of a potential death program would be expected to be expressed well before this time. The results for the K+/serum-deprivation model are presented in Table 1. A representative sample of the gels showing the PCR products and their quantitation by PhosphorImager analysis is presented in Figure 4, A andB, respectively. The level of mRNA for housekeeping genes, such as cyclophilin and actin, decreased rapidly as the cells died. By 12 hr after switching to K5 − S, a time when 80% of the cells are still viable (Fig. 1), mRNA levels for cyclophilin were decreased to ∼30% of control (Fig.4A,B). S-100, a non-neuronal marker (Fano et al., 1995), remained relatively constant.
Table 1.
RT-PCR analysis of mRNA levels during apoptosis in cerebellar granule cells and sympathetic neurons
| Gene | K+/serum-deprived granule cells | NGF-deprived sympathetic neurons |
|---|---|---|
| cyclophilin | ↓ | ↓ |
| nse | ↓ | ↓ |
| actin | ↓ | ↓ |
| S-100 | ↔ | ↔ |
| c-jun | ↑ | ↑ |
| junB | ↓ | ↑ |
| junD | ↓ | nd |
| fra-1 | ↓ | ↓ |
| fra-2 | ↓ | ↓ |
| c-fos | ↓ | ↑ |
| fosB | ↓ | ↑ |
| myb | ↔ | ↑ |
| cyclin D1 | ↔ | ↑ |
| cyclin D2 | ↓ | ↔ |
| cyclin D3 | ↓ | ↓ |
| cdk4 | ↓ | ↓ |
| cdk5 | ↓ | ↓ |
| p53 | ↓ | ↓ |
| MKP-1 | ↓ | ↑ |
| transin | ↔ | ↑ |
| collagenase | ↔ | ↑ |
See Figure 4 for examples of data used to generate this table. Arrows indicate whether the mRNA levels for a given gene increased, decreased, or remained relatively constant. cyclophilin, neuron-specific enolase (nse), and actin are examples of housekeeping genes. c-jun, junB, junD, fra-1, fra-2, c-fos, and fos B are AP-1 transcription factors (Angel and Karin, 1991). c-myb is a transcriptional regulator that is elevated during late G1 and linked with the G1–S-phase cell cycle transition (Gewirtz et al., 1989). cyclin D1, cyclin D2, cyclin D3, cyclin-dependent kinase 4 (cdk4), and cyclin-dependent kinase 5 (cdk5) are regulators of the cell cycle (Pines, 1995).p53 is a tumor suppressor gene associated with PCD (Freeman et al., 1993). MKP-1 inhibits signal transduction through the mitogen-activated protein kinase pathway (Sun et al., 1993).transin and collagenase are extracellular matrix proteases (Matrisian, 1994). nd, Data were not determined. Data from sympathetic neurons are based on Estus et al., 1994 andFreeman et al., 1994.
Fig. 4.
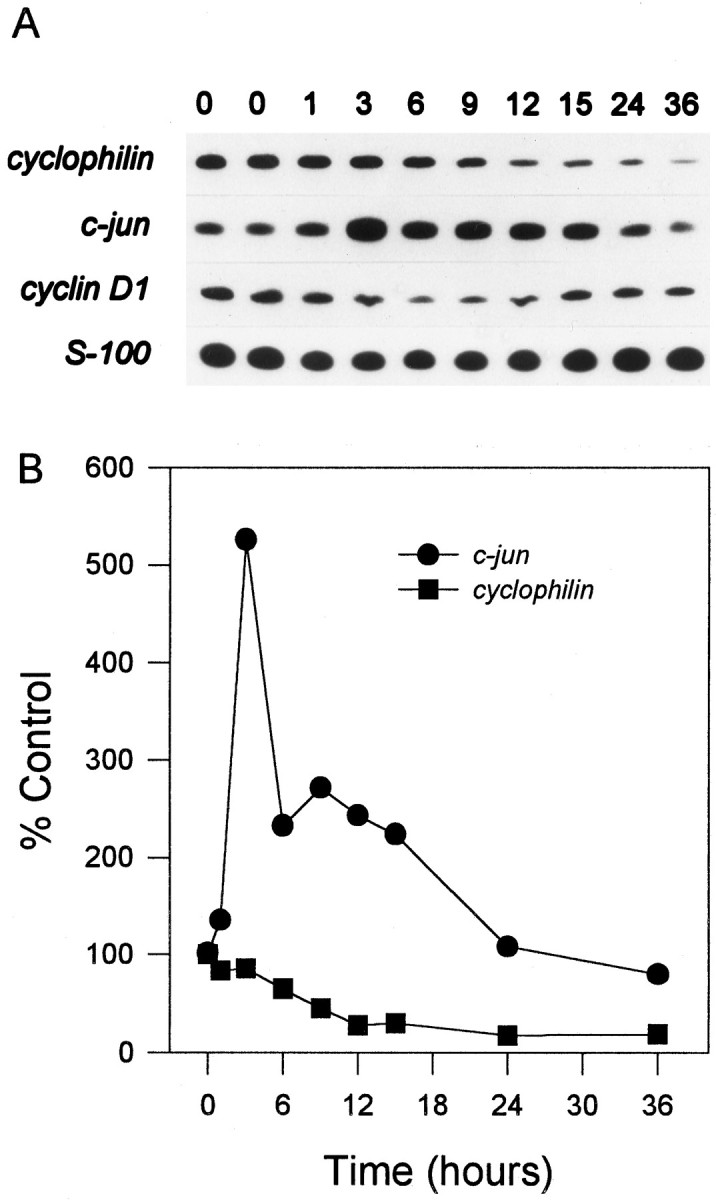
Analysis of mRNA levels in cerebellar granule cells. Cultures were switched to K5 − S, and cDNA was prepared from granule cells after 1, 3, 6, 9, 12, 15, 24, or 36 hr. cDNA from ∼4000 cells was used in a 50 μl PCR reaction, as described in Materials and Methods. Each transcript was analyzed from at least two different neuronal preparations. A, Representative response of cerebellar granule cells in K5 − S medium (comprehensive list in Table 1). cyclophilin was typical of genes that decreased. cyclin D1 decreased slightly and then increased to control levels by 36 hr. c-junincreased approximately fivefold during PCD. S-100, a marker for non-neuronal cells, remained relatively constant. B, Quantitation by PhosphorImager analysis of mRNA levels in cerebellar granule cells in K5 − S medium.
The majority of the mRNAs analyzed in cerebellar granule cells decreased rapidly in a manner similar to cyclophilin after K+/serum deprivation. In contrast, mRNA levels ofc-jun, an AP-1 transcription factor, were increased approximately fivefold by 3 hr after K+/serum deprivation (Fig. 4A,B). myb,transin, and collagenase did not decrease but remained relatively constant or were induced about twofold in cerebellar granule cells. cyclin D1 (Fig.4A) remained relatively constant overall but decreased approximately threefold by 9 hr then increased approximately twofold to near control levels by 36 hr. The complete of list of genes analyzed is shown in Table 1.
DISCUSSION
The following are primary observations made in this study. (1) Primary cerebellar granule cells did not die in a kinetically homogeneous manner but rather died as two distinct populations defined by their relative sensitivity to serum or K+ withdrawal. (2) Metabolic changes associated with PCD in cerebellar granule cells were similar and in the same sequence as those in sympathetic neurons. (3) The pattern of expression of mRNAs in cerebellar granule cells was distinct from sympathetic neurons, but, more important,c-jun was increased in both dying sympathetic neurons and granule cells, and some genes elevated in sympathetic neurons undergoing PCD were maintained or slightly increased in cerebellar granule cells. (4) An apparent generalized degradation of cellular mRNAs occurred before cells became committed to die.
Granule cells died as two populations
We show that the cell loss after removal of serum and potassium in this model of apoptosis was a biphasic response based on kinetic analysis. We defined these two populations as one that dies very quickly in response to removal of serum and the other that dies more slowly in response to removal of potassium. A similar phenomenon of two populations is not observed for sympathetic neurons deprived of NGF (Deckwerth and Johnson, 1993), in which both commitment to death and loss of viability occur in a monophasic manner. An appreciation of these two populations and their different trophic support is essential for understanding this model of granule cell death. Models based on removing either serum or potassium alone are problematic as cell death models, because an unacceptably high background of cells do not die and would complicate any analysis of biochemical or genetic changes associated with the dying cells. Although granule cells and sympathetic neurons differ with respect to the kinetics of cell loss, they are similar regarding the interval between commitment to die and actual death. In both systems and in both populations of granule cells, this interval was ∼6 hr.
Metabolic changes
Taking into account the differences in the time courses of trophic factor (NGF or K+/serum) rescue and loss of viability, sympathetic neurons and granule cells were similar in terms of the decline in protein synthesis, RNA synthesis, and glucose uptake. In both systems, protein synthesis, RNA synthesis, and glucose uptake fall rapidly to ∼20% of control before the commitment point (Fig.5). And in both systems, glucose uptake fell most rapidly, followed by protein synthesis and RNA synthesis. From Figure5, it is clear that the dramatic fall in protein synthesis, RNA synthesis and 2-deoxyglucose uptake did not merely reflect a decrease in cell number, because the fall in metabolic parameters occurred well before any significant loss of viability. The dramatic early decline in these parameters and the similarity in both granule cells and sympathetic neurons imply that these metabolic changes may be part of a common program ultimately leading to PCD.
The mechanisms underlying these dramatic early metabolic changes are unclear. The early decline in protein synthesis was probably not caused by a lack of RNA synthesis, because RNA synthesis fell more slowly than protein synthesis. However, the decline in protein synthesis may have been secondary to a drop in glucose uptake. In the absence of glucose, thymocytes decrease protein synthesis by 75–80% (Mendelsohn et al., 1977). Glucose uptake fell even more quickly than other metabolic parameters. Because glucose is the major high-energy source for neurons (Erecinska and Silver, 1989), this decrease in glucose uptake implies that the cell experiences an altered metabolism after K+/serum withdrawal. The cell may have compensated for the lack of glucose by using enzymes that directly convert ADP to ATP, such as creatine phosphokinase or adenylate kinase, or by using other substrates for energy production, such as glutamine, fatty acids, or internal stores of glycogen. However, these other energy sources would soon be depleted (Erecinska and Silver, 1989). The mechanism that causes the rapid shutdown in glucose uptake is unknown but may involve internalization of glucose transporters similar to removal of insulin from muscle or fat cells (Mueckler, 1994). Additional analysis of what causes these early metabolic changes may elucidate part of the mechanism that commits a cell to PCD. However, whether these metabolic changes were important for cell death is unknown.
Changes in mRNA levels
The transcription of c-jun, an AP-1 transcription factor, was increased in cerebellar granule cells undergoing apoptosis (Fig. 4). The mRNA (Estus et al., 1994) and protein level (Ham et al., 1995) of c-jun increase in sympathetic neurons undergoing apoptosis. c-jun is important for cell death, because microinjection of neutralizing antibodies directed againstc-jun (Estus et al., 1994) or a dominant negativec-jun construct (Ham et al., 1995) protects sympathetic neurons from NGF deprivation-induced cell death. Cerebellar granule cells undergoing PCD in the weaver mutant mouse displayc-jun immunopositivity, implying that c-jun may be part of the in vivo cell death program for granule cells (Gillardon et al., 1995). Our results and those of Gillardon and colleagues suggest that c-jun is an important mediator of PCD in cerebellar granule cells.
The mRNA level of cyclin D1 consistently decreased then increased slightly in K+/serum-deprived granule cells.cyclin D1 may have been transcriptionally downregulated as the cells were deprived of K+ and serum and then upregulated as the cells died. cyclin D1 is induced as sympathetic neurons undergo apoptosis (Freeman et al., 1994). Recent work by Kranenburg and colleagues (1996) suggests that cyclin D1 is required for cell death, because an inhibitor ofcyclin D-dependent kinases will block cell death in a neuroblastoma cell line. Studies using cyclin D1 knockout animals (Sicinski et al., 1995) should provide a rigorous assessment of the importance of cyclin D1 in neuronal PCD.
mRNA levels for c-myb, collagenase, andtransin increase in dying sympathetic neurons. These mRNA levels remained relatively constant as the granule cells underwent cell death. Although not as visually impressive as the induction inc-jun, the fact that some mRNA levels remained relatively constant may, in fact, represent gene induction, because the vast majority of other messages declined rapidly (e.g., cyclophilin, actin, neuron-specific enolase), and >50% of the cells died by 24 hr. Changes in mRNA levels of c-fos in this model may be difficult to interpret, because c-fos transcription is greatly increased by potassium depolarization (Ghosh et al., 1994).
mRNA levels for the majority of genes analyzed in both sympathetic (Estus et al., 1994) neurons and cerebellar granule cells (Table 1) decreased rapidly after the induction of PCD well before most cells had died. For example, by 12 hr after switching to K5 − S, a time when 80% of the cells are still viable (Fig. 1), mRNA levels forcyclophilin decreased to ∼30% of control (Fig.4A,B). This rapid decrease is unlikely to be caused only by decreased global RNA synthesis, because many different mRNA species with presumably differing half-lives all decreased with a similar rapid time course (Table 1) (Estus et al., 1994; Freeman et al., 1994) (data not shown). Decreases in mRNA levels are likely to reflect an active degradative process as has been observed for total RNA in lymphocytes (Cidlowski, 1982) and NGF-deprived sympathetic neurons (J. L. Franklin, personal communication) undergoing PCD. This active global decrease in RNA levels may be a general part of neuronal PCD.
Comparison of models of neuronal PCD
We have summarized several advantages and disadvantages of the cerebellar granule cell and sympathetic neuronal models of PCD (Table 2). Sympathetic neuronal cultures are not complicated by having two populations of cells and die homogeneously in response to removal of a single trophic factor. In addition, for microinjection of antibodies or expression vectors, sympathetic neurons are significantly easier than granule cells, which are extremely difficult because of their small size. On the other hand, granule cells are logistically simpler for experiments involving transgenic mice, because genotyping may be done before preparing neuronal cultures from P7 animals. The most important advantage of the cerebellar granule cell system is the ability to easily obtain large numbers of neurons (20 million per animal) for biochemical analysis and analysis of transgenic animals.
Table 2.
Advantages and disadvantages of sympathetic and granule cell neuronal models of apoptosis
| Advantages | Disadvantages | |
|---|---|---|
| Sympathetic | Die homogeneously | Small numbers of cells |
| neurons | (monophasic) | obtained |
| Large enough for microinjection | Cultures prepared from embryos before | |
| Known trophic factor | genotyping | |
| Can alter one parameter (+/− NGF) | ||
| Granule | Large numbers of cells | Operationally two |
| cells | obtained per animal | populations |
| Cultures prepared from P7 animals after genotyping | Must alter two parameters (K+/serum) for complete death | |
| Too small to easily inject | ||
| Physiologic trophic factor(s) unknown |
This analysis of cerebellar granule cells provides the first demonstration of the previously unappreciated heterogeneity in this cell culture system, a caveat that must be taken into account for understanding results in the cerebellar granule cell system. In addition to providing the needed framework for future studies in granule cells, these data indicate that common metabolic and genetic changes are associated with neuronal PCD in both sympathetic neurons and granule cells. These data provide additional evidence in support of the hypothesis that common events are associated with PCD in both peripheral and central neurons.
Footnotes
This work was supported by National Institutes of Health Grants NS 24679 and AG 12947 and by the Ataxia–Telangiectasia Children’s Project. We thank V. L. Colombo, P. A. Lampe, and P. A. Osborne for expert technical assistance. We thank D. J. Creedon, T. L. Deckwerth, M. Deshmukh, R. M. Easton, and P. A. Osborne for critical evaluations of earlier versions of this manuscript.
Correspondence should be addressed to Dr. Eugene M. Johnson Jr., Washington University School of Medicine, Department of Molecular Biology and Pharmacology, 600 South Euclid Avenue, P.O. Box 8103, St. Louis, MO 63110.
REFERENCES
- 1.Angel P, Karin M. The role of Jun, Fos, and AP-1 complex in cell proliferation and transformation. Biochim Biophys Acta. 1991;1072:129–157. doi: 10.1016/0304-419x(91)90011-9. [DOI] [PubMed] [Google Scholar]
- 2.Balazs R, Jorgensen OS, Hack N. N-methyl-d-aspartate promotes the survival of cerebellar granule cells in culture. Neuroscience. 1988;27:437–451. doi: 10.1016/0306-4522(88)90279-5. [DOI] [PubMed] [Google Scholar]
- 3.Bozyczko CD, McKenna BW, Connors TJ, Neff NT. A rapid fluorometric assay to measure neuronal survival in vitro. J Neurosci Methods. 1993;50:205–216. doi: 10.1016/0165-0270(93)90009-g. [DOI] [PubMed] [Google Scholar]
- 4.Burgoyne RD, Graham ME, Cambray DM. Neurotrophic effects of NMDA receptor activation on developing cerebellar granule cells. J Neurocytol. 1993;22:689–695. doi: 10.1007/BF01181314. [DOI] [PubMed] [Google Scholar]
- 5.Caddy KW, Biscoe TJ. Structural and quantitative studies on the normal C3H and Lurcher mutant mouse. Philos Trans R Soc Lond [Biol] 1979;287:167–201. doi: 10.1098/rstb.1979.0055. [DOI] [PubMed] [Google Scholar]
- 6.Cidlowski JA. Glucocorticoids stimulate ribonucleic acid degradation in isolated rat thymic lymphocytes in vitro. Endocrinology. 1982;111:184–190. doi: 10.1210/endo-111-1-184. [DOI] [PubMed] [Google Scholar]
- 7.Deckwerth TL, Johnson EM., Jr Temporal analysis of events associated with programmed cell death (apoptosis) of sympathetic neurons deprived of nerve growth factor (NGF). J Cell Biol. 1993;123:1207–1222. doi: 10.1083/jcb.123.5.1207. [DOI] [PMC free article] [PubMed] [Google Scholar]
- 8.D’Mello SR, Galli C, Ciotti T, Calissano P. Induction of apoptosis in cerebellar granule neurons by low potassium: inhibition of death by insulin-like growth factor I and cAMP. Proc Natl Acad Sci USA. 1993;90:10989–10993. doi: 10.1073/pnas.90.23.10989. [DOI] [PMC free article] [PubMed] [Google Scholar]
- 9.Edwards SN, Tolkovsky AM. Characterization of apoptosis in cultured rat sympathetic neurons after nerve growth factor withdrawal. J Cell Biol. 1994;124:537–546. doi: 10.1083/jcb.124.4.537. [DOI] [PMC free article] [PubMed] [Google Scholar]
- 10.Edwards SN, Buckmaster AE, Tolkovsky AM. The death programme in cultured sympathetic neurones can be suppressed at the posttranslational level by nerve growth factor, cyclic AMP, and depolarization. J Neurochem. 1991;57:2140–2143. doi: 10.1111/j.1471-4159.1991.tb06434.x. [DOI] [PubMed] [Google Scholar]
- 11.Erecinska M, Silver IA. ATP and brain function. J Cereb Blood Flow Metab. 1989;9:2–19. doi: 10.1038/jcbfm.1989.2. [DOI] [PubMed] [Google Scholar]
- 12. Estus S. Optimization and validation of RT-PCR as a tool to analyze apoptotic gene expression. Poirier J. NeuroMethods 1996. Elsevier; New York: in press. [Google Scholar]
- 13.Estus S, Zaks WJ, Freeman RS, Gruda M, Bravo R, Johnson EM., Jr Altered gene expression in neurons during programmed cell death: identification of c-jun as necessary for neuronal apoptosis. J Cell Biol. 1994;127:1717–1727. doi: 10.1083/jcb.127.6.1717. [DOI] [PMC free article] [PubMed] [Google Scholar]
- 14.Fano G, Biocca S, Fulle S, Mariggio MA, Belia S, Calissano P. The S-100: a protein family in search of a function. Prog Neurobiol. 1995;46:71–82. doi: 10.1016/0301-0082(94)00062-m. [DOI] [PubMed] [Google Scholar]
- 15.Freeman RS, Estus S, Horigome K, Johnson EM., Jr Cell death genes in invertebrates and (maybe) vertebrates. Curr Opin Neurobiol. 1993;3:25–31. doi: 10.1016/0959-4388(93)90031-s. [DOI] [PubMed] [Google Scholar]
- 16.Freeman RS, Estus S, Johnson EM., Jr Analysis of cell cycle-related gene expression in postmitotic neurons: selective induction of cyclin D1 during programmed cell death. Neuron. 1994;12:343–355. doi: 10.1016/0896-6273(94)90276-3. [DOI] [PubMed] [Google Scholar]
- 17.Gallo V, Kingsbury A, Balazs R, Jorgensen OS. The role of depolarization in the survival and differentiation of cerebellar granule cells in culture. J Neurosci. 1987;7:2203–2213. doi: 10.1523/JNEUROSCI.07-07-02203.1987. [DOI] [PMC free article] [PubMed] [Google Scholar]
- 18.Gewirtz AM, Anfossi G, Venturelli D, Valpreda S, Sims R, Calabretta B. G1/S transition in normal human T-lymphocytes requires the nuclear protein encoded by c-myb. Science. 1989;245:180–183. doi: 10.1126/science.2665077. [DOI] [PubMed] [Google Scholar]
- 19.Ghosh A, Ginty DD, Bading H, Greenberg ME. Calcium regulation of gene expression in neuronal cells. J Neurobiol. 1994;25:294–303. doi: 10.1002/neu.480250309. [DOI] [PubMed] [Google Scholar]
- 20.Gillardon F, Baurle J, Grusser-Cornehls U, Zimmermann M. DNA fragmentation and the activation of c-Jun in the cerebellum of mutant mice (weaver, Purkinje cell degeneration). NeuroReport. 1995;6:1766–1768. doi: 10.1097/00001756-199509000-00014. [DOI] [PubMed] [Google Scholar]
- 21.Greenlund LJ, Deckwerth TL, Johnson EJ. Superoxide dismutase delays neuronal apoptosis: a role for reactive oxygen species in programmed neuronal death. Neuron. 1995;14:303–315. doi: 10.1016/0896-6273(95)90287-2. [DOI] [PubMed] [Google Scholar]
- 22.Ham J, Babij C, Whitfield J, Pfarr CM, Lallemand D, Yaniv M, Rubin LL. A c-Jun dominant negative mutant protects sympathetic neurons against programmed cell death. Neuron. 1995;14:927–939. doi: 10.1016/0896-6273(95)90331-3. [DOI] [PubMed] [Google Scholar]
- 23.Kingsbury AE, Gallo V, Woodhams PL, Balazs R. Survival, morphology and adhesion properties of cerebellar interneurones cultured in chemically defined and serum-supplemented medium. Dev Brain Res. 1985;17:17–25. doi: 10.1016/0165-3806(85)90128-2. [DOI] [PubMed] [Google Scholar]
- 24.Kranenburg O, van der Eb AJ, Zantema A. Cyclin D1 is an essential mediator of apoptotic neuronal cell death. EMBO J. 1996;15:46–54. [PMC free article] [PubMed] [Google Scholar]
- 25.Levi G, Aloisi F, Ciotti MT, Gallo V. Autographic localization and depolarization-induced release of acidic amino acids in differentiating cerebellar granule cell cultures. Brain Res. 1984;290:77–86. doi: 10.1016/0006-8993(84)90737-6. [DOI] [PubMed] [Google Scholar]
- 26.Martin DP, Schmidt RE, DiStefano PS, Lowry OH, Carter JG, Johnson EM., Jr Inhibitors of protein synthesis and RNA synthesis prevent neuronal death caused by nerve growth factor deprivation. J Cell Biol. 1988;106:829–844. doi: 10.1083/jcb.106.3.829. [DOI] [PMC free article] [PubMed] [Google Scholar]
- 27.Matrisian LM. Matrix metalloproteinase gene expression. Ann NY Acad Sci. 1994;732:42–50. doi: 10.1111/j.1749-6632.1994.tb24723.x. [DOI] [PubMed] [Google Scholar]
- 28.Mendelsohn SL, Nordeen SK, Young DA. Rapid changes in initiation-limited rates of protein synthesis in rat thymic lymphocytes correlate with energy charge. Biochem Biophys Res Commun. 1977;79:53–60. doi: 10.1016/0006-291x(77)90059-6. [DOI] [PubMed] [Google Scholar]
- 29.Miller TM, Johnson EM., Jr Metabolic and genetic analyses of apoptosis in potassium/serum-deprived cerebellar granule cells. Soc Neurosci Abstr. 1995;21:704. doi: 10.1523/JNEUROSCI.16-23-07487.1996. [DOI] [PMC free article] [PubMed] [Google Scholar]
- 30.Mueckler M. Facilitative glucose transporters. Eur J Biochem. 1994;219:713–725. doi: 10.1111/j.1432-1033.1994.tb18550.x. [DOI] [PubMed] [Google Scholar]
- 31.Oppenheim RW. Cell death during development of the nervous system. Annu Rev Neurosci. 1991;14:453–501. doi: 10.1146/annurev.ne.14.030191.002321. [DOI] [PubMed] [Google Scholar]
- 32.Pines J. Cyclins, CDKs and cancer. Semin Cancer Biol. 1995;6:63–72. doi: 10.1006/scbi.1995.0009. [DOI] [PubMed] [Google Scholar]
- 33.Schramm M, Eimerl S, Costa E. Serum and depolarizing agents cause acute neurotoxicity in cultured cerebellar granule cells: role of the glutamate receptor responsive to N-methyl-d-aspartate. Proc Natl Acad Sci USA. 1990;87:1193–1197. doi: 10.1073/pnas.87.3.1193. [DOI] [PMC free article] [PubMed] [Google Scholar]
- 34.Sicinski P, Donaher JL, Parker SB, Li T, Fazeli A, Gardner H, Haslam SZ, Bronson RT, Elledge SJ, Weinberg RA. Cyclin D1 provides a link between development and oncogenesis in the retina and breast. Cell. 1995;82:621–630. doi: 10.1016/0092-8674(95)90034-9. [DOI] [PubMed] [Google Scholar]
- 35.Sun H, Charles CH, Lau LF, Tonks NK. MKP-1(3CH134), an immediate early gene product, is a dual specificity phosphatase that dephosphorylates MAP kinase in vivo. Cell. 1993;75:487–493. doi: 10.1016/0092-8674(93)90383-2. [DOI] [PubMed] [Google Scholar]
- 36.Thangnipon W, Kingsbury A, Webb M, Balazs R. Observations on rat cerebellar cells in vitro: influence of substratum, potassium concentration and relationship between neurones and astrocytes. Dev Brain Res. 1983;11:177–189. doi: 10.1016/0165-3806(83)90215-8. [DOI] [PubMed] [Google Scholar]
- 37.Wetts R, Herrup K. Direct correlation between Purkinje and granule cell number in the cerebella of lurcher chimeras and wild-type mice. Dev Brain Res. 1983;10:41–47. doi: 10.1016/0165-3806(83)90119-0. [DOI] [PubMed] [Google Scholar]
- 38.Williams RW, Herrup K. The control of neuron number. Annu Rev Neurosci. 1988;11:423–453. doi: 10.1146/annurev.ne.11.030188.002231. [DOI] [PubMed] [Google Scholar]