Abstract
S6 kinase acts as a driver for renal hypertrophy and matrix accumulation, two key pathologic signatures of diabetic nephropathy. As a post-translational modification, S6 kinase undergoes acetylation at the C terminus. The role of this acetylation to regulate kidney glomerular cell hypertrophy and matrix expansion is not known. In mesangial cells, high glucose decreased the acetylation and enhanced phosphorylation of S6 kinase and its substrates rps6 and eEF2 kinase that lead to dephosphorylation of eEF2. To determine the mechanism of S6 kinase deacetylation, we found that trichostatin A, a pan-histone deacetylase (HDAC) inhibitor, blocked all high glucose–induced effects. Furthermore, high glucose increased the expression and association of HDAC1 with S6 kinase. HDAC1 decreased the acetylation of S6 kinase and mimicked the effects of high glucose, resulting in mesangial cell hypertrophy and expression of fibronectin and collagen I (α2). In contrast, siRNA against HDAC1 inhibited these effects by high glucose. A C-terminal acetylation-mimetic mutant of S6 kinase suppressed high glucose–stimulated phosphorylation of S6 kinase, rps6 and eEF2 kinase, and inhibited the dephosphorylation of eEF2. Also, the acetylation mimetic attenuated the mesangial cell hypertrophy and fibronectin and collagen I (α2) expression. Conversely, an S6 kinase acetylation-deficient mutant induced all the above effects of high glucose. Finally, in the renal glomeruli of diabetic rats, the acetylation of S6 kinase was significantly reduced concomitant with increased HDAC1 and S6 kinase activity. In aggregate, our data uncovered a previously unrecognized role of S6 kinase deacetylation in high glucose–induced mesangial cell hypertrophy and matrix protein expression.
Keywords: histone deacetylase 1 (HDAC1), S6 kinase, signal transduction, diabetic nephropathy, extracellular matrix, diabetic renal hypertrophy, matrix expansion, mTORC1
Introduction
Nephropathy, a major microvascular complication of diabetes, is associated with altered hemodynamics with early microalbuminuria followed by macroalbuminuria and finally loss of renal function (1). Hyperglycemia adversely affects multiple renal cell types, including podocytes, endothelial cells, and glomerular mesangial cells in diabetic nephropathy. Although loss of podocytes contributes significantly to diabetic nephropathy, albuminuria regresses in more than 50% of patients (2). Renal hypertrophy occurs very early and is characterized by an increase in cell protein content (3, 4); it occurs in both type 1 and type 2 diabetes (5, 6). Subsequently, mesangial expansion associated with glomerular hypertrophy, thickening of glomerular and tubular basement membranes, and accumulation of matrix proteins such as fibronectin and collagen in the mesangium and interstitium occur and correlate well with the progression of kidney injury (4–9). A mouse model deficient in undergoing mesangial expansion is resistant to renal hypertrophy and matrix protein expression in diabetes (10). These results demonstrate a crucial role of mesangial cells in the development of diabetic nephropathy.
High glucose initiates several interconnected signal transduction pathways including mTOR signaling. mTOR is the catalytic subunit of two evolutionarily conserved distinct complexes, mTORC14 and mTORC2. mTORC1 regulates a wide variety of cell functions, including cell size. For example, dTOR regulates organ size in Drosophila, suggesting its role in cell size control (11). We and others have shown previously that mTORC1 contributes to glomerular hypertrophy, including mesangial cell hypertrophy and matrix protein expansion, two pathologic features of diabetic nephropathy (12–17). mTORC1 phosphorylates two important substrates, 4EBP-1 and S6 kinase. Upon phosphorylation, they contribute to ribosome biogenesis and protein synthesis to increase cell mass (18–20). Additionally, S6 kinase phosphorylates additional substrates that regulate insulin sensitivity, adipocyte differentiation, DNA damage sensing, metabolism, and stress granule formation (21, 22).
Ribosomal protein S6 kinase exists in two forms, S6 kinases 1 and 2, which belong to the AGC kinase family and are encoded by two distinct genes (23). Two isoforms of S6 kinase 1 have been identified that are generated by alternative splicing of the same mRNA. The longer 85-kDa S6 kinase contains an extra 23 amino acids in its N terminus. The p85 S6 kinase 1 has recently been shown to be a secreted metastatic oncoprotein in breast cancer (24). The most extensively studied isoform of ribosomal protein S6 kinase is the p70S6 kinase (S6 kinase), which possesses 502 amino acids. Phosphorylation of S6 kinase at its hydrophobic motif site Thr-389 is necessary for its activation. Although mTORC1 has been identified as the kinase that phosphorylates S6 kinase at this site, mTORC1-independent phosphorylation has been reported (25, 26). In renal cells, including glomerular mesangial cells, we have shown that mTORC1-activated S6 kinase regulates cell hypertrophy and matrix protein expression (15, 27). Along with its activation of phosphorylation by mTORC1, S6 kinase undergoes other post-translational modifications such as ubiquitination and acetylation. Both these modifications are mediated by growth factor signaling and are independent of the phosphorylation of S6 kinase (23, 28, 29). These post-translational modifications of S6 kinase do not affect its kinase activity. However, it is proposed that these modifications may help to recruit the S6 kinase in specific subcellular compartments (23). The goal of this study was to investigate the role of S6 kinase acetylation in response to high glucose in the glomerular mesangial cells. We show that high glucose induces deacetylation of S6 kinase. The histone deacetylase HDAC1 is required for this action and mTORC1-mediated phosphorylation of the kinase. Deacetylation of S6 kinase is necessary for mesangial cell hypertrophy and matrix protein expression. Furthermore, we show in the renal glomeruli of diabetic rats that increased S6 kinase activation is associated with its decreased acetylation and enhanced levels of HDAC1.
Results
High glucose decreases acetylation of S6 kinase
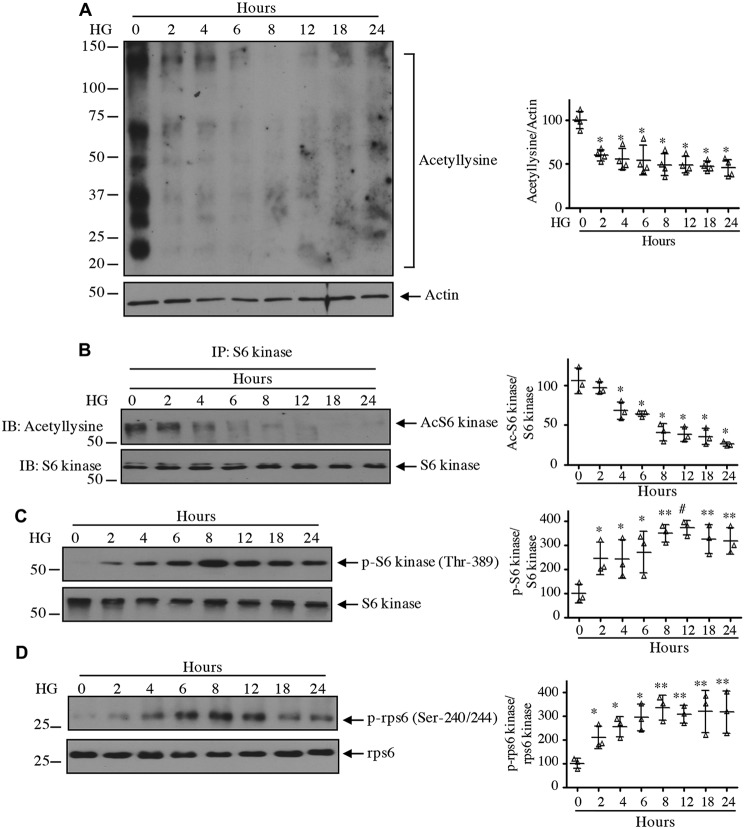
Among other AGC kinases, the C-terminal region of S6 kinase contains an autoinhibitory motif that blocks its activity (21). Downstream of the autoinhibitory site, several lysine residues (Lys-484/485/493) undergo acetylation (23, 29–31). To systematically initiate our study, we examined the acetylation of proteins in mesangial cells in response to 25 mm glucose. High glucose decreased the acetylation of multiple proteins (Fig. 1A). Immunoprecipitation of S6 kinase followed by anti-acetyllysine immunoblotting showed decreased acetylation of this kinase by high glucose (Fig. 1B). Correspondingly, reduced acetylation was associated with increased phosphorylation of S6 kinase at the activating hydrophobic motif site Thr-389 (Fig. 1C). Consequently, the phosphorylation of rps6, an S6 kinase substrate, was significantly increased (Fig. 1D). These results demonstrate a congruence between high glucose–induced S6 kinase deacetylation and its activation by mTORC1-mediated phosphorylation.
Figure 1.
High glucose activates S6 kinase in association with decrease in its acetylation. Glomerular mesangial cells were incubated with 25 mm glucose (high glucose (HG)) for the indicated duration. 5 mm glucose plus 20 mm mannitol was used for time 0. A, C, and D, the cleared cell lysates were immunoblotted with anti-acetyllysine and anti-actin (A), phospho-S6 kinase Thr-389 and S6 kinase (C), and phospho-rps6 Ser-240/244 and rps6 (D) antibodies. B, the cell lysates were immunoprecipitated with S6 kinase antibody followed by immunoblotting (IB) with anti-acetyllysine and S6 kinase antibodies as indicated. Molecular weight markers are shown at the left margin. Quantifications are shown at right. Mean ± S.D. (error bars) of three to four experiments is shown. In A and B, *, p < 0.001 versus 0 h. In C and D, *, p < 0.05; **, p < 0.01; #, p < 0.001 versus 0 h.
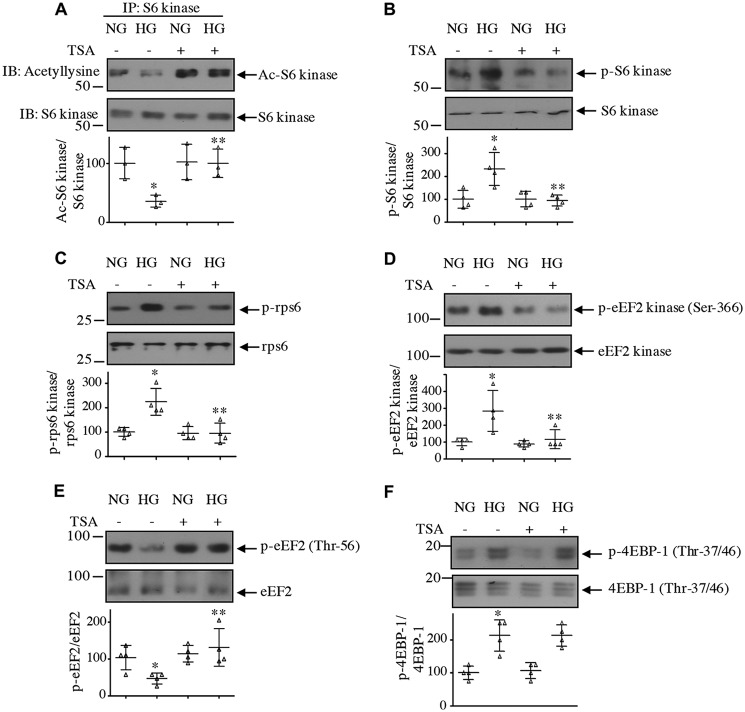
Because protein deacetylation is controlled by HDACs, we considered using a pan-inhibitor, trichostatin A (TSA) (32). TSA significantly prevented the deacetylation of S6 kinase induced by high glucose (Fig. 2A). TSA also inhibited the high glucose–stimulated activating phosphorylation of S6 kinase and its substrate rps6 (Fig. 2, B and C). Similarly, phosphorylation of another substrate of S6 kinase, eEF2 kinase, was suppressed by TSA (Fig. 2D). Phosphorylation of eEF2 kinase inhibits its activity, resulting in a decrease in phosphorylation and activation of eEF2 (33). High glucose reduced eEF2 phosphorylation, which was restored by TSA (Fig. 2E). One possibility is that TSA may directly affect mTROC1 activity and as a result affect the phosphorylation of S6 kinase. To test this, we determined the phosphorylation of 4EBP-1, another direct substrate of mTORC1 (34). As shown in Fig. 2F, high glucose increased the phosphorylation of 4EBP-1, which was not inhibited by TSA. These data demonstrate a role for HDAC in deacetylation and activation of S6 kinase, including phosphorylation of its downstream substrates in response to high glucose in the absence of effect on other aspects of mTORC1 kinase activity.
Figure 2.
HDAC inhibitor reverses high glucose–induced inhibition of S6 kinase acetylation to decrease its activity. Mesangial cells were treated with 0.5 μm TSA for 1 h prior to incubation with 25 mm glucose (HG) for 24 h. A, the cell lysates were immunoprecipitated with S6 kinase antibody followed by immunoblotting (IB) with anti-acetyllysine and anti-S6 kinase antibodies as indicated. B–F, cleared cell lysates were immunoblotted with phospho-S6 kinase Thr-389 and S6 kinase (B), phospho-rps6 Ser-240/244 and rps6 (C), phospho-eEF2 kinase Ser-366 and eEF2 kinase (D), phospho-eEF2 Thr-56 and eEF2 (E), and phospho-4EBP-1 Thr-37/46 and 4EBP-1 (F) antibodies. Molecular weight markers are shown at the left margin. Bottom panels show quantification of the blots. Mean ± S.D. (error bars) of three (A) and four (B–F) independent experiments is shown. For A and E, *, p < 0.05 versus normal glucose (NG); **, p < 0.05 versus HG. In B–D and F, *, p < 0.01 versus NG; **, p < 0.01 versus HG. In F, there was no significant difference between HG and HG plus TSA.
HDAC1 regulates S6 kinase acetylation
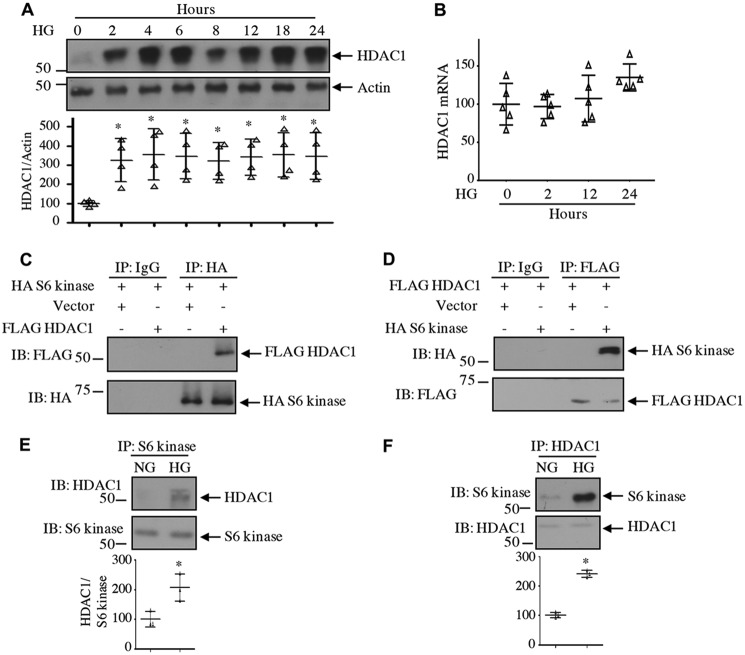
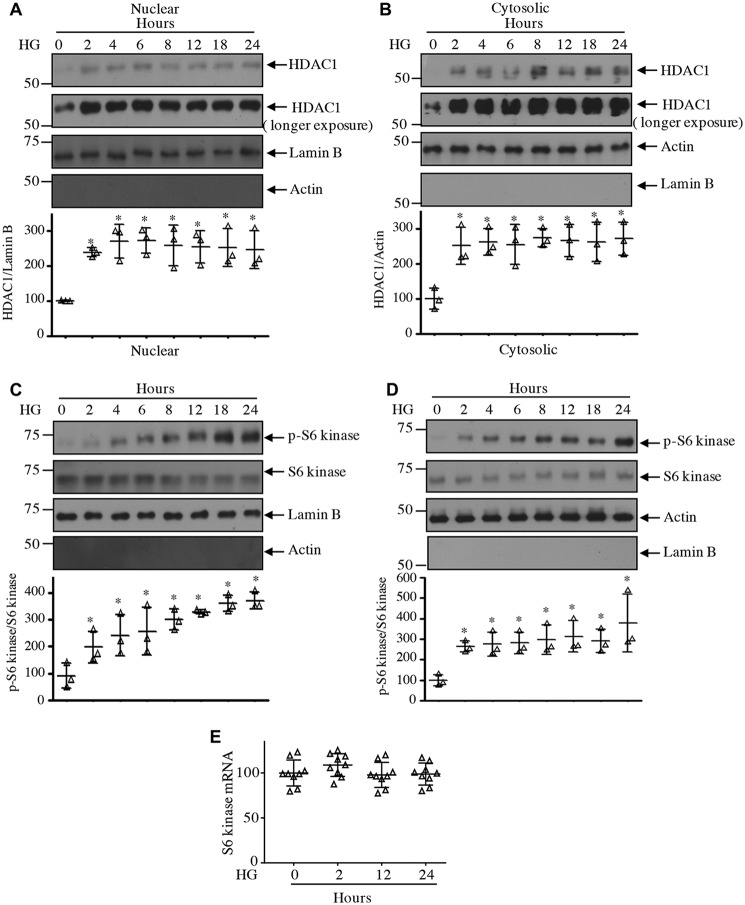
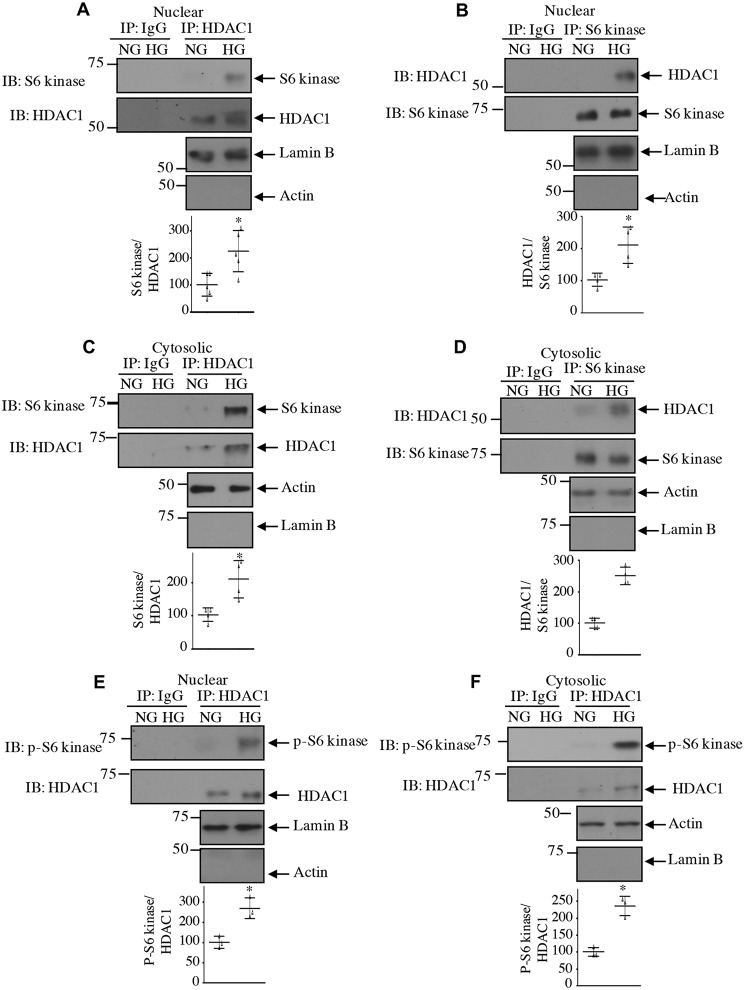
Class I HDACs, including HDAC1, are abundantly expressed in the renal cortex, including renal fibroblasts and tubular epithelial cells (35). High glucose increased the expression of HDAC1 protein in a time-dependent manner in mesangial cells (Fig. 3A). Increased expression was detected at 2 h of incubation with high glucose. Interestingly, high glucose did not have any effect on expression of HDAC1 mRNA (Fig. 3B), indicating lack of regulation at the transcript level. To examine the interaction of HDAC1 with S6 kinase, we expressed FLAG-tagged HDAC1 along with HA-tagged S6 kinase. Reciprocal immunoprecipitation and immunoblotting revealed association of these two proteins in mesangial cells (Fig. 3, C and D). Importantly, high glucose increased the association of endogenous S6 kinase with HDAC1 (Fig. 3, E and F). Because HDAC1 is a nuclear protein, we tested the levels of HADC1 in the nucleus. High glucose time-dependently increased the levels of HDAC1 in the nuclear fraction of mesangial cells (Fig. 4A). Similarly, we detected increased expression of HDAC1 in the cytosol in response to high glucose (Fig. 4B). Interestingly, we found increased phosphorylation and localization of S6 kinase in the nucleus in addition to the cytosol of high glucose–treated mesangial cells (Fig. 4, C and D). Note that the expression of S6 kinase protein and mRNA did not change with high glucose (Fig. 4, C–E). As we have shown above that HDAC1 associates with S6 kinase, we tested their association in the nucleus. As shown in Fig. 5, A and B, S6 kinase in the nucleus associated with HDAC1 in the presence of high glucose. Similarly, the cytosolic fraction also showed this association (Fig. 5, C and D). Interestingly, the HDAC1-associated S6 kinase was phosphorylated in both nucleus and cytosol (Fig. 5, E and F). These results demonstrate that high glucose increases the level of HDAC1 in both nuclear and cytosolic fractions and its association with the S6 kinase.
Figure 3.
High glucose increases expression of HDAC1 protein. A and B, mesangial cells were incubated with 25 mm glucose (HG) for the indicated duration. A, cell lysates were immunoblotted with HDAC1 and actin antibodies. B, expression of HDAC1 mRNA was determined as described under “Experimental procedures.” n = 5; mean ± S.D. (error bars) is shown. C–F, association of S6 kinase with HDAC1. C and D, mesangial cells were transfected with HA-S6 kinase and FLAG-HDAC1 as indicated. Cell lysates were immunoprecipitated with nonimmune IgG, anti-HA (C), or anti-FLAG (D) antibody. The immunoprecipitates were immunoblotted with FLAG and HA antibodies, respectively. E and F, mesangial cells were incubated with HG or NG for 24 h. Cell lysates were immunoprecipitated with S6 kinase (E) or HDAC1 (F) antibody followed by immunoblotting (IB) with HDAC1 and S6 kinase antibodies, respectively, as indicated. Molecular weight markers are shown at the left margins. Mean ± S.D. (error bars) of three to four experiments is shown. *, p < 0.001 versus 0.05 versus zero time point or NG.
Figure 4.
High glucose increases levels of HDAC1 and S6 kinase in the nuclear and cytosolic fractions. Mesangial cells were incubated with 25 mm glucose (HG) for the indicated duration. Nuclear and cytosolic extracts were prepared as described under “Experimental procedures.” Nuclear (A and C) and cytosolic (B and D) extracts were immunoblotted with the indicated antibodies. The bottom part in each panel shows quantification of the blots. n = 3; *, p < 0.001–0.05 versus 0 h. E, mesangial cells were incubated with high glucose for the indicated time periods. Total RNAs were used for real-time RT-PCR with S6 kinase and GAPDH primers as described under “Experimental procedures.” Mean ± S.D. (error bars) of nine measurements is shown.
Figure 5.
High glucose increases association of HDAC1 with S6 kinase in nuclear and cytosolic fractions. Mesangial cells were incubated with 25 mm glucose (HG) for 24 h. Nuclear and cytosolic extracts were prepared as described under “Experimental procedures.” Nuclear (A, B, and E) and cytosolic (C, D, and F) extracts were immunoprecipitated with IgG or HDAC1 (A, C, E, and F) and IgG or S6 kinase (B and D) antibodies followed by immunoblotting (IB) with S6 kinase (A and C), HDAC1 (B and D), and phospho-S6 kinase (E and F) antibodies as indicated. The expression of lamin B and actin is shown to demonstrate purity of the nuclear and cytosolic fractions. Quantifications are shown at the bottom. Mean ± S.D. (error bars) of three to five experiments is shown. *, p < 0.001–0.05 versus NG.
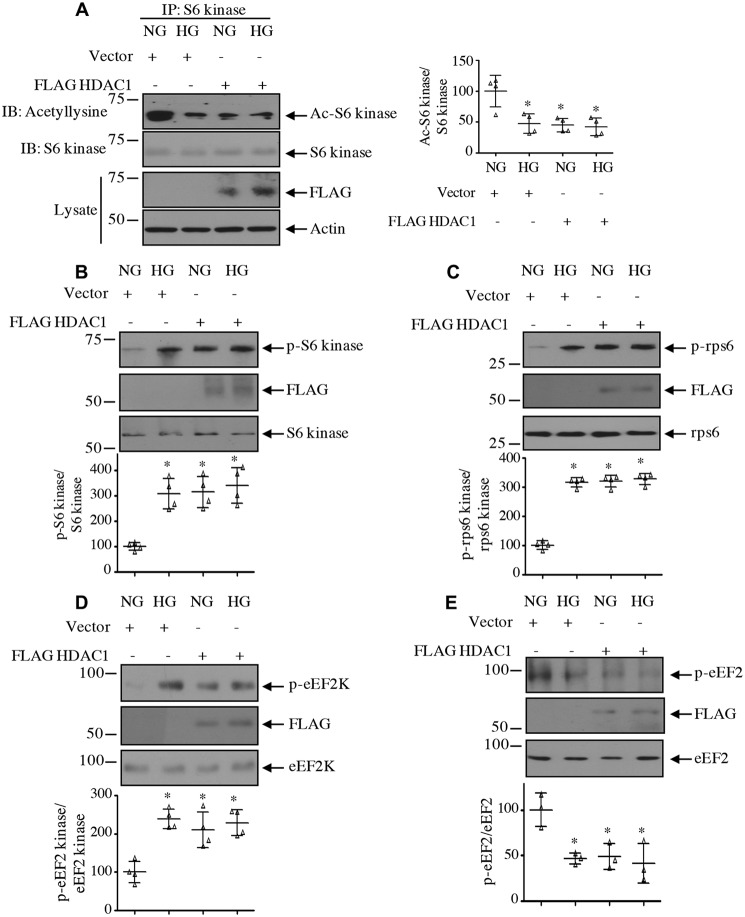
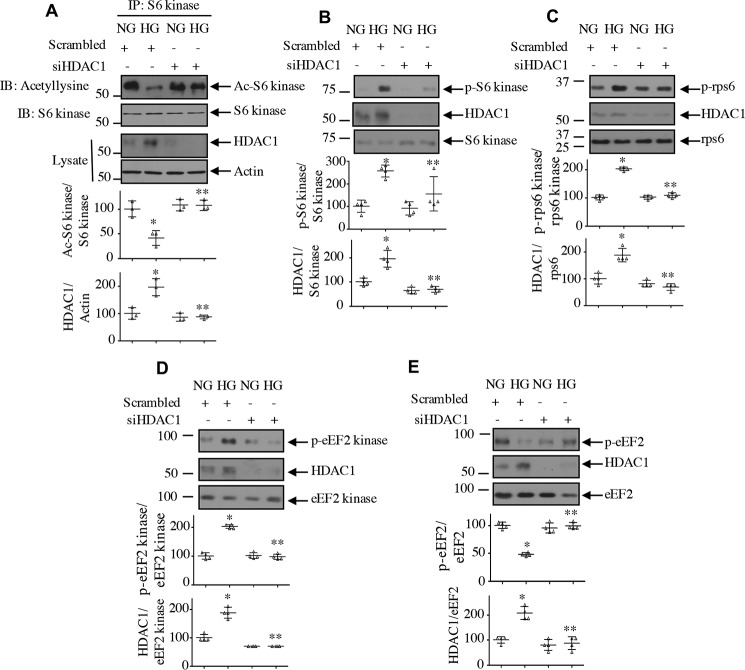
Next, we examined the effect of HDAC1 on the acetylation of S6 kinase. Interestingly, expression of HDAC1 reduced the acetylation of S6 kinase in normal glucose–treated cells, similar to treatment with high glucose (Fig. 6A). Furthermore, HDAC1 increased the activating phosphorylation of S6 kinase, resulting in phosphorylation of its substrates rps6 and eEF2 kinase (Fig. 6, B, C, and D). Consequently, HDAC1 decreased the phosphorylation of eEF2, similar to high glucose treatment (Fig. 6E). To confirm the involvement of HDAC1, we used siRNA against this deacetylase. Down-regulation of HDAC1 reversed the reduced acetylation of S6 kinase induced by high glucose (Fig. 7A). Consequently, siHDAC1 inhibited high glucose–stimulated S6 kinase as judged by its phosphorylation, phosphorylation of rps6/eEF2 kinase, and dephosphorylation of eEF2 (Fig. 7, B–E).
Figure 6.
HDAC1 decreases acetylation of S6 kinase to increase its activity. Mesangial cells were transfected with HDAC1 or vector and incubated with HG or NG. A, cell lysates were immunoprecipitated with S6 kinase antibody followed by immunoblotting (IB) with anti-acetyllysine antibody. Expression of HDAC1 and actin in the cell lysates is shown in the bottom panels. B–E, the cell lysates were immunoblotted with phospho-S6 kinase Thr-389 and S6 kinase (B); phospho-rps6 Ser-240/244 and rps6 (C), phospho-eEF2 kinase Ser-366 and eEF2 kinase (D), phospho-eEF2 Thr-56 and eEF2 (E), and FLAG antibodies as indicated. Molecular weight markers are shown at the left margins. Side and bottom panels show quantifications. Mean ± S.D. (error bars) of four (A–D) and three (E) experiments is shown. *, p < 0.001–0.01 versus NG.
Figure 7.
HDAC1 regulates acetylation of S6 kinase and its activity. Mesangial cells were transfected with siRNA against HDAC1 or scrambled RNA. A, the cell lysates were immunoprecipitated with S6 kinase antibody followed by immunoblotting (IB) with anti-acetyllysine antibody. Expression of HDAC1 and actin in the cell lysates is shown in the bottom panels. B–E, the cell lysates were immunoblotted with phospho-S6 kinase Thr-389 and S6 kinase (B), phospho-rps6 Ser-240/244 and rps6 (C), phospho-eEF2 kinase Ser-366 and eEF2 kinase (D), phospho-eEF2 Thr-56 and eEF2 (E), and HDAC1 antibodies as indicated. Molecular weight markers are shown at the left margins. Bottom panels show quantifications. Mean ± S.D. (error bars) of three (A) and four (B–E) experiments is shown. *, p < 0.001 versus NG; **p < 0.001 versus HG.
HDAC1 regulates high glucose–induced mesangial cell hypertrophy and matrix protein expression
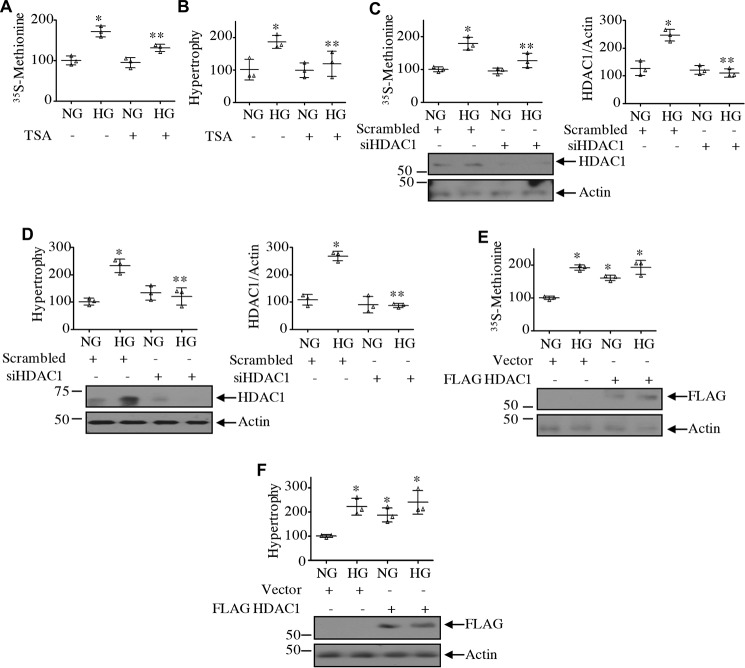
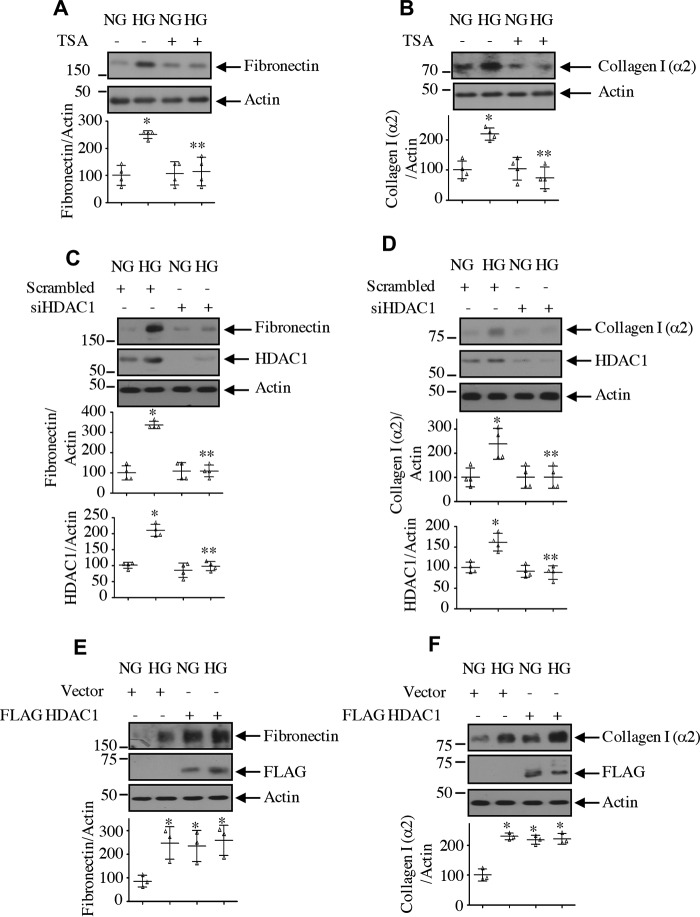
Renal hypertrophy is seen in early stages of diabetic kidney injury. In mesangial cells, high glucose causes hypertrophy (15, 36). We have shown above that HDAC1 regulates the high glucose–induced phosphorylation of rps6 and eEF2 kinase by S6 kinase, suggesting a role of this deacetylase in the initiation and elongation phase of mRNA translation, a rate-limiting step in protein synthesis necessary for hypertrophy. TSA significantly inhibited the protein synthesis and hypertrophy of mesangial cells evoked by high glucose (Fig. 8, A and B). Similarly, siRNA against HDAC1 produced identical results (Fig. 8, C and D). In contrast, expression of HDAC1 increased the protein synthesis and induced hypertrophy of mesangial cells, similar to that observed with high glucose (Fig. 8, E and F). Along with cell hypertrophy, high glucose enhances matrix protein expression in mesangial cells (15, 36). TSA as well as siRNA against HDAC1 significantly inhibited high glucose–stimulated fibronectin and collagen I (α2) expression (Fig. 9, A–D). Conversely, expression of HDAC1 increased the expression of both these proteins, similar to high glucose treatment (Fig. 9, E and F).
Figure 8.
HDAC1 controls mesangial cell protein synthesis and hypertrophy. A and B, mesangial cells were treated with 0.5 μm TSA prior to incubation with HG for 24 h. In A, the protein synthesis was determined as [35S]methionine incorporation as described under “Experimental procedures.” Mean ± S.D. (error bars) of triplicate measurements is shown. *, p < 0.0001 versus NG; **, p < 0.001 versus HG. In B, hypertrophy was determined as the ratio of protein to cell number as described under “Experimental procedures.” Mean ± S.D. (error bars) of triplicate measurements is shown. *, p < 0.02 versus NG; **, p < 0.02 versus HG. C–F, mesangial cells were transfected with siRNA against HDAC1 or scrambled RNA (C and D) or with FLAG-HDAC1 or vector plasmids (E and F). Protein synthesis was determined as [35S]methionine incorporation (C and E). Mean ± S.D. (error bars) of triplicate measurements is shown. *, p < 0.0001 versus NG; **, p < 0.001 versus HG in C. Hypertrophy was determined as described above (D and F). Mean ± S.D. (error bars) of triplicate measurements is shown. *, p < 0.0008 versus NG; **, p < 0.0008 versus HG in D; *, p < 0.004 versus NG in F. Right panels in C and D show quantifications of HDAC1 down-regulation. Mean ± S.D. (error bars) of three experiments is shown.*, p < 0.001 versus NG; **, p < 0.001 versus HG.
Figure 9.
HDAC1 regulates expression of matrix proteins. A and B, mesangial cells were treated with 0.5 μm TSA for 1 h prior to incubation with HG for 24 h. C–F, mesangial cells were transfected with siRNA against HDAC1 or scrambled RNA (C and D) or with FLAG-HDAC1 or vector (E and F). The cell lysates were immunoblotted with fibronectin, collagen I (α2), HDAC1, FLAG, and actin antibodies as indicated. Bottom panels show quantifications. For A–D, mean ± S.D. (error bars) of four independent experiments is shown. For A and B, *, p < 0.001 versus NG; **, p < 0.001 versus HG. For C and D, *, p < 0.01 versus NG; **, p < 0.01 versus HG. For E and F, mean ± S.D. (error bars) of three experiments is shown. *, p < 0.05 (E) and 0.001 (F) versus NG.
C-terminal acetylation of S6 kinase regulates its activity and mesangial cell pathology by high glucose
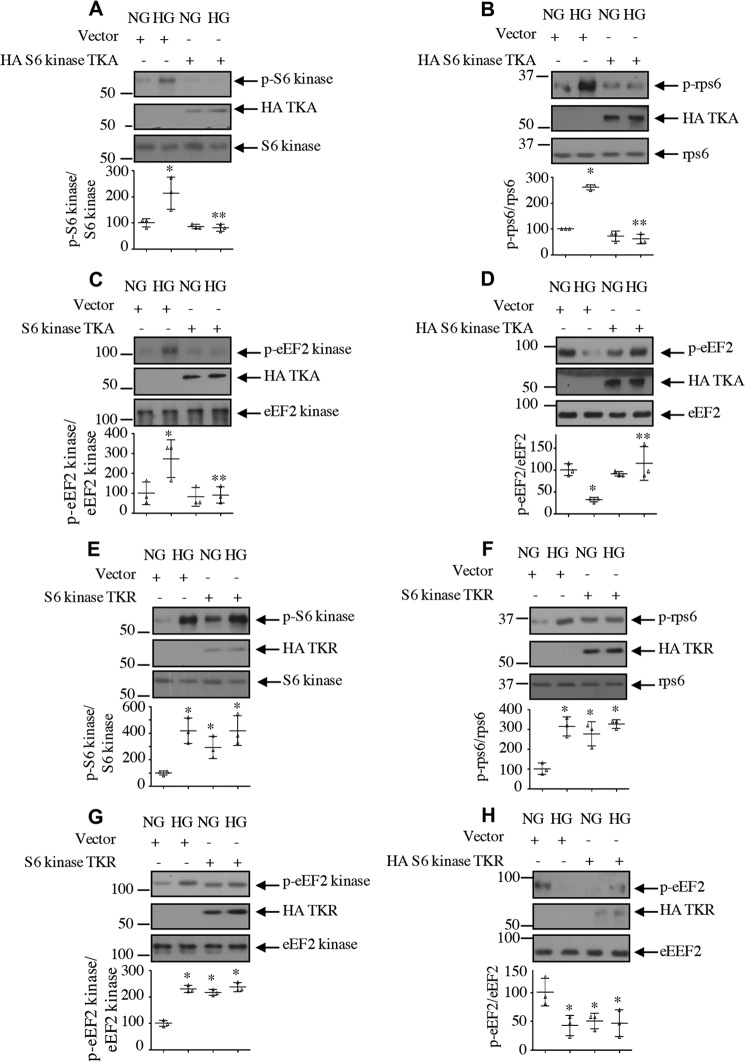
Our work in renal cells has established a role for S6 kinase in cell hypertrophy and matrix protein expansion (15, 27). Our results above demonstrate a conclusive role of HDAC1 in S6 kinase deacetylation, mesangial cell hypertrophy, and matrix protein expression. S6 kinase undergoes acetylation at three C-terminal lysine residues (Lys-484/485/493) by the histone acetyltransferase p300/PCAF (23, 29–31). We first determined whether the C-terminal acetylation of S6 kinase is required for high glucose–induced activation of this kinase. We used an acetylation-mimetic mutant in which the three lysine residues of the S6 kinase were replaced by alanine (TKA). Expression of TKA blocked the high glucose–stimulated activating phosphorylation of S6 kinase, resulting in inhibition of phosphorylation of its two substrates, rps6 and eEF2 kinase (Fig. 10, A–C). Consequent to the mitigation of eEF2 kinase phosphorylation, TKA reversed the high glucose–reduced eEF2 phosphorylation (Fig. 10D). To confirm the role of S6 kinase acetylation, we used an acetylation-deficient S6 kinase mutant (TKR). Expression of TKR increased the phosphorylation of S6 kinase and its substrates rps6 and eEF2 kinase, similar to that observed with high glucose treatment (Fig. 10, E–G). Due to enhanced inactivating phosphorylation of eEF2 kinase, TKR decreased the phosphorylation of eEF2, similar to high glucose (Fig. 10H). Together, these results indicate that C-terminal deacetylation of S6 kinase regulates the high glucose–induced activation of this kinase. Furthermore, our data suggest that S6 kinase acetylation controls the elongation phase of protein synthesis.
Figure 10.
Acetylation of S6 kinase regulates its activity. Mesangial cells were transfected with acetylation-mimetic mutant HA-S6 kinase TKA (A–D), acetylation-deficient HA-S6 kinase TKR (E–H), or vector as indicated. Transfected cells were incubated with HG for 24 h. The cell lysates were immunoblotted with the indicated antibodies. Bottom panels show quantification. Mean ± S.D. (error bars) of three experiments is shown. *, p < 0.001–0.05 versus NG; **, p < 0.001–0.05 versus HG.
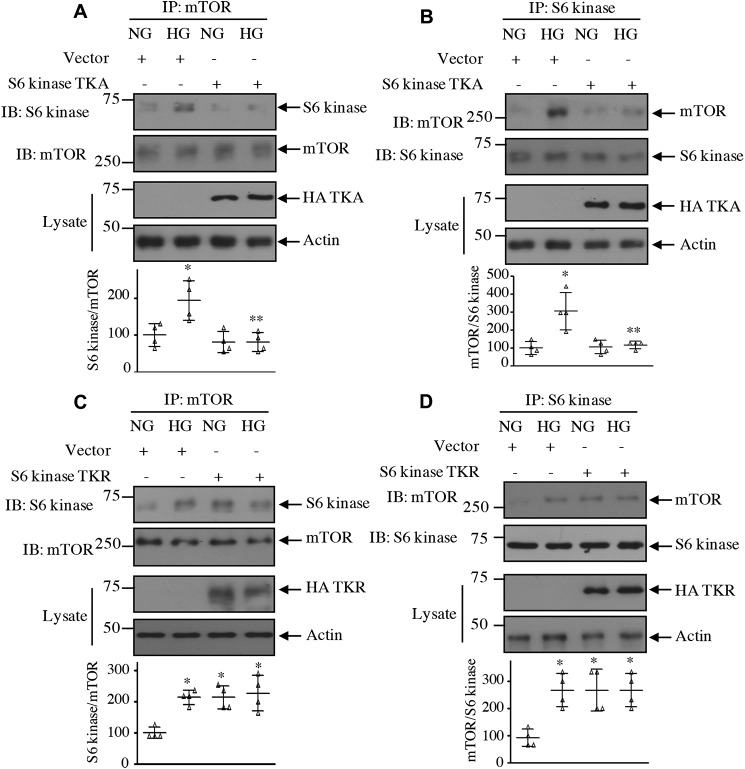
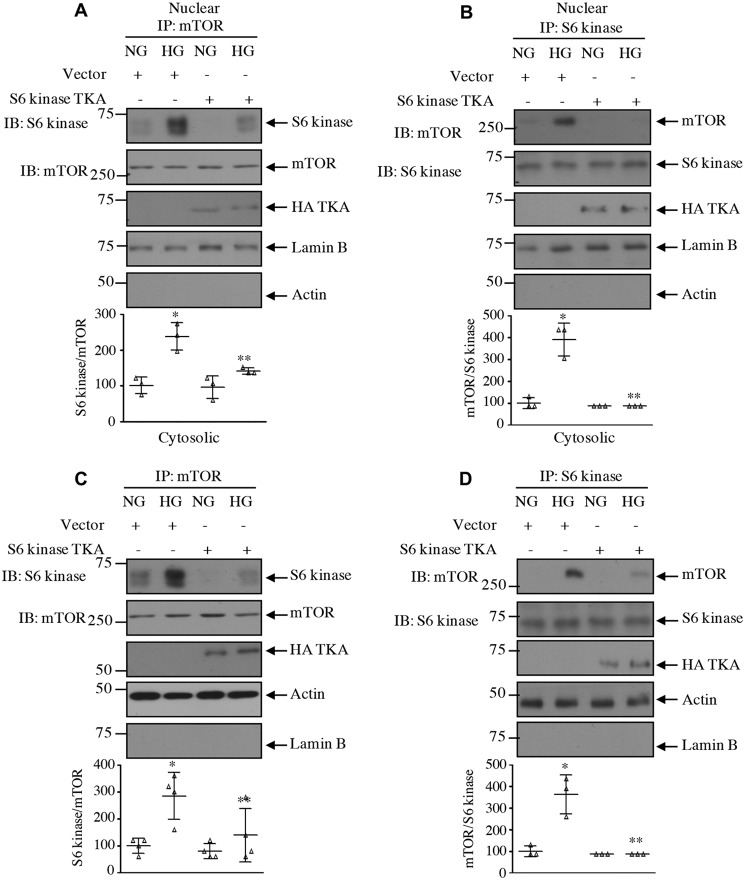
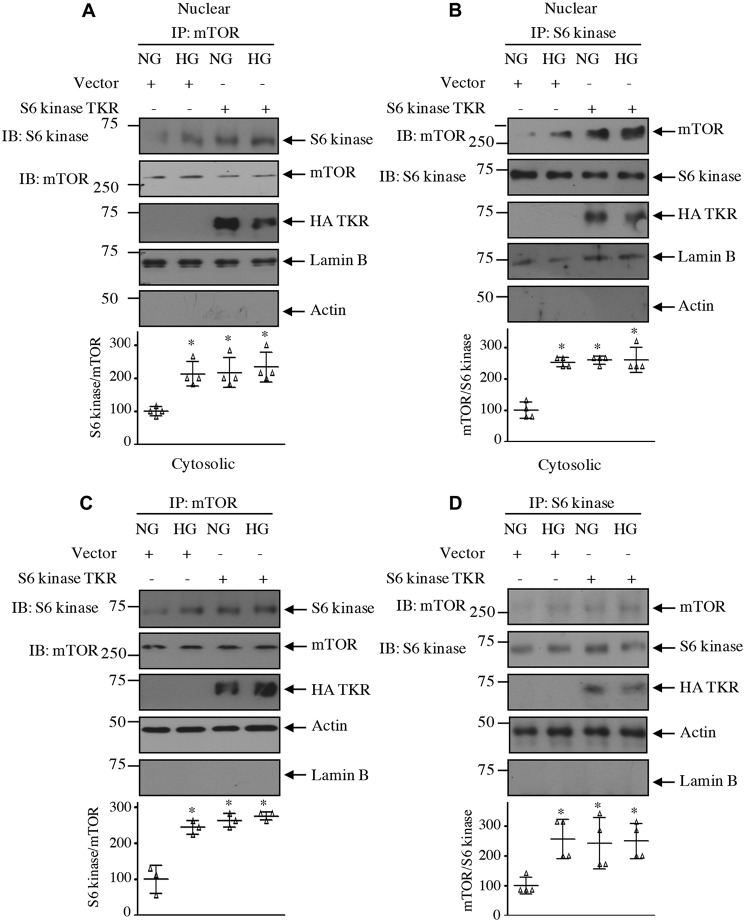
Our results above demonstrate that acetylation of S6 kinase regulates its phosphorylation by mTOR. One hypothesis is that for S6 kinase phosphorylation by mTORC1 to occur it needs to be associated with the kinase mTOR. Therefore, we examined the effect of S6 kinase acetylation mutants on the association of these two kinases. High glucose significantly increased the association of S6 kinase with mTOR in mesangial cells. Expression of the acetylation-mimetic mutant TKA significantly decreased association of S6 kinase with mTOR in the total cell lysates as well as in the nuclear and cytosolic fractions (Figs. 11, A and B, and 12). In contrast, the acetylation-deficient mutant TKR increased the association of mTOR with S6 kinase, similar to that found with high glucose alone (Figs. 11, C and D, and Fig. 13).
Figure 11.
Acetylation of S6 kinase regulates its complex formation with mTOR. Mesangial cells were transfected with acetylation-mimetic HA-S6 kinase TKA (A and B) and acetylation-deficient HA-S6 kinase TKR (C and D) mutants or vector as indicated. Transfected cells were incubated with HG for 24 h. The cell lysates were immunoprecipitated with mTOR (A and C) and S6 kinase (B and D) followed by immunoblotting (IB) with S6 kinase and mTOR antibodies as indicated. The expression of S6 kinase mutants is shown in the lysate. Bottom panels show quantification of the blots. Mean ± S.D. (error bars) of four independent experiments is shown. *, p < 0.001–0.01 versus NG; **, p < 0.001–0.01 versus HG.
Figure 12.
Acetylation-mimetic mutant of S6 kinase inhibits complex formation between mTOR and S6 kinase in the nuclear and cytosolic fractions. Mesangial cells were transfected with acetylation-mimetic HA-S6 kinase TKA mutant or vector as indicated. Transfected cells were incubated with HG for 24 h. The nuclear and cytosolic fractions were immunoprecipitated with mTOR (A and C) and S6 kinase (B and D) followed by immunoblotting (IB) with S6 kinase and mTOR antibodies as indicated. The expression of S6 kinase mutant, lamin B, and actin is shown. Bottom panels show quantification of the blots. Mean ± S.D. (error bars) of three to four experiments is shown. *, p < 0.001–0.01 versus NG; **, p < 0.0.001–0.05 versus HG.
Figure 13.
Acetylation-deficient mutant of S6 kinase increases complex formation between mTOR and S6 kinase in the nuclear and cytosolic fractions. Mesangial cells were transfected with acetylation-deficient HA-S6 kinase mutant or vector as indicated. Transfected cells were incubated with HG for 24 h. The nuclear and cytosolic fractions were immunoprecipitated with mTOR (A and C) and S6 kinase (B and D) followed by immunoblotting (IB) with S6 kinase and mTOR antibodies as indicated. The expression of S6 kinase mutant, lamin B, and actin is shown. Bottom panels show quantification of the blots. Mean ± S.D. (error bars) of three to four experiments is shown. *, p < 0.001–0.05 versus NG.
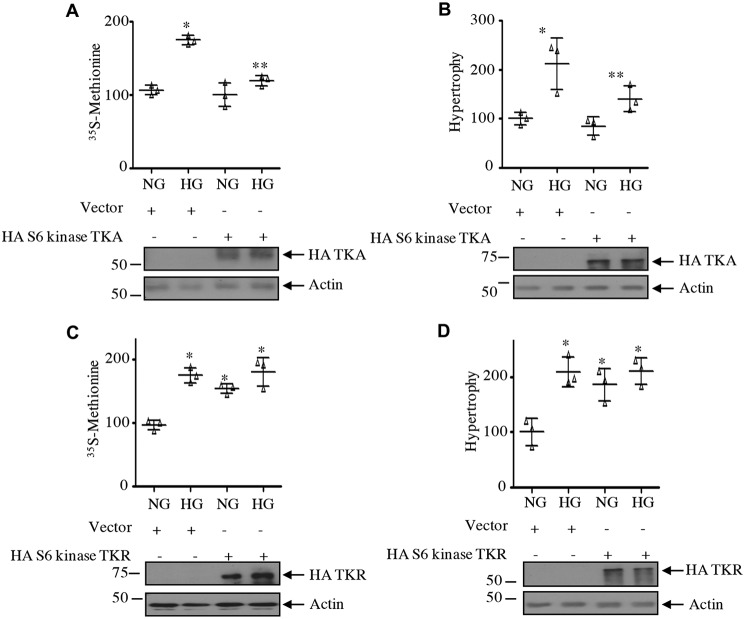
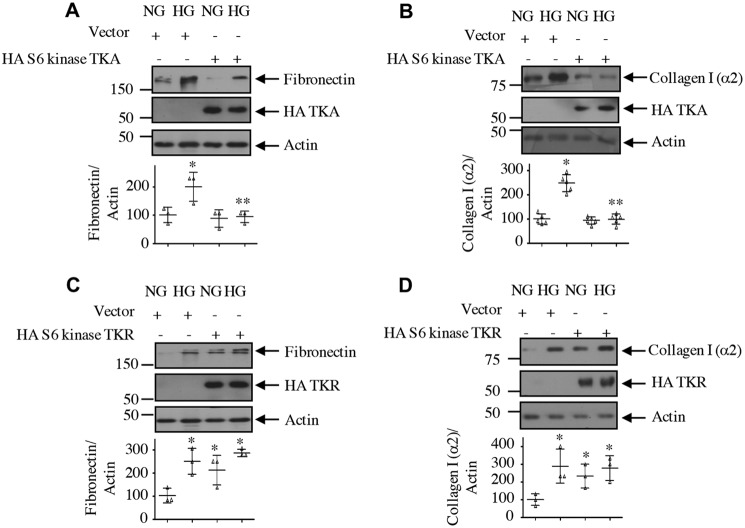
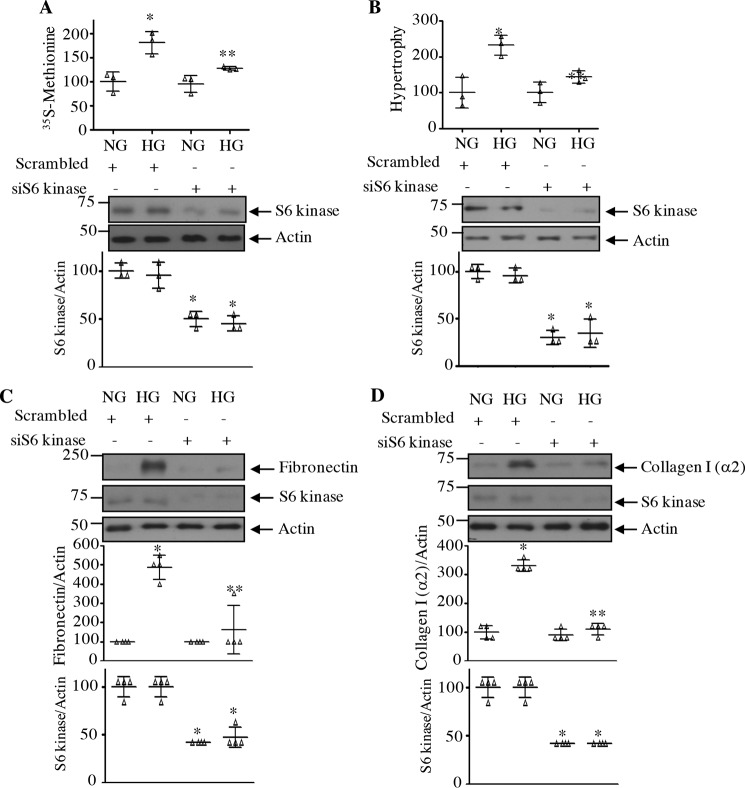
Next, we determined the role of S6 kinase C-terminal acetylation in mesangial cell hypertrophy for which protein synthesis is required. Expression of the acetylation-mimetic mutant of S6 kinase, TKA, significantly inhibited the high glucose–stimulated protein synthesis in mesangial cells (Fig. 14A). Similarly, mesangial cell hypertrophy induced by high glucose was also blocked by TKA (Fig. 14B). In contrast to these results, expression of the acetylation-deficient mutant of S6 kinase, TKR, induced protein synthesis and hypertrophy of mesangial cells, similar to high glucose (Fig. 14, C and D). These results indicate that C-terminal deacetylation of S6 kinase is necessary for high glucose–induced injury in mesangial cells. Consistent with this hypothesis, expression of the acetylation-mimetic TKA significantly inhibited the expression of fibronectin and collagen I (α2) in response to high glucose (Fig. 15, A and B). Contrary to these results, TKR increased the fibronectin and collagen I (α2) expression, similar to that observed with high glucose (Fig. 15, C and D). Finally, we examined the requirement of S6 kinase in mesangial cell hypertrophy and matrix protein expression by using the siRNAs against this kinase. siS6 kinase significantly inhibited high glucose–induced protein synthesis and hypertrophy as well as fibronectin and collagen I (α2) expression (Fig. 16).
Figure 14.
Acetylation of S6 kinase regulates mesangial cell protein synthesis and hypertrophy. Mesangial cells were transfected with acetylation-mimetic mutant HA-S6 kinase TKA (A and B), acetylation-deficient HA-S6 kinase TKR (C and D), or vector as indicated. Transfected cells were incubated with HG for 24 h. Protein synthesis was determined as 35S incorporation, and hypertrophy was measured as the ratio of protein to cell number as described under “Experimental procedures.” The mean ± S.D. (error bars) of triplicate measurements is shown. In A and C, *, p < 0.0001 versus NG. In A, **, p < 0.0001 versus HG. In B, *, p < 0.004 versus NG; **, p < 0.004 versus HG. In D, *, p < 0.002 versus NG.
Figure 15.
Acetylation of S6 kinase regulates mesangial cell fibronectin and collagen I (α2) expression. Mesangial cells were transfected with HA-S6 kinase TKA (A and B), HA-S6 kinase TKR (C and D), or vector as indicated. Transfected cells were incubated with HG for 24 h. The cell lysates were immunoblotted with the indicated antibodies. Bottom panels show quantification. Mean ± S.D. (error bars) of three to five experiments is shown. *, p < 0.001–0.05 versus NG; **, p < 0.001–0.05 versus HG.
Figure 16.
siRNAs against S6 kinase block high glucose–induced mesangial cell hypertrophy and matrix protein expression. Mesangial cells were transfected with siRNAs to S6 kinase or scrambled RNA. A and B, protein synthesis (A) and hypertrophy (B) were determined as described under “Experimental procedures.” Mean ± S.D. (error bars) of three measurements is shown. *, p < 0.01 versus NG; **, p < 0.01 versus HG. C and D, cell lysates were immunoblotted with fibronectin, collagen I (α2), S6 kinase, and actin antibodies as indicated. Quantifications are shown. Mean ± S.D. of four independent experiments is shown. *, p < 0.001 versus NG; **, p < 0.001 versus HG. Quantification of S6 kinase down-regulation is shown. Mean ± S.D. of three (A and B) and four (C and D) experiments is shown. *, p < 0.001 versus NG or HG.
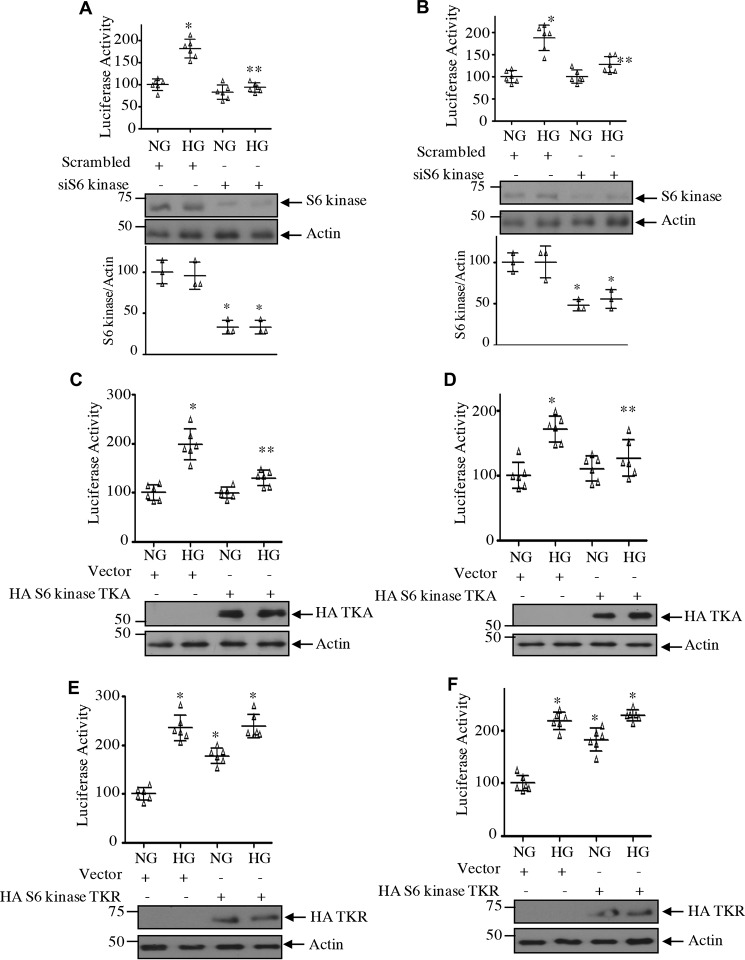
We and others have shown previously that expression of fibronectin and collagen I (α2) is regulated by transcriptional mechanisms (37–40). We investigated the role of S6 kinase and its acetylation in transcription of both these genes using reporter plasmids in which the fibronectin and collagen I (α2) promoters drive firefly luciferase gene (38, 40). High glucose increased the transcription of both fibronectin and collagen I (α2) (Fig. 17). Cotransfection of siRNA against S6 kinase with the reporter plasmids significantly inhibited the reporter activity, suggesting inhibition of transcription of both fibronectin and collagen I (α2) (Fig. 17, A and B). Similarly, S6 kinase acetylation-mimetic mutant attenuated the transcription of both fibronectin and collagen I (α2) (Fig. 17, C and D). In contrast to these results, the acetylation-deficient mutant of S6 kinase, TKR, increased the transcription of fibronectin and collagen I (α2), similar to high glucose treatment (Fig. 17, E and F). Taken together, our results support a conclusive role for S6 kinase and its C-terminal deacetylation in high glucose–mediated mesangial cell hypertrophy and matrix protein expression.
Figure 17.
Acetylation of S6 kinase regulates transcription of fibronectin and collagen I (α2). Mesangial cells were cotransfected with fibronectin promoter–luciferase (A, C, and E), collagen I (α2) promoter–luciferase reporters (B, D, and F), and siS6 kinase (A and B), HA-S6 kinase TKA (C and D), HA-S6 kinase TKR (E and F), or scrambled RNA/vector as indicated. Transfected cells were incubated with HG for 24 h. The cell lysates were used to assay for luciferase activity as described under “Experimental procedures.” Mean ± S.D. (error bars) of six measurements is shown. *, p < 0.001 versus NG; **, p < 0.001–0.01 versus HG. Quantification of S6 kinase expression is shown at the bottom of A and B. Mean ± S.D. (error bars) of three experiments is shown.*, p < 0.001–0.01 versus NG or HG.
Deacetylation of S6 kinase in the glomeruli of streptozotocin-induced diabetic rats
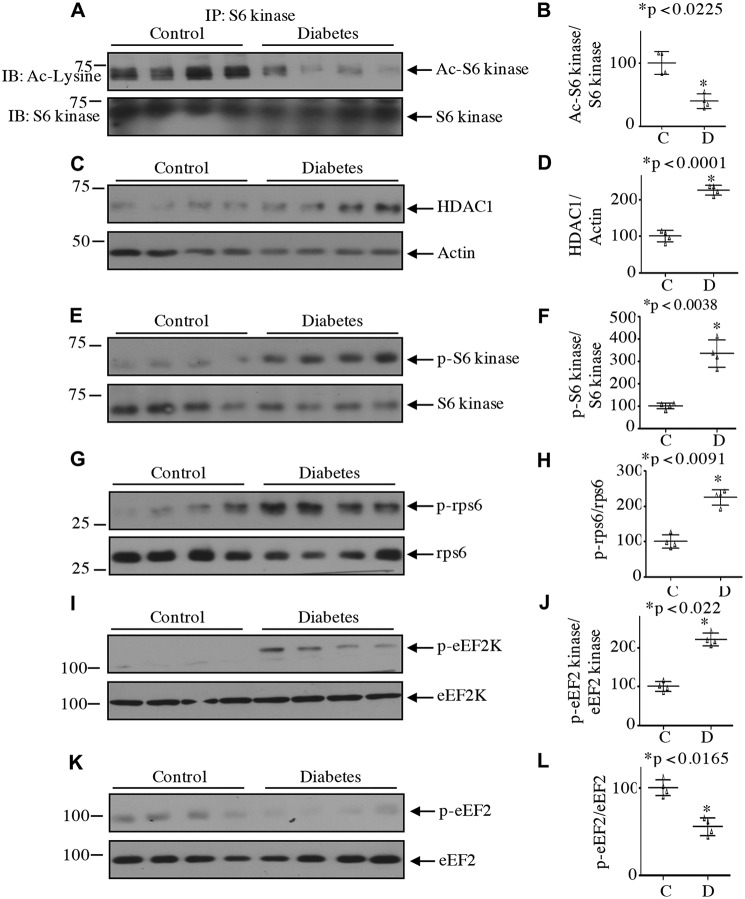
We and others have reported previously that activation of mTORC1 increased the phosphorylation of S6 kinase in diabetic mice and human kidney (13, 14, 16, 17, 41–43). Our results above show that regulation of S6 kinase acetylation contributes to mesangial cell hypertrophy and matrix protein expression. We investigated the relevance of our observations using glomeruli from streptozotocin-induced diabetic rats, which show early pathological changes of diabetic nephropathy (36). There was a significant decrease in the S6 kinase acetylation in the glomeruli of diabetic rats (Fig. 18, A and B). In mesangial cells, deacetylation of S6 kinase by high glucose was associated with increased expression of HDAC1. Consistently, the levels of HDAC1 were significantly elevated in the diabetic glomeruli (Fig. 18, C and D). We have shown that HDAC1 promoted the activating phosphorylation of S6 kinase in mesangial cells (Figs. 6 and 7), so we tested this phenomenon. As shown in Fig. 18, E and F, the phosphorylation of S6 kinase was markedly enhanced in the glomeruli of the diabetic rats. In fact, we detected increased phosphorylation of both the substrates of S6 kinase, rps6 and eEF2 kinase (Fig. 18, G–J). As a consequence of phosphorylation-dependent inactivation of eEF2 kinase, the level of eEF2 phosphorylation was significantly reduced in the diabetic glomeruli (Fig. 18, K and L). These results indicate a possible role of S6 kinase deacetylation in the activation of this kinase and in the pathology of diabetic kidney injury.
Figure 18.
Decreased S6 kinase acetylation in the kidney glomeruli of streptozotocin-induced diabetic rats. A, lysates of renal glomeruli from diabetic and control rats were immunoprecipitated with S6 kinase antibody followed by immunoblotting (IB) with anti-acetyllysine antibody. C, E, G, I, and K, lysates of glomeruli from control and diabetic rats were immunoblotted with the indicated antibodies. Each lane represents an individual animal. B, D, F, H, J, and L, quantification of data presented in A, C, E, G, I, and K, respectively. Mean ± S.D. (error bars) of four animals per group is shown.
Discussion
Activation of the S6 kinase occurs by phosphorylation at Thr-389 by mTORC1. At the N terminus of S6 kinase, there is a short stretch of amino acids called the TOS motif, which is also present in the other substrates of mTORC1 such as 4EBP-1 (44). Mutation of the S6 kinase TOS motif abolishes its phosphorylation by mTORC1. In fact, the S6 kinase TOS motif is required for binding to raptor, the substrate-binding subunit of mTORC1 (45, 46). A series of structure–function studies revealed molecular steps that induce multiple phosphorylation–dependent activation of S6 kinase (47–50). At the basal state, the pseudosubstrate segment at the C terminus containing multiple proline-directed phosphorylation sites interacts with the N-terminal domain to autoinhibit the S6 kinase activity. The initial activation process involves multiple phosphorylations at the C-terminal serine residues to facilitate binding of the N terminus TOS motif with raptor (25, 51). This interaction brings the substrate S6 kinase onto the mTORC1 for its phosphorylation at the hydrophobic motif site Thr-389. However, mutation of the autoinhibitory site at the C terminus relieves the TOS mutation–induced inactivation of S6 kinase (52). Thus, a role of the C terminus in activation of S6 kinase is established.
High glucose is known to induce multiple growth factors such as transforming growth factor-β and platelet-derived growth factor (53). We and others have shown that both these growth factors control the phosphorylation of S6 kinase by high glucose (54, 55). However, along with phosphorylation, growth factor–induced C-terminal acetylation of S6 kinase has also been reported (29). In contrast to these results, in the present study we show that in the basal inactive state, S6 kinase is acetylated at its C terminus, which may contribute to its autoinhibition in the absence of any stimulus. In fact, we demonstrate that high glucose decreases the acetylation of S6 kinase. We postulate that the deacetylation of S6 kinase relieves the autoinhibition of S6 kinase by the C terminus in the presence of high glucose, resulting in its binding to mTOR, thus enabling Thr-389 phosphorylation by mTORC1 (51, 52). This hypothesis is supported by our observation that the acetylation-mimetic mutant of S6 kinase inhibited the association of the kinase with mTOR and hence inhibited the mTOR-mediated phosphorylation. These results are further supported by our opposite finding with the acetylation-deficient mutant, which showed increased association of mTOR with S6 kinase.
Acetylation of histones at the promoter region of various matrix protein genes contributes to the pathologies of diabetic nephropathy (53). Along with histone acetylation, acetylation of nonhistone proteins such as different transcription factors and enzymes, including the S6 kinase, has been reported (29, 30). However, the status of acetylation is maintained by the activity of HDACs, which deacetylate the acetylated histones and other proteins. HDAC inhibitors have been tested clinically for various malignancies (56). HDACs have been implicated in renal fibrosis. For example, the pan-HDAC inhibitor TSA was shown to ameliorate renal fibrosis in a model of unilateral ureteral obstruction by attenuating inflammatory responses and restoring anti-fibrotic BMP7 transcription (57–59). At the cellular level, in renal proximal tubular epithelial cells, TSA blocked the epithelial-to-mesenchymal trans-differentiation necessary for fibrosis (60). Moreover, in renal glomerular endothelial cells, TSA suppressed the expression of the profibrotic cytokine connective tissue growth factor (61). However, these beneficial effects of HDAC inhibition in renal cells do not identify any specific target protein for its action (35, 62). A recent report in T cells showed that HDAC inhibition by TSA induced their differentiation, which depended upon increased acetylation of S6 kinase. However, in this study, increased acetylation of S6 kinase enhanced its phosphorylation/activation by mTORC1 (63). In contrast to these results, our present study in glomerular mesangial cells demonstrates that TSA inhibits the phosphorylation of S6 kinase due to reversal of its deacetylation induced by high glucose. In fact, an increase in the S6 kinase acetylation results in a decrease in the phosphorylation of the S6 kinase substrates, leading to attenuation of mesangial cell hypertrophy and matrix protein expression. It should be noted that TSA did not directly affect the whole spectrum of mTROC1 activity as high glucose–induced phosphorylation of 4EBP-1, another substrate of mTORC1, was unaffected by TSA. These results suggest that HDAC inhibition does not have any direct effect on mTORC1 activity. Rather, we conclude that TSA acts through S6 kinase acetylation, which contributes to the phosphorylation of this kinase by mTORC1, leading to its beneficial effects on fibrotic changes in renal cells.
Multiple isoforms of HDACs are expressed in the kidneys and in proximal tubular epithelial cells (35, 64). Quantitative RT-PCR analysis of whole kidneys from patients with diabetic nephropathy showed increased mRNA expression of the three isotypes HDAC2, HDAC4, and HDAC5. This expression profile was confirmed by immunohistochemical analysis. However, the expression of HDAC2 was localized to the tubules, whereas both HDAC4 and HDAC5 were present in the glomeruli (65). Interestingly, weak expression of these isotypes was detected in diabetic patients without nephropathy. Similar to these observations, the expression of HDAC2 as well as HDAC4 and HDAC5 was increased in rodent models of both type 1 and type 2 diabetes, in cultured proximal tubular epithelial cells, and in glomerular mesangial cells and epithelial cells (podocytes) (62, 65). Among these isotypes, only HDAC2 was increased by high glucose in the proximal tubular epithelial cells, whereas HDAC4 and HDAC5 were increased in the podocyte and mesangial cells, respectively (65). Interestingly, we showed a significant increase in HDAC1 protein in the absence of any increase in its mRNA in mesangial cells in response to high glucose. These results suggest that high glucose does not regulate HDAC1 expression at the transcript level. Interestingly, our results, for the first time, demonstrate an increase in the HDAC1 levels in both nuclear and cytosolic fractions of mesangial cells in the presence of high glucose. Furthermore, HDAC1 is associated with S6 kinase. Importantly, HDAC1-associated S6 kinase is phosphorylated in response to high glucose. In fact, for the first time, we identified that S6 kinase is present in a complex with HDAC1, and we demonstrated a high glucose–inducible association of this deacetylase with S6 kinase not only in the cytosol but in the nucleus also. Furthermore, we demonstrated a role of HDAC1 in mesangial cell hypertrophy and matrix protein expression. Additionally, we detected increased levels of HDAC1 in the glomeruli of diabetic rats.
S6 kinase–mediated phosphorylation of substrates regulates protein synthesis at multiple stages, including mRNA translation initiation and elongation. For example, inactive S6 kinase binds to the multisubunit preinitiation scaffold eIF3, whereas stimulus-inducible recruitment of mTORC1 to eIF3 facilitates phosphorylation of the S6 kinase at Thr-389 to yield dissociation of activated S6 kinase for subsequent phosphorylation of its translational target proteins such as rps6 and eEF2 kinase (18). It is not known whether the acetylation status of S6 kinase determines its binding to eIF3 for the activating phosphorylation by mTORC1 and subsequent phosphorylation of the S6 kinase substrates. Interestingly, our data in the present study demonstrate that deacetylation of S6 kinase is necessary for phosphorylation of rps6 and eEF2 kinase, two substrates required for increased renal cell protein synthesis (33, 66). Importantly, in the renal glomeruli of type 1 diabetic rats, we found increased phosphorylation of these two substrates of S6 kinase, and this was associated with decreased S6 kinase acetylation.
A significant role of S6 kinase in cell size control has been established. Earlier studies in Drosophila revealed that deletion of S6 kinase resulted in death at the larval stage. However, the few survivors exhibited reduced body size exclusively due to reduction in cell size, which further supports its role in cell size control and not cell proliferation (67). Overexpression of S6 kinase in cultured mammalian cells increased the cell size without any effect on cell cycle progression, indicating its specific role in cell hypertrophy (68). Moreover, S6 kinase–deficient mice are smaller than their WT littermates and exhibit reduced pancreatic β-cell and myoblast size without any effect on the proliferation (69–72). Importantly, in a rodent model of uninephrectomy, where an increase in the size of the contralateral kidney is observed, deletion of S6 kinase significantly abrogates compensatory hypertrophy (73). Similarly, S6 kinase–deficient mice showed attenuated renal hypertrophy induced by streptozotocin-induced diabetes (73). In support of these observations, our results here demonstrate that down-regulation of S6 kinase significantly attenuated the hypertrophy of mesangial cells induced by high glucose. Furthermore, in the present study, we show that an acetylation-mimic mutant of S6 kinase inhibited its activating phosphorylation and kinase activity in response to high glucose. Furthermore, this mutant inhibited high glucose–induced mesangial cell hypertrophy. The opposite effect was observed with acetylation-deficient mutant, thus providing evidence for a significant role of high glucose–stimulated deacetylation of S6 kinase in this process. These results concur with the previous in vivo and in vitro role of S6 kinase activity in regulating renal hypertrophy (15, 73). Another feature of diabetic nephropathy is glomerulosclerosis, which follows renal hypertrophy due to increased accumulation of matrix proteins such as collagen and fibronectin (4, 5, 8, 9). Using the same acetylation-mimic and -deficient mutants, we demonstrated a role of S6 kinase deacetylation in matrix protein accumulation by high glucose. In fact, we found that decreased acetylation of S6 kinase was associated with increased S6 kinase phosphorylation in the renal glomeruli of diabetic rats, which exhibit increased matrix protein expression. These results further support a role of S6 kinase deacetylation in the complications of diabetic nephropathy.
In summary, we have elucidated the role of S6 kinase deacetylation by HDAC1, which contributes to the activity of the kinase. To link these two proteins, we showed similar kinetics of expression of HDAC1 and phosphorylation of S6 kinase. Moreover, we demonstrate that HDAC1 regulates the acetylation of S6 kinase, which controls its kinase activity. We show that inhibition of HDAC does not block all aspects of mTORC1 activity; it selectively blocks mTORC1-mediated phosphorylation of S6 kinase, mesangial cell hypertrophy, and matrix protein expression. Additionally, we demonstrate that deacetylation of S6 kinase controls the association of this kinase with mTOR. Thus, we provide evidence that HDAC1-mediated deacetylation is necessary for mTORC1-mediated phosphorylation of S6 kinase, which contributes to hypertrophy and matrix expansion of mesangial cells. Our results furnish a mechanism for the ameliorative effects of HDAC inhibitors in the diabetes-induced renal hypertrophy and fibrosis. Approaches to specifically sustain acetylation of S6 kinase may benefit kidney complications associated with diabetes.
Experimental procedures
Reagents
Recombinant d-glucose; d-mannitol; Na3VO4; PMSF; protease inhibitor mixture; NP-40; TSA; and actin, FLAG, and fibronectin antibodies were purchased from Sigma. Cell culture materials, Opti-MEM medium, TRIzol reagent for RNA isolation, and the nuclear and cytoplasmic extraction kit were obtained from Thermo Fisher. The following antibodies were obtained from Cell Signaling Technology, Danvers, MA: phospho-S6 kinase (Thr-389), S6 kinase, phospho-rps6 (Ser-240/244), rps6, phospho-eEF2 kinase (Ser-366), phospho-4EBP-1 (Thr-37/46), 4EBP-1, mTOR, eEF2 kinase, phospho-eEF2 (Thr-56), eEF2, and anti-acetyllysine. Anti-HA antibody was obtained from Covance, Princeton, NJ. HDAC1 antibody was purchased from EMD Millipore, Burlington, MA. Antibodies for collagen I (α2) and lamin B and siRNAs against HDAC1 and S6 kinase were obtained from Santa Cruz Biotechnology, Dallas, TX. The transfection reagent FuGENE HD and the luciferase assay kit were obtained from Promega, Madison, WI. The kits for synthesizing cDNA and real-time PCR SYBR Green master mix were purchased from Quanta Biosciences, Gaithersburg, MD. The primers to detect HDAC1, S6 kinase, and GAPDH were obtained from Qiagen, Germantown, MD. The PVDF membrane for Western blotting and [35S]methionine were purchased from PerkinElmer Life Sciences. HA-tagged WT S6 kinase, acetylation-mimetic S6 kinase mutant K484A/K485A/K493A (TKA), and acetylation-deficient S6 kinase mutant K484A/K485A/K493A (TKR) were kind gifts from Dr. Ken Inoki, University of Michigan. FLAG-tagged HDAC1 was kindly provided by Dr. E. Seto, H. Lee Moffitt Cancer Center and Research Institute, Florida. The luciferase reporter plasmids containing the fibronectin and collagen I (α2) promoters were described previously (38, 40).
Cell culture
The human renal glomerular mesangial cells were cultured in DMEM with 10% fetal bovine serum as described previously (74, 75). For experiments, the cells were grown to confluence and serum-starved for 24 h prior to incubation with 25 mm glucose in DMEM for the indicated periods of time. 5 mm glucose plus 20 mm mannitol was used for osmotic control.
Animals
Sprague-Dawley rats (200–250 g) were used to induce diabetes by tail vein injection of 55 mg/kg of body weight streptozotocin in sodium citrate buffer (pH 4.5). The blood glucose levels were monitored 24-h postinjection (15). The rats were kept in the UT Health San Antonio animal facility. The animals had free access to food and water. Five days after streptozotocin injection, the rats were euthanized, and kidneys were removed. Renal cortical sections were isolated (15). Glomeruli were prepared from the cortex by a differential sieving technique as described (76). The glomerular preparations were frozen in an ultralow freezer at −70 °C. The UT Health San Antonio Animal Care and Use Committee approved the protocol.
Cell lysis, immunoblotting, and immunoprecipitation
At the end of the experiment, the mesangial cell monolayer was washed twice with PBS. The monolayer was then incubated at 4 °C for 30 min in RIPA buffer (20 mm Tris-HCl, pH 7.5, 150 mm NaCl, 5 mm EDTA, 1 mm PMSF, 0.1% protease inhibitor mixture, and 1% NP-40) to lyse. The cells were scraped off in RIPA buffer and transferred to the centrifuge tubes. Similarly, the glomeruli from control and diabetic rats were lysed in RIPA buffer. The extracts were spun at 10,000 × g for 30 min. The supernatant was collected in fresh tubes, and protein concentration in the supernatant was determined. For immunoblotting, equal amounts of proteins were boiled in SDS sample buffer and separated by SDS-PAGE. The separated proteins were transferred to PVDF membrane by electroblotting. The membrane with the transferred proteins was incubated with the indicated primary antibodies at 4 °C. The membrane was washed and subsequently incubated with the horseradish peroxidase-conjugated secondary antibody. The membrane was then developed by ECL reagent, and specific protein was visualized by exposure to X-ray films (54, 55).
For immunoprecipitation of protein, at the end of the incubation period, the cell monolayer was washed twice with PBS. IP buffer (40 mm HEPES, 0.3% CHAPS, pH 7.5, 1 mm EDTA, 120 mm NaCl, 1.5 mm Na3VO4, 10 mm pyrophosphate, 10 mm glycerophosphate, 50 mm NaF, and 0.1% EDTA-free protease inhibitor mixture) was added for 30 min at 4 °C (15). This buffer containing mild detergent was reported to maintain the physiological interaction between proteins in the cells (77, 78). The cell lysates were cleared of debris as described above, and protein concentration in the supernatant was determined. Equal amounts of proteins were incubated with the indicated antibody at 4 °C for 30 min as described (55). The mixture was then incubated overnight with protein G–agarose on a rotating device at 4 °C. The immunobeads were collected by brief centrifugation and washed three times with IP buffer. Finally, the beads were resuspended in the sample buffer and boiled. The proteins in the sample buffer were separated by SDS-PAGE and immunoblotted as described above.
Preparation of nuclear and cytosolic fractions
Mesangial cell nuclear and cytosolic fractions were prepared using a nuclear and cytosolic extraction kit according to the vendor's (Thermo Fisher) instructions. Briefly, the cell monolayer was trypsinized and collected by centrifugation at 500 × g for 5 min. The cells were then suspended in PBS, washed, and centrifuged. To the cell pellet, ice-cold CER I from the kit was added, vortexed for 15 s, and incubated on ice for 10 min. Then ice-cold CER II was added to the tube followed by vortexing for 5 s and incubating on ice for 1 min. The tube was then centrifuged at 16,000 × g for 5 min. The supernatant was collected as the cytoplasmic extract. The nuclear pellet was suspended in ice-cold NER from the kit, vortexed, and incubated on ice for 40 min. During this incubation period, the tube was vortexed every 10 min. Finally, the tube was centrifuged at 16,000 × g for 10 min. The supernatant nuclear extract was transferred to a chilled tube on ice. The purity of the nuclear extracts was determined by the presence and absence of lamin B and actin, respectively. Similarly, cytosolic extracts were checked for the presence and absence of actin and lamin B, respectively.
Real-time quantitative RT-PCR
Total RNAs were prepared from mesangial cells using TRIzol reagent as described previously according to the vendor's (Thermo Fisher) protocol (38, 42). Using 1 μg of RNA, first-strand cDNAs were synthesized using oligo(dT) and Moloney murine leukemia virus reverse transcriptase from the cDNA synthesis kit. The cDNA was amplified in a 96-well plate using specific primers for HDAC1, S6 kinase, and GAPDH in a 7500 real-time PCR machine (Applied Biosystems). The PCR conditions were 95 °C for 10 min followed by 40 cycles at 95 °C for 30 s, 60 °C for 30 s, and 72 °C for 30 s. The relative mRNA expression was calculated using the ΔΔCt method. The mRNA level was normalized by GAPDH in the same sample (38).
Measurement of protein synthesis and hypertrophy
For assessment of protein synthesis, at the last 2 h of incubation, the cells were labeled with 1 μCi of [35S]methionine as described (36, 54). Briefly, the cells were washed with PBS and lysed in RIPA buffer. After protein estimation, equal amounts of protein were spotted onto 3MM Whatman filter paper. The filters were washed by boiling for 1 min in 10% TCA containing 0.1 g/liter methionine. The filters were then dried, and the radioactivity was determined using scintillation fluid. Mesangial cell hypertrophy was determined as described previously (43, 55). In brief, the cell monolayer was washed with PBS. The cells were trypsinized, resuspended in the medium, and counted in a hemocytometer. Also, the cell suspension was centrifuged gently at 4000 × g at 4 °C. The cell pellet was resuspended in RIPA buffer and lysed as described above. Total protein content was determined. The ratio of total protein to cell number was calculated. The increase in the ratio was considered as cell hypertrophy as described (43, 55).
Transfection
The cell culture medium was removed from the monolayer inside the tissue culture hood. The cells were washed once with PBS, and Opti-MEM medium was added. The plasmid vector, siRNA against HDAC1, or scrambled RNA was mixed in Opti-MEM with FuGENE HD. The mixture was incubated at room temperature for 5 min and then added to the cells. The cells were incubated at 37 °C in a humidified incubator. At 6 h, complete medium was added (54, 55). At 24 h, the cells were serum-starved and treated with high glucose as described above.
Luciferase activity
Mesangial cells were cotransfected with the reporter plasmids and S6 kinase TKA, S6 kinase TKR, siRNAs against S6 kinase, vector, or scrambled RNA as described in the figure legends. The transfected cells were incubated with high glucose for 24 h. The cell lysates were used to assay luciferase activity using a kit as described previously (38, 40). The data are presented as mean ± S.D. of six measurements.
Statistics
The mean ± S.D. of indicated measurements is shown. The significance of the results was determined using GraphPad Prism software. Analysis of variance followed by Students–Newman–Keuls analysis was used. A p value of <0.05 was considered as significant.
Author contributions
F. D. and G. G. C. data curation; F. D. and G. G. C. formal analysis; F. D. validation; G. G. C. conceptualization; G. G. C. supervision; G. G. C. funding acquisition; G. G. C. investigation; G. G. C. writing-original draft; G. G. C. project administration; G. G. C. writing-review and editing; F. D. and S. M. performed experiments; N. G.-C. intellectual input and writing the manuscript; B. S. K. analyzed the in vivo data and contributed intellectual input during writing of the manuscript.
This work was supported by Department of Veterans Affairs Biomedical Laboratory Research and Development Service Merit Review Award 2I01 BX000926 (to G. G. C.). The authors declare that they have no conflicts of interest with the contents of this article.
- mTORC
- mTOR complex
- mTOR
- mechanistic target of rapamycin
- dTOR
- Drosophila homolog of the target of rapamycin
- TSA
- trichostatin A
- HDAC
- histone deacetylase
- HA
- hemagglutinin
- PCAF
- p300/CBP-associated factor
- TOS
- TOR signaling
- PMSF
- phenylmethylsulfonyl fluoride
- NP-40
- Nonidet P-40
- GAPDH
- glyceraldehyde-3-phosphate dehydrogenase
- PVDF
- polyvinylidene difluoride
- DMEM
- Dulbecco's modified Eagle's medium
- RIPA
- radioimmune precipitation assay
- IP
- immunoprecipitation
- NG
- normal glucose
- HG
- high glucose
- AGC
- PKA, PKG, and PKC kinase families.
References
- 1. Lehmann R., and Schleicher E. D. (2000) Molecular mechanism of diabetic nephropathy. Clin. Chim. Acta 297, 135–144 10.1016/S0009-8981(00)00240-0 [DOI] [PubMed] [Google Scholar]
- 2. Perkins B. A., Ficociello L. H., Silva K. H., Finkelstein D. M., Warram J. H., and Krolewski A. S. (2003) Regression of microalbuminuria in type 1 diabetes. N. Engl. J. Med. 348, 2285–2293 10.1056/NEJMoa021835 [DOI] [PubMed] [Google Scholar]
- 3. Ibrahim H. N., and Hostetter T. H. (1997) Diabetic nephropathy. J. Am. Soc. Nephrol. 8, 487–493 [DOI] [PubMed] [Google Scholar]
- 4. Kanwar Y. S., Sun L., Xie P., Liu F. Y., and Chen S. (2011) A glimpse of various pathogenetic mechanisms of diabetic nephropathy. Annu. Rev. Pathol. 6, 395–423 10.1146/annurev.pathol.4.110807.092150 [DOI] [PMC free article] [PubMed] [Google Scholar]
- 5. Mogensen C. E., and Andersen M. J. (1973) Increased kidney size and glomerular filtration rate in early juvenile diabetes. Diabetes 22, 706–712 10.2337/diab.22.9.706 [DOI] [PubMed] [Google Scholar]
- 6. White K. E., and Bilous R. W. (2000) Type 2 diabetic patients with nephropathy show structural-functional relationships that are similar to type 1 disease. J. Am. Soc. Nephrol. 11, 1667–1673 [DOI] [PubMed] [Google Scholar]
- 7. Satriano J. (2007) Kidney growth, hypertrophy and the unifying mechanism of diabetic complications. Amino Acids 33, 331–339 10.1007/s00726-007-0529-9 [DOI] [PubMed] [Google Scholar]
- 8. Caramori M. L., and Mauer M. (2003) Diabetes and nephropathy. Curr. Opin. Nephrol. Hypertens. 12, 273–282 10.1097/00041552-200305000-00008 [DOI] [PubMed] [Google Scholar]
- 9. Drummond K., Mauer M., and International Diabetic Nephropathy Study Group (2002) The early natural history of nephropathy in type 1 diabetes: II. Early renal structural changes in type 1 diabetes. Diabetes 51, 1580–1587 10.2337/diabetes.51.5.1580 [DOI] [PubMed] [Google Scholar]
- 10. Awazu M., Omori S., Ishikura K., Hida M., and Fujita H. (2003) The lack of cyclin kinase inhibitor p27Kip1 ameliorates progression of diabetic nephropathy. J. Am. Soc. Nephrol. 14, 699–708 10.1097/01.ASN.0000051726.41601.C0 [DOI] [PubMed] [Google Scholar]
- 11. Oldham S., Montagne J., Radimerski T., Thomas G., and Hafen E. (2000) Genetic and biochemical characterization of dTOR, the Drosophila homolog of the target of rapamycin. Genes Dev. 14, 2689–2694 10.1101/gad.845700 [DOI] [PMC free article] [PubMed] [Google Scholar]
- 12. Inoki K. (2008) Role of TSC-mTOR pathway in diabetic nephropathy. Diabetes Res. Clin. Pract. 82, Suppl. 1, S59–S62 10.1016/j.diabres.2008.09.028 [DOI] [PubMed] [Google Scholar]
- 13. Sataranatarajan K., Mariappan M. M., Lee M. J., Feliers D., Choudhury G. G., Barnes J. L., and Kasinath B. S. (2007) Regulation of elongation phase of mRNA translation in diabetic nephropathy: amelioration by rapamycin. Am. J. Pathol. 171, 1733–1742 10.2353/ajpath.2007.070412 [DOI] [PMC free article] [PubMed] [Google Scholar]
- 14. Inoki K., Mori H., Wang J., Suzuki T., Hong S., Yoshida S., Blattner S. M., Ikenoue T., Rüegg M. A., Hall M. N., Kwiatkowski D. J., Rastaldi M. P., Huber T. B., Kretzler M., Holzman L. B., et al. (2011) mTORC1 activation in podocytes is a critical step in the development of diabetic nephropathy in mice. J. Clin. Investig. 121, 2181–2196 10.1172/JCI44771 [DOI] [PMC free article] [PubMed] [Google Scholar]
- 15. Dey N., Ghosh-Choudhury N., Das F., Li X., Venkatesan B., Barnes J. L., Kasinath B. S., and Ghosh Choudhury G. (2010) PRAS40 acts as a nodal regulator of high glucose-induced TORC1 activation in glomerular mesangial cell hypertrophy. J. Cell. Physiol. 225, 27–41 10.1002/jcp.22186 [DOI] [PMC free article] [PubMed] [Google Scholar]
- 16. Eid A. A., Ford B. M., Bhandary B., de Cassia Cavaglieri R., Block K., Barnes J. L., Gorin Y., Choudhury G. G., and Abboud H. E. (2013) Mammalian target of rapamycin regulates Nox4-mediated podocyte depletion in diabetic renal injury. Diabetes 62, 2935–2947 10.2337/db12-1504 [DOI] [PMC free article] [PubMed] [Google Scholar]
- 17. Sakaguchi M., Isono M., Isshiki K., Sugimoto T., Koya D., and Kashiwagi A. (2006) Inhibition of mTOR signaling with rapamycin attenuates renal hypertrophy in the early diabetic mice. Biochem. Biophys. Res. Commun. 340, 296–301 10.1016/j.bbrc.2005.12.012 [DOI] [PubMed] [Google Scholar]
- 18. Holz M. K., Ballif B. A., Gygi S. P., and Blenis J. (2005) mTOR and S6K1 mediate assembly of the translation preinitiation complex through dynamic protein interchange and ordered phosphorylation events. Cell 123, 569–580 10.1016/j.cell.2005.10.024 [DOI] [PubMed] [Google Scholar]
- 19. Livingstone M., Atas E., Meller A., and Sonenberg N. (2010) Mechanisms governing the control of mRNA translation. Phys. Biol. 7, 021001 10.1088/1478-3975/7/2/021001 [DOI] [PubMed] [Google Scholar]
- 20. Mariappan M. M., D'Silva K., Lee M. J., Sataranatarajan K., Barnes J. L., Choudhury G. G., and Kasinath B. S. (2011) Ribosomal biogenesis induction by high glucose requires activation of upstream binding factor in kidney glomerular epithelial cells. Am. J. Physiol. Renal Physiol. 300, F219–F230 10.1152/ajprenal.00207.2010 [DOI] [PMC free article] [PubMed] [Google Scholar]
- 21. Magnuson B., Ekim B., and Fingar D. C. (2012) Regulation and function of ribosomal protein S6 kinase (S6K) within mTOR signalling networks. Biochem. J. 441, 1–21 10.1042/BJ20110892 [DOI] [PubMed] [Google Scholar]
- 22. Sfakianos A. P., Mellor L. E., Pang Y. F., Kritsiligkou P., Needs H., Abou-Hamdan H., Désaubry L., Poulin G. B., Ashe M. P., and Whitmarsh A. J. (2018) The mTOR-S6 kinase pathway promotes stress granule assembly. Cell Death Differ. 25, 1766–1780 10.1038/s41418-018-0076-9 [DOI] [PMC free article] [PubMed] [Google Scholar]
- 23. Fenton T. R., and Gout I. T. (2011) Functions and regulation of the 70kDa ribosomal S6 kinases. Int. J. Biochem. Cell Biol. 43, 47–59 10.1016/j.biocel.2010.09.018 [DOI] [PubMed] [Google Scholar]
- 24. Zhang J., Guo J., Qin X., Wang B., Zhang L., Wang Y., Gan W., Pandolfi P. P., Chen W., and Wei W. (2018) The p85 isoform of the kinase S6K1 functions as a secreted oncoprotein to facilitate cell migration and tumor growth. Sci. Signal. 11, eaao1052 10.1126/scisignal.aao1052 [DOI] [PMC free article] [PubMed] [Google Scholar]
- 25. Schalm S. S., and Blenis J. (2002) Identification of a conserved motif required for mTOR signaling. Curr. Biol. 12, 632–639 10.1016/S0960-9822(02)00762-5 [DOI] [PubMed] [Google Scholar]
- 26. Lehman N., Ledford B., Di Fulvio M., Frondorf K., McPhail L. C., and Gomez-Cambronero J. (2007) Phospholipase D2-derived phosphatidic acid binds to and activates ribosomal p70 S6 kinase independently of mTOR. FASEB J. 21, 1075–1087 10.1096/fj.06-6652com [DOI] [PubMed] [Google Scholar]
- 27. Mariappan M. M., Shetty M., Sataranatarajan K., Choudhury G. G., and Kasinath B. S. (2008) Glycogen synthase kinase 3β is a novel regulator of high glucose- and high insulin-induced extracellular matrix protein synthesis in renal proximal tubular epithelial cells. J. Biol. Chem. 283, 30566–30575 10.1074/jbc.M801756200 [DOI] [PMC free article] [PubMed] [Google Scholar]
- 28. Gwalter J., Wang M. L., and Gout I. (2009) The ubiquitination of ribosomal S6 kinases is independent from the mitogen-induced phosphorylation/activation of the kinase. Int. J. Biochem. Cell Biol. 41, 828–833 10.1016/j.biocel.2008.08.018 [DOI] [PubMed] [Google Scholar]
- 29. Fenton T. R., Gwalter J., Cramer R., and Gout I. T. (2010) S6K1 is acetylated at lysine 516 in response to growth factor stimulation. Biochem. Biophys. Res. Commun. 398, 400–405 10.1016/j.bbrc.2010.06.081 [DOI] [PubMed] [Google Scholar]
- 30. Fenton T. R., Gwalter J., Ericsson J., and Gout I. T. (2010) Histone acetyltransferases interact with and acetylate p70 ribosomal S6 kinases in vitro and in vivo. Int. J. Biochem. Cell Biol. 42, 359–366 10.1016/j.biocel.2009.11.022 [DOI] [PubMed] [Google Scholar]
- 31. Hong S., Zhao B., Lombard D. B., Fingar D. C., and Inoki K. (2014) Cross-talk between sirtuin and mammalian target of rapamycin complex 1 (mTORC1) signaling in the regulation of S6 kinase 1 (S6K1) phosphorylation. J. Biol. Chem. 289, 13132–13141 10.1074/jbc.M113.520734 [DOI] [PMC free article] [PubMed] [Google Scholar]
- 32. Van Lint C., Emiliani S., and Verdin E. (1996) The expression of a small fraction of cellular genes is changed in response to histone hyperacetylation. Gene Expr. 5, 245–253 [PMC free article] [PubMed] [Google Scholar]
- 33. Kasinath B. S., Feliers D., Sataranatarajan K., Ghosh Choudhury G., Lee M. J., and Mariappan M. M. (2009) Regulation of mRNA translation in renal physiology and disease. Am. J. Physiol. Renal Physiol. 297, F1153–F1165 10.1152/ajprenal.90748.2008 [DOI] [PMC free article] [PubMed] [Google Scholar]
- 34. Zoncu R., Efeyan A., and Sabatini D. M. (2011) mTOR: from growth signal integration to cancer, diabetes and ageing. Nat. Rev. Mol. Cell Biol. 12, 21–35 10.1038/nrm3025 [DOI] [PMC free article] [PubMed] [Google Scholar]
- 35. Liu N., and Zhuang S. (2015) Treatment of chronic kidney diseases with histone deacetylase inhibitors. Front. Physiol. 6, 121 10.3389/fphys.2015.00121 [DOI] [PMC free article] [PubMed] [Google Scholar]
- 36. Mahimainathan L., Das F., Venkatesan B., and Choudhury G. G. (2006) Mesangial cell hypertrophy by high glucose is mediated by downregulation of the tumor suppressor PTEN. Diabetes 55, 2115–2125 10.2337/db05-1326 [DOI] [PubMed] [Google Scholar]
- 37. Kato M., Putta S., Wang M., Yuan H., Lanting L., Nair I., Gunn A., Nakagawa Y., Shimano H., Todorov I., Rossi J. J., and Natarajan R. (2009) TGF-β activates Akt kinase through a microRNA-dependent amplifying circuit targeting PTEN. Nat. Cell Biol. 11, 881–889 10.1038/ncb1897 [DOI] [PMC free article] [PubMed] [Google Scholar]
- 38. Das F., Bera A., Ghosh-Choudhury N., Abboud H. E., Kasinath B. S., and Choudhury G. G. (2014) TGFβ-induced deptor suppression recruits mTORC1 and not mTORC2 to enhance collagen I (α2) gene expression. PLoS One 9, e109608 10.1371/journal.pone.0109608 [DOI] [PMC free article] [PubMed] [Google Scholar]
- 39. Ghosh Choudhury G., Kim Y. S., Simon M., Wozney J., Harris S., Ghosh-Choudhury N., and Abboud H. E. (1999) Bone morphogenetic protein 2 inhibits platelet-derived growth factor-induced c-fos gene transcription and DNA synthesis in mesangial cells. Involvement of mitogen-activated protein kinase. J. Biol. Chem. 274, 10897–10902 10.1074/jbc.274.16.10897 [DOI] [PubMed] [Google Scholar]
- 40. Ghosh Choudhury G., and Abboud H. E. (2004) Tyrosine phosphorylation-dependent PI 3 kinase/Akt signal transduction regulates TGFβ-induced fibronectin expression in mesangial cells. Cell. Signal. 16, 31–41 10.1016/S0898-6568(03)00094-9 [DOI] [PubMed] [Google Scholar]
- 41. Gödel M., Hartleben B., Herbach N., Liu S., Zschiedrich S., Lu S., Debreczeni-Mór A., Lindenmeyer M. T., Rastaldi M. P., Hartleben G., Wiech T., Fornoni A., Nelson R. G., Kretzler M., Wanke R., et al. (2011) Role of mTOR in podocyte function and diabetic nephropathy in humans and mice. J. Clin. Investig. 121, 2197–2209 10.1172/JCI44774 [DOI] [PMC free article] [PubMed] [Google Scholar]
- 42. Dey N., Das F., Mariappan M. M., Mandal C. C., Ghosh-Choudhury N., Kasinath B. S., and Choudhury G. G. (2011) MicroRNA-21 orchestrates high glucose-induced signals to TOR complex 1, resulting in renal cell pathology in diabetes. J. Biol. Chem. 286, 25586–25603 10.1074/jbc.M110.208066 [DOI] [PMC free article] [PubMed] [Google Scholar]
- 43. Das F., Ghosh-Choudhury N., Mariappan M. M., Kasinath B. S., and Choudhury G. G. (2016) Hydrophobic motif site-phosphorylated protein kinase CβII between mTORC2 and Akt regulates high glucose-induced mesangial cell hypertrophy. Am. J. Physiol. Cell Physiol. 310, C583–C596 10.1152/ajpcell.00266.2015 [DOI] [PMC free article] [PubMed] [Google Scholar]
- 44. Schalm S. S., Fingar D. C., Sabatini D. M., and Blenis J. (2003) TOS motif-mediated raptor binding regulates 4E-BP1 multisite phosphorylation and function. Curr. Biol. 13, 797–806 10.1016/S0960-9822(03)00329-4 [DOI] [PubMed] [Google Scholar]
- 45. Nojima H., Tokunaga C., Eguchi S., Oshiro N., Hidayat S., Yoshino K., Hara K., Tanaka N., Avruch J., and Yonezawa K. (2003) The mammalian target of rapamycin (mTOR) partner, raptor, binds the mTOR substrates p70 S6 kinase and 4E-BP1 through their TOR signaling (TOS) motif. J. Biol. Chem. 278, 15461–15464 10.1074/jbc.C200665200 [DOI] [PubMed] [Google Scholar]
- 46. Wullschleger S., Loewith R., and Hall M. N. (2006) TOR signaling in growth and metabolism. Cell 124, 471–484 10.1016/j.cell.2006.01.016 [DOI] [PubMed] [Google Scholar]
- 47. Weng Q. P., Kozlowski M., Belham C., Zhang A., Comb M. J., and Avruch J. (1998) Regulation of the p70 S6 kinase by phosphorylation in vivo. Analysis using site-specific anti-phosphopeptide antibodies. J. Biol. Chem. 273, 16621–16629 10.1074/jbc.273.26.16621 [DOI] [PubMed] [Google Scholar]
- 48. Mukhopadhyay N. K., Price D. J., Kyriakis J. M., Pelech S., Sanghera J., and Avruch J. (1992) An array of insulin-activated, proline-directed serine/threonine protein kinases phosphorylate the p70 S6 kinase. J. Biol. Chem. 267, 3325–3335 [PubMed] [Google Scholar]
- 49. Ferrari S., Bannwarth W., Morley S. J., Totty N. F., and Thomas G. (1992) Activation of p70s6k is associated with phosphorylation of four clustered sites displaying Ser/Thr-Pro motifs. Proc. Natl. Acad. Sci. U.S.A. 89, 7282–7286 10.1073/pnas.89.15.7282 [DOI] [PMC free article] [PubMed] [Google Scholar]
- 50. Alessi D. R., Kozlowski M. T., Weng Q. P., Morrice N., and Avruch J. (1998) 3-Phosphoinositide-dependent protein kinase 1 (PDK1) phosphorylates and activates the p70 S6 kinase in vivo and in vitro. Curr. Biol. 8, 69–81 10.1016/S0960-9822(98)70037-5 [DOI] [PubMed] [Google Scholar]
- 51. Weng Q. P., Andrabi K., Kozlowski M. T., Grove J. R., and Avruch J. (1995) Multiple independent inputs are required for activation of the p70 S6 kinase. Mol. Cell. Biol. 15, 2333–2340 10.1128/MCB.15.5.2333 [DOI] [PMC free article] [PubMed] [Google Scholar]
- 52. Schalm S. S., Tee A. R., and Blenis J. (2005) Characterization of a conserved C-terminal motif (RSPRR) in ribosomal protein S6 kinase 1 required for its mammalian target of rapamycin-dependent regulation. J. Biol. Chem. 280, 11101–11106 10.1074/jbc.M413995200 [DOI] [PubMed] [Google Scholar]
- 53. Kato M., and Natarajan R. (2014) Diabetic nephropathy—emerging epigenetic mechanisms. Nat. Rev. Nephrol. 10, 517–530 10.1038/nrneph.2014.116 [DOI] [PMC free article] [PubMed] [Google Scholar]
- 54. Bera A., Das F., Ghosh-Choudhury N., Mariappan M. M., Kasinath B. S., and Ghosh Choudhury G. (2017) Reciprocal regulation of miR-214 and PTEN by high glucose regulates renal glomerular mesangial and proximal tubular epithelial cell hypertrophy and matrix expansion. Am. J. Physiol. Cell Physiol. 313, C430–C447 10.1152/ajpcell.00081.2017 [DOI] [PMC free article] [PubMed] [Google Scholar]
- 55. Das F., Ghosh-Choudhury N., Kasinath B. S., and Choudhury G. G. (2018) Tyrosines-740/751 of PDGFRβ contribute to the activation of Akt/Hif1α/TGFβ nexus to drive high glucose-induced glomerular mesangial cell hypertrophy. Cell. Signal. 42, 44–53 10.1016/j.cellsig.2017.09.017 [DOI] [PMC free article] [PubMed] [Google Scholar]
- 56. Eckschlager T., Plch J., Stiborova M., and Hrabeta J. (2017) Histone deacetylase inhibitors as anticancer drugs. Int. J. Mol. Sci. 18, E1414 10.3390/ijms18071414 [DOI] [PMC free article] [PubMed] [Google Scholar]
- 57. Pang M., Kothapally J., Mao H., Tolbert E., Ponnusamy M., Chin Y. E., and Zhuang S. (2009) Inhibition of histone deacetylase activity attenuates renal fibroblast activation and interstitial fibrosis in obstructive nephropathy. Am. J. Physiol. Renal Physiol. 297, F996–F1005 10.1152/ajprenal.00282.2009 [DOI] [PMC free article] [PubMed] [Google Scholar]
- 58. Marumo T., Hishikawa K., Yoshikawa M., Hirahashi J., Kawachi S., and Fujita T. (2010) Histone deacetylase modulates the proinflammatory and -fibrotic changes in tubulointerstitial injury. Am. J. Physiol. Renal Physiol. 298, F133–F141 10.1152/ajprenal.00400.2009 [DOI] [PubMed] [Google Scholar]
- 59. Manson S. R., Song J. B., Hruska K. A., and Austin P. F. (2014) HDAC dependent transcriptional repression of Bmp-7 potentiates TGF-β mediated renal fibrosis in obstructive uropathy. J. Urol. 191, 242–252 10.1016/j.juro.2013.06.110 [DOI] [PMC free article] [PubMed] [Google Scholar]
- 60. Yoshikawa M., Hishikawa K., Marumo T., and Fujita T. (2007) Inhibition of histone deacetylase activity suppresses epithelial-to-mesenchymal transition induced by TGF-β1 in human renal epithelial cells. J. Am. Soc. Nephrol. 18, 58–65 10.1681/ASN.2005111187 [DOI] [PubMed] [Google Scholar]
- 61. Komorowsky C., Ocker M., and Goppelt-Struebe M. (2009) Differential regulation of connective tissue growth factor in renal cells by histone deacetylase inhibitors. J. Cell. Mol. Med. 13, 2353–2364 10.1111/j.1582-4934.2008.00674.x [DOI] [PMC free article] [PubMed] [Google Scholar]
- 62. Noh H., Oh E. Y., Seo J. Y., Yu M. R., Kim Y. O., Ha H., and Lee H. B. (2009) Histone deacetylase-2 is a key regulator of diabetes- and transforming growth factor-β1-induced renal injury. Am. J. Physiol. Renal Physiol. 297, F729–F739 10.1152/ajprenal.00086.2009 [DOI] [PubMed] [Google Scholar]
- 63. Park J., Kim M., Kang S. G., Jannasch A. H., Cooper B., Patterson J., and Kim C. H. (2015) Short-chain fatty acids induce both effector and regulatory T cells by suppression of histone deacetylases and regulation of the mTOR-S6K pathway. Mucosal Immunol. 8, 80–93 10.1038/mi.2014.44 [DOI] [PMC free article] [PubMed] [Google Scholar]
- 64. Wakino S., Hasegawa K., and Itoh H. (2015) Sirtuin and metabolic kidney disease. Kidney Int. 88, 691–698 10.1038/ki.2015.157 [DOI] [PMC free article] [PubMed] [Google Scholar]
- 65. Wang X., Liu J., Zhen J., Zhang C., Wan Q., Liu G., Wei X., Zhang Y., Wang Z., Han H., Xu H., Bao C., Song Z., Zhang X., Li N., et al. (2014) Histone deacetylase 4 selectively contributes to podocyte injury in diabetic nephropathy. Kidney Int. 86, 712–725 10.1038/ki.2014.111 [DOI] [PubMed] [Google Scholar]
- 66. Maity S., Bera A., Ghosh-Choudhury N., Das F., Kasinath B. S., and Choudhury G. G. (2018) microRNA-181a downregulates deptor for TGFβ-induced glomerular mesangial cell hypertrophy and matrix protein expression. Exp. Cell Res. 364, 5–15 10.1016/j.yexcr.2018.01.021 [DOI] [PMC free article] [PubMed] [Google Scholar]
- 67. Montagne J., Stewart M. J., Stocker H., Hafen E., Kozma S. C., and Thomas G. (1999) Drosophila S6 kinase: a regulator of cell size. Science 285, 2126–2129 10.1126/science.285.5436.2126 [DOI] [PubMed] [Google Scholar]
- 68. Fingar D. C., Salama S., Tsou C., Harlow E., and Blenis J. (2002) Mammalian cell size is controlled by mTOR and its downstream targets S6K1 and 4EBP1/eIF4E. Genes Dev. 16, 1472–1487 10.1101/gad.995802 [DOI] [PMC free article] [PubMed] [Google Scholar]
- 69. Pende M., Um S. H., Mieulet V., Sticker M., Goss V. L., Mestan J., Mueller M., Fumagalli S., Kozma S. C., and Thomas G. (2004) S6K1−/−/S6K2−/− mice exhibit perinatal lethality and rapamycin-sensitive 5′-terminal oligopyrimidine mRNA translation and reveal a mitogen-activated protein kinase-dependent S6 kinase pathway. Mol. Cell. Biol. 24, 3112–3124 10.1128/MCB.24.8.3112-3124.2004 [DOI] [PMC free article] [PubMed] [Google Scholar]
- 70. Pende M., Kozma S. C., Jaquet M., Oorschot V., Burcelin R., Le Marchand-Brustel Y., Klumperman J., Thorens B., and Thomas G. (2000) Hypoinsulinaemia, glucose intolerance and diminished β-cell size in S6K1-deficient mice. Nature 408, 994–997 10.1038/35050135 [DOI] [PubMed] [Google Scholar]
- 71. Shima H., Pende M., Chen Y., Fumagalli S., Thomas G., and Kozma S. C. (1998) Disruption of the p70s6k/p85s6k gene reveals a small mouse phenotype and a new functional S6 kinase. EMBO J. 17, 6649–6659 10.1093/emboj/17.22.6649 [DOI] [PMC free article] [PubMed] [Google Scholar]
- 72. Ohanna M., Sobering A. K., Lapointe T., Lorenzo L., Praud C., Petroulakis E., Sonenberg N., Kelly P. A., Sotiropoulos A., and Pende M. (2005) Atrophy of S6K1−/− skeletal muscle cells reveals distinct mTOR effectors for cell cycle and size control. Nat. Cell Biol. 7, 286–294 10.1038/ncb1231 [DOI] [PubMed] [Google Scholar]
- 73. Chen J. K., Chen J., Thomas G., Kozma S. C., and Harris R. C. (2009) S6 kinase 1 knockout inhibits uninephrectomy- or diabetes-induced renal hypertrophy. Am. J. Physiol. Renal Physiol. 297, F585–F593 10.1152/ajprenal.00186.2009 [DOI] [PMC free article] [PubMed] [Google Scholar]
- 74. Choudhury G. G., Ghosh-Choudhury N., and Abboud H. E. (1998) Association and direct activation of signal transducer and activator of transcription1α by platelet-derived growth factor receptor. J. Clin. Investig. 101, 2751–2760 10.1172/JCI1044 [DOI] [PMC free article] [PubMed] [Google Scholar]
- 75. Das F., Ghosh-Choudhury N., Bera A., Dey N., Abboud H. E., Kasinath B. S., and Choudhury G. G. (2013) Transforming growth factor β integrates Smad 3 to mechanistic target of rapamycin complexes to arrest deptor abundance for glomerular mesangial cell hypertrophy. J. Biol. Chem. 288, 7756–7768 10.1074/jbc.M113.455782 [DOI] [PMC free article] [PubMed] [Google Scholar]
- 76. Shultz P. J., DiCorleto P. E., Silver B. J., and Abboud H. E. (1988) Mesangial cells express PDGF mRNAs and proliferate in response to PDGF. Am. J. Physiol. Renal Physiol. 255, F674–F684 10.1152/ajprenal.1988.255.4.F674 [DOI] [PubMed] [Google Scholar]
- 77. Kim D. H., Sarbassov D. D., Ali S. M., King J. E., Latek R. R., Erdjument-Bromage H., Tempst P., and Sabatini D. M. (2002) mTOR interacts with raptor to form a nutrient-sensitive complex that signals to the cell growth machinery. Cell 110, 163–175 10.1016/S0092-8674(02)00808-5 [DOI] [PubMed] [Google Scholar]
- 78. Sarbassov D. D., Ali S. M., Kim D. H., Guertin D. A., Latek R. R., Erdjument-Bromage H., Tempst P., and Sabatini D. M. (2004) Rictor, a novel binding partner of mTOR, defines a rapamycin-insensitive and raptor-independent pathway that regulates the cytoskeleton. Curr. Biol. 14, 1296–1302 10.1016/j.cub.2004.06.054 [DOI] [PubMed] [Google Scholar]


