

Abstract
Affinity purification followed by mass spectrometry has become the technique of choice to identify binding partners in biochemical complexes isolated from a physiologic cellular context. In this report we detail our protocol for tandem affinity purification (TAP) primarily based on the use of the FLAG and HA peptide epitopes, with a particular emphasis on factors affecting yield and specificity, as well as steps to implement an automated version of the TAP procedure.
Keywords: TAP, affinity purification, mass spectrometry, protein complex, protein-protein interaction, epitope tags
INTRODUCTION
Affinity chromatography is a long-established method for the purification of proteins and other macromolecules (Arsenis & McCormick, 1964; Lerman, 1953; Silman & Katchalski, 1966). Although this technique is designed around a specific interaction between two components (such as between an antibody and its epitope), it typically suffers from low yield and non-specific interactions, particularly when the target of interest is purified from a complex matrix, often precluding robust analysis of constituent components. In addition, analysis of a target protein often requires the identification, characterization, or development of a new affinity reagent, drastically impeding the creation and systematic use of standardized protocols. These limitations were overcome two decades ago thanks to the development of the Tandem Affinity Purification (TAP) method (Rigaut et al., 1999). In its first implementation, the TAP procedure utilized a combination of protein A and calmodulin-binding peptide (CBP) as affinity tags (Puig et al., 2001; Rigaut et al., 1999). This strategy has been used to map protein-protein interactions in yeast (Gavin et al., 2002) and mammalian cells (Bouwmeester et al., 2004). Despite initial successes, the protein A-CBP tandem tag exhibits relatively poor yield and has found limited use in mammalian cells. Recognizing the potential of TAP, Nakatani et al. introduced the use of FLAG and HA peptide tags for sequential immuno-affinity purification (Nakatani & Ogryzko, 2003). In the ensuing years, researchers have employed other peptide or polypeptide epitopes such as V5, MYC and GFP (Maerki et al., 2009; Trinkle-Mulcahy et al., 2008), in addition to affinity tags which do not rely on antigen-antibody recognition such as the interaction between StrepTactin (an engineered version of streptavidin) and the Strep tag II sequence (Gloeckner, Boldt, Schumacher, Roepman, & Ueffing, 2007; Schmidt & Skerra, 2007). The original TAP method and its derivatives all provide a dramatic increase in specificity obtained through the use of two successive and orthogonal affinity purification steps.
This unit presents detailed instructions to identify binding partners of a protein of interest (POI) using Tandem Affinity Purification and mass spectrometry (TAP-MS). Basic Protocol 1 provides instructions for cloning the cDNA for the POI into vectors encoding the FLAG and HA (pOZ vectors) or the FLAG and Strep-tag II (SII) epitope tags (pST vectors). Basic Protocol 2 outlines steps to establish stable cell lines from which a tagged Protein of Interest (tPOI) will be purified. The preparation of anti-IL2Rα affinity beads used to purify infected is detailed in Support Protocol 1. Basic Protocol 3 describes steps to prepare subcellular fractions prior to protein extraction and measurement of tPOI expression level (Basic Protocol 4). Basic Protocol 5 presents steps to execute a tandem affinity purification and describes the use of quality controls to monitor the yield and specificity of the purification process. Alternate Protocol 5 provides instructions to execute an automated tandem affinity purification using a KingFisher bead processor. Preparation of anti-HA magnetic agarose affinity reagent is presented in Support Protocol 2. Basic Protocol 6 describes the steps to prepare TAP samples for mass spectrometry analysis. The different stages of the project are illustrated in a workflow diagram in Figure 1.
Figure 1:
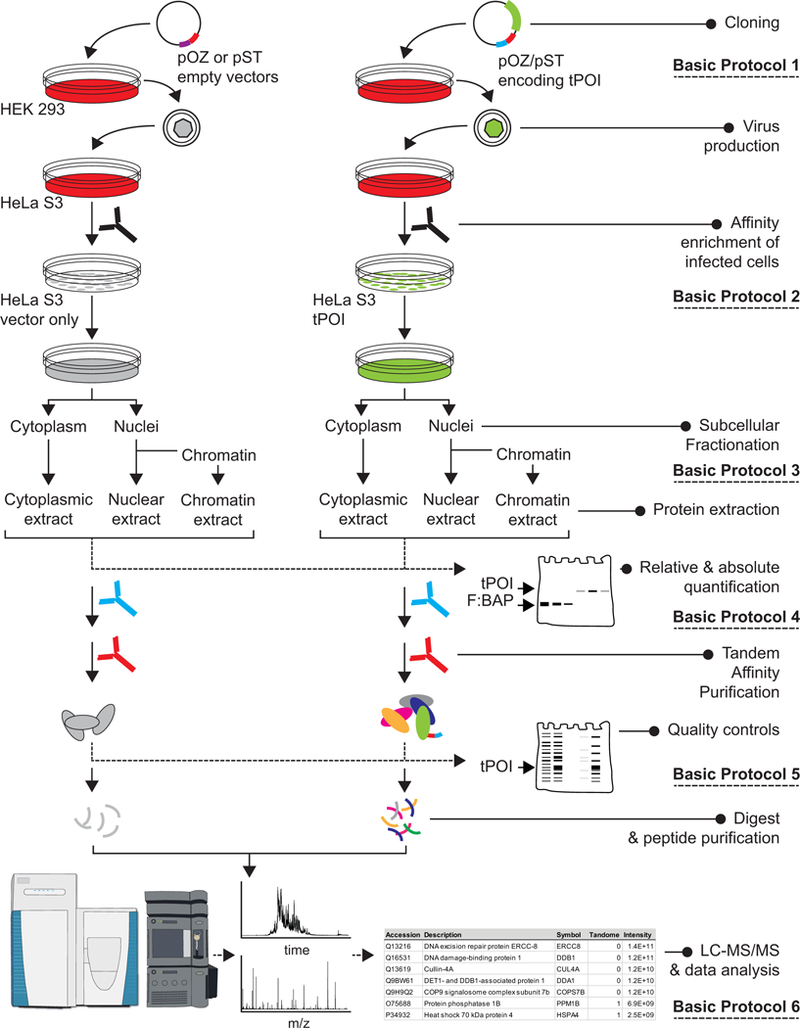
Overview of the Basic Protocols described in this section.
BASIC PROTOCOL 1
DESIGNING AND CLONING OF RETROVIRAL EXPRESSION VECTORS FOR TANDEM AFFINITY PURIFICATION
A variety of epitope tags have been described over the years; we have developed our protocols primarily around FLAG-HA (Adelmant et al., 2012) and FLAG-Strep-tag II (SII) peptide tags (Hill et al., 2014). These tags are short and the strong binding to their affinity module is readily reversed by competitive elution. This characteristic enables efficient enrichment of the target from complex cellular matrices while simultaneously allowing selective elution under non-denaturing conditions from the affinity resin. Use of these affinity tags provides two stages of specificity (capture and elution) and permits recovery of functional protein complexes (Groisman et al., 2003). A short amino acid spacer is typically inserted between the POI and the two peptide tags to increase accessibility and minimize interference with binding of interacting partners. We have used the original Mo-MuLV-based retroviral vectors (pOZ-N and pOZ-C (Nakatani & Ogryzko, 2003)) for tandem FLAG and HA purification and have more recently engineered similar vectors (pST-N and pST-C) for FLAG and SII purification workflows (Hill et al., 2014). These vectors include the coding sequence for interleukin-2 receptor alpha polypeptide (IL2Rα) which serves as a surface selection marker. An Internal Ribosome Entry Site (IRES) sequence between the coding sequence for the tPOI and the selection marker ensures that cells positive for IL2Rα will also express the tPOI. Note that packaging constraints associated with retroviral vectors limit the maximal size of inserted cDNA to about 4000 bp, corresponding to proteins with molecular weight less than ~150 kDa.
We recommend that two cell lines be established, with the tags inserted at the N- or C-terminus of the POI. The choice to continue the study with one of these two constructs can be determined following an initial round of TAP.
MATERIALS
cDNA from cells or tissues expressing the protein of interest
pOZ or pST vectors (available from the authors upon request)
Target-specific primers:
For all primers, include 4 nucleotides “nnnn” to facilitate restriction enzyme cleavage after target amplification by PCR. Substitute codons indicated between square brackets with the target-specific sequence.
For pOZ-N and pST-N:
Forward primer: 5’-nnnnctcgag[codon+2:codon+6]-3’ XhoI
Do not include the codon for the initiator Methionine
Reverse primer: 5’-nnnngcggccgcCTA[codon-1:codon-5]-3’ NotI Stop Rev. Compl.
For pOZ-C and pST-C:
Forward primer: 5’-nnnnctcgagcaccATG[codon+2:codon+5]-3’ XhoI Kozak
Reverse primer: 5’-nnnngcggccgc[codon-1:codon-5] −3’ NotI Rev. Compl.
Do not include the STOP codon
For sequencing (pOZ and pST vectors):
From the 5’: 5’-ggcatcgcagcttggatacac-3’
From the 3’: 5’-ccgctagagggaaaccgttgtg-3’
High-fidelity DNA polymerase such as Phusion High-Fidelity DNA Polymerase (New England Biolabs, cat. no. M0530S)
dNTP mix (New England Biolabs, cat. no. N0447)
Nuclease-free water
XhoI and NotI restriction enzymes (New England Biolabs, cat. no. R0146S and R0189S)
Restriction enzyme buffer NEBuffer 3.1 (New England Biolabs, cat. no. B7203S)
T4 DNA ligase (1 U/µL), Thermo Fisher Scientific (ThermoFisher, cat. no. 15224017)
1.2 % agarose gel with ethidium bromide (0.5 µg/mL)
Nucleic acid gel extraction and purification kit such as QIAquick Gel Extraction Kit (Qiagen, cat. no. 28704)
Bacterial growth media: LB ampicilin (100 µg/mL), LB agar plates with Ampicilin (50 µg/mL)
Electrocompetent E. coli cells, such as NEB 10-beta (New England Biolabs, cat. no. C3020)
Plasmid preparation kit such as QIAprep Spin Miniprep and Midiprep Kits (Qiagen, cat. no. 27104 and 12143)
Autoclave-sterilized 80% (v/v) glycerol
1.5 mL microcentrifuge tube
Tubes for thermal cycling amplification
Thermal cycler
Electroporator
1 mm gap electroporation cuvettes
14 mL round bottom snap-cap tube
37°C incubator and orbital incubator
For additional reagents and equipment for polymerase chain reaction, see https://doi.org/10.1002/0471140864.psa04js29.
For DNA separation and visualization, and agarose gel electrophoresis, see https://doi.org/10.1002/0471140864.psa04fs13. For UV spectrophotometry, see https://doi.org/10.1002/0471140864.psa04ks52. For E. coli culturing, see https://doi.org/10.1002/0471140864.psa04bs13
PCR AMPLIFICATION OF TARGET CDNA
-
1
In a PCR tube placed on ice, assemble nuclease-free water, cDNA (1 ng), forward and reverse primers (0.5 µM each), dNTP mix (1 µL), reaction buffer (10 µL) and DNA polymerase (0.5 µL) in a final volume of 50 µL.
-
2
Perform PCR amplification using an initial denaturation step at 94°C for 5 minutes, followed by 30 cycles consisting of a denaturation step at 94°C for 30 sec, an annealing step at 57°C (this temperature may need to be adjusted according to the primer pair Tm) for 30 sec and a primer extension step at 72°C for 1 min per kb of cDNA target. Finish with a final extension step at 72°C for 10 minutes.
-
3
Analyze 5 µL of the PCR product on a 1.2% agarose gel to ensure that a single band of size corresponding to the intended target was amplified.
-
4
Purify the PCR product using the QIAquick PCR & Gel Cleanup Kit.
LIGATE RETROVIRAL VECTOR AND TARGET DNA
-
5
In a 1.5 mL microcentrifuge tube combine one half of the purified PCR product, 10 units of each XhoI and NotI restriction enzymes, reaction buffer (NEBuffer 3.1) and add nuclease free water to a final volume of 50 µL.
-
6
In a second 1.5 mL microcentrifuge tube combine the 5 µg of retroviral vector (pOZ-N or -C, pST-N or -C), 10 units of each XhoI and NotI restriction enzymes, reaction buffer (NEBuffer 3.1) and add nuclease free water to a final volume of 50 µL.
-
7
Digest the target and vector DNA for 2 hours at 37°C.
-
8
Purify both restriction digests products using the QIAquick Gel Extraction Kit.
-
9
Analyze 2% of the digested vector and 10% of the digested PCR product on a 1.2% agarsoe gel and estimate their relative concentrations.
-
10
Combine digested vector (20 ng) and digested PCR product at a 1:5 molar ratio. Add 1 µL of T4 DNA ligase and its buffer and bring the volume to 20 µL with nulcease-free water.
-
11
Incubate overnight at room temperature.
TRANSFORM E. COLI CELLS AND IDENTIFY RECOMBINANT VECTORS
-
12
Set the electroporator voltage to 1.8 kV, capacitance to 25 μF and resistance to 300 Ω.
-
13
Cool electroporation cuvettes on ice.
-
14
Add 20 µL of Milli-Q water to each cuvette.
-
15
Thaw electrocompetent cells on ice.
-
16
For each ligase reaction, perform the following steps.Add 1 µL of ligation reaction to a cuvette.
-
17
Add 20 µL of electrocompetent cells and gently mix up and down once.
-
18
Place cuvette on ice for 1 minute.
-
19
Quickly dry the cuvette electrodes and place in the electroporator chamber.
-
20
Apply the electric pulse using the parameter listed above.
-
21
Add 200 µL of outgrowth medium and quickly transfer electroporated cells to a round-bottom snap-cap tube.
-
22
Place the tube with transfected cells on an orbital shaker and allow cells to recover for 1 hr. at 37°C.
-
23
Spread 20 µL of each transfection on an agar plate containing ampicillin (50 µg/mL) and incubate overnight at 37°C.
-
24
Pick 6 well-isolated colonies and inoculate each in 2 mL of LB-Amp. Grow the cultures overnight on an orbital shaker at 37°C.
-
25
Purify plasmid DNA from 500 µL of each culture using the QIAprep Spin Miniprep Kit.
-
26
Perform restriction digests for 30 minutes at 37°C using 5 units of XhoI and NotI on 5 µL of each of the six plasmid preparations. Analyze digests by electrophoresis on a 1.2% agarose gel. Clones with the appropriate recombinant vector will show two bands, one corresponding to the size of vector and the other to the size of the insert. Keep the remaining cultures at 4°C until sequence validation.
-
27
Confirm the sequence of selected constructs by DNA sequencing. Also verify that the coding sequence of the protein of interest is in the appropriate open reading frames relative to the sequence encoding the tags and the stop codon.
-
28
Prepare a glycerol stock by adding 200 µL of 80% (v/v) glycerol to the 800 µL of the selected culture. Mix thoroughly and store at ─80°C. The stocks are stable for several years.
BASIC PROTOCOL 2
ESTABLISHING A STABLE CELL LINE EXPRESSING A TAP-TAGGED PROTEIN
The choice of a cell line for TAP-MS should be made after considering two main factors: biochemical tractability and biological relevance. We find that HeLa S3 cells adapted to grow in suspension represent a good starting point, particularly for those new to biochemical purification of multi-component protein complexes. HeLa S3 cells are highly amenable to viral transduction and will tolerate expression of a variety of protein types (Adelmant et al., 2012; Durzynska et al., 2017; Ferry et al., 2017; Hill et al., 2014; Kim et al., 2014; Lee, Adelmant, Marto, & Lee, 2015; Miotto et al., 2018; Quan, Adelmant, Marto, Look, & Yusufzai, 2014; Sand-Dejmek et al., 2011; Simarro et al., 2010; Uljon et al., 2016; Wang, Moore, Adelmant, Marto, & Silver, 2013; Zhou et al., 2010). In addition, these cells are readily fractionated into subcellular compartments and are easy and inexpensive to grow in large quantities. Regardless of the choice of cell line for TAP-MS, a negative control is essential to assess the performance of the purification. Here, one can choose to work either with parental (uninfected) cells or with cells established with the empty pOZ or pST vectors. The original pOZ vectors (and their derivative pST) were designed to encode the selection marker IL2Rα. The expression of IL2Rα is physically coupled to the expression of tPOI through an Internal Ribosome Entry Site (IRES) sequence, thereby minimizing the risk of obtaining cells expressing the selection marker but not the tPOI. Unlike other selection methods which are based on the expression of antibiotic resistance genes (such as puromycin N-acetyl-transferase), selection of IL2Rα positive cells is very quick (binding occurs within minutes), does not affect cell metabolism and can be performed multiple times to achieve the highest level of purity. The first step to establish a stable cell line expressing the tPOI is to produce viral particles. This is achieved by co-transfecting the retroviral DNA plasmid and the vectors encoding GAG-POL and VSV-G into HEK293 cells. Note that achieving the highest transfection efficiency while maintaining cell viability is critical to produce high viral titers. The transfected cell supernatants containing viral particles are then used to transduce the target cell line. Infected cells are easily enriched using magnetic beads coated with anti-IL2Rα antibody 3 days after viral transduction. A second purification is performed at day 6 or 7 to ensure that all cells in the population express the IL2Rα marker and the tPOI. The two stages of selection minimize the risk of a small number of uninfected cells overtaking the population. This can occur after a limited number of doublings if expression of the tPOI imparts even a modest growth disadvantage to infected cells.
Over the past several years we have constructed numerous vectors encoding FLAG-HA and FLAG-SII tagged proteins and established corresponding stable HeLa S3 cell lines (Table 1), several of which are described in the accompanying figures; our vector reagents may be useful to troubleshoot viral production and cell line generation. Our cell lines may be useful to troubleshoot the purification. These reagents are available upon request.
Table 1:
Available retroviral vectors and corresponding HeLa S3 cell lines:
| Retroviral vector | Gene | Epitope tags | Tags location |
|---|---|---|---|
| pOZN | N/A | FLAG:HA | N-term |
| pOZC | N/A | FLAG:HA | C-term |
| pSTN | N/A | FLAG:SII | N-term |
| pSTC | N/A | FLAG:SII | C-term |
| pOZN-PRMT5 | PRMT5 | FLAG:HA | N-term |
| pSTN-PRMT5 | PRMT5 | FLAG:SII | N-term |
| pOZN-RIOK1 | RIOK1 | FLAG:HA | N-term |
| pSTN-RIOK1 | RIOK1 | FLAG:SII | N-term |
| pOZN-WDR77 | WDR77 | FLAG:HA | N-term |
| pSTN-WDR77 | WDR77 | FLAG:SII | N-term |
| pOZC-ERCC8 | ERCC8 | FLAG:HA | C-term |
| pSTC-ERCC8 | ERCC8 | FLAG:SII | C-term |
| pSTC-PSF | PSF | FLAG:SII | C-term |
| pOZN-hnRNPH1 | hnRNPH | FLAG:HA | N-term |
| pSTN-hnRNPH1 | hnRNPH | FLAG:SII | N-term |
MATERIALS
Sequence-validated pOZ or pST retroviral vectors expressing tPOI
pCG-GAG-POL and pCG-VSV-G vectors (Richard Mulligan lab, Harvard Medical School, Boston)
pAcGFP1-C1 (Promega, cat. no. 632470)
HeLa-S3 (ATCC, cat. no. CCL2.2) adapted to grow in suspension
HEK 293 (ATCC, cat. no. CRL- 1573)
DMEM (ThermoFisher, cat. no. 11965–092)
DPBS (ThermoFisher, cat. no. 14190–144)
Bovine Growth Serum (GE Healthcare Life Sciences, cat. no. SH3054103)
Complete growth media: DMEM containing 10% (v/v) of Bovine Growth Serum
PBS/BSA: DPBS containing 0.1% BSA (w/v), 0.2 µm filter-sterilized
Versene Solution (ThermoFisher, cat. no. 15040–066)
Superfect (Qiagen cat. no. 301305)
Polybrene (Hexadimethrine bromide, Sigma, cat. no. H9268)
IgG-free BSA (Jackson Immunoresearch cat. no. 001–000-161)
anti-IL2 Receptor alpha (Millipore/Upstate Biotech cat. no. 05–170)
T75 Flasks (Corning, cat no. 353136)
15 cm plates (Corning, cat. no. 430599)
6 cm plates (Corning, cat. no. 353002)
15 mL conical tubes (Corning centriStar, cat. no. 430790)
50 mL conical tubes (Corning centriStar, cat. no. 430820)
0.45 µm cellulose acetate filter (Whatman cat. no. 6901–2504)
Dynabeads M-450 Goat anti-Mouse IgG (Invitrogen cat. no. 110–33)
VIRAL PARTICLE PRODUCTION
Viral particles pseudotyped with VSV-G are amphotropic and can infect human cells. Perform all tissue culture procedures in Biosafety level 2 cabinet and follow appropriate measures for working with infectious materials.
-
1Seed 4 × 10⁶ HEK 293 cells per 6 cm tissue culture plate in 4 mL of complete media 24 hours before transfection.
- Ensure that cells are 80–90% confluent the day of transfection.
-
2Combine 5 µg of retroviral vector (e.g.: pOZ-tPOI) and 2.5 µg of each pCG GAG-POL and pCG-VSV-G vectors. Add OPTI-MEM to bring the volume to 150 µL.
- Separately transfect 10 µg of a vector expressing a fluorescent protein (such as pAcGFP1-C1) as a positive control for the transfection.
-
3
Mix gently and add 50 µL of Superfect to each DNA mixture.
-
4
During the 5-minute DNA-liposome complex formation, aspirate culture media and add 2 mL of complete growth media.
-
5
Dispense DNA-liposome complex in a dropwise manner over the entire surface of the plate.
-
6
After 8 hours at 37°C, add 2 mL of complete growth media.
-
7
16 hours after transfection, aspirate media and add 4 mL of complete growth media.
-
8
After 24 hours, collect media containing viral particles and store at 4°C. Add 4 mL of complete growth media to plates and return them to the incubator. Collect media after an additional 24 hours and combine with previous viral supernatant.
-
9Slowly filter combined viral supernatants through a 0.45 µm cellulose acetate filter. Make four 2-mL aliquots and store at −80°C.
- Filter supernatant slowly (drop by drop) to minimize damage to viral envelope.
CELL TRANSDUCTION.
-
10
For each vector, seed cells in three 6 cm plates to attain 40% confluency (1 × 10⁶ for HeLa-S3 cells) after 24 hours.
-
11
Add 100, 500 or 2500 µL of the viral stock to plates seeded in step 1, keeping total volume at 4 mL and add polybrene to a final concentration of 4 μg/mL.
-
12
Let cells grow for 48 hours without removing the viral supernatant.
CELL SELECTION
-
13Detach infected HeLa S3 cells using versene, resuspend in 4 mL of complete growth media and transfer to a 15 mL conical tube.
- For adherent cells, detach cells from plate using 0.05% trypsin solution. Transfer trypsinized cells to a 15 mL conical tube using 10 mL of complete growth media. Pellet cells at 300 × g for 5 minutes and resuspend cell pellet in 4 mL of complete growth media.
-
14
Add 20 µL of anti-IL2Rα coated bead slurry to each tube (Support Protocol 1).
-
15
Incubate cells with bead slurry for one hour in the incubator, inverting the tube every 10 minutes.
-
16
Collect infected cells by placing the tube in a magnetic rack for 2 minutes and remove the supernatant.
-
17Remove tube from magnetic rack and resuspend cells in 4 mL of complete media.
- Pipet the suspension slowly to minimize damage to cells.
-
18Repeat the steps 16 and 17 two more times.
- The purpose of these washes is to remove non-infected cells. Three washes are usually enough. If uninfected cells (with no beads attached) are observed in the next stage, more washes should be included.
-
19
Transfer a 20 µL aliquot of the cell suspension to a glass slide, cover with a coverslip and examine under microscope. Nearly all cells should have one or more magnetic bead attached to its surface. Otherwise, repeat washes until this is the case.
-
20
Transfer washed cells to a 6 cm plate.
-
21
Monitor cell culture density every day.
-
22
Split cells at a 1:4 ratio when they reach 80% confluence.
-
23
Repeat selection process (steps 4–10) when cells are 80% confluent.
-
24
Continue to expand cultures, setting aside one 6 cm plate for protein extraction and western blot analysis to verify expression of the protein of interest. Make three or more frozen liquid nitrogen stocks of each cell line.
SUPPORT PROTOCOL 1
In this protocol, magnetic beads are coated with Anti-ILR2A antibody for use in Basic Protocol 2. These beads can be prepared in advanced and stored.
PREPARING MAGNETIC BEADS COATED WITH THE ANTI-IL2RΑ ANTIBODY
Wash 1 mL of Goat anti-Mouse IgG bead slurry with 5 mL of PBS/BSA solution.
Repeat the wash step two more times.
Dilute 25 µL of anti-IL2 receptor alpha antibody into 1 mL of sterile PBS/BSA and filter through a 0.2 µm filter.
Add diluted antibody to magnetic beads and rotate end over end overnight at 4°C.
Collect beads using a magnetic rack apparatus and remove supernatant.
Remove tube from magnetic rack and resuspend beads in 4 mL of PBS/BSA.
Repeat wash 3 times and resuspend beads in a final volume of 1 mL. The concentration of beads in the final suspension is 4 × 10⁸ beads/mL. The bead suspension can be stored for several months at 4°C.
BASIC PROTOCOL 3
HELA-S3 CELL CULTURE AND SUBCELLULAR FRACTIONATION
Subcellular fractionation serves as a first purification stage by reducing sample complexity. The process also helps minimize dilution of the tPOI. For example, the packed cell volume from 3 × 10⁸ HeLa S3 cells is roughly 1.2 mL. To efficiently lyse this pellet would require at least 6 mL of a detergent-containing buffer for a final volume of total extract of ~ 7 mL. By contrast subcellular fractionation of these cells will yield a cytoplasmic fraction of only 3 mL and a crude nuclear pellet of 400 µL. The nuclear pellet can be solubilized with 1.6 mL of buffer for a final nuclear extract of ~ 2 mL. For the chromatin fraction, the typical extract volume post chromatin digestion will be at most 400 µL.
Note that the fractionation protocol described in Basic Protocol 3 works well for HeLa-S3 grown in suspension. Fractionation of other cell types will likely require modifications to this protocol.
MATERIALS
HeLa S3 control cell line and tPOI-expressing cell line (Basic Protocol 2)
2-mercaptoethanol (Sigma-Aldrich, cat. no. M7154)
Hypotonic buffer (see Reagents and Solutions)
7 mL Dounce homogenizers such as Kimble Kontes (Sigma-Aldrich, cat. no. D9063–1SET).
Cell lifter (Costar, cat. no. 3008)
Glass slides such as Corning Frosted Microscope Slides (Fisher Scientific 12–553-10)
Coverslips such as Eisco Microscope Cover Glasses (Fisher Scientific S13945)
Additional reagents and equipment for tissue culture (Basic Protocol 2)
HELA-S3 CELL CULTURE
-
1
From a confluent T75 flask (~ 2 × 10⁶ cells per mL), transfer media containing floating cells to a 50 mL conical tube.
-
2
Wash cells that remained attached to the flask with 5 mL of warm DPBS then with 2.5 mL of Versene solution. Remove completely. Return flask to incubator for 5 minutes.
-
3
During this incubation, add 25 mL of culture media to each of six 15 cm plates and place the plates into the incubator.
-
4
Retrieve the flask from the incubator and tap on its sides to dislodge adherent cells. Pipet previously collected cells back into the flask to combine adherent and suspension cells and transfer to original 50 mL conical tube. Add culture media to bring the volume to 20 mL.
-
5
Homogenize cell suspension by gently pipetting up and down and transfer 3 mL to each 15 cm plates. The remaining cells (1.5 mL) can be used to seed a new T75 flask for further expansion.
-
6
Add 5 mL of culture media to each of the six 15 cm plates 72 hours after seeding.
SUBCELLULAR FRACTIONATION
An overview of the fractionation process is shown in Fig. 2
Figure 2:

Workflow diagram of the subcellular fractionation protocol.
-
7Without removing the culture media, collect cells using a cell lifter and transfer cell suspension to pre-chilled 50 mL conical tubes (one tube can be used to collect cell suspensions from several plates).
- Cells cannot be frozen prior to subcellular fractionation. This process needs to be performed immediately following cell harvest.
-
8
Pellet cells at 300 × g for three minutes at 4°C.
-
9
Decant the media into a biological waste vessel.
-
10
Pipette 10 mL of cold DPBS into each 50 mL conical tube. Gently resuspend cell pellets by pipetting up and down.
-
11
Bring the volume of DPBS in each tube to 50 mL. Mix by inversion.
-
12
Pellet cells at 300 × g for three minutes at 4°C. Decant the DPBS solution.
-
13
Gently resuspend each pellet by pipetting up and down using 10 mL of DPBS. Combine cell suspensions into one 50 mL conical tube. Bring the volume to 50 mL and mix by inversion.
-
14
Pellet cells at 300 × g for three minutes at 4°C. Decant the DPBS solution.
-
15
Gently resuspend pellet by pipetting up and down using 10 mL of DPBS. Transfer cell suspension to a 15 mL conical tube.
-
16
Pellet cells at 300 × g for three minutes at 4°C.
-
17
Carefully remove the supernatant. Record cell pellet volume (CPV).
-
18
Resuspend cell pellet in hypotonic buffer using 5 times the CPV.
-
19
Pellet cells at 800 × g for three minutes.
-
20
Remove supernatant with a pipette (the pellet is very loose at this stage). The volume of the pellet should be between 1.5 to 2 times the starting CPV, indicating appropriate cell swelling.
-
21
Resuspend swollen cell pellet using one CPV of hypotonic buffer.
-
22
Incubate on ice for 10 minutes.
-
23
Transfer a 5 µL aliquot of swollen cell suspension to a glass slide, cover with a coverslip and set aside.
-
24
Transfer swollen cell suspension to a pre-chilled 7 mL Dounce homogenizer.
-
25
Insert the loose-fitting glass pestle and slowly shear the cells using 10 Dounce homogenizer cycles (a cycle is 1 down and 1 up movement of the pestle).
-
26
Set pestle aside. Transfer a 5 µL aliquot of homogenized cell suspension to a glass slide, cover with a coverslip.
-
27
Examine cell spreads before and after Dounce homogenization. The cells before disruption should have a round, intact appearance. After homogenization, nearly all cells should be broken open. The nuclei appear as small darker spheres. A lot of debris should be visible. If more than ~ 10% of cells remain intact, add 2 more Dounce cycles and evaluate the extent of cell breakage again. Continue if necessary but stop when nuclei begin to fragment.
-
28
Distribute content of homogenizer between several microcentrifuge tubes labeled “N”.
-
29
Centrifuge at 1000 × g for 10 minutes at 4°C.
-
30
Transfer supernatants to a microcentrifuge tube labeled “C0”.
-
31
Resuspend crude nuclear pellets in “N” with 1 mL of complete hypotonic buffer. Transfer a 50 µL aliquot to a tube labelled “N-wb” for Western Blot analysis (Basic Protocol 4).
-
32
Centrifuge both supernatants (“C0”) and resuspended nuclear pellets (“N”), including the 50 µL aliquots) as above (Step 29–30).
-
33
Transfer the supernatant from “C0” to a new microcentrifuge tube labeled “C”. This is the crude cytoplasmic fraction. Separately transfer a 50 µL aliquot to a microcentrifuge tube labeled “C-wb” for Western Blot analysis (Basic Protocol 4).
-
34
Discard supernatants from the “N” and “N-wb” tubes. The pellets correspond to the crude nuclear fraction (“N”).
-
35Snap freeze crude cytoplasmic (“C”) and nuclear fractions (“N”) in liquid nitrogen and store at ─80°C.
- Promptly remove tubes from liquid nitrogen. Liquid nitrogen causes severe burns. Wear cryogenic gloves and a face shield.
-
36
These crude subcellular fractions can be stored at ─80°C for several years.
BASIC PROTOCOL 4
PREPARATION OF SUBCELLULAR EXTRACTS AND EVALUATION OF TPOI EXPRESSION LEVEL
Once cell lines are established and crude subcellular fractions prepared, proteins should be solubilized as efficiently as possible while preserving their native conformation, activity and molecular interactions. As described below, the extraction buffer used to prepare nuclear extracts should solubilize most protein targets. If other buffers need to be used, verify that their composition is compatible with downstream immuno-affinity purification. Similarly, enzymatic digestion of the crude chromatin fraction with micrococcal nuclease followed by “extraction” with a small concentration of detergent should efficiently solubilize most DNA associated complexes yet is gentle enough to maintain protein complex integrity. To increase the efficiency of the FLAG affinity enrichment, adjust the composition of the soluble chromatin and of the crude cytoplasmic fractions so that they contain an isotonic concentration of NaCl at pH 7.5 along with a small amount of detergent (0.05%).
MATERIALS
Crude subcellular fraction (Basic Protocol 3)
IGEPAL CA 630 (Sigma-Aldrich, cat. no. I8896–100 mL)
Protease inhibitor cocktail (Roche, cat. no. 11873580001)
Phosphatase inhibitor cocktail (Sigma, cat. no. P0044)
RNase inhibitor (ThermoFisher Scientific, cat. no. 10777019)
0.5M EDTA pH 8.0 (ThermoFisher Scientific, cat. no. AM9261)
BCA Protein Assay Kit (ThermoFisher Scientific, cat. no. 23227)
BCA assay plate (Costar, cat. no. 3370)
Micrococcal S7 nuclease (Roche, cat. no. 10107921001)
Blocking solution (see recipes)
Blotting buffer (see recipes)
SuperSignal West Femto (ThermoFisher Scientific, cat. no 34094)
1.7 mL Centrifuge tubes (Corning, cat. no. 3621)
10/20 µL XL graduated tips (USA Scientific, cat. no. 1160–3700)
200 µL tips (USA Scientific, cat. no. 1111–08006)
1000 µL tips (USA Scientific, cat. no. 1111–2821)
1–200 µL narrow-bore graduated tips (Sorenson, cat. no. 27760T)
FLAG-BAP (Sigma, cat. no. P7582)
CYTOPLASMIC EXTRACT PREPARATION.
-
1
Completely thaw cytoplasmic fractions for control and experimental samples on ice.
-
2
Adjust the composition of cytoplasmic extracts by adding NaCl to a final concentration of 150 mM, Tris pH7.5 to a final concentration of 50 mM and IGEPAL CA 630 to a final concentration of 0.05%.
-
3
Mix end-over end for 20 minutes at 4°C and pellet insoluble material by centrifugation at 20,000 × g for 10 minutes at 4°C.
-
4
Transfer cleared extracts to new microcentrifuge tubes, leaving behind any insoluble material (small, loose pellets may be visible). Proceed directly to TAP procedure (avoid freezing).
NUCLEAR EXTRACT PREPARATION.
-
5
Completely thaw crude nuclear fractions for control and experimental samples on ice.
-
6
Resuspend nuclear pellets in 4 pellet volumes of FLAG-IP buffer by pipetting up and down 3–4 times. The FLAG IP buffer should at a minimum contain protease inhibitors. Phosphatase and RNAse inhibitors may be added if necessary.
-
7
Extract nuclear proteins by mixing end-over-end for 30 minutes at 4°C.
-
8
Pellet insoluble material by centrifugation at 20,000 × g for 10 minutes at 4°C and transfer supernatant to new microcentrifuge tubes. Keep pellets on ice if planning to extract chromatin-bound proteins. Proceed directly to TAP procedure (avoid freezing).
CHROMATIN EXTRACT PREPARATION.
-
9
Resuspend post-nuclear extraction pellets with 5 volumes of cold micrococcal nuclease (MNase) digestion buffer.
-
10
Centrifuge insoluble material at 10,000 × g for 5 minutes at 4°C. Discard the supernatant. Crude chromatin pellets may be stored at ─80°C and used later.
-
11
Use a pipet equipped with a narrow-bore low binding pipet tip and thoroughly resuspend each pellet with 1 volume of MNase digestion buffer. The suspension should have a milky appearance without visible clumps. Add Micrococcal Nuclease to a final concentration of 3 units/µL.
-
12Place tubes on a temperature-controlled vortex mixer set to 30°C and incubate under constant agitation. Visually inspect the progress of chromatin digestion after 20 minutes. If clumps are visible, add another 3 units/µL of MNase, pipet up and down as described above and continue the incubation for another 10 minutes. Chromatin can be digested at lower temperature (15°C) but the digestion will proceed much slower.
-
Micrococcal nuclease digestion can be verified by performing a phenol/chloroform extraction on 10% of solubilized chromatin followed by electrophoresis on a 2% agarose gel. After ethidium bromide staining, the most intense band should correspond to ~140 bp, the length of DNA wrapped around a mononucleosome.The crude chromatin pellet can be kept frozen at this stage.
-
-
13
Add one volume of 2 × HA IP buffer containing protease inhibitors (and phosphatase inhibitors if necessary, but note that cellular RNAs have been digested by MNase at this point) and incubate on a vortex platform for 10 minutes at 4°C.
-
14
Centrifuge insoluble material at 20,000 × g for 10 minutes at 4°C and transfer supernatants to new tubes. Proceed directly to TAP procedure (avoid freezing).
EVALUATING THE EXPRESSION OF TPOI
-
15
Prepare a 2-fold serial dilution of the FLAG-BAP recombinant protein from 50 ng to 1.5 ng.
-
16
Add 20 µg of negative control extract (from parental cells or from cells transduced with an empty vector) to each tube of diluted FLAG-BAP as a carrier.
-
17
Load these standards alongside 20 µg of subcellular extracts prepared from cells expressing the tagged protein of interest (tPOI).
-
18
Proceed with the western blot procedure as described in the following steps. [https://doi.org/10.1002/cpps.32]
-
19
Block the membrane with blocking solution for 45 minutes at room temperature.
-
20
Probe the membrane for 2 hours at room temperature with HRP-conjugated anti-FLAG antibody diluted 1:2000 in blocking solution.
-
21
Wash the membrane 4 times for 10 minutes each at room temperature with blotting buffer.
-
22
Develop the membrane using a luminescent substrate solution (such as West Femto) and image the membrane using a luminescent image analyzer.
-
23Calculate the amount of tPOI per mg of extract.
- One should match the intensity of tPOI in a given subcellular fraction to that of a standard in the dilution series and multiply by 50 (20 µg x 50 = 1 mg
BASIC PROTOCOL 5
TANDEM AFFINITY PURIFICATION
Tandem Affinity Purification relies on the sequential enrichment of the tPOI using immobilized affinity reagents that independently bind the two peptide epitopes. The anti-FLAG affinity reagent used in the first stage can efficiently capture a target present at low concentration (typically present at less than 0.1% (w/w) of the input) from a very complex background (proteome or sub-proteome level). The anti-HA affinity and the StrepTactin reagents exhibits lower overall affinity for their respective target sequence but will perform well to re-capture a semi-purified target from the FLAG elution.
This procedure can be performed manually (Basic Protocol 5) or using a KingFisher96 magnetic bead processor (Alternate Protocol 5). Both protocols detail the steps for a FLAG-HA tandem purification. If the second purification stage relies on Strep-tag II, simply substitute the StrepTactin for the HA-affinity matrix, SII-IP wash buffers for HA-IP wash buffers and the SII-IP elution buffer for the HA-IP SII-IP elution buffer.
Regardless of the procedure chosen, quality controls to monitor yield and specificity should be included. This consists of taking small aliquots of the samples at multiple stages of the procedure and analyzing the relative abundance and purity of the target by western blot and silver stain analysis, respectively. The percentages of each fraction indicated below are given as guidelines. Higher or lower percentages may be used depending on the expression level of the tPOI, its behavior during the purification and the sensitivity of the detection method.
MATERIALS
Extracts form control and tPOI expressing HeLa S3 cells (Basic Protocol 4)
BCA Protein Assay Kit (ThermoFisher Scientific, cat. no. 23227)
FLAG agarose beads (Sigma, cat. no. A2220)
Magnetic FLAG agarose beads (Sigma, cat. no. M8823)
FLAG peptide (Sigma, cat. no. F3290)
HA agarose beads (Santa Cruz, cat. no. sc-7392AC)
FLAG elution buffer (see recipes)
HA elution buffer (see recipes)
SII elution buffer (see recipes)
NuPAGE MOPS SDS Running Buffer (20x) (ThermoFisher Scientific, cat. no. NP0001)
6 × His-HA peptide HHHHHHAYPYDVPDYA (Tufts University Core Facility or other peptide synthesis companies)
StrepTactin Superflow (IBA, cat. no. 2–1206-002)
Magnetic StrepTactin beads (IBA, cat. no. 2–4090-002)
Igepal CA 630 (Sigma-Aldrich, cat. no. I8896–100ML)
Phosphatase inhibitor cocktail (Sigma, cat. no. P0044)
RNase inhibitor (ThermoFisher Scientific, cat. no. 10777019)
d-Desthiobiotin (Sigma-Aldrich, cat. no. D1411)
Protease inhibitor cocktail (Roche, cat. no. 11873580001)
1.7 mL Centrifuge tubes (Corning, cat. no. 3621)
10/20 µL XL graduated tips (USA Scientific, cat. no. 1160–3700)
200 µL tips (USA Scientific, cat. no. 1111–08006)
1000 µL tips (USA Scientific, cat. no. 1111–2821)
200 µL flat tips 0.2 mm (Costar, cat. no.4884)
Centrifuge filter tubes 0.45 µm (Millipore, cat. no. UFC30HV00)
NuPAGE 4–12% Bis-Tris Protein Gels, 1.0 mm, 15-well (ThermoFisher Scientific, cat. no. NP0323BOX)
NuPAGE MOPS SDS Running Buffer (20x) (ThermoFisher Scientific, cat. no. NP0001)
NuPAGE Antioxidant (ThermoFisher Scientific, cat. no. NP0005)
NuPAGE LDS Sample Buffer (4x) (ThermoFisher Scientific, cat. no. NP0007)
SilverQuest Silver Staining Kit (ThermoFisher Scientific, cat. no. LC6070)
TAP FLAG-IP
-
1
Quantify protein yields for control and tPOI-expressing cell extracts using bicinchoninic acid (BCA) assay.
-
2
Refer to Basic Protocol 4 to estimate the volume of extract containing ~5 µg of tPOI.
-
3Normalize total protein amount and concentration across all extracts (including negative controls).
- Save between 0.1 and 0.5% of the tPOI-expressing extract as TAP input “INw”.
-
4
Place the FLAG-agarose vial on ice to bring its content to ice temperature.
-
5Use a wide-bore pipet tip to transfer multiples of 20 µL (20 µL per purification) of FLAG-agarose slurry to a tube.
- Care should be taken to minimize loss of beads during these washes. Always leave 20 to 50 µL of buffer above the bead pellet after centrifugation. Use a 0.2 mm flat gel loading tip to remove the remaining buffer when indicated.
-
6Wash the beads:
- Add 500 µL of FLAG-IP buffer.
- Vortex briefly to fully resuspend the beads.
- Pellet the beads at 300 × g for 30 seconds.
- Place tubes on ice for 1 minute
- Discard supernatant.
-
7
Repeat the wash cycle for a total of three times.
-
8
For each 20 µL of slurry initially transferred, resuspend the washed beads using 40 µL of FLAG-IP buffer.
-
9
Transfer 40 µL of the washed beads to each sample.
-
10
Incubate for 2 h at 4°C, rotating tubes end-over-end. For extract volumes < 0.2 mL, a vortex platform should be used to keep beads in suspension.
-
11
Pellet FLAG-agarose beads at 300 × g for 30 seconds.
-
12Transfer all but ~ 20 µL of the supernatant to a tube labeled “FLAG Flow-Through”.
- Save an aliquot of the FLAG flow through as “FFTw”. Use the same volumetric percentage as the TAP input “INw”. As with all following samples for QC, store at −20°C until use.
-
13
Use a flat 0.2 mm gel loading tip to remove remaining extract and discard.
-
14Wash cycle:
- Add 500 µL of FLAG-IP buffer.
- Vortex briefly to fully resuspend the beads.
- Pellet the FLAG-agarose beads at 300 × g for 30 seconds.
- Place tubes on ice for 1 minute
- Discard supernatant.
-
15
Repeat wash cycle.
-
16Repeat steps a. and b. of the wash cycle using HA-IP buffer.
- While beads are in suspension, use a wide-bore pipet tip to take an aliquot of the slurry as FLAG bound “FBNDw”. Use the same volumetric percentage as the “INw”.
-
17
Pellet the FLAG-agarose beads at 300 × g for 30 seconds.
-
18
Discard all but ~ 20 µL of the supernatant.
-
19
Use a flat 0.2 mm gel loading tip to remove remaining wash buffer left on top of the beads.
-
20
Add 20 µL of FLAG elution buffer.
-
21
Incubate on a vortex platform at 4°C for 30 minutes keeping beads in suspension.
-
22
Pellet beads at 300 × g for 30 seconds.
-
23
Prepare the centrifuge filters by adding 200 µL of HA-IP buffer to the top container of the centrifuge filters (one per sample) and centrifuge immediately for 1 minute at 4,000 × g.
-
24
Discard the wash buffer collected in the lower compartment.
-
25
Use a flat 0.2 mm gel loading tip to transfer the eluted proteins to the pre-washed centrifuge filters from Step 24. Do not transfer the beads at this stage. Keep the first (filtered) elution on ice during the 2nd elution.
-
26
Add 20 µL of FLAG elution buffer to the beads.
-
27
Incubate on a vortex platform for 30 minutes at 4°C.
-
28
Pellet the beads and liquid at 300 × g for 30 seconds.
-
29Pipet up-and-down to resuspend the bead pellet. Transfer the slurry to the centrifuge filter used previously in Step 25 and centrifuge immediately at 4,000 × g for 1 minute to collect both FLAG-IP elutions in a single tube.
- Save an aliquot of the FLAG elution for WB analysis as “FELw”. Use twice the volumetric percentage of the “FBNDw”. Also save an aliquot of the FLAG elution for the negative control “FELsCTRL” and of the FLAG elution for the experimental sample “FELsEXP” for silver stain analysis. Use 5% (2 µL) for both.
-
30Collect the beads from the top container of centrifuge filters using 200 µL of HA-IP buffer and transfer to a tube.
- Save an aliquot of the bead slurry as FLAG post-elution “FPEw”. Use the same volumetric percentage as the “FELw”.
TAP HA-IP
-
31Use a wide-bore pipet tip to transfer multiples of 20 µL (20 µL per purification) of HA-agarose slurry to a tube.
- It is important to use the recommended HA-beads from Santa Cruz Biotechnology, as these are the only commercially available affinity reagent that supports specific elution using an excess of HA peptide.
-
32
Wash the slurry three times with 500 µL of HA-IP buffer.
-
33
For each 20 µL of slurry, resuspend the washed beads using 20 µL of HA-IP buffer.
-
34
Transfer 20 µL of washed beads to tubes containing the combined FLAG-IP elutions from the previous section.
-
35
Incubate for 2 to 16 hours at 4°C on a vortex platform. Ensure that vortexing keeps the beads in suspension.
Short (2 hours) incubations may minimize loss of weakly associated interactors but may not completely re-capture tPOI. Recapture efficiency may be increased using longer (16 hours) incubations.- Save the same aliquots described for the FLAG purification stage, labeling tubes as “HFTw”(step 12), “HBNDw”(step 16), “HELw” (step 29), “HELsCTRL” (step 29), “HELsEXP” (step 29) and “HPEw” (step 30). Use the following percentages of each fraction:
- HFTw: between 2 and 4% of the HA-IP flow through.
- HBNDw: same volumetric percentage as HFTw, taken as a bead slurry during the last HA-IP wash cycle.
- HELw: twice the volumetric percentage of HFTw, taken form the combined elutions.
- HELsCTRL and HELsEX”: 15 % of the combined elutions.
- HPEw”: twice the volumetric percentage of HFTw, taken as a slurry from eluted HA beads.
-
36Follow the procedure described for the FLAG-IP washes and elutions (step 14–30) with the following modifications:
- Washes: use 200 µL of the HA-IP buffer and wash the beads 3 times
- Elutions: use 20 µL of HA elution buffer.
QUALTIY CONTROL ANALYSIS TO EVALUATE SAMPLE RECOVERY
-
37Prepare QC samples for western blot analysis.
- To minimize loss of minute amounts of tPOI present at the later stages of the TAP, add 20 µg of negative control extract (or other complex protein mixtures that do not express a tagged version of the POI) to each sample.
-
38
Add LDS sample buffer (containing reducing agent) to a final concentration of 1 ×.
-
39
Denature at 70°C for 10 minutes.
-
40
Cool down to room temperature, vortex and load samples on a SDS gel.
-
41
Follow with a western blot procedure and probe the membrane with the HRP-conjugated anti-FLAG antibody.
QUALTIY CONTROL ANALYSIS TO EVALUATE PURIFICATION SPECIFICITY
-
42
To the samples saved for silver stain analysis, add water and LDS sample buffer (containing reducing agent) to a final concentration of 1 × in a total volume of 10 µL.
-
43
Denature at 70°C for 10 minutes.
-
44
Cool down to room temperature, briefly collect condensation by centrifugation and vortex.
-
45Insert a precast 15-well, 1 mm, 4–12% NuPAGE, BisTris gel into the gel box.
- Use of precast gradient gels with similar characteristics is highly recommended for the highest detection sensitivity.
-
46
Fill the upper and lower chambers with 1 × MOPS running buffer.
-
47
Immediately before loading the gel, thoroughly flush the wells.
-
48
Dilute 1 µL of the BenchMark protein ladder into 100 µL of 1 × LDS (with or without reducing agent).
-
49Load the gel as follows:
- 10 µL of 1 × LDS buffer
- 10 µL of the diluted molecular weight marker
- 10 µL of FELsCTRL
- 10 µL of FELsEXP
- 10 µL of the diluted molecular weight marker
- 10 µL of HELsCTRL
- 10 µL of HELsEXP
- 10 µL of the diluted molecular weight marker
- 10 µL of 1 × LDS buffer
- Loading 10 µL of 1 × LDS in wells adjacent to the markers minimizes lane distortion.
-
50
Run the gel according to the manufacturer’s instructions, typically 200V for 57 minutes at room temperature.
-
51
Proceed to stain the gel using the SilverQuest silver staining kit or using homemade reagents.
ALTERNATE PROTOCOL 1
AUTOMATED TANDEM-AFFINITY PURIFICATION
We had previously automated phosphopeptide enrichment using the KingFisher bead processor (Ficarro, Adelmant, et al., 2009). We have since used magnetic agarose beads coated with the FLAG and HA antibodies or with StrepTactin to automate our TAP procedure. Magnetic anti-FLAG agarose conjugate and StrepTactin magnetic agarose conjugate are available from the same manufacturers who sell the agarose conjugates used in Basic Protocol 5. These magnetic beads exhibit very similar properties with respect to binding capacity and competitive elution. To maintain the added specificity of competitive elution in the HA step, we crosslink the HA-F7 antibody (Santa Cruz Biotechnology) to protein A magnetic agarose (Support Protocol 2, step 31–53).
Care should be taken when using magnetic agarose on an automated platform: like many other bead processors, the KingFisher relies on liquid displacement to keep beads in suspension during the incubation steps. Because of their low buoyancy, magnetic agarose beads will quickly accumulate at the bottom of the well plate and remain there despite continuous mixing. This issue is easily addressed by collecting and releasing beads at regular intervals during the incubation stages (see supplementary files for run parameters).
MATERIALS
Extracts form control and tPOI expressing HeLa S3 cells (Basic Protocol 4)
Magnetic FLAG agarose beads (Sigma, cat. no. M8823)
FLAG peptide (Sigma, cat. no. F3290)
Magnetic HA agarose beads (see preparation in Support protocol 5 below)
Magnetic StrepTactin beads (IBA, cat. no. 2–4090-002)
KingFisher Flex bead processor (ThermoFisher Scientific, cat. no. 5400630)
KingFisher 96 tip comb for DW magnets (ThermoFisher Scientific, cat. no. 97002534)
KingFisher Deepwell 96 Plate (ThermoFisher Scientific, cat. no. 95040450)
KingFisher 96 KF microplate (ThermoFisher Scientific, cat. no. 97002540)
AUTOMATED FLAG IP
Refer to Basic Protocol 5 for quality controls by western blot and silver staining.
-
1
Substitute HA buffers with SII buffers if the second purification stage relies on enrichment with magnetic StrepTactin beads.
-
2
Place the FLAG-magnetic agarose vial on ice.
-
3
Normalize all extracts concentrations and volumes and distribute in wells of a Microtiter DW 96 plate (maximum volume per well: 900 µL). Carefully note the coordinate of wells containing the extracts. Use corresponding wells for plates used in all subsequent steps.
-
4
Use a wide-bore pipet tip to transfer multiples of 50 µL (50 µL per 900 µL of extract) of FLAG-magnetic agarose slurry to a tube.
-
5
Wash the slurry three times with 1 mL of FLAG-IP buffer.
-
6
For each 50 µL of slurry initially transferred, resuspend the beads using 100 µL of FLAG-IP buffer.
-
7
Transfer 100 µL of the washed beads to the wells containing extracts.
-
8
Prepare two KingFisher Deepwell 96 plates containing 500 µL of FLAG-IP buffer.
-
9
Prepare one KingFisher Deepwell 96 plate containing 500 µL of HA-IP buffer.
-
10Prepare two KingFisher 96 KF microplates containing 50 µL of FLAG-IP elution buffer.
- The composition of the FLAG-IP elution buffer is dictated by the second IP stage (HA or SII).
-
11
Prepare a KingFisher 96 KF microplate with a 96 DW tip-comb and add 100 µL of FLAG-IP buffer to the wells.
-
12
Place the plate with the tip-comb, the input plate, the two FLAG-IP wash plates, the HA-wash plate and the two FLAG elution plates on the KingFisher instrument in positions 1–7.
-
13
Start the KingFisher FLAG-IP protocol (see supplementary file for KingFisher run parameters).
-
14
Transfer and combine the first and second FLAG-IP elutions into one well of a KingFisher 96 KF plate. Bring the volume of the combined elutions to 200 µL with HA-IP buffer)
AUTOMATED HA IP
-
15
Use a wide-bore pipet tip to transfer multiples of 50 µL (50 µL per initial FLAG-IP) of the 25% HA-magnetic agarose slurry to a tube.
-
16
Wash the slurry three times with 500 µL of HA-IP buffer.
-
17
For each 50 µL of slurry initially transferred, resuspend the beads using 50 µL of HA-IP buffer.
-
18
Transfer 50 µL of washed beads to the wells of the KingFisher plate containing the FLAG-IP elutions.
-
19
Set up three KingFisher 96 KF microplates containing 150 µL of HA-IP buffer.
-
20
Set up two KingFisher 96 KF microplates containing 40 µL of HA-IP elution buffer.
-
21
Set up a KingFisher 96 KF microplate with a 96 DW tip-comb and add 100 µL of HA-IP buffer to the wells.
-
22
Place the plate with the tip comb, the plate containing the FLAG-IP elutions with the HA beads, the three HA-IP wash plates and the two HA-IP elution plates on the KingFisher instrument in positions 1–7.
-
23
Start the KingFisher HA-IP protocol (see supplementary file for KingFisher run parameters).
-
24
Collect and pool the two elutions corresponding to the same sample.
-
25
Refer to Basic Protocol 5 for quality control analysis.
SUPPORT PROTOCOL 2
PREPARING MAGNETIC BEADS COATED WITH THE ANTI-HA ANTIBODY
We have tested magnetic anti-HA beads from several manufacturers and found that these reagents suffer from the same issue described in the TAP section: captured targets are inefficiently released, if at all, from the beads following competitive elution with excess HA peptide. Fortunately, it is relatively easy to prepare a functional reagent. In house coupling of Protein A to magnetic agarose, as described in the first section, is the most cost-effective option if large amounts of the affinity reagent are required. However, Protein A magnetic Sepharose can also be purchased from GE Health Care Life Sciences. The second step consists of crosslinking the anti-HA antibody to the magnetic Protein A agarose.
MATERIALS
4% Glyoxal-activated magnetic agarose bead, 20 −75 µm (BioScience Bead Division, cat. no. MG-U010)
Protein A (ThermoFisher Scientific, cat. no. 77673)
Protein A solution (50 mg/mL, see recipes)
2 M Sodium cyanoborohydride (see recipes)
0.2 M Sodium Borate
PBS/Tween 0.04% (v/v)
Anti-HA antibody (Santa Cruz Biotechnology, cat. no. sc-7392)
Dimethyl-pimelimidate (ThermoFisher Scientific, cat. no. 21666)
Ethanolamine (Sigma, 15014–25ML)
PREPARING PROTEIN-A MAGNETIC AGAROSE BEADS
-
1
Transfer 5 mL of Glyoxal-activated Magnetic Agarose Beads to a 15 mL conical tube.
-
2
Place on a magnetic stand.
-
3
Remove the supernatant.
-
4
Add 5 mL of 0.2 M Sodium Borate.
-
5
Mix to resuspend the beads.
-
6
Place on the magnetic stand.
-
7
Remove the supernatant.
-
8
Repeat the 0.2 M Sodium Borate wash three more times.
-
9
Remove the last wash.
-
10
Dilute 200 µL (10 mg) of Protein-A stock solution into 5 mL of 0.2 M Sodium Borate.
-
11
Resuspend the beads in 5 mL of diluted Protein A solution.
-
12
Mix end over end for 10 minutes at room temperature.
-
13Remove from the mixer and let the beads settle to the bottom of the tube.
- Sodium cyanoborohydride is toxic. The following steps need to be performed in a fume hood.
-
14
Add 50 µl of 2 M sodium cyanoborohydride solution and quickly invert the tube to mix its content.
-
15
Incubate end over end for 2 hours at room temperature.
-
16
Place the tube on a magnetic stand.
-
17
Remove the supernatant.
-
18
Add 5 mL of 0.2 M Sodium Borate.
-
19
Mix to resuspend the beads.
-
20
Add 50 µl of ethanolamine.
-
21
Mix briefly.
-
22
Add 50 µL of 2 M sodium cyanoborohydride solution and quickly invert the tube to mix its content.
-
23
Incubate end over end for 1 hour at room temperature.
-
24
Place the tube on the magnetic stand.
-
25
Discard the supernatant in a chemical waste container.
-
26
Add 2.5 mL of PBS/Tween.
-
27
Invert the tube to resuspend the beads.
-
28
Place the tube on the magnetic stand.
-
29
Repeat the PBS/Tween wash two more times.
-
30
After the last wash, resuspend the beads in 5 mL of PBS/Tween containing 20% ethanol as preservative. The volume of packed beads should be around 1 mL. Protein-A magnetic agarose beads can be stored at 4°C for several months.
COUPLING THE ANTI-HA ANTIBODY TO PROTEIN-A MAGNETIC AGAROSE BEADS
It is recommended to monitor the efficiency of this procedure by analyzing the same volumetric fraction of the input (containing the equivalent of 500 ng of anti-HA antibody), bound, flow-through and crosslinked beads in an SDS gel followed by Coomassie staining.
-
31Transfer the desired amount of Protein-A magnetic agarose beads to a 15 mL conical tube.
- 1 mL of packed beads should bind approximately 2 mg of antibody.
-
32
Wash the beads three times with 10 packed bead volumes of PBS/Tween.
-
33
Resuspend the beads in 10 packed bead volumes of PBS/Tween.
-
34Add the appropriate amount of antibody based on the estimated total capacity of Protein-A magnetic agarose.
- It is essential to use the recommended anti-HA antibody (HA-F7 probe from Santa-Cruz Biotechnology). Among the many commercial sources we have tested, this is the only HA antibody that will enable specific elution of the target protein with an excess of HA peptide.
-
35
Incubate the bead slurry and the HA antibody for 2 hours at room temperature.
-
36
Pellet the beads and transfer the supernatant to a tube.
-
37
Wash the Protein-A beads / HA antibody conjugate three times with 10 volumes of 0.2 M Sodium Tetra-Borate.
-
38
Resuspend the beads in a final volume equivalent to 4 bead volumes of 0.2 M Sodium Tetra-Borate. Leave the prepared beads at room temperature until the crosslinking step.
-
39
Allow the dimethyl-pimelimidate (DMP) vial to fully equilibrate to room temperature.
-
40
Weight out a small amount of DMP in a microcentrifuge tube.
-
41
Add a volume of Sodium 0.2 M Tetra-Borate to make a DMP solution at a concentration of 25 mg per mL (eq. to 100 mM).
-
42
Add one volume of this DMP solution per volume of resuspended beads.
-
43
Incubate end over end for 30 minutes at room temperature.
-
44
Briefly collect the beads by centrifugation and place on the magnetic stand.
-
45
Remove the supernatant.
-
46
Resuspend the beads in a final volume equivalent to 5 bead volumes of Sodium 0.2 M Tetra-Borate.
-
47
For each mL of bead slurry, add 12 µL of ethanolamine.
-
48
Incubate end over end for 30 minutes at room temperature.
-
49
Briefly collect the beads by centrifugation and place on the magnetic stand.
-
50
Remove the supernatant.
-
51
Wash the beads 3 times with 5 volumes of PBS/Tween.
-
52
Resuspend the beads in a final volume of PBS/Tween equivalent to 4 bead volumes to yield a 25% slurry.
-
53
The anti-HA magnetic agarose beads can be kept at 4°C for several months.
BASIC PROTOCOL 6
SAMPLE PREPARATION AND MASS SPECTROMETRY ANALYSIS
We use a small-scale batch-mode reversed phase chromatography followed by strong cation exchange chromatography to purify peptides before LC-MS/MS analysis. This 2-step process, together with a reduction in the concentration of IGEPAL CA 630 during the HA purification stage and the use of a basic variant of the HA peptide effectively removes interfering buffer components and alleviates the need for labor intensive - low efficiency - PAGE-based purification. For optimal sensitivity we perform liquid chromatography at very low flow rate (< 20 nL/min) using a vented column with small I.D. (< 30 µm) capillary columns (Adelmant et al., 2012; Ficarro, Zhang, et al., 2009; Rozenblatt-Rosen et al., 2012) to introduce peptide samples into the mass spectrometer. We provide a short summary of our LC-MS methods, although the choice of liquid chromatography equipment and mass spectrometry instrumentation are not critical. In fact, our TAP protocol should be compatible with most systems utilized throughout the biomedical research community. We conclude by providing a quick overview of the steps required to generate a list of candidate binding partners.
MATERIALS
TAP sample (Basic Protocol 5 or Alternate Protocol 5)
Dithiothreitol (Sigma, cat. no. 43819)
Iodoacetamide (Sigma, cat. no. I1149)
1 M Tris pH 8.0 (ThermoFisher Scientific, cat. no. AM9856)
Ammonium Bicarbonate (Fluka, cat. no. 09830)
RapiGest SF (Waters, cat. no. 186002122)
Sequencing Grade Trypsin (Promega, cat. no. V5113)
Neutralit pH Indicator Strip pH 5–10 (ThermoFisher Scientific, cat. no. M1095330001)
Acetonitrile (ThermoFisher Scientific cat. no. A955–4)
Acetic Acid (Sigma cat. no. 338826–100mL)
HPLC solvent A: 0.2 M acetic acid in HPLC-grade water
HPLC solvent B: 100% acetonitrile/0.2 M acetic acid
Trifluoroacetic Acid (ThermoFisher Scientific, cat. no. 28904)
SCX Wash Buffer (see recipe)
SCX Elution Buffer (see recipe)
Poros 50R2 and 50HS Resin (Life Technologies cat. no. 1115906 and cat. no. 1335906)
Adhesive sealing film (Analytical Sales & Services cat. no. 961801)
96 well plate (Axygen cat. no. PCR-96-FS-C)
Fused Silica Capillary Tubing, 360 × 150 µm (Polymicro Technologies, cat. no. 1068150024)
Pre-column (100 μm ID × 4 cm, packed with Poros 10R2, Life Technologies cat. no. 1–1118-02)
Analytical column (30 μm ID × 50 cm, packed with Monitor C18 5 µm, Orochem Technologies cat. no. M5–001-1B)
Vacuum concentrator (ThermoFisher Scientific)
High pressure chamber (Nanobaume SP-400-M1)
Nano Acquity HPLC system (Waters)
Mass spectrometer: QExactive (Thermo) equipped with a Digital PicoView electrospray source platform (New Objective)
PROTEOLYTIC DIGESTION
- Estimate sample volume and transfer to a Sarstedt tube.
- Sarstedt polypropylene tubes exhibit very low protein and peptide binding characteristics and leach relatively small amounts of residual plasticizer compared to other brands.
Add 50 mM ammonium bicarbonate to bring the sample volume to 45 or 90 µL.
Add RapiGest (1% v/v) to a final concentration of 0.1% and dithiothreitol (DTT) to a final concentration of 10 mM.
Incubate at 56°C for 30 minutes in a water bath.
Cool to room temperature.
Add iodoacetamide to a final concentration of 22.5 mM.
Incubate at room temperature in the dark for 20 minutes.
- Add between 1 and 5 µg of trypsin.
- This amount is likely greater than the typical enzyme/substrate ratio recommended for trypsin but will compensate for reduced activity due to the presence of residual protease inhibitors in TAP samples.
Check pH of solution by transferring a 0.5 µL aliquot onto a pH paper strip. If necessary, adjust pH to 8.0 with 1 M Tris pH 8.0
Incubate samples overnight at 37°C.
PEPTIDE CLEAN-UP
-
54
Add trifluoroacetic acid (TFA) to a final concentration of 1% (v/v) and incubate at 37°C for 30 minutes.
-
55
Centrifuge at 20,000 × g for 10 minutes at room temperature to precipitate RapiGest degradation products.
-
56
Transfer supernatant to a Sarstedt tube.
-
57
Add 40 µL of the 50% Poros 50R2 slurry.
-
58
Vortex gently and centrifuge for 15 seconds at 3,000 × g.
-
59
Place the tube into a pressure chamber equipped with a fritted 360 × 150 µm fused silica capillary. The fritted end of the capillary should be inserted into the pressure chamber and bottomed-down into the tube containing the sample and the 50R2 slurry.
-
60
Pressurize the chamber to ~200 psi and collect flow-through in a Sarstedt tube.
-
61
Depressurize the chamber and open slowly.
-
62
Add 100 µL of 0.1% TFA to the tube.
-
63
Vortex gently and centrifuge for 15 seconds at 3,000 × g.
-
64
Return the tube to the pressure chamber and pressurize to collect the wash buffer in the tube used for the flow-through.
-
65
Depressurize the chamber and open slowly.
-
66
Add 50 µL of 80% ACN/0.1% TFA to the tube.
-
67
Vortex gently and centrifuge for 15 seconds at 3,000 × g.
-
68
Return the tube to the pressure chamber and pressurize to collect the eluted peptides in a new Sarstedt tube.
-
69
Depressurize the chamber and open slowly.
-
70
Dry the eluted peptides to completion by vacuum centrifugation.
-
71
Discard the tube containing the resin and the fritted capillary.
-
72
Reconstitute the dried peptides with 100 µL SCX wash buffer.
-
73
Add 20 µL of the 50% 50HS slurry.
-
74
Vortex gently and centrifuge for 15 seconds at 3,000 × g.
-
75
Place the tube into the pressure chamber equipped with a new fritted 360 × 150 µm fused silica capillary.
-
76
Pressurize the chamber to ~200 psi and collect flow-through in a Sarstedt tube.
-
77
Depressurize the chamber and open slowly.
-
78
Add 20 µL of SCX wash buffer.
-
79
Vortex gently and centrifuge for 15 seconds at 3,000 × g.
-
80
Place the tube back in the pressure chamber and pressurize to collect the wash buffer in the tube used for the flow-through.
-
81
Depressurize the chamber and open slowly.
-
82
Add 20 µL of SCX elution buffer to the tube
-
83
Vortex gently and centrifuge for 15 seconds at 3,000 × g.
-
84
Place the tube back in the pressure chamber and pressurize to collect the eluted peptides in a new Sarstedt tube.
-
85
Depressurize the chamber and open slowly.
-
86
Dry the eluted peptides to completion by vacuum centrifugation.
-
87
Discard the tube containing the resin and the fritted capillary.
LC-MS/MS ANALYSIS
-
88
Reconstitute the dried peptides with 20 µL of 0.1% TFA.
-
89
Transfer 10 µL of the reconstituted peptides into a 96 well plate and seal the plate with adhesive sealing film.
-
90
Load peptides onto the vented precolumn for 15 minutes at a flow rate of 3 µL/min.
-
91A typical 90-minute chromatography method consisting of the following steps is a good starting point for low complexity samples:
- 1%–35% HPLC solvent B from 0 to 45 min
- 35%–90% HPLC solvent B from 45 to 55 min
- 90% HPLC solvent B from 55 to 60 min
- 1% HPLC solvent B from 60 to 90 min
-
92
Eluting peptides are analyzed in data dependent mode where the top 10 most abundant precursor ions in each MS scan are subjected to higher-energy collisional dissociation (HCD). Other settings include: dynamic exclusion: 15 sec, automatic gain control (MS2): 2e5 and max injection time (MS2): 50 ms.
DATA ANALYSIS
-
93
Raw mass spectrometry data are converted to Mascot generic format (.mgf) using our publicly available mzDesktop graphical user interface (https://sourceforge.net/projects/multiplierz/) or for more experienced users, the python-based multiplierz environment (https://github.com/BlaisProteomics/multiplierz) (Alexander, Ficarro, Adelmant, & Marto, 2017).
-
94
MS/MS spectra are searched against Swiss-Prot protein database using the Mascot search engine.
-
95
Carefully select search criteria such as enzyme, taxonomy, precursor and fragment ion tolerance, variable and fixed modifications according to the sample and instrument characteristics. Select the option instructing Mascot to perform a decoy database search to enable false discovery rate estimation.
-
96
Establish a list of confidently identified and reproducibly detected candidate binding partners by selecting proteins detected across independent replicate TAP experiments. Despite the inherent specificity of TAP, non-specific contaminants may need to be excluded from the initial list. As a first step, we typically exclude proteins identified in any of the negative control TAPs performed along the experimental TAPs. We also flag proteins detected in more than 1% of over 100 negative control TAPs (coined the “Tandome” (Rozenblatt-Rosen et al., 2012)).
-
97
Optional: Individual protein abundance can be estimated by averaging the intensity, represented as Extracted Ion Chromatograms (XIC) of the 3 most abundant peptides according to the method of Silva (Silva, Gorenstein, Li, Vissers, & Geromanos, 2006). It is highly recommended to estimate this metric across technical replicate LC-MS/MS runs for at least two independent replicate TAP experiments.
REAGENTS AND SOLUTIONS
Water is Milli-Q, Nanopure or equivalent ultrapure water with a resistivity of 18.2 MΩ.cm.
Hypotonic buffer is 10 mM Tris-HCl (pH 7.3), 10 mM KCl, 1.5 mM MgCl2, 10 mM 2-mercaptoethanol. Prepare the buffer by mixing 10 mL of 1M Tris-HCl (pH 7.3), 10 mL of 1M KCl, 1.5 mL of 1M MgCl2 and bring the volume to 1 L with water. Store at 4°C for a year. Before use, add 0.007% (v/v) of 2-mercaptoethanol and 1% (v/v) of concentrated (100 x) protease inhibitor cocktail to produce the volume of buffer required.
Blotting buffer: 25 mM Tris·Cl, pH 7.4, 0.15 M NaCl, 0.04 % (v/v) Tween 20 in water.
Blocking solution: Blotting buffer (see recipe) with 5% (w/v) nonfat dry milk.
SCX wash buffer: 25% (v/v) acetonitrile, 0.1% (v/v) Formic acid in water.
SCX elution buffer: 25% (v/v) acetonitrile, 0.1% (v/v) Formic acid, 300 mM KCl in water
PBS/BSA: Prepare 50 mL of a 0.1% (w/v) solution of BSA in PBS. Sterilize by filtering through 0.2 µm filter. Store at 4°C for 6 months.
Micrococcal S7 digestion buffer is 20 mM Tris-HCl, pH 7.5, 100 mM KCl, 2 mM MgCl2, 1 mM CaCl2 and protease inhibitor cocktail. Store at room temperature for a year.
FLAG peptide stock 4 mg/mL: Dilute dried peptide in 200 mM Tris pH 8.0. Store at – 20°C for 2 years.
FLAG elution buffer: Dilute FLAG peptide stock 20-fold into HA-IP buffer or SII-IP buffer. Prepare before use.
Note that the elution buffer is prepared in the buffer for the second stage IP
HA peptide stock 4 mg/mL: Dilute dried peptide in 50 mM Tris pH 7.5, 150 mM NaCl, 1 mM EDTA. Store at – 20°C for 2 years.
HA elution buffer: Dilute HA peptide stock 20-fold into HA-IP buffer. Prepare before use.
Desthiobiotin stock: Prepare a 12.5 mM desthiobiotin in SII IP buffer. Sonicate to bring into solution. Prepare fresh before use.
SII elution buffer: Dilute desthiobiotin stock 5-fold in SII-IP buffer to a final concentration of 2.5 mM desthiobiotin. Prepare before use.
TAP base buffer. For 475 mL, combine:
5 M NaCl: 15 mL
1 M Tris pH 7.5: 25 mL
0.5 M EDTA pH 8.0: 1 mL
50% Glycerol: 100 mL
Water: 334 mL
Store at 4°C for a year
FLAG IP buffer: combine 9.5 mL of TAP base buffer with 500 µL of 10% Igepal 630. Add protease inhibitor cocktail before use. Prepare fresh before use.
HA IP buffer: combine 9.5 mL of TAP base buffer with 450 µL of water and 50 µL of 10% Igepal 630. Add protease inhibitor cocktail before use. Prepare fresh before use.
SII IP buffer: For 10 mL, combine:
5 M NaCl: 300 µL
1 M Tris pH 8.0: 500 µL
0.5 M EDTA pH 8.0: 20 µL
50% Glycerol: 2 mL
10% Igepal 630: 50 µL
Water: 7.13 mL
Add protease inhibitor cocktail before use
Prepare fresh before use.
2 × HA IP buffer: For 10 mL, combine:
5 M NaCl: 600 µL
1 M Tris pH 7.5: 1 mL
0.5 M EDTA pH 8.0: 40 µL
50% Glycerol: 4 mL
10% Igepal 630: 100 µL
Water: 4.3 mL
Prepare fresh before use
Protein-A stock solution: 50 mg/mL
Resuspend one 50 mg vial with 1 mL of water
Use immediately or make several 5 and 10 mg aliquots
Add an equal volume of glycerol and store at −20°C. Avoid freeze/thaw cycles
Sodium Tetra-Borate, 0.2 M: Dissolve 3.81 g of Sodium Tetra-borate deca-hydrate in a final volume of 50 mL water. Store at room temperature for a year. If crystallization occurs, heat in a 50°C water bath until crystals dissolve.
Sodium cyanoborohydride solution, 2 M: Weight out a small amount (~ 100 mg) of Sodium cyanoborohydride in a screw-cap glass container and dissolve in water to a final concentration of 2 M. Prepare fresh before use.
Sodium cyanoborohydride is toxic. Prepare solution in a fume hood. This solution should never be acidified. Clearly label the tube and waste containers. This solution is unstable. Prepare just before use.
COMMENTARY
Background Information
Most cellular processes are carried out by proteins assembled into multi-component ‘machines’ which often act coordinately with other biochemical machines, akin to an assembly line. Detailed analysis of the composition and dynamics of these molecular machines is an important prelude to a comprehensive characterization of the biochemical pathways which support cellular function.
Single-step affinity purification followed by mass spectrometry analysis (AP-MS) (Banks et al., 2018; Dunham, Mullin, & Gingras, 2012; Giambruno et al., 2013; Greco, Guise, & Cristea, 2016; Kwan & Emili, 2016; Morris et al., 2014) has recently been used to build protein interaction networks which cover entire or defined subsets of proteomes for model organisms (Butland et al., 2005; Krogan et al., 2006) or homo sapiens (Hein et al., 2015; Huttlin et al., 2015). Although these data have a broad scope, they are limited in context (Washburn, 2016) in that disease-specific proteoforms, gene variants, as well as infectious pathogens or other exogenous factors, may drastically alter the landscape of cellular protein interactions (Koleva et al., 2012; Rozenblatt-Rosen et al., 2012). Researchers seeking to test hypotheses in a specific cellular context may opt for a focused analysis of individual protein complexes rather than the ‘representative’ biochemical networks provided by large-scale studies. In such cases, Tandem Affinity Purification remains the method of choice to provide insights into protein function and to address mechanistic gaps in our interpretation of genotype-phenotype relationships (Adelmant et al., 2012; Cato et al., 2017; Chen et al., 2010; Doherty, Adelmant, Cecchetelli, Marto, & Cram, 2014; Duarte et al., 2013; Durzynska et al., 2017; Ferry et al., 2017; Fine et al., 2012; Goudreault et al., 2009; Hill et al., 2014; Hwang et al., 2014; Jager et al., 2011; Kim et al., 2014; Koleva et al., 2012; Lee et al., 2015; Mathias et al., 2014; Meijer et al., 2014; Miotto et al., 2018; Pathania et al., 2011; Pichlmair et al., 2012; Quan et al., 2014; Rozenblatt-Rosen et al., 2012; Sand-Dejmek et al., 2011; Simarro et al., 2010; Uljon et al., 2016; Wang et al., 2013; Watanabe et al., 2014; Wei, Chiang, Sumpter, Mishra, & Levine, 2017; C. Zhang et al., 2015; J. Zhang et al., 2017; Zhou et al., 2010).
The enrichment afforded by TAP is intermediate between that of proteins enriched by single step affinity methods and that of protein complexes purified by conventional chromatography. Conventional chromatography-based purification, now seldom used, requires very large amounts of cellular input material and a level of technical expertise not widely available (for example, see: Näär et. al. (Naar et al., 1999)). The resulting protein complexes are of very high purity and often retain tractable biochemical activity. At the other end of the spectrum, single step IPs require less sophisticated skills in biochemistry and can easily be performed en masse. However, the low specificity which typically plagues single-step purifications often makes it difficult to discern true binding partners from background contaminants. As a result, the confidence level for identifying associated proteins in single-step purifications is usually improved when a particular tPOI is analyzed in the context of studies that interrogate very large numbers of tPOIs (Huttlin et al., 2015). In this way one can more easily label contaminant proteins as those identified across a defined fraction of all tPOIs analyzed. An important caveat with this approach is that proteins shared across functionally related protein complexes will be labelled as contaminant. Another limitation as noted earlier is that these large-scale studies provide a ‘representative’ picture of biochemical complexes, that may not address biological questions posed under a specific physiological context. By contrast, the increased specificity inherent to TAP greatly reduces the contaminating background, facilitating simple subtraction of proteins detected in a matched negative control TAPs to arrive at a set of candidate binding partners. As described above, we also annotate proteins based on their detection frequency (≥ 1%) across a large set of negative control TAPs (‘Tandome’) (Rozenblatt-Rosen et al., 2012). This approach provides a more probabilistic view of detected proteins as potential contaminants. Annotation based on the Tandome should be treated as a relatively coarse filter, as it does not yet account for the abundance of the contaminant protein or its subcellular localization. A common critique of TAP is that its stringency may limit the detection of low-stoichiometry or transient protein binding partners. While this risk is non-negligible, it can be mitigated by careful adjustment of experimental conditions, as in our protocol, or by increasing the input protein amount. It is important to note that increasing the input material for single-step purifications is often counterproductive since the relative quantity of background and POI-associated proteins will likely remain constant. However, in context-specific studies designed around a specific hypothesis, data from a well-controlled TAP experiment will provide a more direct path to new insight for one or a limited number of POIs.
Critical Parameters and Troubleshooting
The following troubleshooting guide does not include common issues that may arise when using reagents other than those recommended in the protocol (such as using anti-HA-agarose beads from suppliers other than Santa-Cruz Biotechnology, using a 3 × FLAG peptide instead of single FLAG peptide etc…), or when substantially altering the protocol (such as incubating the FLAG IP overnight).
CELL TRANSDUCTION AND SELECTION
Observation: Few cells are decorated with anti-IL2R coated beads.
Possible causes and solutions:
Poor transfection efficiency. Ensure that transfection efficiency is greater than 80% for GFP-vector transfected cells. Optimize transfection protocol otherwise.
Low viral titer: HEK 293 cells are efficiently transfected (high percentage of GFP-positive cells) but transfection impairs cell viability. Cells should continue to grow and reach full confluency 24 hours post-transfection. If not, try to scale back the amount of plasmid DNA and transfection reagent to optimize cell viability. Also try to increase the number of cells plated for transfection.
Low viral titer: coding sequence for tPOI is too long (> 4 kb), resulting in decreased viral packaging efficiency. Scale up viral production and viral transduction. Alternatively, switch to a retroviral vector with larger packaging capabilities.
HELA-S3 CELL CULTURE AND SUBCELLULAR FRACTIONATION
Observation: Poor cell breakage.
Possible causes and solutions:
This fractionation protocol is optimized for suspension HeLa-S3 cells. A detergent-based fractionation protocol should be tested for adherent cells (Ramsby & Makowski, 2011).
Insufficient cell swelling. This may result from damage to cell membranes. Pipet cell suspensions thoroughly but slowly. Make sure that 2-mercaptoethanol was added to the hypotonic buffer before use. Note that subcellular fractionation needs to be performed immediately following cell harvesting and cannot be performed on frozen cell pellets.
Observation: Poor chromatin digestion.
Possible causes and solutions:
Inactive micrococcal nuclease: Prepare fresh stock.
Insufficient washes before digestion. Remaining EDTA from the lysis in FLAG-IP buffer will chelate divalent cations lead to reduced enzymatic activity.
We have observed that crude chromatin fractions prepared from a subset of adherent cell lines (BJ1-hTERT, U2OS, IMR90) can be difficult to solubilize.
EVALUATING THE EXPRESSION OF TPOI
Observation: Low tPOI expression.
Possible causes and solutions:
Incorrect vector design. Verify vector sequence. Use western blot to verify tPOI-expression in extracts from transfected HEK 293 cells (harvested after step 8, in Basic Protocol 2, “Viral particle production”).
Incomplete cell selection. Uninfected cells were carried over during cell selection and colonized the population. Transfer an aliquot (~1 × 10⁶) of cells to a well of a 24-well plate and incubate with 5 µL of anti-IL2R beads for 30 minutes at 37°C. Verify that all cells have at least one bead attached. If this is not the case, reselect the cell population as described in Section 2 steps 13–20, or start with a new viral transduction (Basic Protocol 2: “Cell transduction and selection”)
QUALTIY CONTROL ANALYSIS TO EVALUATE SAMPLE RECOVERY
Observation: High amounts of tPOI detected in FLAG-IP or HA-IP flow-throughs.
Possible causes and solutions:
Suboptimal mixing during the IP stage. Ensure that the affinity beads are kept in suspension during the entire length of the IP. In the case of automated TAP, ensure that the beads do not accumulate at the bottom of the wells after a few cycles. If accumulation is observed, increase the duration, number or frequency of bead collection steps between “mix” stages.
Suboptimal incubation parameters. The efficiency of the HA purification tends to be lower than that of the FLAG purification. Increase the duration of the HA IP to 16 hours.
Observation: High amounts of tPOI detected in FLAG-IP or HA-IP post-elutions:
Possible causes and solutions:
Suboptimal mixing. Ensure that the affinity beads are kept in suspension during the entire length of the elution.
Observation: tPOI is detected in the FLAG elution but not in any HA purification stages.
Possible causes and solutions:
Loss due to non-specific adsorption: the increased purity of tPOI following the HA purification stage makes it more susceptible to non-specific adsorption on tube surfaces and to denaturation / precipitation. Include the recommended protein extract carrier when preparing samples for western blot analysis.
Loss due to degradation: this is usually accompanied by the appearance of additional bands below the molecular weight of tPOI during quality control by western blot. Increase the concentration of protease inhibitors 2-fold. Include phosphatase inhibitors during the purification.
QUALTIY CONTROL ANALYSIS TO EVALUATE PURIFICATION SPECIFICITY
Observation: Bands are visible in the HA elution for the negative control TAP (automated TAP).
Possible causes and solutions:
Beads in HA elution: increase the duration or number of bead collection steps between and after the two HA elution steps. Alternatively, filter the HA elutions as described for the manual protocol.
Observation: tPOI is the only visible protein in the HA elution.
Possible causes and solutions:
Insufficient input for low stoichiometry complexes: Increase the purification scale. The extract of up to 100 × 15 cm plates can be used as input for TAP. If necessary, the extract should be split into 1.5 mL aliquots and separately subjected to FLAG IP. Collect all FLAG elutions in a single tube and proceed with the HA purification stage, scaling up all volumes by a factor equal to ½ the number of 1.5 mL aliquots used as input for the FLAG IP (i.e.: if 4 × 1.5 mL aliquots were used for the FLAG IP, scale up the HA volumes by a factor of 2).
Understanding Results
The TAP protocol presented in this unit has been used by us and our collaborators to characterize binding partners of proteins spanning a variety of functional categories. This protocol should enable novice and skilled biochemists alike obtain valuable and meaningful information about interaction partners of their POI and help generate novel hypotheses.
TPOI EXPRESSION
Expression of tPOI relative to its endogenous counterpart can be evaluated by western blot analysis if an antibody against the protein of interest is available. The tPOI will usually be observed at a slightly higher molecular weight compared to its endogenous counterpart owing to the peptide tags. The expression and subcellular localization of the tagged and endogenous POI should be comparable (Fig. 3). Expression level of tPOI is primarily driven by the retroviral promoter and as a result, is not directly tunable. However, varying the multiplicity of infection (MOI) during viral transduction can affect the number of integration sites of the viral DNA in the target cell genome and thereby offer some level of control on the final expression level. If mimicking the native expression level and dynamics of tPOI is important, adding the peptide tags at the endogenous locus may be considered. The recent use of CRISPR/cas9 to introduce a variant of the TAP epitope tags in several endogenous loci in the leukemia cell line K562 can be used as a general guide to achieve this goal (Dalvai et al., 2015). The same laboratory recently described an intelligent strategy to enrich cells with the desired genetic alteration (Agudelo et al., 2017).
Figure 3:

Relative expression of several tandem-tagged human proteins and their endogenous counterparts. Cytoplasmic and nuclear extracts were prepared from HeLa S3 cells expressing N-terminal FLAG:HA-tagged PRMT5, N-terminal FLAG:SII-tagged PRMT5, N-terminal FLAG:HA-tagged WDR77, N-terminal FLAG:SII-tagged hnRNPH1, and C-terminal FLAG:SII-tagged PSF. 12.5 µg of each subcellular fraction was loaded on the gel. Western blot detection was performed using commercial antibodies raised against the respective endogenous proteins.
Absolute expression of tPOI should be quantified in all cases. This is readily done by western blot analysis using the HRP-conjugated anti-FLAG antibody and comparing the signal obtained for tPOI relative to a standard curve established with the recombinant FLAG-BAP protein (Fig. 4). This information will help determine the amount of extract required to obtain 1 µg or more of the purified tPOI following TAP.
Figure 4:

Expression of several tandem-tagged human proteins relative to recombinant FLAG-tagged BAP. In addition to extracts described in Figure 1, cytoplasmic and nuclear extracts were prepared from HeLa-S3 cells expressing N-terminal FLAG:SII-tagged RIOK1. A serial dilution of FLAG-BAP was run alongside each fractionated cell extract (17.5 µg). Western blot detection was performed using an HRP-labeled anti-FLAG antibody.
TANDEM AFFINITY PURIFICATION
The first step towards a successful TAP experiment is to ensure optimal recovery of tPOI across the two stages of purification. To monitor recovery, samples are collected during selected steps of the procedure (Basic Protocol 5) and analyzed by western blot using HRP-conjugated anti-FLAG antibody. A typical FLAG purification is characterized by an efficiency close to 100% (Fig. 5). The high efficiency is demonstrated by the near complete depletion of tPOI from the extract (comparing FLAG-IP flow-through, lane 2 and Input, lane 1) and by a nearly quantitative recovery upon competitive peptide elution (FLAG-IP elution, lane 4) with very little tPOI left on the beads after elution (FLAG beads Post-elution, lane 5). The HA purification generally exhibits lower efficiency compared to FLAG (note that the volumetric percentage of the HA-IP elution, lane 8 is 2.5 times that of FLAG-IP elution, lane 4) but is characterized by a substantial increase in specificity (see below).
Figure 5:

Quality control (quantitative). Nuclear extracts (4 mg) from HeLa S3 cells expressing ERCC8:FLAG:HA were subjected to FLAG-IP (2.5 hrs.) and HA-IP (O/N). Samples for quality controls were taken at indicated purification steps and analyzed by western blot. Western blot detection was performed using an HRP-labeled anti-FLAG antibody.
Once the performance of the tandem purification steps has been verified, one should next evaluate specificity by PAGE and silver staining. A typical result for this quality control step is shown (Fig. 6). The relatively poor specificity of the FLAG purification is evidenced by the presence of multiple bands in the negative control purification. An almost identical pattern showing bands with similar intensity should be visible in the FLAG elution from tPOI-containing extracts. A few additional bands corresponding to the tagged protein itself and some of its binding partners should be visible. The relative intensity of these ‘specific’ bands compared to those common to the control and experimental sample will vary depending on the expression levels of the particular tPOI studied.
Figure 6:
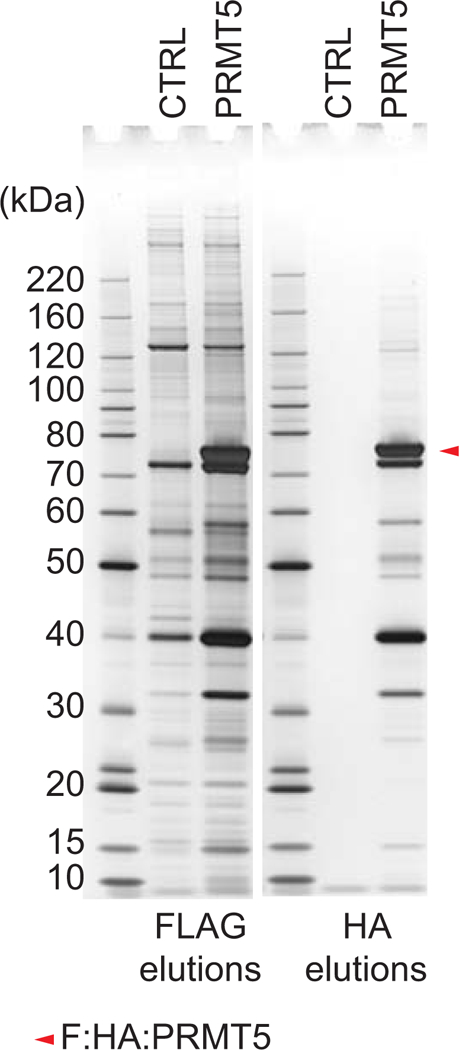
Quality control (qualitative). Cytoplasmic extracts (4 mg) from control (empty pOZ-N vector) HeLa S3 cells and from HeLa S3 cells expressing FLAG:HA:PRMT5 were subjected to FLAG-IP (2.5 hrs.) and HA-IP (O/N). Samples from the FLAG-IP elutions (5%) and from the HA-IP elutions (15%) were analyzed by silver staining.
Three main criteria pertaining to specificity and yield should be considered when evaluating the results from the HA purification:
Absence of visible bands in the HA (or SII) elution for the negative control TAP. Occasionally, a smear of poorly resolved bands can be observed between 60 and 70 kDa. These are likely keratin proteins. A band at the very bottom of the gel usually corresponds to the HA peptide. Although these are technically contaminants, their presence will not preclude proceeding with LC-MS/MS analysis.
Presence of a clearly defined, intense band with the molecular weight of tPOI in the experimental TAP (note that apparent molecular weight may be affected by the choice of acrylamide gels and buffer system but are usually within 5 kDa of the expected MW). Under the conditions specified in this protocol, the intensity of this band should at least match the intensity of one of the bands of the molecular weight marker.
Presence of a few additional bands of varying intensities, observed uniquely in the experimental TAP sample, representing putative binding partners.
It is important to note that the standard TAP cannot resolve distinct subcomplexes: all complexes formed around tPOI that are present in the extract will co-purify. It is possible to enrich discrete subcomplexes with additional chromatography steps or by relying on differential centrifugation (Groisman et al., 2003). Including these additional steps will require a substantial increase in input material. In cases where a protein partner specific to a particular subcomplex is known, it is also possible to rely on a split-TAP approach: in this case the POI and its subcomplex-specific partner need to be tagged with two different, non-overlapping epitopes (Starokadomskyy & Burstein, 2014).
AUTOMATION
Automated TAP enables parallel purification with high reproducibility (Fig. 7) while maintaining specificity on par with a manual protocol (Fig. 8). This approach can be beneficial when multiple samples need to be processed in parallel and manual processing becomes burdensome. This is the case when scaling up is necessary to increase the yield of tPOIs expressed at very low levels.
Figure 7:

Automated TAP on KingFisher. Nuclear extracts (2.4 mg) from control (empty pST-C vector) HeLa S3 cells and from HeLa S3 cells expressing PSF:FLAG:SII were subjected to automated FLAG-IP (3 hrs.) and SII-IP (3 hrs.). Samples from the FLAG-IP elutions (5%) and from the SII-IP elutions (15%) were analyzed by silver staining. The wells containing the control and PSF:FLAG:SII extracts are indicated in the plate schematic above the silver stain image.
Figure 8:

Manual and Automated TAP comparison. Nuclear extracts (6.6 mg) from control (empty pOZ-C vector) HeLa S3 cells and from HeLa S3 cells expressing ERCC8:FLAG:HA were subjected to FLAG-IP (3 hrs.) and HA-IP (O/N). Samples from the manual (MAN.) and automated (KING.) FLAG-IP elutions (5%) and from the HA-IP elutions (15%) were analyzed by silver staining.
DATA ANALYSIS
Depending on the protein under study, its expression level and the scale of the purification, a TAP-MS experiment should result in the identification of a few up to a few dozen candidate binding partners after removing contaminants. tPOI should be present in the list of detected proteins and if XIC-based or other label-free quantification methods were performed as part of the data analysis process, tPOI should be among the most abundant proteins. High-confidence protein binding partners should be reproducibly detected across all replicate TAP experiments, irrespective of the number of peptides through which they were identified (see Figure 1B in Ferry et al., 2017 or Figure 1A in Zhang et al., 2017). This rule can be somewhat relaxed (requiring 2 identifications out of 3 TAPs or 3 out of 5) when the binding partner is thought to be present at low stoichiometry relative to tPOI.
Time Considerations
Identifying binding partners of a protein is a project in and of itself and will require dedicated efforts over a few months. However, the project is easily divided between independent stages described below.
Retroviral vector design and construction: Construction and sequence validation of the retroviral vector can be achieved within 10 days
Viral particle production: Transfection of HEK 293 cells and harvesting viral supernatant takes about 5 days
Cell transduction and selection. This process will take one to two weeks to complete, depending on the volume of viral supernatant used. A few more days will be necessary to verify tPOI expression by western blot analysis.
HeLa-S3 cell culture: Plates are seeded Mondays (or Fridays), refed on Thursdays (or Mondays), and fractionated on Fridays (or Tuesdays). 6 × 10⁸ HeLa-S3 cells (corresponding to 12 × 150 cm plates) can be collected every week for the control and the experimental cell line.
Subcellular fractionation: It will take about 4 hours to process a total of 12 × 150 cm plates (6 plates for the control and 6 plates for the experimental cell line).
tPOI expression analysis: This only needs to be done once after the cell line has been established. The analysis by western blot is completed in 2 days.
Cytoplasmic extract preparation: 1.5 hours. This process is followed by TAP.
Nuclear extract preparation: 2 hours. This process is followed by TAP.
Chromatin extract preparation: This process follows nuclear extract preparation for a total time of 3 hours. It is followed by TAP.
Tandem Affinity Purification. The tandem affinity purification process can be performed within a single day if performing a 2-hour FLAG IP followed by a 4-hour HA or SII purification or 2 days if the second stage is performed overnight.
Preparation of magnetic anti-HA agarose beads. This process, including analysis of quality controls can be completed in 4 to 5 days. This preparation will yield material for
Quality controls: The western blot and silver stain experiments can be performed in parallel and will be completed in 2 days, including data analysis.
Enzymatic digestion: 1 hour followed by overnight incubation.
Peptide clean-up: 2 hours for 4 samples.
LC-MS/MS analysis: 1.5 hour per sample including peptide loading and LC column regeneration. Data analysis and candidate identification will take from a few hours to a few days depending on the complexity of the data.
Supplementary Material
Acknowledgement
Our protocol for TAP-MS has been developed and refined over many years with generous support from the National Institutes of Health (P01-NS047572, P50-HG004233, R01-CA215489, P01-CA203655, R01-CA219850, R01-NS050674).
Literature Cited
- Adelmant G, Calkins AS, Garg BK, Card JD, Askenazi M, Miron A, … Lazaro JB (2012). DNA ends alter the molecular composition and localization of Ku multicomponent complexes. Mol Cell Proteomics, 11(8), 411–421. doi: 10.1074/mcp.M111.013581 [DOI] [PMC free article] [PubMed] [Google Scholar]
- Agudelo D, Duringer A, Bozoyan L, Huard CC, Carter S, Loehr J, … Doyon Y (2017). Marker-free coselection for CRISPR-driven genome editing in human cells. Nat Methods, 14(6), 615–620. doi: 10.1038/nmeth.4265 [DOI] [PubMed] [Google Scholar]
- Alexander WM, Ficarro SB, Adelmant G, & Marto JA (2017). multiplierz v2.0: A Python-based ecosystem for shared access and analysis of native mass spectrometry data. Proteomics, 17(15–16). doi: 10.1002/pmic.201700091 [DOI] [PubMed] [Google Scholar]
- Arsenis C, & McCormick DB (1964). Purification of Liver Flavokinase by Column Chromatography on Flavin-Cellulose Compounds. J Biol Chem, 239, 3093–3097. [PubMed] [Google Scholar]
- Banks CAS, Thornton JL, Eubanks CG, Adams MK, Miah S, Boanca G, … Washburn MP (2018). A structured workflow for mapping human Sin3 histone deacetylase complex interactions using Halo-MudPIT AP-MS. Mol Cell Proteomics doi: 10.1074/mcp.TIR118.000661 [DOI] [PMC free article] [PubMed] [Google Scholar]
- Bouwmeester T, Bauch A, Ruffner H, Angrand PO, Bergamini G, Croughton K, … Superti-Furga G (2004). A physical and functional map of the human TNF-alpha/NF-kappa B signal transduction pathway. Nat Cell Biol, 6(2), 97–105. [DOI] [PubMed] [Google Scholar]
- Butland G, Peregrin-Alvarez JM, Li J, Yang W, Yang X, Canadien V, … Emili A (2005). Interaction network containing conserved and essential protein complexes in Escherichia coli. Nature, 433(7025), 531–537. doi: 10.1038/nature03239 [DOI] [PubMed] [Google Scholar]
- Cato L, Neeb A, Sharp A, Buzon V, Ficarro SB, Yang L, … Brown M (2017). Development of Bag-1L as a therapeutic target in androgen receptor-dependent prostate cancer. Elife, 6. doi: 10.7554/eLife.27159 [DOI] [PMC free article] [PubMed] [Google Scholar]
- Chen Z, Sasaki T, Tan X, Carretero J, Shimamura T, Li D, … Wong KK (2010). Inhibition of ALK, PI3K/MEK, and HSP90 in murine lung adenocarcinoma induced by EML4-ALK fusion oncogene. Cancer Res, 70(23), 9827–9836. doi: 10.1158/0008-5472.CAN-10-1671 [DOI] [PMC free article] [PubMed] [Google Scholar]
- Dalvai M, Loehr J, Jacquet K, Huard CC, Roques C, Herst P, … Doyon Y (2015). A Scalable Genome-Editing-Based Approach for Mapping Multiprotein Complexes in Human Cells. Cell Rep, 13(3), 621–633. doi: 10.1016/j.celrep.2015.09.009 [DOI] [PubMed] [Google Scholar]
- Doherty MF, Adelmant G, Cecchetelli AD, Marto JA, & Cram EJ (2014). Proteomic analysis reveals CACN-1 is a component of the spliceosome in Caenorhabditis elegans. G3 (Bethesda), 4(8), 1555–1564. doi: 10.1534/g3.114.012013 [DOI] [PMC free article] [PubMed] [Google Scholar]
- Duarte M, Wang L, Calderwood MA, Adelmant G, Ohashi M, Roecklein-Canfield J, … Johannsen E (2013). An RS motif within the Epstein-Barr virus BLRF2 tegument protein is phosphorylated by SRPK2 and is important for viral replication. PLoS One, 8(1), e53512. doi: 10.1371/journal.pone.0053512 [DOI] [PMC free article] [PubMed] [Google Scholar]
- Dunham WH, Mullin M, & Gingras AC (2012). Affinity-purification coupled to mass spectrometry: basic principles and strategies. Proteomics, 12(10), 1576–1590. doi: 10.1002/pmic.201100523 [DOI] [PubMed] [Google Scholar]
- Durzynska I, Xu X, Adelmant G, Ficarro SB, Marto JA, Sliz P, … Blacklow SC (2017). STK40 Is a Pseudokinase that Binds the E3 Ubiquitin Ligase COP1. Structure, 25(2), 287–294. doi: 10.1016/j.str.2016.12.008 [DOI] [PMC free article] [PubMed] [Google Scholar]
- Ferry L, Fournier A, Tsusaka T, Adelmant G, Shimazu T, Matano S, … Defossez PA (2017). Methylation of DNA Ligase 1 by G9a/GLP Recruits UHRF1 to Replicating DNA and Regulates DNA Methylation. Mol Cell, 67(4), 550–565 e555. doi: 10.1016/j.molcel.2017.07.012 [DOI] [PubMed] [Google Scholar]
- Ficarro SB, Adelmant G, Tomar MN, Zhang Y, Cheng VJ, & Marto JA (2009). Magnetic bead processor for rapid evaluation and optimization of parameters for phosphopeptide enrichment. Anal Chem, 81(11), 4566–4575. doi: 10.1021/ac9004452 [DOI] [PMC free article] [PubMed] [Google Scholar]
- Ficarro SB, Zhang Y, Lu Y, Moghimi AR, Askenazi M, Hyatt E, … Marto JA (2009). Improved electrospray ionization efficiency compensates for diminished chromatographic resolution and enables proteomics analysis of tyrosine signaling in embryonic stem cells. Anal Chem, 81(9), 3440–3447. doi: 10.1021/ac802720e [DOI] [PubMed] [Google Scholar]
- Fine DA, Rozenblatt-Rosen O, Padi M, Korkhin A, James RL, Adelmant G, … DeCaprio JA (2012). Identification of FAM111A as an SV40 host range restriction and adenovirus helper factor. PLoS Pathog, 8(10), e1002949. doi: 10.1371/journal.ppat.1002949 [DOI] [PMC free article] [PubMed] [Google Scholar]
- Gavin AC, Bosche M, Krause R, Grandi P, Marzioch M, Bauer A, … Superti-Furga G (2002). Functional organization of the yeast proteome by systematic analysis of protein complexes. Nature, 415(6868), 141–147. [DOI] [PubMed] [Google Scholar]
- Giambruno R, Grebien F, Stukalov A, Knoll C, Planyavsky M, Rudashevskaya EL, … Bennett KL (2013). Affinity purification strategies for proteomic analysis of transcription factor complexes. J Proteome Res, 12(9), 4018–4027. doi: 10.1021/pr4003323 [DOI] [PMC free article] [PubMed] [Google Scholar]
- Gloeckner CJ, Boldt K, Schumacher A, Roepman R, & Ueffing M (2007). A novel tandem affinity purification strategy for the efficient isolation and characterisation of native protein complexes. Proteomics, 7(23), 4228–4234. doi: 10.1002/pmic.200700038 [DOI] [PubMed] [Google Scholar]
- Goudreault M, D’Ambrosio LM, Kean MJ, Mullin MJ, Larsen BG, Sanchez A, … Gingras AC (2009). A PP2A phosphatase high density interaction network identifies a novel striatin-interacting phosphatase and kinase complex linked to the cerebral cavernous malformation 3 (CCM3) protein. Mol Cell Proteomics, 8(1), 157–171. doi: 10.1074/mcp.M800266-MCP200 [DOI] [PMC free article] [PubMed] [Google Scholar]
- Greco TM, Guise AJ, & Cristea IM (2016). Determining the Composition and Stability of Protein Complexes Using an Integrated Label-Free and Stable Isotope Labeling Strategy. Methods Mol Biol, 1410, 39–63. doi: 10.1007/978-1-4939-3524-6_3 [DOI] [PMC free article] [PubMed] [Google Scholar]
- Groisman R, Polanowska J, Kuraoka I, Sawada J, Saijo M, Drapkin R, … Nakatani Y (2003). The ubiquitin ligase activity in the DDB2 and CSA complexes is differentially regulated by the COP9 signalosome in response to DNA damage. Cell, 113(3), 357–367. [DOI] [PubMed] [Google Scholar]
- Hein MY, Hubner NC, Poser I, Cox J, Nagaraj N, Toyoda Y, … Mann M (2015). A human interactome in three quantitative dimensions organized by stoichiometries and abundances. Cell, 163(3), 712–723. doi: 10.1016/j.cell.2015.09.053 [DOI] [PubMed] [Google Scholar]
- Hill SJ, Rolland T, Adelmant G, Xia X, Owen MS, Dricot A, … Livingston DM (2014). Systematic screening reveals a role for BRCA1 in the response to transcription-associated DNA damage. Genes Dev, 28(17), 1957–1975. doi: 10.1101/gad.241620.114 [DOI] [PMC free article] [PubMed] [Google Scholar]
- Huttlin EL, Ting L, Bruckner RJ, Gebreab F, Gygi MP, Szpyt J, … Gygi SP (2015). The BioPlex Network: A Systematic Exploration of the Human Interactome. Cell, 162(2), 425–440. doi: 10.1016/j.cell.2015.06.043 [DOI] [PMC free article] [PubMed] [Google Scholar]
- Hwang JH, Pores Fernando AT, Faure N, Andrabi S, Adelmant G, Hahn WC, … Roberts TM (2014). Polyomavirus small T antigen interacts with yes-associated protein to regulate cell survival and differentiation. J Virol, 88(20), 12055–12064. doi: 10.1128/JVI.01399-14 [DOI] [PMC free article] [PubMed] [Google Scholar]
- Jager S, Cimermancic P, Gulbahce N, Johnson JR, McGovern KE, Clarke SC, … Krogan NJ (2011). Global landscape of HIV-human protein complexes. Nature, 481(7381), 365–370. doi: 10.1038/nature10719 [DOI] [PMC free article] [PubMed] [Google Scholar]
- Kim H, Dejsuphong D, Adelmant G, Ceccaldi R, Yang K, Marto JA, & D’Andrea AD (2014). Transcriptional repressor ZBTB1 promotes chromatin remodeling and translesion DNA synthesis. Mol Cell, 54(1), 107–118. doi: 10.1016/j.molcel.2014.02.017 [DOI] [PMC free article] [PubMed] [Google Scholar]
- Koleva RI, Ficarro SB, Radomska HS, Carrasco-Alfonso MJ, Alberta JA, Webber JT, … Marto JA (2012). C/EBPalpha and DEK coordinately regulate myeloid differentiation. Blood, 119(21), 4878–4888. doi: 10.1182/blood-2011-10-383083 [DOI] [PMC free article] [PubMed] [Google Scholar]
- Krogan NJ, Cagney G, Yu H, Zhong G, Guo X, Ignatchenko A, … Greenblatt JF (2006). Global landscape of protein complexes in the yeast Saccharomyces cerevisiae. Nature, 440(7084), 637–643. [DOI] [PubMed] [Google Scholar]
- Kwan JHM, & Emili A (2016). Simple and Effective Affinity Purification Procedures for Mass Spectrometry-Based Identification of Protein-Protein Interactions in Cell Signaling Pathways. Methods Mol Biol, 1394, 181–187. doi: 10.1007/978-1-4939-3341-9_13 [DOI] [PubMed] [Google Scholar]
- Lee J, Adelmant G, Marto JA, & Lee DH (2015). Dephosphorylation of DBC1 by Protein Phosphatase 4 Is Important for p53-Mediated Cellular Functions. Mol Cells, 38(8), 697–704. doi: 10.14348/molcells.2015.0066 [DOI] [PMC free article] [PubMed] [Google Scholar]
- Lerman LS (1953). Antibody chromatography on an immunologically specific adsorbent. Nature, 172(4379), 635–636. [DOI] [PubMed] [Google Scholar]
- Maerki S, Olma MH, Staubli T, Steigemann P, Gerlich DW, Quadroni M, … Peter M (2009). The Cul3-KLHL21 E3 ubiquitin ligase targets aurora B to midzone microtubules in anaphase and is required for cytokinesis. J Cell Biol, 187(6), 791–800. doi: 10.1083/jcb.200906117 [DOI] [PMC free article] [PubMed] [Google Scholar]
- Mathias RA, Greco TM, Oberstein A, Budayeva HG, Chakrabarti R, Rowland EA, … Cristea IM (2014). Sirtuin 4 is a lipoamidase regulating pyruvate dehydrogenase complex activity. Cell, 159(7), 1615–1625. doi: 10.1016/j.cell.2014.11.046 [DOI] [PMC free article] [PubMed] [Google Scholar]
- Meijer DH, Sun Y, Liu T, Kane MF, Alberta JA, Adelmant G, … Mehta S (2014). An amino terminal phosphorylation motif regulates intranuclear compartmentalization of Olig2 in neural progenitor cells. J Neurosci, 34(25), 8507–8518. doi: 10.1523/JNEUROSCI.0309-14.2014 [DOI] [PMC free article] [PubMed] [Google Scholar]
- Miotto B, Marchal C, Adelmant G, Guinot N, Xie P, Marto JA, … Defossez PA (2018). Stabilization of the methyl-CpG binding protein ZBTB38 by the deubiquitinase USP9X limits the occurrence and toxicity of oxidative stress in human cells. Nucleic Acids Res doi: 10.1093/nar/gky149 [DOI] [PMC free article] [PubMed] [Google Scholar]
- Morris JH, Knudsen GM, Verschueren E, Johnson JR, Cimermancic P, Greninger AL, & Pico AR (2014). Affinity purification-mass spectrometry and network analysis to understand protein-protein interactions. Nat Protoc, 9(11), 2539–2554. doi: 10.1038/nprot.2014.164 [DOI] [PMC free article] [PubMed] [Google Scholar]
- Naar AM, Beaurang PA, Zhou S, Abraham S, Solomon W, & Tjian R (1999). Composite co-activator ARC mediates chromatin-directed transcriptional activation. Nature, 398(6730), 828–832. doi: 10.1038/19789 [DOI] [PubMed] [Google Scholar]
- Nakatani Y, & Ogryzko V (2003). Immunoaffinity purification of mammalian protein complexes. Methods Enzymol, 370, 430–444. [DOI] [PubMed] [Google Scholar]
- Pathania S, Nguyen J, Hill SJ, Scully R, Adelmant GO, Marto JA, … Livingston DM (2011). BRCA1 is required for postreplication repair after UV-induced DNA damage. Mol Cell, 44(2), 235–251. doi: 10.1016/j.molcel.2011.09.002 [DOI] [PMC free article] [PubMed] [Google Scholar]
- Pichlmair A, Kandasamy K, Alvisi G, Mulhern O, Sacco R, Habjan M, … Superti-Furga G (2012). Viral immune modulators perturb the human molecular network by common and unique strategies. Nature, 487(7408), 486–490. doi: 10.1038/nature11289 [DOI] [PubMed] [Google Scholar]
- Puig O, Caspary F, Rigaut G, Rutz B, Bouveret E, Bragado-Nilsson E, … Seraphin B (2001). The tandem affinity purification (TAP) method: a general procedure of protein complex purification. Methods, 24(3), 218–229. [DOI] [PubMed] [Google Scholar]
- Quan J, Adelmant G, Marto JA, Look AT, & Yusufzai T (2014). The chromatin remodeling factor CHD5 is a transcriptional repressor of WEE1. PLoS One, 9(9), e108066. doi: 10.1371/journal.pone.0108066 [DOI] [PMC free article] [PubMed] [Google Scholar]
- Ramsby M, & Makowski G (2011). Differential detergent fractionation of eukaryotic cells. Cold Spring Harb Protoc, 2011(3), prot5592. doi: 10.1101/pdb.prot5592 [DOI] [PubMed] [Google Scholar]
- Rigaut G, Shevchenko A, Rutz B, Wilm M, Mann M, & Seraphin B (1999). A generic protein purification method for protein complex characterization and proteome exploration. Nat Biotechnol, 17(10), 1030–1032. [DOI] [PubMed] [Google Scholar]
- Rozenblatt-Rosen O, Deo RC, Padi M, Adelmant G, Calderwood MA, Rolland T, … Vidal M (2012). Interpreting cancer genomes using systematic host network perturbations by tumour virus proteins. Nature, 487(7408), 491–495. doi: 10.1038/nature11288 [DOI] [PMC free article] [PubMed] [Google Scholar]
- Sand-Dejmek J, Adelmant G, Sobhian B, Calkins AS, Marto J, Iglehart DJ, & Lazaro JB (2011). Concordant and opposite roles of DNA-PK and the “facilitator of chromatin transcription” (FACT) in DNA repair, apoptosis and necrosis after cisplatin. Mol Cancer, 10, 74. doi: 10.1186/1476-4598-10-74 [DOI] [PMC free article] [PubMed] [Google Scholar]
- Schmidt TG, & Skerra A (2007). The Strep-tag system for one-step purification and high-affinity detection or capturing of proteins. Nat Protoc, 2(6), 1528–1535. doi: 10.1038/nprot.2007.209 [DOI] [PubMed] [Google Scholar]
- Silman I, & Katchalski E (1966). Water-insoluble derivatives of enzymes, antigens, and antibodies. Annu Rev Biochem, 35, 873–908. doi: 10.1146/annurev.bi.35.070166.004301 [DOI] [PubMed] [Google Scholar]
- Silva JC, Gorenstein MV, Li GZ, Vissers JP, & Geromanos SJ (2006). Absolute quantification of proteins by LCMSE: a virtue of parallel MS acquisition. Mol Cell Proteomics, 5(1), 144–156. doi: 10.1074/mcp.M500230-MCP200 [DOI] [PubMed] [Google Scholar]
- Simarro M, Gimenez-Cassina A, Kedersha N, Lazaro JB, Adelmant GO, Marto JA, … Anderson P (2010). Fast kinase domain-containing protein 3 is a mitochondrial protein essential for cellular respiration. Biochem Biophys Res Commun, 401(3), 440–446. doi: 10.1016/j.bbrc.2010.09.075 [DOI] [PMC free article] [PubMed] [Google Scholar]
- Starokadomskyy P, & Burstein E (2014). Bimolecular affinity purification: a variation of TAP with multiple applications. Methods Mol Biol, 1177, 193–209. doi: 10.1007/978-1-4939-1034-2_15 [DOI] [PubMed] [Google Scholar]
- Trinkle-Mulcahy L, Boulon S, Lam YW, Urcia R, Boisvert FM, Vandermoere F, … Lamond A (2008). Identifying specific protein interaction partners using quantitative mass spectrometry and bead proteomes. J Cell Biol, 183(2), 223–239. doi: 10.1083/jcb.200805092 [DOI] [PMC free article] [PubMed] [Google Scholar]
- Uljon S, Xu X, Durzynska I, Stein S, Adelmant G, Marto JA, … Blacklow SC (2016). Structural Basis for Substrate Selectivity of the E3 Ligase COP1. Structure, 24(5), 687–696. doi: 10.1016/j.str.2016.03.002 [DOI] [PMC free article] [PubMed] [Google Scholar]
- Wang Q, Moore MJ, Adelmant G, Marto JA, & Silver PA (2013). PQBP1, a factor linked to intellectual disability, affects alternative splicing associated with neurite outgrowth. Genes Dev, 27(6), 615–626. doi: 10.1101/gad.212308.112 [DOI] [PMC free article] [PubMed] [Google Scholar]
- Washburn MP (2016). There is no human interactome. Genome Biol, 17, 48. doi: 10.1186/s13059-016-0913-4 [DOI] [PMC free article] [PubMed] [Google Scholar]
- Watanabe H, Ma Q, Peng S, Adelmant G, Swain D, Song W, … Bass AJ (2014). SOX2 and p63 colocalize at genetic loci in squamous cell carcinomas. J Clin Invest, 124(4), 1636–1645. doi: 10.1172/JCI71545 [DOI] [PMC free article] [PubMed] [Google Scholar]
- Wei Y, Chiang WC, Sumpter R Jr., Mishra P, & Levine B (2017). Prohibitin 2 Is an Inner Mitochondrial Membrane Mitophagy Receptor. Cell, 168(1–2), 224–238 e210. doi: 10.1016/j.cell.2016.11.042 [DOI] [PMC free article] [PubMed] [Google Scholar]
- Zhang C, Li X, Adelmant G, Dobbins J, Geisen C, Oser MG, … Kaelin WG Jr. (2015). Peptidic degron in EID1 is recognized by an SCF E3 ligase complex containing the orphan F-box protein FBXO21. Proc Natl Acad Sci U S A, 112(50), 15372–15377. doi: 10.1073/pnas.1522006112 [DOI] [PMC free article] [PubMed] [Google Scholar]
- Zhang J, Gao X, Schmit F, Adelmant G, Eck MJ, Marto JA, … Roberts TM (2017). CRKL Mediates p110beta-Dependent PI3K Signaling in PTEN-Deficient Cancer Cells. Cell Rep, 20(3), 549–557. doi: 10.1016/j.celrep.2017.06.054 [DOI] [PMC free article] [PubMed] [Google Scholar]
- Zhou F, Cardoza JD, Ficarro SB, Adelmant GO, Lazaro JB, & Marto JA (2010). Online nanoflow RP-RP-MS reveals dynamics of multicomponent Ku complex in response to DNA damage. J Proteome Res, 9(12), 6242–6255. doi: 10.1021/pr1004696 [DOI] [PMC free article] [PubMed] [Google Scholar]
Associated Data
This section collects any data citations, data availability statements, or supplementary materials included in this article.