Abstract
Objective:
we aim to study to what extent conventional and deep-learning-based T2 relaxometry patterns are able to distinguish between knees with and without radiographic OA.
Methods:
T2 relaxation time maps were analyzed for 4,384 subjects from the baseline Osteoarthritis Initiative Dataset. Voxel Based Relaxometry was used for automatic quantification and voxel-based analysis of the differences in T2 between subjects with and without radiographic OA. A Densely Connected Convolutional Neural Network (DenseNet) was trained to diagnose OA from T2 data. For comparison, more classical feature extraction techniques and shallow classifiers were used to benchmark the performance of our algorithm’s results. Deep and shallow models were evaluated with and without the inclusion of risk factors. Sensitivity and Specificity values and McNemar test were used to compare the performance of the different classifiers.
Results:
The best shallow model was obtained when the first ten Principal Components, demographics and pain score were included as features (AUC=77.77%, Sensitivity = 67.01%, Specificity = 71.79%). In comparison, DenseNet trained on raw T2 data obtained AUC=83.44%, Sensitivity= 76.99%, Specificity=77.94%,. McNemar test on two misclassified proportions form the shallow and deep model showed that the boost in performance was statistically significant (McNemar’s chi-squared = 10.33, DF = 1, P-value = 0.0013)
Conclusion:
In this study, we presented a MRI-based data-driven platform using T2 measurements to characterize radiographic OA. Our results showed that feature learning from T2 maps has potential in uncovering information that can potentially better diagnose OA than simple averages or linear patterns decomposition.
Keywords: Deep Learning, Convolutional Neural Network, Voxel Based Relaxometry, Quantitative MRI, T2 relaxation times
INTRODUCTION
Osteoarthritis (OA) affects 27 million U.S. adults [1] and often leads to severe disability [2]. The prevalence of OA is 33.6% in adults older than 65 years [3]. Although OA is a widespread and debilitating disease, treatment options are currently limited, and disease-modifying therapies have not been established yet [4]. In an effort to develop quantitative biomarkers for OA and to fill the void that exists for diagnosing, monitoring and assessing the extent of early whole joint degeneration in OA, the past decade has shown an increase in using noninvasive imaging for OA. Magnetic Resonance Imaging (MRI) is a central component of large-scale epidemiologic observational studies such as the Osteoarthritis Initiative (OAI), where it can provide a rich array of structural and functional features of musculoskeletal tissues, which in turn shed light on disease etiology, potential treatment pathways, and prognostic tools for long-term disease outcomes.
MR-derived compositional imaging techniques, such as T2 relaxation times, assess the structural and biochemical properties of cartilage since they are sensitive to changes in collagen orientation and water content [5][6]. The degenerative changes observed in MRI are commonly quantified using averaged region of interest (ROI) based approaches. In such approaches, relevant compartments of cartilage are segmented, and each ROI within the cartilage is described by its average T2 value. However, previous studies reported that spatially assessing relaxation times of the knee cartilage using laminar and sub-compartmental analyses could lead to better and possibly earlier identification of cartilage matrix abnormalities [7, 8]. Accordingly, in the last few years, quantitative MRI research has been characterized by a growing interest in exploring the spatial distribution and local patterns in relaxation time maps.
Extraction of second-order statistical information or texture analysis [9, 10] has been widely used to overcome the limitation of the average-based approaches. While texture descriptors have the potential to capture local information, the most commonly used method is based on gray levels co-occurrence matrix [9, 10] which summarizes the values of contrast, entropy, and other textural features on a regional basis. Because of that, even if grayscale co-occurrence textural features can explain the local changes adequately, they do not capture the specific localization of the changes to a voxel level.
In an attempt to overcome these limitations, a novel fully-automated and data-driven algorithm for transforming all knee relaxation time images to a standard coordinate system, and deriving Voxel Based Relaxometry (VBR) maps has been previously proposed [11]. This technique allows for the investigation of local cartilage composition differences between two groups of subjects, or subjects at different time points, through voxel-based statistics or Statistical Parametric Mapping (SPM) [12]. The fact that all images are aligned to a single template in VBR makes it possible to consider each patient as a data-point in a multi-dimensional feature space. Feature extraction techniques that generate a smaller set of predictors that seek to capture the majority of the information can be adopted for analysis of T2 data. Principal Component Analysis (PCA), a commonly used feature extraction technique, can be utilized to efficiently abstracts the characteristics of the multidimensional point cloud obtained from VBR maps of subjects, and to discover the latent patterns and subgroups of biochemical composition among subject groups.
In order to shift away from using conventional handcrafted features (such as averages or standard deviations over specified regions) to describe T2 maps; we can employ data-driven models that are trainable to learn relevant features from the raw input. The concept of feature learning is the very strength of deep learning [13]. It has shown the superiority of data-driven feature extraction in comparison to conventional hand-crafted knowledge-based features in medical imaging field [14–16]; which in quantitative T2 mapping translates to abandoning the established concept of regions of interest or compartmental average analysis in favor of data-driven representation of relevant information directly from the raw data [13].
In this study, we propose a fully automated method for the analysis of T2 relaxation time maps with the aim of extracting relevant relaxometry patterns to classify radiographic knee OA in the entire Osteoarthritis Initiative baseline dataset. We aim to establish the role of data-driven feature extraction to exploit the potential of T2 relaxation times in comparison to classic feature handcrafting.
We hypothesize that the coupling of quantitative compositional MRI and deep learning can uncover latent feature representations, non-linear aggregation among elementary features, and thus better characterize OA as compared to compartmental averages or linear patterns decompositions.
METHODS
Dataset
All the 4,797 subjects recruited and imaged for the Osteoarthritis Initiative study were initially included. From this dataset, 4,663 subjects had a T2 mapping acquisition; and 4,384 also had a radiographic evaluation of OA performed with Kellgren and Lawrence (KL) grading system (central readings) [17]. Within this group, 1937 (44.2%) subjects showed radiographic OA (KL≥2), and 2447 (55.8%) were considered controls (KL<2). Table 1 shows the distribution of the demographics and pain scores from the Knee Outcomes in Osteoarthritis Scores (KOOS) [18] survey.
Table 1:
Subjects Demographic and Clinical Characteristics (N=4384)
| Characteristic | OA: KL 2–4 (N=1937) | Controls KL=0–1 (N=2447) | P-value |
|---|---|---|---|
| Age (years)b | 62.73 ± 8.90 | 59.86 ± 9.12 | 2.59E-25 |
| BMI (kg/m2)b | 29.73 ± 5.07 | 27.53 ± 4.47 | 2.28E-51 |
| Sexa | |||
| Female | 766 (39.54%) | 1063 (43.44%) | 0.0094 |
| Male | 1171(60.45%) | 1384 (56.55%) | |
|
KOOS Pain (0–100, 0 = worst outcome)b |
79.78 ± 18.61 | 88.29 ± 14.38 | 2.76E-63 |
Data expressed as Count (Percentage %).
Data expressed as Mean ± Standard Deviation.
Experimental Design
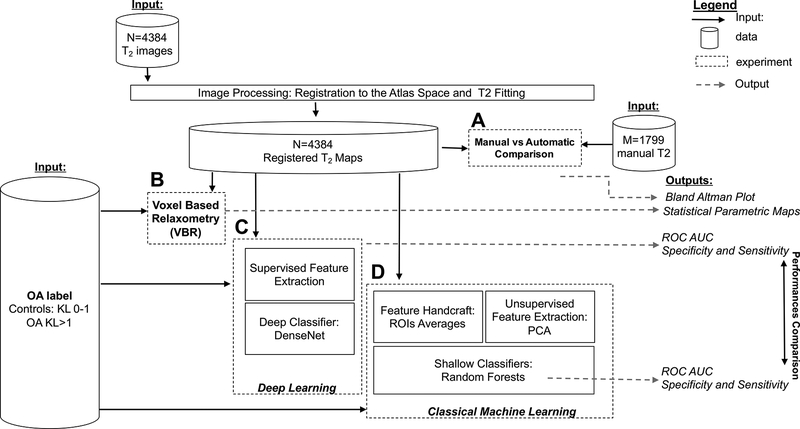
All the 4,384 T2 maps were processed to obtain the automated evaluation of T2 values. The overall experimental design, including input/output for each experiment, is shown in Figure 1. We performed four main experiments: (1) Comparison between manual and automated segmentation of T2 maps (Figure 1A), (2) Voxel-based Relaxometry analysis to detect local OA features in T2 maps (Figure 1B), (3) Exploration of the usage of Deep Learning to predict OA classes from T2 maps (Figure 1C), and (4) Classical machine learning to predict OA classes using the extracted features from T2 maps with the aim of establishing a performance benchmark (Figure 1D).
Figure 1:
Experimental design overview.
Image Processing
Image analysis was performed with software developed in-house using MATLAB (Mathworks Inc, El Segundo, CA) integrated with the elastix registration library [19]. All the images were morphed to the space of a reference obtaining matched T2-weighed images, using a previously developed and evaluated technique [11]. An intensity-based multi-resolution pyramidal approach was applied for the registration. B-spline transformation was used for the morphing and Advanced Mattes Mutual Information image similarity was used as an objective function.
Global non-rigid registration was applied first, and four local registrations were then applied using the reference cartilage segmentation to constrain the image area considered in the registration optimization. This process was performed on the first T2 -weighted image and the transformation obtained was applied to all the followed T2-weighted images. T2 maps were then computed on the morphed echoes using a three-parameter, Levenberg-Marquardt mono-exponential: (S(TE) α exp(−TSL/T2)+C). The reference image was selected through an iterative process aimed to minimize the dataset global deformation. Four compartments, [medial femoral condyle (MF), lateral femoral condyle (LF), medial tibia (MT), lateral tibia (LT)] were segmented manually on the reference knee, and the mask from the reference segmentation was applied to all the other images in the dataset, to obtain a fully automated estimation of the cartilage T2 relaxation time.
Comparison with Manual Segmentation
A total of 1799 cases was segmented manually in the course of several studies performed between 2011 and 2017 from two main NIH projects: U01AR059507, P50AR060752. The availability of manual segmentation was the only criteria for case selection. All the users that performed manual segmentation went through the same training, and all the manual segmentation and T2 results were previously quality controlled and used in published studies. Bland-Altman plots were used to compare manual and automated T2 averages in the four cartilage compartments.
Voxel-Based Relaxometry
Statistical Parametric Mapping (SPM) was conducted to assess the voxel-based variability differences between the two groups, participants with radiographic OA vs. control. Voxel-based summary statistics, including the group mean and standard deviation maps, were calculated. Group comparisons were performed using a one-way Analysis of Variance (ANOVA) model using the two-sided overall alpha level of 0.05. Percentage of voxels that showed the significant difference in T2 measurements between the OA cohort and control and the average percentage differences in T2 values for each of four compartments were summarized by SPMs. Age, gender, and, body mass index (BMI) were considered as adjusting factors in statistical analyses. Random Field Theory (RFT) [20] was used to find the significant threshold which gives 0.05 family-wise error rate. RFT solves the multiple comparison problem by using results that give the expected Euler Characteristic (EC) [21] for a smooth statistical map that has been thresholded. RFT, unlike than Bonferroni correction, accounts for the fact that observations in a smooth map are not independent of each other.
OA Prediction with Learned Features: Deep Learning
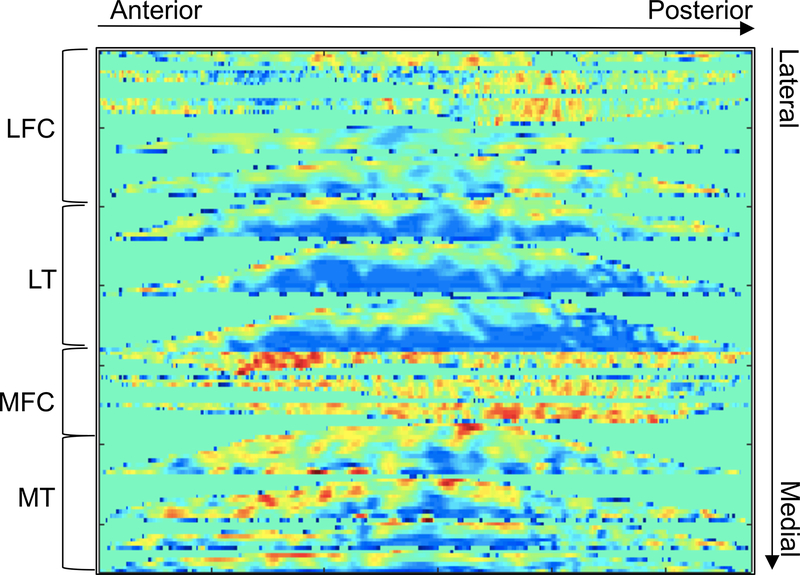
We trained a convolutional neural network (CNN) to perform the task of predicting OA classes, the presence of radiographic OA or absence of radiographic OA, by learning features from the T2 maps. A flattening technique, previously used for texture analysis [22], was adopted here to stitch the four compartments together. To flatten the cartilage, the geodesic length of the cartilage-bone interface was computed, and points along this curve were uniformly sampled. For each sampled point a normal and tangent vector was computed. Warping was applied with backward mapping to bring the original cartilage points to their corresponding target positions with the inherent constraints of preserving the geodesic length and cartilage thickness. All the flattened slices were stitched together in the raw image direction after resizing each flattened slice to the same number of columns, 256. The 2D image obtained through this process was then also resized in the row direction to 256, and all the intensities were clipped at 100ms, then scaled to between 0 and 1 using the max-min method. Through this process, we obtained a 2D matrix, which served as input to the convolutional neural network, Figure 2 shows an example.
Figure 2:
Example of the 2D flatten T2 map used as input to the convolutional neural network
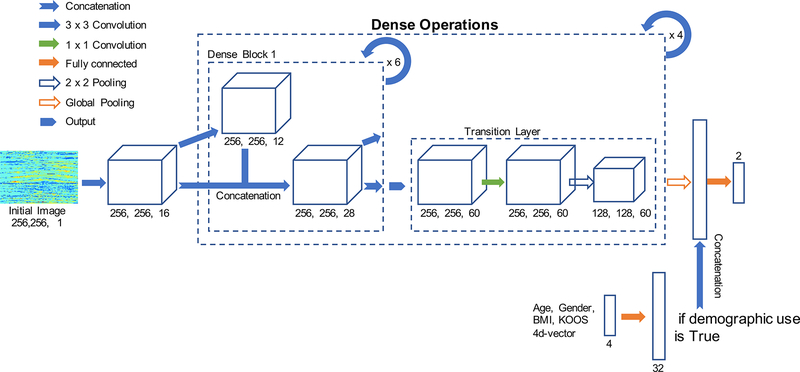
We employed a densely connected neural network (DenseNet) as our model architecture [23, 24]. The architecture contains a feature layer capturing low-level features, dense blocks, and transition layers between adjacent dense blocks (Figure 3). The whole dataset was divided into a 65-20-15% split of training, validation, and hold-out testing set.
Figure 3:
Design of the Densely connected neural network used for the OA classification from T2 relaxation times maps.
We trained the DenseNet from scratch (random weight initialization) with a learning rate of 1e-4, 0–1 input image normalization, cross-entropy loss function, growth rate of 12, block depth of 6, for 20 epochs on an NVIDIA Titan X GPU, implemented in native TensorFlow (Google, Mountain View CA). Termination at 20 epochs was chosen by observing the learning curve of training and validation losses in an attempt to reduce overtraining that would translate to overfitting of the model.
Instead of adopting the traditional fully connected layer for classification, we used a technique which directly outputs the spatial average of the feature maps as the confidence about the predicted class via a global average pooling layer, and the resulting vector is then fed into the softmax layer [25]. Global average pooling compared with traditional fully connected layer has an advantage as it enforces correspondence between feature maps and categories. Global average pooling provides structural regularization and prevents overfitting without entirely relying on drop out regularization [25].
We also applied a modification on the original architecture for the inclusion of demographic and clinical predictors. Age, gender, BMI and KOOS reported pain scores were standardized by subtracting the sample mean and dividing by the standard deviation. The standardized features are fed in as a 4-dimensional vector and then multiplied element-wise by a 32-dimensional weight vector (simply a trainable fully connected layer). This 32-dimensional layer was then concatenated onto the features output of the DenseNet trained on the flattened T2 map.
OA Prediction with hand-crafted features: Random Forests
In an attempt to benchmark the predictive performance of the deep learning model, classical feature extraction in conjunction with shallow machine learning classification models, Random Forests (RF), were investigated. The same split datasets used for DenseNet, training, validation, and hold-out test set, were used for model building, fine-tuning, and final model evaluation.
A total of five candidates sets of hand-crafted features were explored: First, the conventional method of taking average of T2 values in four compartments, MF, LF, MT, and LT, were considered (feature set 1). Second, demographic features and self-reported KOOS pain scores were used (feature set 2). Third, four average T2 values combined with demographic features were considered together (feature set 3). Next, Principal Components Analysis (PCA) on VBR maps was used to extract the 10 most important modes of variation in the overall T2 maps (feature set 4). Each Principal Component (PC) describes a specific relaxometry pattern, and each T2 map was decomposed into a linear combination of those patterns. The estimated coefficients of PCs represent the level of departure from the mean relaxometry patterns over all samples. Lastly, the scores from PCA combined with demographic features were inspected together (feature set 5).
For each set of hand-crafted features from the training set, RF was fit with the number of estimators from 50 to 100, Gini impurity score and entropy as the criteria for the quality of a split, sqrt(number of features) and log2(number of features) as the maximum number of features considered at each split, in conjunction with several values of minimum number of samples required to split the node: 2, 4, 6, 8, and 10. A total of 600 combinations of tuning parameters were grid-searched for each of five feature sets and evaluated on the validation set. Area under the curve of the receiver operator characteristic (ROC) curve was used to compare the best RF classifier for each of five feature set.
Comparing the predictive performance of shallow and deep classification model
The identified best-performing feature set combined with the fine-tuned RF classifier was evaluated on the hold-out test set. The DenseNet trained and fine-tuned on flattened raw T2 map and demographic features were also evaluated on the same hold-out test set. Due to the relatively large sample size, we could safely assume that the variation generated from the random data split is small enough. Additionally, we assumed that internal randomness in two models, for example, random weight initialization in CNN and bootstrap in RF, are small enough. To formally compare the results of the two models we performed McNemar’s chi-squared test on the proportions that two models disagree on the OA prediction [26]
RESULTS
Comparison with Manual Segmentation
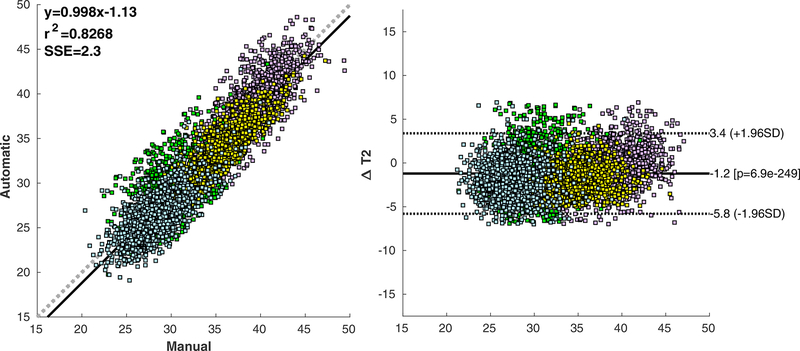
Manual and automated T2 quantification showed a good agreement for the femoral compartment: average absolute difference of 2.16ms (6.19%) for the lateral femur (Pearson correlation R=0.82) and 1.73ms (4.46%) for the medial femur (Pearson correlation R=0.75). The agreement in the tibia compartments was not as good: average absolute difference of 2.37ms (8.32%) for the lateral femur (Pearson correlation R=0.75); and 2.31ms (7.69%) for the medial tibia (Pearson correlation R=0.60). Figure 4 shows the correlation scatter plot and Bland-Altman plot for the four compartments.
Figure 4:
Bland-Altman and correlation plots showing a comparison between manual and automated average T2 relaxation time computed for 1799 cases in the OAI dataset.
Voxel Based Relaxometry
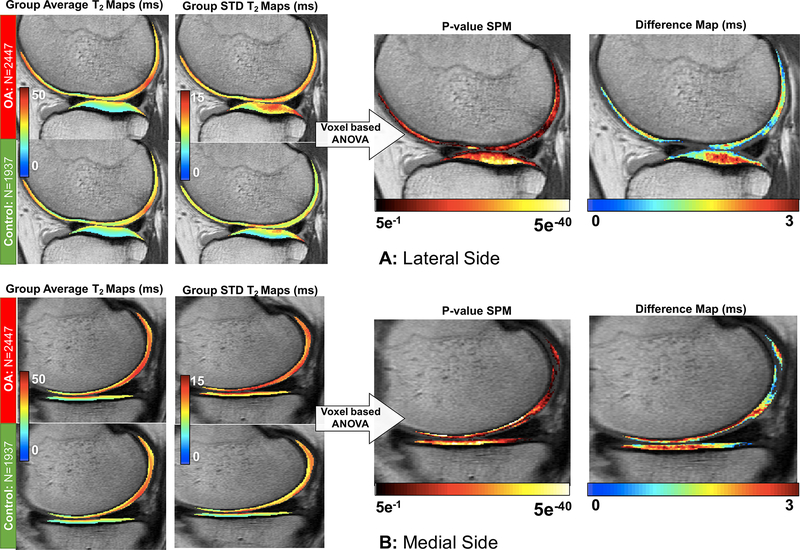
Local analysis of the T2 measurements differences between OA and control knees performed with Statistical Parametric Mapping technique showed a general prolongation of the relaxation time in all four cartilage compartments. After adjusting for multiple comparisons, 92.35% of the medial tibia voxels showed a significant T2 prolongation on the average of 2.33ms (7.78%, 95-CI [2.27ms - 2.39ms]); based on the results of the voxel-based one-way ANOVA; 80.94% of the lateral tibia voxels showed a T2 prolongation of 2.12ms (8.42%, 95-CI [2.09ms - 2.14ms]); 73.82% of the medial femoral voxels showed T2 prolongation of 2.63ms (6.66%, 95-CI [2.58ms −2.67ms]) and 80.61% of the medial femoral voxels showed a T2 prolongation of 1.91ms (5.52%, 95-CI [1.89ms - 1.93ms]). Figure 5 shows the average and standard deviation of T2 measurements in the atlas space for OA and control groups. The mean difference in prolongation of T2 values observed in the OA cohort compared to the control in the significant voxels and p-value map indicating level of significance is also shown. From this map, where no a-priori sub compartmental or laminar subdivisions are imposed, it can be seen that the significant prolongation in T2 in the femoral compartments is driven by differences in the deep layer of the cartilage and, specifically in the weight-bearing areas, whereas the superficial layer did not show significant differences. In the tibial compartments, the strongest differences were observed in the central portion of the cartilage plate.
Figure 5.
Voxel-based statistical parametric map analysis of the baseline OAI dataset in distinguish subjects with and without sign of OA average and standard deviation maps are shown for OA and controls. T2 average prolongation observed in OA subjects and p-value map are also shown (N=1937). The maps show just voxel that reaches significance after adjustment for multiple comparison. (A) VBR analysis showed in a representative lateral slice. (B) VBR analysis showed in a representative medial slice.
OA Prediction with Learned Features: Deep Learning
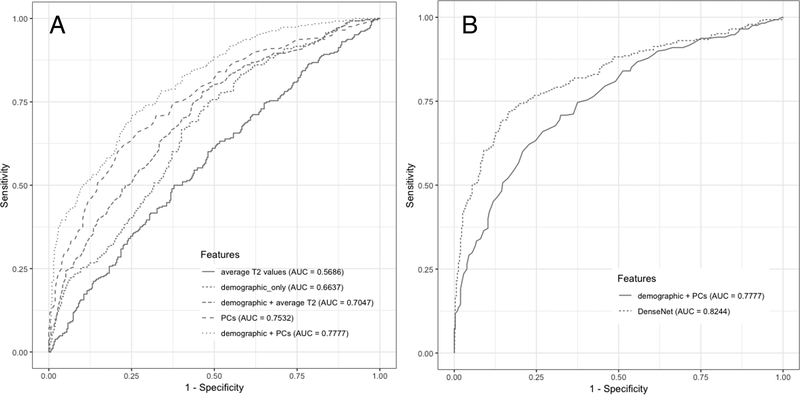
DenseNet directly trained to learn the features from T2 maps, without handcrafted feature extraction, achieved sensitivity equal to 74.53% and specificity equal to 76.13%. When age, gender, BMI, and KOOS pain scores were included, we observed an increase in performance with Sensitivity equal to 76.99% and Specificity equal to 77.94% (AUC = 82.44%).
OA Prediction with hand-crafted Features: Random Forests
Figure 6A shows a visualization of the area under the ROC curve for the final models with the five datasets. RF models built and fine-tuned only on the average T2 measurements, feature set 1, did not perform well (Sensitivity = 48.96%, Specificity = 62.82%). The performance improved when demographic features and knee pain scores were included (Sensitivity = 62.85%, Specificity = 60.26%). RF model with PCs from VBR T2 maps performed better than RF with mean T2 measurements combined with demographic features (Sensitivity = 65.97%, Specificity = 66.67%). The predictive performance improved when demographic features were added to the PCs and we chose this RF trained on feature set 5 as our final model (Sensitivity = 67.01%, Specificity = 71.79%). This model was chosen as best shallow classifier to be compared to the DenseNet (Sensitivity = 76.99%, Specificity =77.94%), Figure 6B.
Figure 6:
(A) ROC curves comparing the Random Forest results between different feature combination. (B) Comparison of the best performant shallow classifier with the deep learning model.
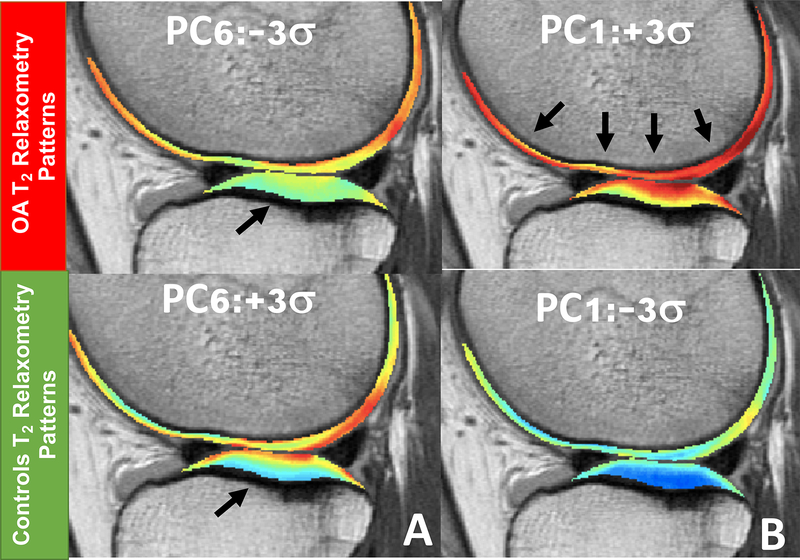
Though RFs generally suffer from the limitation related to bias, the ensemble nature allows us to gain an understanding of the relationship between features and the response variable. The relative importance scores of the features in the feature set 5, T2 PCs and demographic information, were estimated using the aggregated purity improvement across the final RF model, and presented in Table 2. For this model, PC Six got into the topmost important radiographic OA class predictor. The lower scores the PC Six, the smaller difference of T2 measurements were observed between deep and superficial layers (Figure 7A), potentially indicating that it can characterize and identify subjects with radiographic OA better than conventional metrics as compartmental average of T2 measurement. BMI was the most important predictors among demographic features considered for this model, whereas age and gender had the least relative importance scores. PC one which describe the most widely used global average T2 prolongation it is only the firth predictor (Figure 7B).
Table 2:
Features importance racking computed for the best performing shallow classifier (10 PCs + Demographics)
| Features | Relative Importance |
|---|---|
| PC6 | 0.1138 |
| BMI | 0.0975 |
| PC2 | 0.0968 |
| PC1 | 0.0865 |
| PC9 | 0.0787 |
| PC8 | 0.0780 |
| KOOS | 0.0768 |
| PC3 | 0.0719 |
| PC7 | 0.0643 |
| PC10 | 0.0632 |
| PC4 | 0.0553 |
| PC5 | 0.0544 |
| Age | 0.0539 |
| Gender | 0.0090 |
Figure 7.
(A) Modeling of the most significant T2 relaxometry patterns associated with radiographic OA. Subjects with KL>1 exhibit a decreased difference between superficial and deep layer of the cartilage. (B) Modeling of the first Principal component which describe the most variation in the dataset and it is related with global T2 averages but was not the first contributor for the OA vs Control distinction.
Comparing the predictive performance of shallow and deep classification model
When we compared the best RFs with DenseNet the deep learning model showed less miscalculation rate compared with the best shallow model (22.83% vs. 30.5%). A McNemar test on two proportions, the ratio of test set that DenseNet correctly classified but RF didn’t, and vice versa, showed that two proportions are significantly different (McNemar’s chi-squared = 10.33, DF = 1, P-value = 0.0013 (two-sided)).
DISCUSSION
In this study, we explored the ability of voxel-based relaxometry and deep learning to extract relaxometry patterns that are able to classify radiographic OA. The results of this study have the potential to enrich our knowledge with the role of quantitative compositional MRI analysis in studying OA beyond the usage of descriptive statistics of relaxation time parametric maps. Sensitivity and specificity of relaxation time techniques, and the absence of a defined threshold to classify OA, has been criticized in previous studies [27]. However, our results show there may be more information, beyond simple averages over compartments that can be extracted from T2 maps by capitalizing on the recent advances in computer vision and deep learning.
A prior study used machine learning, specifically weighted neighbor distance using compound hierarchy of algorithms representing morphology (WND-CHRM), to predict symptomatic progression of knee OA using T2 values demonstrated some concepts of using data-driven feature extraction on T2 maps, obtained encouraging results (accuracy 75%) [28]. However, the analysis was limited to the medial femur compartment alone and a small sample size of 68 did not allow the authors to perform a formal cross-validation and the evaluation was performed with the leave-one-out technique which is known to overestimate the actual generalizability of the model.
In contrast, in this study, we applied automated feature learning of CNN in addition to the classical feature extraction techniques, which allowed us to gain the understanding of the relaxation time features. The PCA-based pattern analysis approach applied in this study provided insights on the role of the different layers of cartilage T2 in characterizing OA; similar results were previously observed in a much smaller pilot study on a separate dataset (N=40) [29]. Our results suggest that, in addition to the expected global average T2 prolongation, OA subjects show a localized prolongation just in the deep layer of the cartilage which ultimately results in the T2 differences between the two layers being different in subjects with radiographic OA compared to controls. While several previous studies adopted laminar analysis strategies to separately characterize the biochemical composition of the two layers to improve sensitivity [9, 30], the difference between the layers has not been explored as an OA relaxometry pattern. In OA subjects, the integrity of the collagen matrix and permeability of the fluid in the layer, which is critical to maintaining the cartilage mechanical properties, is compromised [31]. It may result in a decreased distinction between superficial and deep layers, making the difference between cartilage layer relaxation times a plausible imaging biomarker associated with OA. Souza et al. [32] observed a similar effect of decreased differences between the two layers while studying static loading in knee articular cartilage relaxation times. T1ρ and T2 values were observed to increase with loading in the deep layer and decrease in the superficial layer. In that study, changes in relaxation times due to loading were observed to be generally larger in the OA group, suggesting a reduced ability to dissipate loads and a decreased ability to retain water in OA subject cartilage.
One of the limitations of this study is that OA was defined using radiographic criteria. It is well known that signs of cartilage degeneration can be observed well before radiographic manifestation of the disease. Clearly, studies considering MR lesions and symptomatic OA are warranted. This study needs to be considered as a proof of concept of the use of deep learning to learn features from T2 maps, since in this study no attempts were made to optimize the convolutional neural network. Usage of other architectures, different choices of hyper parameters or different learning strategies may improve these initial results significantly.
When used in this large heterogeneous sample, in a fully automated fashion and without the ability of any case-by-case quality control, the single atlas-based method used for VBR segmentation showed some failure cases, in which we observed unacceptable differences between manual and automated segmentation of T2 maps. Future directions may include deep learning based-segmentation [33, 34] to drive the registration procedure and potentially improve the current results.
In this study, we considered only the relaxation times in the tibia-femoral cartilage for the characterization of OA and included only the age, gender, BMI, and KOOS reported pain scores in the model. OA is whole organ disease that includes other tissues in the joint, specifically their morphological, biochemical, and biomechanical aspect, along with the subjects physical activity levels; the separate analysis of each contributing factor is unable to fully capture the complex nature of this multifactorial disease [35, 36]. Thus, further evaluation including the features in the meniscus and bone marrow, along with activity levels, may provide greater insights. OA, being a polygenic, and complex disease, characterized by several phenotypes, is the perfect candidate for multidimensional and multimodal approaches [37] and big data feature extraction and multifactorial data-integration from diverse assessments spanning morphological, biochemical, genetic features are required to accomplish this task. However, automating the post-processing pipelines is definitely one of the integral and mandatory steps to accomplish this task and despite the narrow focus in this paper, we have taken the first stride in this direction.
In conclusion, this study, utilizing quantitative imaging, voxel-based relaxometry and deep learning convolutional neural networks is an effort to set up an MRI-based data-driven platform for improving OA outcome prediction and patient sub-stratification. The innovation lies in the fact that T2 relaxometry features are automatically extracted without a-priori assumptions and have been used to analyze the entire baseline OAI T2 dataset extracting significant features to describe characteristics of radiographic OA.
ROLE OF FUNDING SOURCE
This project was supported by K99AR070902 (VP), P50 AR060752 (SM) R61AR073552 (SM/VP) from the National Institute of Arthritis and Musculoskeletal and Skin Diseases, National Institutes of Health, (NIH-NIAMS).
Footnotes
Publisher's Disclaimer: This is a PDF file of an unedited manuscript that has been accepted for publication. As a service to our customers we are providing this early version of the manuscript. The manuscript will undergo copyediting, typesetting, and review of the resulting proof before it is published in its final citable form. Please note that during the production process errors may be discovered which could affect the content, and all legal disclaimers that apply to the journal pertain.
CONFLICTS OF INTEREST
The authors have no conflict of interests to disclose
REFERENCES
- 1.Neogi T The epidemiology and impact of pain in osteoarthritis. Osteoarthritis Cartilage 2013; 21: 1145–1153. [DOI] [PMC free article] [PubMed] [Google Scholar]
- 2.Deshpande BR, Katz JN, Solomon DH, Yelin EH, Hunter DJ, Messier SP, et al. Number of Persons With Symptomatic Knee Osteoarthritis in the US: Impact of Race and Ethnicity, Age, Sex, and Obesity. Arthritis Care Res (Hoboken) 2016; 68: 1743–1750. [DOI] [PMC free article] [PubMed] [Google Scholar]
- 3.Centers for Disease Control and Prevention: Osteoarthritis. 2017. [Google Scholar]
- 4.Felson DT, Lawrence RC, Hochberg MC, McAlindon T, Dieppe PA, Minor MA, et al. Osteoarthritis: new insights. Part 2: treatment approaches. Ann Intern Med 2000; 133: 726–737. [DOI] [PubMed] [Google Scholar]
- 5.Link TM, Neumann J, Li X. Prestructural cartilage assessment using MRI. J Magn Reson Imaging 2017; 45: 949–965. [DOI] [PubMed] [Google Scholar]
- 6.David-Vaudey E, Ghosh S, Ries M, Majumdar S. T2 relaxation time measurements in osteoarthritis. Magn Reson Imaging 2004; 22: 673–682. [DOI] [PubMed] [Google Scholar]
- 7.Carballido-Gamio J, Joseph GB, Lynch JA, Link TM, Majumdar S. Longitudinal analysis of MRI T2 knee cartilage laminar organization in a subset of patients from the osteoarthritis initiative: a texture approach. Magn Reson Med 2011; 65: 1184–1194. [DOI] [PubMed] [Google Scholar]
- 8.Carballido-Gamio J, Stahl R, Blumenkrantz G, Romero A, Majumdar S, Link TM. Spatial analysis of magnetic resonance T1rho and T2 relaxation times improves classification between subjects with and without osteoarthritis. Med Phys 2009; 36: 4059–4067. [DOI] [PMC free article] [PubMed] [Google Scholar]
- 9.Schooler J, Kumar D, Nardo L, McCulloch C, Li X, Link TM, et al. Longitudinal evaluation of T1rho and T2 spatial distribution in osteoarthritic and healthy medial knee cartilage. Osteoarthritis Cartilage 2014; 22: 51–62. [DOI] [PMC free article] [PubMed] [Google Scholar]
- 10.Williams A, Winalski CS, Chu CR. Early articular cartilage MRI T2 changes after anterior cruciate ligament reconstruction correlate with later changes in T2 and cartilage thickness. J Orthop Res 2016. [DOI] [PMC free article] [PubMed] [Google Scholar]
- 11.Pedoia V, Li X, Su F, Calixto N, Majumdar S. Fully automatic analysis of the knee articular cartilage T1rho relaxation time using voxel-based relaxometry. J Magn Reson Imaging 2016; 43: 970–980. [DOI] [PMC free article] [PubMed] [Google Scholar]
- 12.Wright IC, McGuire PK, Poline JB, Travere JM, Murray RM, Frith CD, et al. A voxel-based method for the statistical analysis of gray and white matter density applied to schizophrenia. Neuroimage 1995; 2: 244–252. [DOI] [PubMed] [Google Scholar]
- 13.LeCun Y, Bengio Y, Hinton G. Deep learning. Nature 2015; 521: 436–444. [DOI] [PubMed] [Google Scholar]
- 14.Ribli D, Horvath A, Unger Z, Pollner P, Csabai I. Detecting and classifying lesions in mammograms with Deep Learning. Sci Rep 2018; 8: 4165. [DOI] [PMC free article] [PubMed] [Google Scholar]
- 15.Becker AS, Bluthgen C, Phi van VD, Sekaggya-Wiltshire C, Castelnuovo B, Kambugu A, et al. Detection of tuberculosis patterns in digital photographs of chest X-ray images using Deep Learning: feasibility study. Int J Tuberc Lung Dis 2018; 22: 328–335. [DOI] [PubMed] [Google Scholar]
- 16.Lee H, Tajmir S, Lee J, Zissen M, Yeshiwas BA, Alkasab TK, et al. Fully Automated Deep Learning System for Bone Age Assessment. J Digit Imaging 2017; 30: 427–441. [DOI] [PMC free article] [PubMed] [Google Scholar]
- 17.Kellgren JH, Lawrence JS. Radiological assessment of osteo-arthrosis. Ann Rheum Dis 1957; 16: 494–502. [DOI] [PMC free article] [PubMed] [Google Scholar]
- 18.Roos EM, Roos HP, Lohmander LS, Ekdahl C, Beynnon BD. Knee Injury and Osteoarthritis Outcome Score (KOOS)--development of a self-administered outcome measure. J Orthop Sports Phys Ther 1998; 28: 88–96. [DOI] [PubMed] [Google Scholar]
- 19.Klein S, Staring M, Murphy K, Viergever MA, Pluim JPW. elastix: A Toolbox for Intensity-Based Medical Image Registration. Ieee Transactions on Medical Imaging 2010; 29: 196–205. [DOI] [PubMed] [Google Scholar]
- 20.Nichols TE. Multiple testing corrections, nonparametric methods, and random field theory. Neuroimage 2012; 62: 811–815. [DOI] [PubMed] [Google Scholar]
- 21.Nichols T, Hayasaka S. Controlling the familywise error rate in functional neuroimaging: a comparative review. Stat Methods Med Res 2003; 12: 419–446. [DOI] [PubMed] [Google Scholar]
- 22.Carballido-Gamio J, Link TM, Majumdar S. New techniques for cartilage magnetic resonance imaging relaxation time analysis: texture analysis of flattened cartilage and localized intra- and inter-subject comparisons. Magn Reson Med 2008; 59: 1472–1477. [DOI] [PMC free article] [PubMed] [Google Scholar]
- 23.Gao Huang ZL, Kilian Q. Weinberger, van der Maaten Laurens. Densely Connected Convolutional Networks. ARXIV 2016; eprint arXiv:1608.06993: 12. [Google Scholar]
- 24.Cheng JAB, Mark JL The Relative Performance of Ensemble Methods with Deep Convolutional Neural Networks for Image Classification. arXiv:1704.01664 2017. [DOI] [PMC free article] [PubMed] [Google Scholar]
- 25.Lin MC, Qiang; Shuicheng Yan. Network In Network. arXiv:1312.4400 2014. [Google Scholar]
- 26.Steven LS On Comparing Classifiers: Pitfalls to Avoid and a Recommended Approach. Data Mining adn Knowledge Discovery 1997; 1: 317–328. [Google Scholar]
- 27.Roemer FW, Kijowski R, Guermazi A. Editorial: from theory to practice - the challenges of compositional MRI in osteoarthritis research. Osteoarthritis Cartilage 2017; 25: 1923–1925. [DOI] [PubMed] [Google Scholar]
- 28.Ashinsky BG, Bouhrara M, Coletta CE, Lehallier B, Urish KL, Lin PC, et al. Predicting early symptomatic osteoarthritis in the human knee using machine learning classification of magnetic resonance images from the osteoarthritis initiative. J Orthop Res 2017; 35: 2243–2250. [DOI] [PMC free article] [PubMed] [Google Scholar]
- 29.Pedoia V, Russell C, Randolph A, Li X, Majumdar S, Consortium A-A. Principal component analysis-T1rho voxel based relaxometry of the articular cartilage: a comparison of biochemical patterns in osteoarthritis and anterior cruciate ligament subjects. Quant Imaging Med Surg 2016; 6: 623–633. [DOI] [PMC free article] [PubMed] [Google Scholar]
- 30.Kumar D, Souza RB, Singh J, Calixto NE, Nardo L, Link TM, et al. Physical activity and spatial differences in medial knee T1rho and t2 relaxation times in knee osteoarthritis. J Orthop Sports Phys Ther 2014; 44: 964–972. [DOI] [PMC free article] [PubMed] [Google Scholar]
- 31.Sophia Fox AJ, Bedi A, Rodeo SA. The basic science of articular cartilage: structure, composition, and function. Sports Health 2009; 1: 461–468. [DOI] [PMC free article] [PubMed] [Google Scholar]
- 32.Souza RB, Kumar D, Calixto N, Singh J, Schooler J, Subburaj K, et al. Response of knee cartilage T1rho and T2 relaxation times to in vivo mechanical loading in individuals with and without knee osteoarthritis. Osteoarthritis Cartilage 2014; 22: 1367–1376. [DOI] [PMC free article] [PubMed] [Google Scholar]
- 33.Norman B, Pedoia V, Majumdar S. Use of 2D U-Net Convolutional Neural Networks for Automated Cartilage and Meniscus Segmentation of Knee MR Imaging Data to Determine Relaxometry and Morphometry. Radiology 2018; 288: 177–185. [DOI] [PMC free article] [PubMed] [Google Scholar]
- 34.Liu F, Zhou ZY, Jang H, Samsonov A, Zhao GY, Kijowski R. Deep convolutional neural network and 3D deformable approach for tissue segmentation in musculoskeletal magnetic resonance imaging. Magnetic Resonance in Medicine 2018; 79: 2379–2391. [DOI] [PMC free article] [PubMed] [Google Scholar]
- 35.Pedoia V, Haefeli J, Morioka K, Teng HL, Nardo L, Souza RB, et al. MRI and biomechanics multidimensional data analysis reveals R2-R1rho as an early predictor of cartilage lesion progression in knee osteoarthritis. J Magn Reson Imaging 2018; 47: 78–90. [DOI] [PMC free article] [PubMed] [Google Scholar]
- 36.Rossi-deVries J, Pedoia V, Samaan MA, Ferguson AR, Souza RB, Majumdar S. Using multidimensional topological data analysis to identify traits of hip osteoarthritis. J Magn Reson Imaging 2018. [DOI] [PMC free article] [PubMed] [Google Scholar]
- 37.Veillette C, Jurisica I. Precision Medicine for Osteoarthritis In: Osteoarthritis, Springer Ed; New York: 2015:257–270. [Google Scholar]


