

Abstract
Background
Observational studies have suggested that selenium (Se) may have beneficial effects against certain cardiovascular outcomes, with a possible U‐shaped association. We assessed the hypothesis that blood Se concentration might be inversely associated with the prevalence of stroke and the relationship would be nonlinear.
Methods and Results
Data collected from adult participants (aged ≥20 years) in the Canadian Health Measures Survey (CHMS 2007–2011, n=7065) and the US National Health and Nutrition Examination Survey (NHANES 2011–2012, n=5030) were analyzed. A total of 82 (1.16%) and 202 (4.02%) stroke cases were identified in CHMS and NHANES. Respondents with stroke had lower Se levels than those without stroke, with a mean difference of 16 μg/L and 12 μg/L for CHMS and NHANES, respectively. Respondents with high blood Se concentration (tertile 3) had a lower prevalence of stroke compared with those with low Se concentration (tertile 1). The adjusted odds ratios were 0.38 (95% CI: 0.15, 0.92) and 0.57 (95% CI: 0.31, 1.03) for CHMS and NHANES, respectively. A continuous decreasing trend of stroke with whole blood selenium was observed in CHMS, whereas the curve plateaued starting at 190 μg/L for NHANES, based on the cubic restricted spline regression. Sensitivity analysis using the serum and urinary Se concentrations demonstrates that our results were consistent across different selenium biomarkers.
Conclusions
We observed inverse cross‐sectional associations between whole blood Se and the prevalence of stroke in representative samples of the Canadian and the US population.
Keywords: Canadian Health Measures Survey, diet, environment, National Health and Nutrition Examination Survey, selenium, stroke
Subject Categories: Epidemiology, Diet and Nutrition
Clinical Perspective
What Is New?
We observed a linearly decreasing trend of stroke with whole blood selenium in Canadian Health Measures Survey, whereas the curve plateaued at 190 μg/L for US National Health and Nutrition Examination Survey, as opposed to the widely accepted U shape.
The inverse association between selenium and stroke was more salient in certain population subgroups: male, elderly, white, and people with higher education and higher income.
The inverse association between selenium and stroke was consistent for whole blood, serum, and urinary selenium.
What Are the Clinical Implications?
Selenium status might be a novel factor associated with stroke.
The association between habitual selenium intake (as reflected by selenium biomarkers) and stroke might be different from the association between selenium supplement and stroke.
Introduction
Stroke is the second most common cause of deaths (11.8% of all deaths) and the third most common cause of disability (4.5% of disability adjusted life years from all‐cause) worldwide.1, 2 Each year, >140 000 Americans and 10 000 Canadians die of stroke.3, 4 More than 90% of the stroke burden globally is attributable to modifiable risk factors, including cardiometabolic conditions, smoking, as well as poor diet.5 In addition, age, sex, genetics, and family history are also major risk factors for stroke.6, 7, 8, 9
Selenium (Se) is a trace element essential for supporting human health.10 Se incorporates into selenoproteins and Se‐dependent enzymes (eg, glutathione peroxidases), which are involved in antioxidant and anti‐inflammatory processes, as well as in intracellular redox regulation and modulation.11 Observational studies have suggested that Se may have beneficial effects against certain cardiovascular outcomes, with a possible U‐shaped association.12, 13, 14, 15, 16 However, trial results are controversial. Specifically, 2 large randomized control trials (SELECT [Selenium and Vitamin E Cancer Prevention Trial] and NPC [Nutritional Prevention of Cancer Trial]) conducted in the United States, a Se‐replete population, showed no benefits on the incidence and mortality of coronary heart disease and stroke.17, 18
The objectives of the present study were to examine cross‐sectional associations between blood Se concentrations and prevalence of stroke in the general North American population (ie, both Canada and the United States) as well as to explore the potential nonlinear relationship between blood Se and prevalence of stroke. We hypothesized that (1) blood Se levels would be inversely associated with the prevalence of stroke; and (2) the relationship between Se and prevalence of stroke would be nonlinear.
Methods
Ethics
No new data were collected, and therefore no ethics review was needed.
Study Population
To assess the association between Se and stroke in the North American population, we used data from the Canadian Health Measures Survey (CHMS) and the US National Health and Nutrition Examination Survey (NHANES). Details of the 2 surveys have been published elsewhere.19, 20 We combined the first 2 cycles of CHMS (2007–2009 and 2009–2011), which included ≈7000 adult respondents (≥aged 20 years). To ensure comparability between the 2 surveys, we used NHANES data from 2011 to 2012, which included ≈5000 adult respondents (aged ≥20 years). The response rate (participants who completed both questionnaire and laboratory test) was 70.8% for the CHMS and 69.5% for the NHANES. The CHMS is available to Canadian researchers through Statistics Canada's research data center program, and the NHANES is publicly available.
Assessment of Selenium Biomarkers
In the CHMS, blood Se was measured by inductively coupled plasma–mass spectrometry (Elan DRC II; Perkin Elmer Sciex).21 Laboratory analyses were performed at the Centre de toxicology du Québec of l'Institut national de santé publique du Québec (Québec, Canada) accredited under ISO 17025. The limits of detection for blood Se were 8 μg/L and 20 μg/L in the CHMS cycle 1 and cycle 2, respectively. For the NHANES, whole blood Se was measured by inductively coupled plasma–mass spectrometry (ELAN DRC II; PerkinElmer, Norwalk, CT), and serum Se was measured by inductively coupled plasma–dynamic reaction cell–mass spectrometry, a multielement analytical technique capable of trace level elemental analysis. The analyses were performed at the Division of Laboratory Sciences, National Center for Environmental Health, and Centers for Disease Control and Prevention (Atlanta, GA). Details of the laboratory procedures can be found on the NHANES website (https://wwwn.cdc.gov/nchs/nhanes/continuousnhanes/labmethods.aspx?BeginYear=2011). The limits of detection for whole blood and serum Se were 30 and 4.5 μg/L, respectively.
Outcome
Stroke was defined as self‐reported health professional confirmed diagnosis in both databases. In the CHMS, the following question was asked during the interview. “Now I'd like to ask about certain chronic health conditions which you may have. We are interested in ‘long‐term conditions’ which are expected to last or have already lasted 6 months or more and that have been diagnosed by a health professional. Do you suffer from the effects of a stroke?” In the NHANES, the following question was asked. “The following questions are about different medical conditions. Has a doctor or other health professional ever told you that you had a stroke?” No subtype information is available in both databases. The median diagnosed time of stroke was 5 years in the NHANES, and such information was not available in the CHMS.
Assessment of Risk Factors
Risk factors of stroke were assessed in both surveys. Whole blood mercury was measured following the same respective procedures in the CHMS and NHANES.21, 22 Total cholesterol was assessed for the CHMS and NHANES participants. Blood pressure was measured as the average of 3 measurements for NHANES and 5 measurements for CHMS. Body mass index was calculated by dividing the weight (in kilograms) by the square of height (in meters). Diabetes mellitus status was determined based on self‐reported diagnosis or fasting glucose ≥7.0 mmol/L for both surveys. Medication use for high blood pressure, high cholesterol, and diabetes mellitus were determined from the questionnaire. Use of nutritional supplements containing Se in the last 30 days was also determined from the questionnaire. Socioeconomic status (sex, age, race, education, and family income) and smoking status were based on self‐reported responses in the questionnaires.
Statistical Analysis
The participant characteristics were assessed with descriptive statistics, including the frequency, mean, and 95% CIs. We first examined differences in whole blood Se concentrations by stroke status. The weighted geometric mean for whole blood Se was calculated for different population subgroups. We used logistic regressions to investigate the difference in the prevalence of stroke by whole blood Se tertiles, adjusting for age, sex, systolic blood pressure, smoking status, total cholesterol, diabetes mellitus, medication and vitamin supplement use, race/ethnic background, education, annual family income, body mass index, and parents’ history of stroke from the CHMS and NHANES data. All analyses were stratified by variables in which either the prevalence of stroke or whole blood Se were unevenly distributed, including sex, age (<60 and ≥60 years old), education (less than college or college and above; individual for NHANES and household for CHMS). The cut‐offs were the medians of the variables of interest. Mercury exposure is an emerging risk factor for cardiovascular diseases,23, 24, 25 and we also stratified the analysis by blood mercury concentration (<0.86 and ≥0.86 μg/L). The adjusted odds ratios (ORs) of the prevalence of stroke by whole blood Se tertiles, as obtained from the logistic regressions, were visually depicted in forest plots. Restricted cubic spline regression was fitted to explore the potential nonlinear shape of the dose–response curve between whole blood Se and stroke.26
Two sets of sensitivity analyses were conducted to ensure the replicability of the results. First, segmented logistic regression, with 1 breakpoint, was fitted to examine the shape of association further.27 The adjusted ORs associated with each 10‐μg/L increase in blood Se were reported for ease of interpretation. A forward procedure was adopted to show the relative contribution of other risk factors and their influence on the effect size of Se and the breakpoints. Model 1 included Se and a constant; model 2 added sex and age; model 3 added traditional stroke risk factors (ie, smoking, diabetes mellitus, systolic blood pressure, total cholesterol, body mass index, medication, and supplement use); and model 4 added socioeconomic status (education, marital status, and family income). Second, all the analyses were conducted using creatinine‐adjusted urinary Se in the CHMS and serum Se in the NHANES, as alternative measures of selenium status.
The descriptive analysis, logistic regressions, and forest plots were performed with Stata version 14.1 (StataCorp LP, College Station, TX), and the restricted cubic spline regression and segmented logistic regression were performed with R (R Core Development Team). Survey weights were used to ensure representative population‐level estimates for both surveys. All standard errors, CIs, and coefficients of variation were bootstrapped with 500 replicates to account for the complex sampling design used in the CHMS.
Results
Table 1 presents the CHMS and NHANES participant characteristics by stroke status. The mean age of the CHMS and NHANES participants was 46 and 48 years, respectively, and the participants were relatively equally represented by males and females. A total of 82 (1.16%) and 202 (4.02%) stroke cases were identified in CHMS and NHANES. There were some differences in the participant characteristics between the 2 surveys; however, in both surveys, people with stroke were older, had higher systolic blood pressure, lower total cholesterol, higher body mass index, and higher prevalence of diabetes mellitus. Table 2 presents participant characteristics by whole blood Se tertiles in both data sets. There were no statistical differences between most socioeconomic factors and stroke risk factors across whole blood selenium tertiles. The selenium tertile 3 consisted of more males and fewer current smokers in both data sets. The medication and nutrition supplement use pattern was also similar across Se tertiles.
Table 1.
Participants’ Characteristics by Stroke Status: CHMS 2007 to 2011 and NHANES 2011 to 2012
| Characteristics | CHMS 2007–2011 | NHANES 2011–2012 | ||
|---|---|---|---|---|
| No Stroke (n=6983) | Stroke (n=82) | No Stroke (n=4828) | Stroke (n=202) | |
| Mean (SD) | ||||
| Age, y | 46 (15) | 64 (10) | 47 (16) | 65 (16) |
| Systolic blood pressure, mm Hg | 113 (15) | 122 (19) | 121 (16) | 128 (23) |
| Total cholesterol, mmol/L | 5.0 (1.0) | 4.6 (1.0) | 5.1 (1.0) | 4.9 (1.2) |
| BMI, kg/m2 | 27.3 (5.5) | 30.1 (7.0) | 28.7 (6.5) | 28.9 (7.6) |
| N (%) | ||||
| Male | 3235 (49.62) | 43 (61.39) | 2381 (48.07) | 99 (44.32) |
| Age ≥60 y | 2086 (20.84) | 67 (74.16) | 1443 (24.57) | 147 (67.62) |
| Race | ||||
| White | 5973 (84.49) | 77 (97.21) | 1793 (66.55) | 88 (62.78) |
| Black | 299 (4.85) | – | 1233 (11.31) | 68 (17.87) |
| Other | 711 (10.66) | – | 1812 (22.14) | 46 (19.35) |
| College or abovea | 4911 (70.85) | 51 (55.15) | 2740 (63.77) | 70 (39.18) |
| Annual family income ≥35 000b | 4472 (67.95) | 30 (40.97) | 2498 (62.43) | 70 (45.89) |
| Mercury ≥0.86 μg/L | 3640 (53.24) | 43 (62.36) | 2450 (47.77) | 78 (37.48) |
| Current smoker | – (21.10) | – (17.94) | 941 (19.56) | 55 (28.09) |
| Diabetes mellitus | – (7.62) | – (26.42) | 756 (11.41) | 71 (31.36) |
| Antihypertensive medication | 1438 (17.49) | 57 (66.29) | 1416 (25.87) | 152 (71.91) |
| Diuretics alone or in combination | 875 (10.40) | 37 (45.25) | 762 (11.67) | 74 (33.35) |
| Cholesterol‐lowering medication | 1010 (12.20) | 49 (52.92) | 1127 (21.42) | 111 (54.12) |
| Vitamin supplement | – (17.58) | – (16.72) | 545 (11.6) | 30 (13.7) |
All percentages, means, and corresponding SDs were calculated with proper weights. BMI indicates body mass index; CHMS, Canadian Health Measures Survey; NHANES, National Health and Nutrition Examination Survey. (–) Not reported because of sample size requirement by Statistical Canada.
Individual highest education level for NHANES, household highest education level (postsecondary school) for CHMS.
Annual household income for CHMS.
Table 2.
Participants’ Characteristics by Selenium Tertiles: CHMS 2007 to 2011 and NHANES 2011 to 2012
| Characteristics | CHMS 2007–2011 | NHANES 2011–2012 | ||||
|---|---|---|---|---|---|---|
| Selenium Tertile 1 n=2334 <184 μg/L | Selenium Tertile 2 n=2371 184 to 207 μg/L | Selenium Tertile 3 n=2360 >207 μg/L | Selenium Tertile 1 n=1675 <181 μg/L | Selenium Tertile 2 n=1677 181 to 201 μg/L | Selenium Tertile 3 n=1678 >201 μg/L | |
| Mean (SD) | ||||||
| Age, y | 46 (16) | 45 (16) | 46 (15) | 48 (17) | 47 (16) | 48 (15) |
| Systolic blood pressure, mm Hg | 112 (16) | 114 (15) | 114 (15) | 122 (18) | 122 (16) | 121 (14) |
| Total cholesterol, mmol/L | 4.8 (1.0) | 5.0 (1.0) | 5.2 (1.0) | 4.9 (1.0) | 5.1 (1.0) | 5.2 (1.0) |
| BMI, kg/m2 | 27.1 (5.8) | 27.6 (5.7) | 27.1 (5.1) | 28.6 (7.0) | 28.8 (6.4) | 28.8 (5.7) |
| N (weighted percentage) | ||||||
| Male | 916 (43.03) | 1158 (52.12) | 1222 (54.18) | 743 (43.51) | 800 (45.46) | 937 (53.95) |
| Age ≥60 y | 711 (22.29) | 738 (21.92) | 704 (19.95) | 564 (27.23) | 513 (25.02) | 513 (25.42) |
| Race | ||||||
| White | 2018 (86.48) | 2085 (87.6) | 1944 (79.68) | 598 (64.04) | 604 (65.92) | 679 (70.85) |
| Black | 88 (3.75) | 96 (4.81) | 117 (5.89) | 506 (14.05) | 438 (11.21) | 347 (8.17) |
| Other | 249 (9.77) | 174 (7.59) | 294 (14.42) | 571 (21.90) | 635 (22.87) | 652 (20.98) |
| College or abovea | 1624 (68.92) | 1706 (72.43) | 1632 (70.69) | 881 (59.09) | 941 (65.27) | 988 (65.62) |
| Annual family income ≥35 000b | 1455 (66.83) | 1538 (68.61) | 1509 (67.56) | 790 (57.65) | 879 (64.47) | 899 (65.47) |
| Mercury ≥0.86 μg/L | 1174 (50.77) | 1295 (56.06) | 1214 (53.19) | 767 (42.36) | 866 (48.72) | 895 (50.74) |
| Current smoker | 563 (25.28) | 440 (19.15) | 405 (18.45) | 385 (23.45) | 330 (20.23) | 281 (15.29) |
| Diabetes mellitus | 215 (8.79) | 175 (6.96) | 161 (6.59) | 279 (12.91) | 259 (10.52) | 289 (12.55) |
| Antihypertensive medication | 500 (18.30) | 494 (18.21) | 501 (17.49) | 562 (28.73) | 499 (25.89) | 507 (26.83) |
| Diuretics alone or in combination | 301 (11.30) | 304 (10.95) | 307 (10.03) | 263 (11.07) | 268 (10.86) | 272 (14.69) |
| Cholesterol‐lowering medication | 368 (14.50) | 364 (13.49) | 327 (9.83) | 399 (22.30) | 401 (20.58) | 438 (24.65) |
| Vitamin supplement | 421 (18.26) | 404 (17.72) | 396 (16.73) | 265 (11.25) | 271 (11.02) | 294 (12.75) |
All percentages, means, and corresponding SDs were calculated with proper weights. BMI indicates body mass index; CHMS, Canadian Health Measures Survey; NHANES, National Health and Nutrition Examination Survey.
Individual highest education level for NHANES, household highest education level (postsecondary school) for CHMS.
Annual household income for CHMS.
Table 3 presents the whole blood Se levels of CHMS and NHANES participants by stroke status stratified by socioeconomic characteristics and blood mercury levels. In both surveys, participants with stroke had lower Se levels than those without stroke, with a mean difference of 16 and 12 μg/L for CHMS and NHANES, respectively. This trend was observed for all subgroups. In both surveys, cases with no stroke, males, participants younger than 60 years, those with a college education, those with a higher annual family income, and those with lower blood mercury levels had higher blood Se levels. The whole blood Se concentrations were comparable between stroke survivors diagnosed within 5 years (n=117, 181 μg/L) and more than 5 years (n=112, 181 μg/L) in the NHANES.
Table 3.
Geometric Mean and 95% CIs of Whole Blood Selenium Concentrations by Stroke Status, Stratified by Age, Sex, Race, Education, Family Income, and Blood Mercury Levels: CHMS 2007 to 2011 and NHANES 2011 to 2012
| CHMS 2007–2011 | NHANES 2011–2012 | |||
|---|---|---|---|---|
| No Stroke (n=6983) | Stroke (n=82) | No Stroke (n=4828) | Stroke (n=202) | |
| Total | 197 (194–199) | 181 (172–191) | 193 (190–196) | 181 (173–189) |
| Sex | ||||
| Female | 194 (191–197) | 191 (182–200) | 191 (188–194) | 176 (165–188) |
| Male | 200 (197–203) | 175 (163–188) | 196 (193–199) | 187 (180–195) |
| Age group | ||||
| <60 y | 197 (194–200) | 173 (148–201) | 194 (191–197) | 187 (172–203) |
| ≥60 y | 196 (193–199) | 184 (178–191) | 192 (188–197) | 179 (171–187) |
| Race | ||||
| White | 195 (193–198) | 180 (171–191) | 195 (191–199) | 178 (167–190) |
| Black | – | – | 188 (184–191) | 183 (176–191) |
| Other | – | – | 192 (189–196) | 189 (180–199) |
| Educationa | ||||
| Less than college | 196 (192–200) | 187 (179–195) | 191 (187–196) | 179 (167–190) |
| College or above | 197 (194–200) | 177 (163–192) | 194 (192–197) | 185 (178–193) |
| Annual family incomeb | ||||
| <35 000 | 196 (193–199) | 181 (166–197) | 191 (188–193) | 182 (170–193) |
| ≥35 000 | 197 (195–200) | 182 (176–188) | 195 (192–199) | 181 (173–189) |
| Mercury, μg/L | ||||
| <0.86 | 196 (193–199) | 188 (181–195) | 192 (188–196) | 178 (168–189) |
| ≥0.86 | 198 (195–201) | 177 (165–191) | 195 (193–198) | 186 (178–194) |
CHMS indicates Canadian Health Measures Survey; NHANES, National Health and Nutrition Examination Survey. (–) Not reported because of sample size requirement by Statistical Canada.
Individual highest education level for NHANES, household highest education level (less than secondary school, postsecondary school) for CHMS.
Annual household income for CHMS.
Figures 1 and 2 present the adjusted ORs of stroke by whole blood Se tertiles for the CHMS and NHANES participants. The cut‐off points for the medium and high tertiles of blood Se concentration for CHMS were 184 and 207 μg/L and those for NHANES were 181 and 201 μg/L, respectively. The 95th percentiles were 250 and 237 for CHMS and NHANES, respectively. Although the ORs of the stratified groups tended to vary among the tertiles, the high blood Se tertile tended to have more significant protective effects against stroke than the medium tertile in both the CHMS and NHANES populations. For the subgroup analysis, the magnitudes of association were smaller and more likely to be significant for male, elderly (aged 60 years and over), participants with higher education and income, and participants who had higher blood mercury concentration, for both the CHMS and NHANES. In sensitivity analyses, the association between creatinine‐adjusted urinary Se (CHMS), serum Se (HNANES), and stroke were similar.
Figure 1.
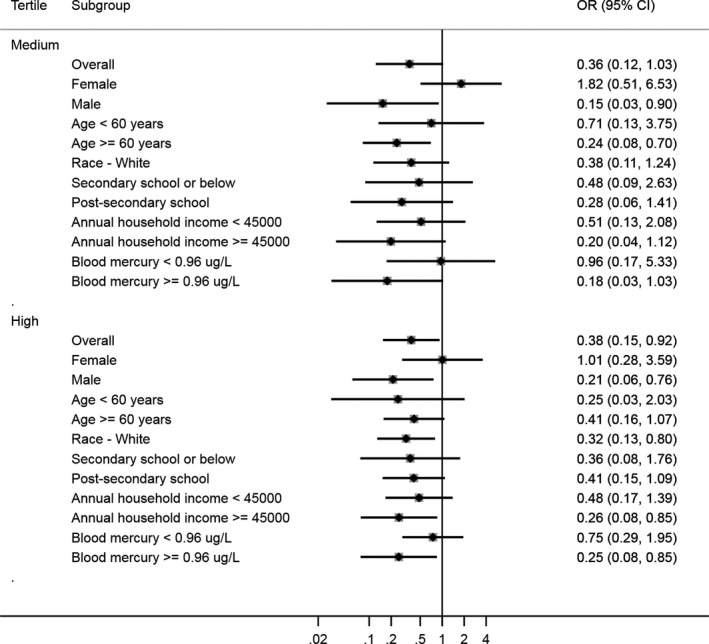
Odds ratio (OR) of the prevalence of stroke by whole blood selenium tertiles stratified by age, sex, race, education, family income, and mercury: Canadian Health Measures Survey 2007 to 2011. The diamonds represent the estimated point of the odds ratio and the solid lines represent the 95% CIs of the ORs. The dashed line represents the reference (individuals within each subgroup with selenium in tertile 1). The cut‐offs for medium and high whole blood selenium were 184 and 207 μg/L, respectively.
Figure 2.
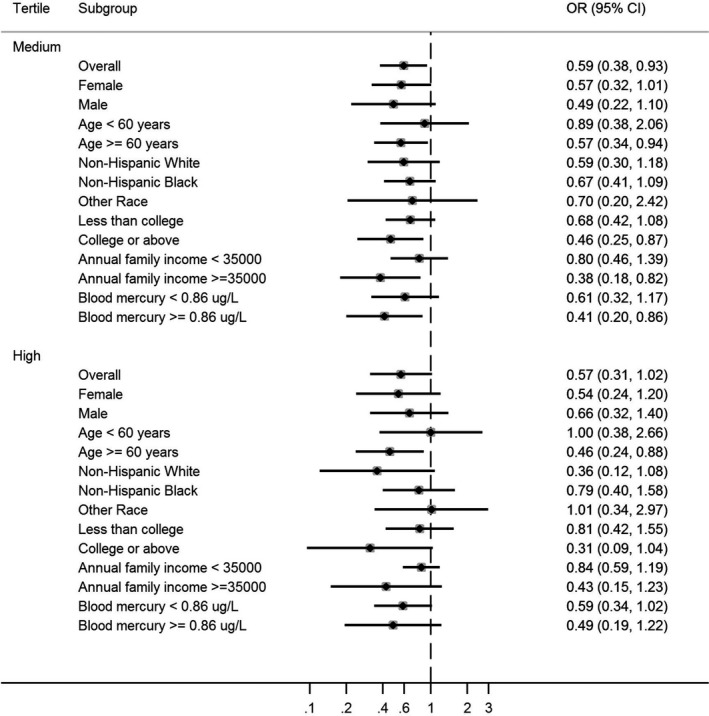
Odds ratio of the prevalence of stroke by whole blood selenium tertiles stratified by age, sex, race, education, family income, and mercury: National Health and Nutrition Examination Survey 2011 to 2012. The diamonds represent the estimated point of the odds ratio and the solid lines represent the 95% CI of the odds ratios. The dashed line represents the reference (individuals within each subgroup with selenium in tertile 1). The cut‐offs for medium and high whole blood selenium were 181 and 201 μg/L, respectively.
Supporting the forest plot analysis of the association between whole blood Se and stroke, the restricted cubic spline regression results (Figure 3A and 3B) revealed a linear association between whole blood Se and stroke in the CHMS, whereas a nonlinear association was found in the NHANES. A continuous decreasing trend was observed for the CHMS participants, whereas the curve plateaued starting at 190 μg/L for the NHANES participants. As sensitivity analysis, restricted cubic spline regression analyses were conducted for the association between creatinine‐adjusted urinary Se (CHMS, Figure 4A), serum Se (HNANES, Figure 4B), and stroke, both of which presented nonlinear decreasing trends.
Figure 3.
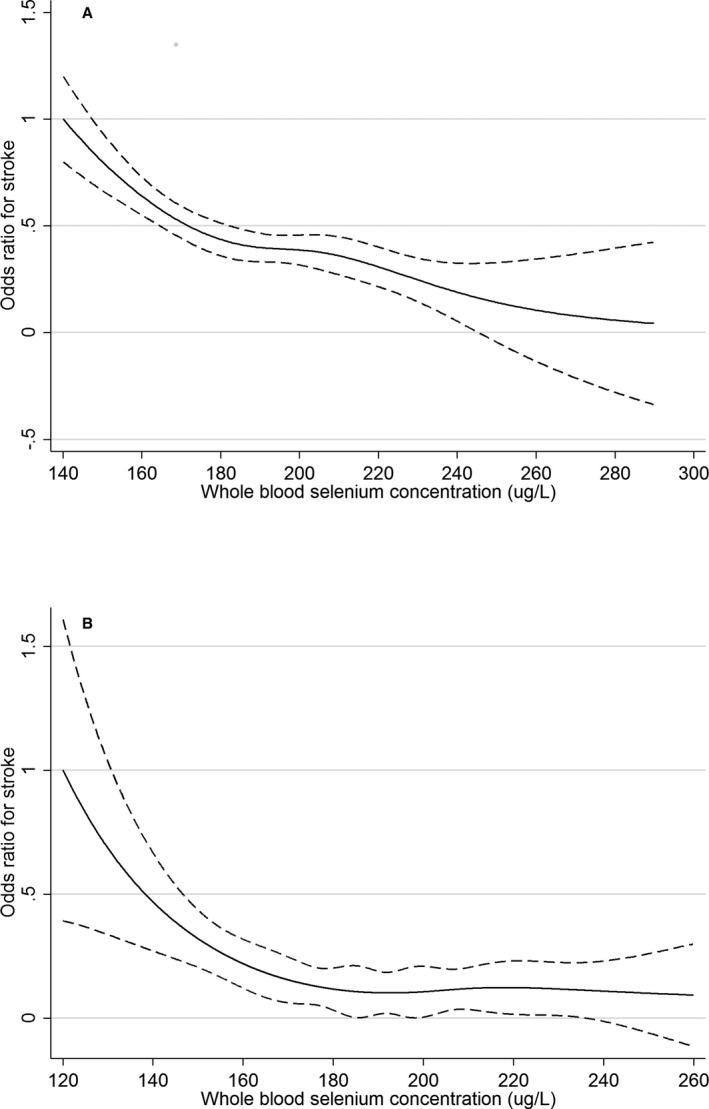
A, Odds ratio of the prevalence of stroke by whole selenium concentrations determined via restricted cubic spline regression in Canadian Health Measures Survey 2007 to 2011. The solid line represents the smoothed point estimate of the odds ratio and the dashed lines represent the 95% CI of the odds ratio. The curve is truncated at 290 μg/L, which is around the 99th percentile of the whole blood selenium distribution of the participants. B, Odds ratio of the prevalence of stroke by whole blood selenium concentrations determined via restricted cubic spline regression in National Health and Nutrition Examination Survey 2011 to 2012. The solid line represents the smoothed point estimate of the odds ratio and the dashed lines represent the 95% CI of the odds ratio. The curve is truncated at 260 μg/L, which is around the 99th percentile of the whole blood selenium distribution of the participants.
Figure 4.
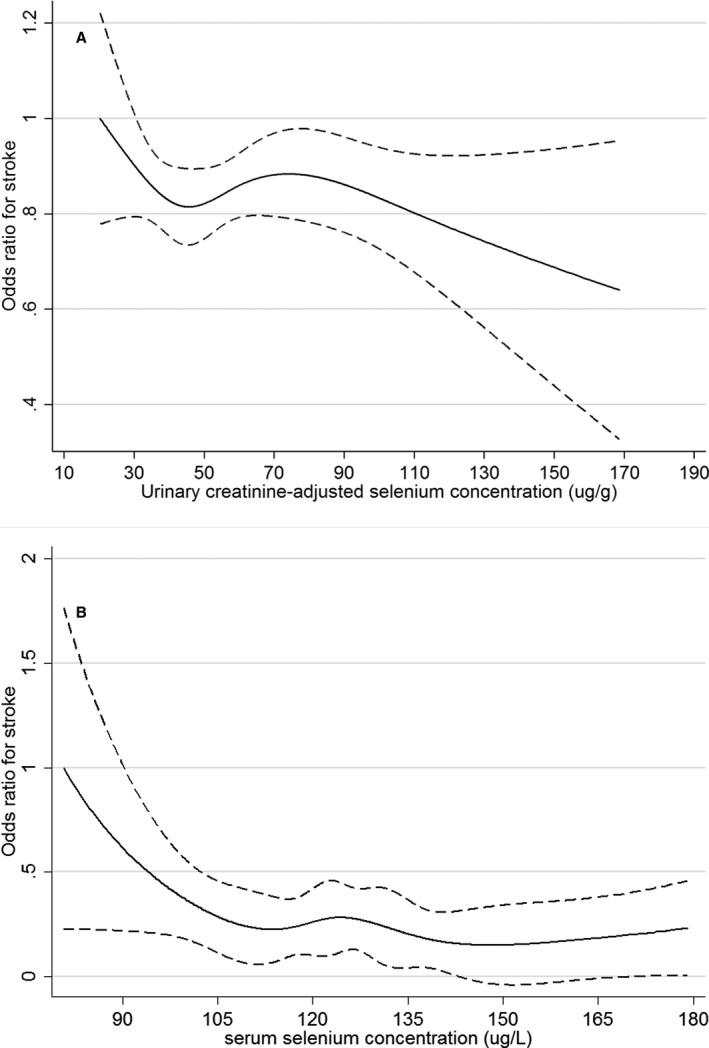
A, Odds ratio of the prevalence of stroke by urinary creatinine–adjusted selenium concentrations determined via restricted cubic spline regression in Canadian Health Measures Survey 2007 to 2011. The solid line represents the smoothed point estimate of the odds ratio and the dashed lines represent the 95% CI of the odds ratio. The curve is truncated at 170 μg/g, which is around the 99th percentile of the urinary creatinine–adjusted selenium distribution of the participants. B, Odds ratio of the prevalence of stroke by whole blood selenium concentrations determined via restricted cubic spline regression in National Health and Nutrition Examination Survey 2011 to 2012. The solid line represents the smoothed point estimate of the odds ratio and the dashed lines represent the 95% CI of the odds ratio. The curve is truncated at 180 μg/L, which is around the 99th percentile of the serum selenium distribution of the participants.
Table 4 presents the ORs of stroke associated with each 10‐μg/L increase in whole blood Se. Segmented logistic regressions with 1 breakpoint were fitted, and the identified breakpoint and slopes (ie, ORs) before and after the breakpoint are presented for blood Se for the CHMS and NHANES populations. Traditional risk factors (eg, age, sex, and blood pressure), socioeconomic factors, and mercury were added sequentially to the models. Interestingly, no breakpoint was identified for any of the models of the CHMS data, and the prevalence of stroke decreased by 15% with each 10‐μg/L increase in blood Se levels. This further supports the linear association between whole blood Se and stroke in the CHMS. Meanwhile, the breakpoint for the NHANES data was ≈190 μg/L, before which the prevalence of stroke decreased by ≈20% for each 10‐μg/L increase in blood Se levels, and after which the trend plateaued.
Table 4.
Multiple Variable Logistic Regression Models of Selenium and Stroke: Canadian Health Measures Survey 2007 to 2011 and National Health and Examination Survey 2011 to 2012
| Model | CHMS 2007–2011 | NHANES 2011–2012 | ||||||
|---|---|---|---|---|---|---|---|---|
| Odds Ratio | 95% CI | Break Point | Odds Ratio | 95% CI | Break Point | Odds Ratio | 95% CI | |
| 1 | 0.85 | 0.78, 0.93 | – | 0.70 | 0.61, 0.81 | 180 | 1.00 | 0.99, 1.08 |
| 2 | 0.84 | 0.75, 0.94 | – | 0.81 | 0.71, 0.93 | 186 | 1.00 | 0.99, 1.08 |
| 3 | 0.85 | 0.76, 0.95 | – | 0.79 | 0.70, 0.91 | 189 | 0.99 | 0.89, 1.10 |
| 4 | 0.86 | 0.78, 0.95 | – | 0.81 | 0.70, 0.93 | 187 | 0.99 | 0.90, 1.10 |
The adjusted odds ratios associated with each 10‐μg/L increase in blood Se (selenium) were reported for ease of interpretation. A forward procedure was adopted to show the relative contribution of other risk factors and their influence on the effect size of Se and the break points. Model 1 included Se and a constant; model 2 added sex and age; model 3 added traditional stroke risk factors (ie, smoking, diabetes mellitus, systolic blood pressure, total cholesterol, body mass index, medication, and supplement use); and model 4 added socioeconomic status (education, marital status, and family income). CHMS indicates Canadian Health Measures Survey; NHANES, NHANES, National Health and Examination Survey. (–) No break point fitted by the model.
Discussion
We observed inverse cross‐sectional associations between whole blood Se and prevalence of stroke in representative samples of the Canadian and the US population. Differences in the magnitudes and significances of associations were observed for socioeconomic status (age, sex, education, income, and race) and blood mercury concentration. We observed a sharp decline in the prevalence of stroke until ≈180 μg/L whole blood Se from both the CHMS and the NHANES. The corresponding serum Se concentration is ≈120 μg/L. This finding agrees with previous literature that serum/plasma Se concentration at 100 to 120 μg/L is sufficient to optimize functions of glutathione peroxidases and selenoprotein P.28, 29
These results are somewhat inconsistent with a large body of observational data suggesting a possible U‐shaped association between Se status/intake and cardiometabolic outcomes.15 One plausible explanation is that the U‐shaped association was mainly based on all‐cause mortality.14, 15, 30, 31 The association between Se and stroke might be different. Bleys and colleagues reported that all‐cause mortality decreased with serum Se up to 130 μg/L, plateaued, and then increased moderately after 150 μg/L in the US NHANES population.30 The association curve for Se and coronary heart disease mortality was very similar to that for all‐cause mortality (ie, the U‐shaped curve). However, the association curve for Se and stroke mortality had a reversed U‐shape.30 Several epidemiological studies conducted in populations with low Se intake (eg, Finland and The Netherlands) also reported associations with larger effect size between Se and stroke, compared with associations between Se and coronary heart disease.32, 33 Secondly, in addition to traditional risk factors such as blood pressure and cholesterol, increased oxidative stress was proposed as a physiopathological mechanism in stroke,34 since Se is essential for enzymes such as glutathione peroxidases and thioredoxin reductases, which are involved in antioxidant defense and intracellular redox regulation and modulation.11, 35 This may partially explain the observed stronger association between Se and stroke, compared with Se and heart disease. Thirdly, the spline regression curve is used as a model to visualize the potential nonlinear association between the nutrient/exposure and the selected health outcome. Factors from both the data (eg, the joint distribution of Se and the health outcome) and the method itself (eg, spline methods used, number of knots chosen, and control variables included) can all influence the shape of the association curve. The event rate in the present study is relatively low compared with other studies. The sparseness of data point at high‐end Se concentration might also contribute to the difference in the shape of association.
The associations observed between Se and stroke were not the same across different population subgroups. In general, the associations were stronger among male, elderly, white people with higher education, and higher income. These characteristics were reported to be associated with higher Se status, potentially through higher dietary intake of fish and nuts.36, 37 These characteristics, except for the elderly, were also related to a healthier lifestyle and lower prevalence of stroke in general. The results suggest that Se may exhibit some beneficial effect in population subgroups with a lower risk of stroke and high habitual Se intake. It should be noted that some of the population subgroups with relatively low Se status (eg, racial minorities, population with low income and low education levels) are less likely to be represented in prior clinical trials. Higher blood mercury concentrations enhanced the associations. The interaction between Se and mercury may partially explain it.38, 39
It is interesting to compare our results with the trials using Se supplementation (ie, SELECT and NPC), where no beneficial effects were reported on cardiovascular outcomes in relatively similar North American populations. The baseline mean serum Se concentration was ≈135 μg/L for SELECT participants and 115 μg/L for NPC participants. The glutathione peroxidases and selenoprotein P functions for most participants of the 2 trials might already be at the optimal level before supplement. Secondly, Se supplementation was reported to be associated with increased risk of type 2 diabetes mellitus.15, 16, 40 The association between Se intake/supplementation and lipid profile is also controversial.41, 42, 43 These effects might attenuate the protective effect of Se on stroke. However, a closer examination of the NPC results showed that participants in the third tertile of baseline serum Se had much lower cardiovascular disease incidence and mortality, compared with participants in the first and second tertiles.17 Both our sensitivity analysis using serum Se and subgroup analysis by socioeconomic characteristics showed very similar results. Many other epidemiological studies with stratified analysis showed similar findings as well.32, 33 This raises the possibility that the association between baseline Se status (habitual Se intake) and cardiovascular outcomes might be different from Se supplementation.44 For example, both dietary Se intake and whole blood Se were found to be negatively associated with the prevalence of stroke among Inuit living in Canada, a population with high Se exposure through their traditional diet rich in fish and marine mammals.45 Unfortunately, such stratified analysis is not available from SELECT publications. Further longitudinal studies will help to confirm this hypothesis.
Another concern might be that this study used the whole blood Se as the main biomarker, while many of the previous studies focus on serum or plasma Se, which can better reflect levels of glutathione peroxidases and selenoproteins. However, this may not be an important factor since there is a good agreement between the whole blood and serum/plasma Se concentration in most of the populations.46 Our sensitivity analysis using serum Se in the NHANES showed very similar results as whole blood Se. Se is excreted through urine. Our sensitivity analysis using urinary Se in the CHMS also supports the main findings. Antihypertensive medication use, especially diuretics, was not related to either whole blood Se or urinary Se concentrations in the present study.
This study has several strengths. We made an effort to ensure the replicability of our results. Parallel analyses were conducted in 2 separate databases, with multiple measures of Se status. The association between Se biomarkers and prevalence of stroke was also investigated from multiple aspects. Moreover, different statistical methods were also adopted to explore the nonlinear dose–response relationship between Se and stroke. The main weakness of this study is the cross‐sectional design that can only show associations and not causal relationships. In addition, the health outcome is self‐reported, which can be subject to recall bias. However, there is evidence supporting the validity of using self‐reported illness.47 The stroke events occurred before Se biomarkers were measured. Many factors influencing Se biomarker levels (eg, medication, diet, and smoking) might change after stroke. This could result in reverse causality. However, we showed that whole blood Se concentrations were the same between participants who had a stroke less than or more than 5 years ago. Furthermore, medication, especially diuretic use, was not related to whole blood and urinary Se concentrations. Both smoking cessation and healthier dietary choice would generally result in higher whole blood Se concentrations,36 which will lead to more conservative risk estimates in the association between Se and stroke. Information on the subtype of stroke was not available in both data sets, which makes it complicated to postulate the potential mechanisms of the beneficial impact of Se on stroke. The antioxidant nature of Se and its potential effect on blood pressure might be good explanations.
In conclusion, we observed inverse cross‐sectional associations between Se biomarkers and prevalence of stroke in representative samples of the Canadian and US populations. The inverse relationship between Se and stroke was nonlinear with potential inflation point at 190 μg/L whole blood Se and 120 μg/L serum Se. Prospective cohort study or re‐analysis of Se supplement trials with baseline Se biomarkers could provide more insight into the association between Se and stroke. Some of the population subgroups with low Se status (eg, ethnic minorities and people from lower socioeconomic background) should be targeted in future investigations.
Sources of Funding
Funding support from the Canada Research Chair Program to Chan is acknowledged.
Disclosures
None.
Acknowledgments
The analysis presented in this article (CHMS part) was conducted at the COOL RDC, which is part of the Canadian Research Data Centre Network (CRDCN). The services and activities provided by the COOL RDC are made possible by the financial or in‐kind support of the SSHRC, the CIHR, the CFI, Statistics Canada, Carleton University, the University of Ottawa, and the Université du Québec en Outaouais. The views expressed in this article do not necessarily represent those of the CRDCN or that of its partners.
(J Am Heart Assoc. 2019;8:e012290 DOI: 10.1161/JAHA.119.012290.)
References
- 1. Wang H, Naghavi M, Allen C, Barber RM, Carter A, Casey DC, Charlson FJ, Chen AZ, Coates MM, Coggeshall M, et al. Global, regional, and national life expectancy, all‐cause mortality, and cause‐specific mortality for 249 causes of death, 1980–2015: a systematic analysis for the Global Burden of Disease Study 2015. Lancet. 2016;388:1459–1544. [DOI] [PMC free article] [PubMed] [Google Scholar]
- 2. Roth GA, Johnson C, Abajobir A, Abd‐Allah F, Abera SF, Abyu G, Ahmed M, Aksut B, Alam T, Alam K, et al. Global, regional, and national burden of cardiovascular diseases for 10 causes, 1990 to 2015. J Am Coll Cardiol. 2017;70:1–25. [DOI] [PMC free article] [PubMed] [Google Scholar]
- 3. Dai S, Bancej C, Bienek A, Walsh P, Stewart P, Wielgosz A. Report summary tracking heart disease and stroke in Canada 2009. Chronic Dis Can. 2009;29:192–193. [Google Scholar]
- 4. Benjamin EJ, Virani SS, Callaway CW, Chang AR, Cheng S, Chiuve SE, Cushman M, Delling FN, Deo R, de Ferranti SD, Ferguson JF, Fornage M, Gillespie C, Isasi CR, Jiménez MC, Jordan LC, Judd SE, Lackland D, Lichtman JH, Lisabeth L, Liu S, Longenecker CT, Lutsey PL, Matchar DB, Matsushita K, Mussolino ME, Nasir K, O'Flaherty M, Palaniappan LP, Pandey DK, Reeves MJ, Ritchey MD, Rodriguez CJ, Roth GA, Rosamond WD, Sampson UKA, Satou GM, Shah SH, Spartano NL, Tirschwell DL, Tsao CW, Voeks JH, Willey JZ, Wilkins JT, Wu JHY, Alger HM, Wong SS, Muntner P. Heart disease and stroke statistics—2018 update: a report from the American Heart Association. Circulation. 2018;137:e67–e492. [DOI] [PubMed] [Google Scholar]
- 5. Feigin VL, Roth GA, Naghavi M, Parmar P, Krishnamurthi R, Chugh S, Mensah GA, Norrving B, Shiue I, Ng M, Estep K, Cercy K, Murray CJL, Forouzanfar MH. Global burden of stroke and risk factors in 188 countries, during 1990–2013: a systematic analysis for the Global Burden of Disease Study 2013. Lancet Neurol. 2016;15:913–924. [DOI] [PubMed] [Google Scholar]
- 6. Xian Y, Holloway RG, Smith EE, Schwamm LH, Reeves MJ, Bhatt DL, Schulte PJ, Cox M, Olson DWM, Hernandez AF, Lytle BL, Anstrom KJ, Fonarow GC, Peterson ED. Racial/ethnic differences in process of care and outcomes among patients hospitalized with intracerebral hemorrhage. Stroke. 2014;45:3243–3250. [DOI] [PubMed] [Google Scholar]
- 7. Owolabi M, Sarfo F, Howard VJ, Irvin MR, Gebregziabher M, Akinyemi R, Bennett A, Armstrong K, Tiwari HK, Akpalu A, Wahab KW, Owolabi L, Fawale B, Komolafe M, Obiako R, Adebayo P, Manly JM, Ogbole G, Melikam E, Laryea R, Saulson R, Jenkins C, Arnett DK, Lackland DT, Ovbiagele B, Howard G. Stroke in indigenous Africans, African Americans, and European Americans: interplay of racial and geographic factors. Stroke. 2017;48:1169–1175. [DOI] [PMC free article] [PubMed] [Google Scholar]
- 8. Howard G, Moy CS, Howard VJ, McClure LA, Kleindorfer DO, Kissela BM, Judd SE, Unverzagt FW, Soliman EZ, Safford MM, Cushman M, Flaherty ML, Wadley VG. Where to focus efforts to reduce the black‐white disparity in stroke mortality: incidence versus case fatality? Stroke. 2016;47:1893–1898. [DOI] [PMC free article] [PubMed] [Google Scholar]
- 9. Feigin VL, Norrving B, Mensah GA. Global burden of stroke. Circ Res. 2017;120:439–448. [DOI] [PubMed] [Google Scholar]
- 10. World Health Organization, Food and Agriculture Organization of the United Nations . Chapter 15, selenium In: World Health Organization, Food and Agriculture Organization of the United Nations , ed. Human Vitamin and Mineral Requirements—Report of a Joint FAO/WHO Expert Consultation Bangkok, Thailand. Rome: Food and Nutrition Division FAO; 2002:235–256. [Google Scholar]
- 11. Schweizer U, Bräuer AU, Köhrle J, Nitsch R, Savaskan NE. Selenium and brain function: a poorly recognized liaison. Brain Res Rev. 2004;45:164–178. [DOI] [PubMed] [Google Scholar]
- 12. Vinceti M, Filippini T, Del Giovane C, Dennert G, Zwahlen M, Brinkman M, Zeegers M, Horneber M, D'Amico R, Crespi C. Selenium for preventing cancer (review). Cochrane Database Syst Rev. 2018;1:CD005195. [DOI] [PMC free article] [PubMed] [Google Scholar]
- 13. Flores‐Mateo G, Navas‐Acien A, Pastor‐Barriuso R, Guallar E. Selenium and coronary heart disease: a meta‐analysis. Am J Clin Nutr. 2006;84:762–773. [DOI] [PMC free article] [PubMed] [Google Scholar]
- 14. Rees K, Hartley L, Day C, Flowers N, Clarke A, Stranges S. Selenium supplementation for the primary prevention of cardiovascular disease. Cochrane Database Syst Rev. 2013;1:CD009671. [DOI] [PMC free article] [PubMed] [Google Scholar]
- 15. Stranges S, Navas‐Acien A, Rayman MP, Guallar E. Selenium status and cardiometabolic health: state of the evidence. Nutr Metab Cardiovasc Dis. 2010;20:754–760. [DOI] [PubMed] [Google Scholar]
- 16. Rayman MP, Stranges S. Epidemiology of selenium and type 2 diabetes: can we make sense of it? Free Radic Biol Med. 2013;65:1557–1564. [DOI] [PubMed] [Google Scholar]
- 17. Stranges S, Marshall JR, Trevisan M, Natarajan R, Donahue RP, Combs GF, Farinaro E, Clark LC, Reid ME. Effects of selenium supplementation on cardiovascular disease incidence and mortality: secondary analyses in a randomized clinical trial. Am J Epidemiol. 2006;163:694–699. [DOI] [PubMed] [Google Scholar]
- 18. Lippman SM, Klein EA, Goodman PJ, Lucia MS, Thompson IM, Ford LG, Parnes HL, Minasian LM, Gaziano M, Hartline JA, Parsons JK, Bearden JD III, Crawford ED, Goodman GE, Claudio J, Winquist E, Cook ED, Karp DD, Walther P, Michael M, Kristal AR, Darke AK, Arnold KB, Patricia A, Santella RM, Albanes D, Taylor PR, Probstfield JL, Jagpal TJ, Crowley JJ, Meyskens FL, Baker LH, Coltman CA Jr. Effect of selenium and vitamin E on risk of prostate cancer and other cancers: the Selenium and Vitamin E Cancer Prevention Trial (SELECT). JAMA. 2009;301:39–51. [DOI] [PMC free article] [PubMed] [Google Scholar]
- 19. Tremblay M, Wolfson M, Connor Gorber S. Canadian Health Measures Survey: rationale, background and overview. Health Rep. 2007;18(suppl):7–20. [PubMed] [Google Scholar]
- 20. Centers for Disease Control and Prevention, National Center for Health Statistics . National Health and Nutrition Examination Survey Data. Hyattsville, MD: U.S. Department of Health and Human Services, Centers for Disease Control and Prevention; 2010. Available at: http://www.cdc.gov/nchs/nhanes/nhanes_questionnaires.htm/. Accessed December 10, 2018. [Google Scholar]
- 21. Health Canada . Second report on human biomonitoring of environmental chemicals in Canada—Results of the Canadian Health Measures Survey Cycle 2 (2009–2011). Ottawa, Ontario; 2013. [Google Scholar]
- 22. Lye E, Legrand M, Clarke J, Probert A. Blood total mercury concentrations in the Canadian population: Canadian Health Measures Survey cycle 1, 2007–2009. Can J Public Health. 2013;104:e246–e251. [DOI] [PMC free article] [PubMed] [Google Scholar]
- 23. Hu XF, Singh K, Chan HM. Mercury exposure, blood pressure, and hypertension: a systematic review and dose—response meta‐analysis. Environ Health Perspect. 2018;126:076002. [DOI] [PMC free article] [PubMed] [Google Scholar]
- 24. Houston MC. Role of mercury toxicity in hypertension, cardiovascular disease, and stroke. J Clin Hypertens (Greenwich). 2011;13:621–627. [DOI] [PMC free article] [PubMed] [Google Scholar]
- 25. Roman HA, Walsh TL, Coull BA, Dewailly É, Guallar E, Hattis D, Mariën K, Schwartz J, Stern AH, Virtanen JK, Rice G. Evaluation of the cardiovascular effects of methylmercury exposures: current evidence supports development of a dose‐response function for regulatory benefits analysis. Environ Health Perspect. 2011;119:607–614. [DOI] [PMC free article] [PubMed] [Google Scholar]
- 26. Harrell F. Regression Modeling Strategies: With Applications to Linear Models, Logistic Regression, and Survival Analysis. New York: Springer; 2001. [Google Scholar]
- 27. Muggeo VMR. Estimating regression models with unknown break‐points. Stat Med. 2003;22:3055–3071. [DOI] [PubMed] [Google Scholar]
- 28. Xia Y, Hill KE, Li P, Xu J, Zhou D, Motley AK, Wang L, Byrne DW, Burk RF. Optimization of selenoprotein P and other plasma selenium biomarkers for the assessment of the selenium nutritional requirement: a placebo‐controlled, double‐blind study of selenomethionine supplementation in selenium‐deficient Chinese subjects. Am J Clin Nutr. 2010;92:525–531. [DOI] [PMC free article] [PubMed] [Google Scholar]
- 29. Hurst R, Armah CN, Dainty JR, Hart DJ, Teucher B, Goldson AJ, Broadley MR, Motley AK, Fairweather‐Tait SJ. Establishing optimal selenium status: results of a randomized, double‐blind, placebo‐controlled trial. Am J Clin Nutr. 2010;91:923–931. [DOI] [PMC free article] [PubMed] [Google Scholar]
- 30. Bleys J, Navas‐Acien A, Guallar E. Serum selenium levels and all‐cause, cancer, and cardiovascular mortality among US adults. Arch Intern Med. 2008;168:404–410. [DOI] [PubMed] [Google Scholar]
- 31. Rayman MP. Selenium and human health. Lancet. 2012;379:1256–1268. [DOI] [PubMed] [Google Scholar]
- 32. Virtamo J, Valkeila E, Alfthan G, Punsar S, Huttunen JK, Karvonen MJ, Virtamo J. Serum selenium and the risk of coronary heart disease and stroke. Am J Epidemiol. 1985;122:276–282. [DOI] [PubMed] [Google Scholar]
- 33. Kok FJ, de Bruijn AM, Vermeeren R, Hofman A, van Laar A, de Bruin M, Hermus RJ, Valkenburg HA. Serum selenium, vitamin antioxidants, and cardiovascular mortality: a 9‐year follow‐up study in the Netherlands. Am J Clin Nutr. 1987;45:462–468. [DOI] [PubMed] [Google Scholar]
- 34. Allen CL, Bayraktutan U. Oxidative stress and its role in the pathogenesis of ischaemic stroke. Int J Stroke. 2009;4:461–470. [DOI] [PubMed] [Google Scholar]
- 35. Chen J, Berry MJ. Selenium and selenoproteins in the brain and brain diseases. J Neurochem. 2003;86:1–12. [DOI] [PubMed] [Google Scholar]
- 36. Hu XF, Chan HM. Factors associated with the blood and urinary selenium concentrations in the Canadian population: results of the Canadian Health Measures Survey (2007–2011). Int J Hyg Environ Health. 2018;221:1023–1031. [DOI] [PubMed] [Google Scholar]
- 37. Combs GF, Watts JC, Jackson MI, Johnson LK, Zeng H, Scheett AJ, Uthus EO, Schomburg L, Hoeg A, Hoefig CS, Davis CD, Milner JA. Determinants of selenium status in healthy adults. Nutr J. 2011;10:75. [DOI] [PMC free article] [PubMed] [Google Scholar]
- 38. Hu XF, Eccles KM, Chan HM. High selenium exposure lower the odds ratios for hypertension, stroke, and myocardial infarction associated with mercury exposure among Inuit in Canada. Environ Int. 2017;102:200–206. [DOI] [PubMed] [Google Scholar]
- 39. Khan MA, Wang F. Mercury‐selenium compounds and their toxicological significance: toward a molecular understanding of the mercury‐selenium antagonism. Environ Toxicol Chem. 2009;28:1567–1577. [DOI] [PubMed] [Google Scholar]
- 40. Stranges S, Marshall JR, Natarajan R, Donahue RP, Trevisan M, Combs GF, Cappuccio FP, Ceriello A, Reid ME, Cerello A, Reid ME. Effects of long‐term selenium supplementation on the incidence of type 2 diabetes. Ann Intern Med. 2007;147:217–223. [DOI] [PubMed] [Google Scholar]
- 41. Rayman MP, Stranges S, Griffin BA, Pastor‐barriuso R, Guallar E. Effect of supplementation with high‐selenium yeast on plasma lipids. Ann Intern Med. 2011;154:656–665. [DOI] [PubMed] [Google Scholar]
- 42. Cold F, Winther KH, Pastor‐barriuso R, Rayman MP, Guallar E, Nybo M, Griffin BA, Stranges S, Cold S, Grif BA, Stranges S, Cold S. Randomised controlled trial of the effect of long‐term selenium supplementation on plasma cholesterol in an elderly Danish population. Br J Nutr. 2015;114:1807–1818. [DOI] [PubMed] [Google Scholar]
- 43. Laclaustra M, Stranges S, Navas‐Acien A, Ordovas JM, Guallar E. Serum selenium and serum lipids in US adults: National Health and Nutrition Examination Survey (NHANES) 2003–2004. Atherosclerosis. 2010;210:643–648. [DOI] [PMC free article] [PubMed] [Google Scholar]
- 44. Zhang X, Liu C, Guo J, Song Y. Selenium status and cardiovascular diseases: meta‐analysis of prospective observational studies and randomized controlled trials. Eur J Clin Nutr. 2016;70:162–169. [DOI] [PubMed] [Google Scholar]
- 45. Hu XF, Sharin T, Chan MH. Dietary and blood selenium are inversely associated with the prevalence of stroke among Inuit in Canada. J Trace Elem Med Biol. 2017;44:322–330. [DOI] [PubMed] [Google Scholar]
- 46. Combs GF. Biomarkers of selenium status. Nutrients. 2015;7:2209–2236. [DOI] [PMC free article] [PubMed] [Google Scholar]
- 47. Bourne PA. The validity of using self‐reported illness to measure objective health. N Am J Med Sci. 2009;1:232–238. [DOI] [PMC free article] [PubMed] [Google Scholar]