

Abstract
Myotonic dystrophy type 1 (DM1) is an autosomal dominant inherited disorder caused by expansion of a germline and somatically unstable CTG repeat in the DMPK gene. Previously, CTG repeat length at birth has been correlated to patient age at symptom onset. Attempts to correlate CTG repeat length with progressive DM1 phenotypes, such as muscle power, have proven difficult. To better correlate genotype with progressive phenotypes, we have measured CTG repeat tract length and screened for interrupting variant repeats in 192 study participants from a well-characterized Canadian cohort. We have assessed genotype–phenotype correlations with nine progressive measures of skeletal muscle power and respiratory function. We have built statistical models that include confounding factors such as sex, age, height and weight to further explain variation in muscle power. Our analysis reveals a strong correlation between DM1 genotype and respiratory function and skeletal muscle power, as part of a complex model that includes additional modulators such as sex, age, height, weight and the presence or absence of interrupting variant repeats. Distal skeletal muscle measurements, such as hand pinch and grip strength, show the strongest correlation with disease genotype. Detailed analysis of CTG repeat length, and incorporation of confounding factors, greatly improves the predictive ability of these models. They reveal a greater genetic influence on individual progressive phenotypes than on age at symptom onset and for clinical trials will help optimize stratification and explain patient variability. They will also help practitioners prioritize assessment of the muscular power measurements that correlate best with disease severity.
Introduction
Myotonic dystrophy type 1 [DM1 (MIM: 160900)] is an autosomal dominant inherited disorder and is the commonest form of muscular dystrophy in adults (1,2). The age of symptom onset varies massively, from birth in congenital cases to old age in the mildest form of DM1. The characteristic symptoms are distal skeletal muscle weakness and myotonia, but additional symptoms exhibited by each patient are highly variable and include heart conduction defects, cataracts, testicular atrophy and gastrointestinal disorders (1).
The genetic basis of DM1 is the expansion of an unstable cytosine-thymine-guanine (CTG) repeat in the 3′-UTR of the DMPK gene (HGNC:2933) (3–5). In the general population, the triplet repeat is polymorphic, ranging from 5 to ~35 repeats. In DM1 patients, disease severity correlates with repeat size at birth from 50+ CTG repeats in mild cases to 1000+ CTG repeats in congenitally affected children (3–8). Once in the disease range, the CTG tract becomes highly unstable in the germline and frequently expands from one generation to the next (9–12). This results in anticipation, an increase in symptom severity and a decrease in age at onset of 20 to 30 years per generation (13). In addition to germinal instability, the expanded CTG tract is highly unstable in the soma in a process that is age- and allele-length dependent and expansion biased (14–16). The rate of expansion is highly variable among tissues (17–20), which likely contributes toward the tissue-specific symptoms and progressive nature of the condition. Patients with a CTG tract that expands faster than expected, develop symptoms earlier than expected, showing a direct correlation between somatic instability and disease severity (21,22).
Somatic instability has confounded attempts to measure the expanded CTG allele length in DM1 patients. The most accurate method for assessing somatic instability is small pool-small pool-polymerase chain reaction (SP-PCR). (SP-PCR) (23) allows us to estimate the progenitor allele length (ePAL) which a patient was born with, in addition to the modal allele size at the time of DNA sampling (16,22). ePAL is the best predictor of age at symptom onset and corrects the confounding effects of age at sampling. Although the majority of DM1 patients inherit a pure CTG expansion at the DMPK locus, a proportion of patients have variant repeats—such as cytosine-cytosine-guanine (CCG) or cytosine-guanine-guanine (CGG)—in the repeat tract (24,25). These variant repeats reduce both germline and somatic instability (25) and appear to be associated with delayed age at symptom onset (24–27).
As age at symptom onset is subjective and unlikely to be an outcome measure in clinical trials in the short-to-medium term, it is essential to identify objective phenotypes with a causal genetic relationship and also to establish whether the presence of variant repeats affects the rate-of-change of progressive phenotypes. Currently, there is little conclusive data correlating CTG repeat number with progressive clinical phenotypes such as muscle power (28,29), likely due to failure to account for somatic mosaicism and the presence of variant repeats, alongside other complex interactions such as sex and age. Another factor is the sampling bias often found in DM1 studies, which comprise of a mix of older, milder patients with smaller CTG alleles and younger, more severe patients born with larger CTG alleles. Analysis therefore requires dissociation of age-dependent phenotypic decline, from disease-dependent phenotypic decline, which is difficult in small cohorts. Identification of a set of easily measured phenotypes, which correlate strongly with genotype, would also be useful for practitioners who need to routinely track disease progression.
The Saguenay-Lac-Saint-Jean region of Canada is a population of French-Canadian origin and has the highest incidence of DM1 worldwide, with a frequency of ~1/630 (30), from a common DM1 founder who settled ~14 generations ago (31,32). The population is the subject of an ongoing longitudinal study to find the determinants of disability and quality of life in DM1. From 2002 to 2004, 200 DM1 patients were recruited into an extensive study that assessed muscle, pulmonary, cardiac, metabolic, endocrine and neurocognitive function, as well as social participation. The medical history of each participant was reviewed and when possible an age at DM1 symptom onset was determined. Blood DNA was collected during the study, providing an opportunity to determine ePAL and the modal repeat expansion from birth.
We have sought to correlate CTG repeat length with nine objective measures of respiratory function and skeletal muscle power, to assess their correlation with progressive phenotypes that could be assessed during clinical trials and by practitioners. We hypothesize that these are complex phenotypes, strongly mediated by the same sex and age factors that modulate muscle power in the general population and complicated further by the impact of DM1.
Results
Estimation of progenitor and modal allele length
Blood DNA samples were available for 192 of the 200 Saguenay study participants. We used SP-PCR (16) to determine ePAL (22) and modal allele length for each participant (Fig. 1A). An expanded CTG repeat allele was identified in 186 participants using our standard SP-PCR protocol. In an additional five participants, an expanded CTG repeat was identified after the addition of 10% dimethyl sulfoxide (DMSO) to the PCR. A requirement for DMSO is usually indicative of the presence of a GC-rich variant repeat interrupting the CTG tract (25). In one individual, we were unable to amplify an expanded allele, although it was possible to amplify a single non-expanded allele, suggesting the blood DNA was of good quality. Again, this is usually indicative of a large number of GC-rich variant repeats (CCG or CGG) in the CTG tract. In the 191 participants successfully genotyped, the ePAL ranged from 48 to 1060 CTG repeats, and the modal allele ranged from 52 to 1470 repeats.
Figure 1.
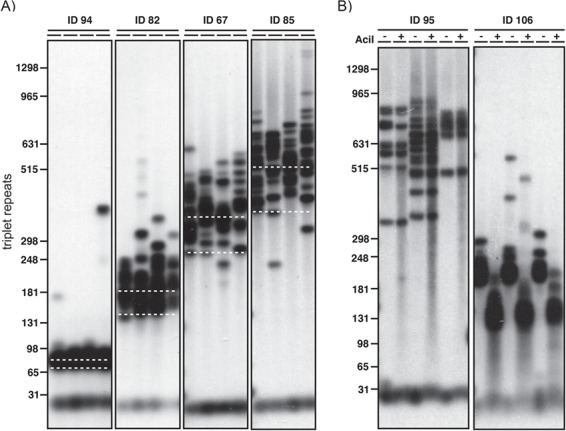
Estimation of the progenitor allele and modal allele and detection of AciI-sensitive variant repeats in blood DNA. Shown are representative small pool PCR analyses of CTG repeat length at the DMPK locus in blood DNA. The approximate number of CTG repeats is shown on the left. (A) The position of the ePAL for each of four individuals is indicated by the lower white dashed line. The modal allele length at sampling is indicated by the upper white dashed line. For each sample four replicate PCRs were performed with ~300 pg genomic DNA. (B) For both participants, three replicate PCRs were performed and digested with AciI (+) or left undigested (−) in a modified SP-PCR. Participant ID95 does not contain AciI-sensitive sites within the expanded repeat, whereas participant ID106 does, as evidenced by the downward shift in band size.
Identification of AciI-sensitive variants in the expanded allele
Non-CTG variants within the expanded allele can have a significant effect on both the somatic and germline stability of the repeat tract (25). We used SP-PCR to amplify the CTG repeat and tested for the presence of the most common repeats—CCG and CGG—by post-PCR digestion with AciI, which cuts in the presence of CCG or CGG (Fig. 1B) (25). We identified variants in the repeat tract of 17 out of 191 expanded alleles (8.9%). This included all of the samples that required the addition of DMSO to facilitate SP-PCR. No AciI-sensitive variants were identified in the non-disease-causing allele of the participants.
Correlation of ePAL and age at symptom onset in the cohort
Patient age at onset of symptoms was available for 147 participants in the Saguenay study. We used linear regression modeling to investigate the relationship between repeat length at birth and the age at which symptoms become apparent (Fig. 2A). As expected, ePAL was a major modifier of age at symptom onset (Table 1, model 1a, r2 = 0.217, P < 0.001) (22,33). Additionally, we tested whether the presence/absence of AciI-sensitive sites further modified age at onset. The presence of AciI-sensitive sites was significantly associated (P = 0.011) with a later age at onset (model 1b, r2 = 0.247, P < 0.001). We further tested whether sex had an effect on genotype–phenotype correlations and found male patients to have a later age at symptom onset (model 1c, r2 = 0.263, P < 0.001), although the effect was small and only marginally significant (P = 0.05). This is likely due to skewing within the cohort, as age at symptom onset data is available for a larger proportion of males with a small ePAL (<100 rpts) than females.
Figure 2.
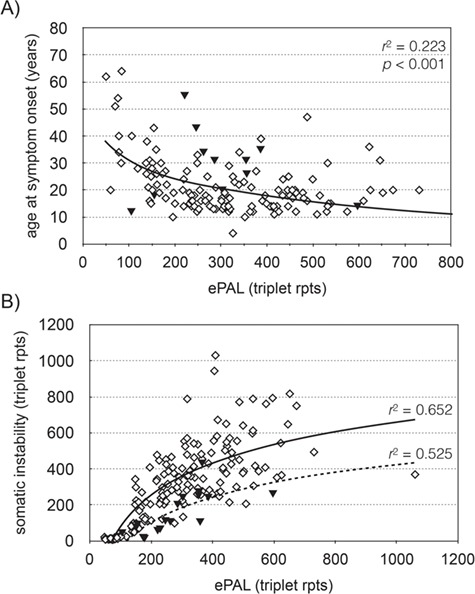
The estimated progenitor allele is the major modifier of age at symptom onset and somatic instability in DM1. (A) The graph shows the relationship between ePAL and age at symptom onset (n = 146) in the Saguenay cohort. The solid line shows the regression line for all patients, using a logarithmic model (Table 1, model 1a). The solid triangles denote patients with an AciI-sensitive CTG repeat tract. (B) The graph shows the relationship between ePAL and somatic instability during the study in CTG repeat AciI sensitive (solid triangles, n = 16) and CTG repeat AciI insensitive (diamonds, n = 175) participants. The lines show the regression line in AciI sensitive (broken line) and insensitive (solid line) subgroups, using a logarithmic model.
Table 1.
Linear regression models for age at symptom onset and somatic instability
| Model | Adjusted r2 | P | Parameter | Beta | P |
|---|---|---|---|---|---|
| 1a) Age at onset = log(ePAL) | 0.217 | <0.001 | log(ePAL) | −0.472 | |
| 1b) Age at onset = log(ePAL) + AciI | 0.247 | <0.001 | log(ePAL) | −0.470 | <0.001 |
| AciI | 0.189 | 0.011 | |||
| 1c) Age at onset = log(ePAL) + AciI + sex | 0.263 | <0.001 | log(ePAL) | −0.473 | <0.001 |
| AciI | 0.195 | 0.008 | |||
| Sex | 0.144 | 0.050 | |||
| 2a) Somatic instability = log(ePAL) | 0.614 | <0.001 | 0.785 | ||
| 2b) Somatic instability = log(ePAL) + AciI | 0.658 | <0.001 | log(ePAL | 0.794 | <0.001 |
| AciI | −0.214 | <0.001 | |||
| 2c) Somatic instability = log(ePAL) + AciI + age | 0.684 | <0.001 | log(ePAL) | 0.851 | <0.001 |
| AciI | −0.208 | <0.001 | |||
| Age | 0.174 | <0.001 |
The models include age at symptom onset (age at onset), ePAL (ePAL), AciI sensitivity in the repeat tract (AciI), age at sampling (age), sex (sex) and somatic instability between birth and study sampling (somatic instability).
Somatic instability in the Saguenay cohort
Somatic instability can be defined as the change in the modal CTG repeat number between birth and the time at which the DNA is sampled. In this study, we have quantified somatic instability as the difference between the ePAL (22) and modal repeat number during the study. In the Saguenay cohort, somatic instability is strongly correlated with ePAL and the presence/absence of AciI sensitivity in the repeat tract (model 2b, r2 = 0.658, P < 0.001). The model was further improved by including age at sampling (P < 0.001) as an additional variable (model 2c, r2 = 0.684, P < 0.001). Linear regression of repeat tract AciI-sensitive/insensitive subgroups again showed that somatic instability was lower in AciI-sensitive participants (Fig. 2B, n = 16, r2 = 0.525, P = 0.001), than insensitive participants (n = 175, r2 = 0.652, P < 0.001). Including the sex of the participant as a variable did not improve the regression model.
Genotype–phenotype correlations in the Saguenay cohort
Nine clinical measures of skeletal muscle power and respiratory function were available for the Saguenay cohort—maximal inspiratory pressure (MIP); maximal expiratory pressure (MEP); forced vital capacity (FVC); peak expiratory flow (PEF); and power measurements for grip, pinch, shoulder abductors, knee extensors and ankle dorsiflexors. ePAL correlated significantly with seven of the nine measures without inclusion of any additional variables (Fig. 3, r2 ranged from 0.071 to 0.443). As the cohort is comprised of both sexes and a wide range of ages, we would expect that sex, age at sampling, height and weight may also contribute to phenotypes and included them as parameters in the linear regression model. ePAL was a significant contributor to all nine respiratory function and muscular power phenotypes when combined with age and/or sex (Table 2, Supplementary Material, Fig. 1) and for six of the phenotypes was the strongest contributor to the model (Table 2, see β values). Repeat tract AciI sensitivity was significant for six of the phenotypes, including all five measures of skeletal muscle power. The modal CTG repeat length during the study was significantly correlated with eight of the nine phenotypes without correction for age or sex (Fig. 4, r2 ranged from 0.049 to 0.505). When age and/or sex were added to the model, it became a significant modulator of all nine models and was the most significant contributor to six phenotypes (Table 3, see β values). As with ePAL, CTG repeat tract AciI sensitivity appeared to be most important for the measures of skeletal muscle power.
Figure 3.
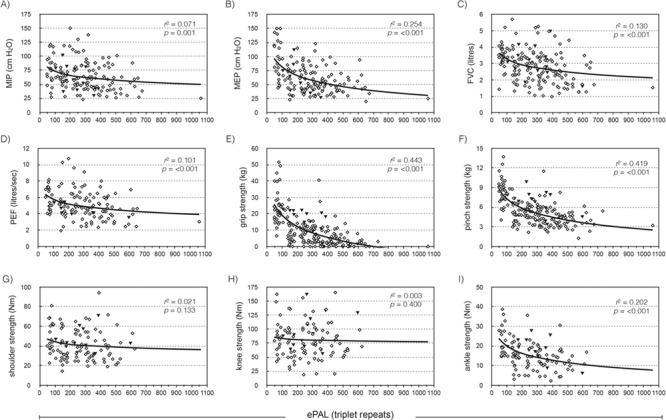
The estimated progenitor allele length is a modifier of four measures of respiratory function and three measures of skeletal muscle power. The graphs show the relationship between ePAL and (A) MIP, (B) MEP, (C) FVC, (D) PEF, (E) grip, (F) pinch, (G) shoulder, (H) knee and (I) ankle dorsiflexor strength, uncorrected for age, sex, height or weight. The solid line shows the logarithmic regression line for the cohort, r2 and P-values are for phenotype = log(ePAL). Solid black triangles represent patients with an AciI-sensitive CTG repeat tract.
Figure 4.
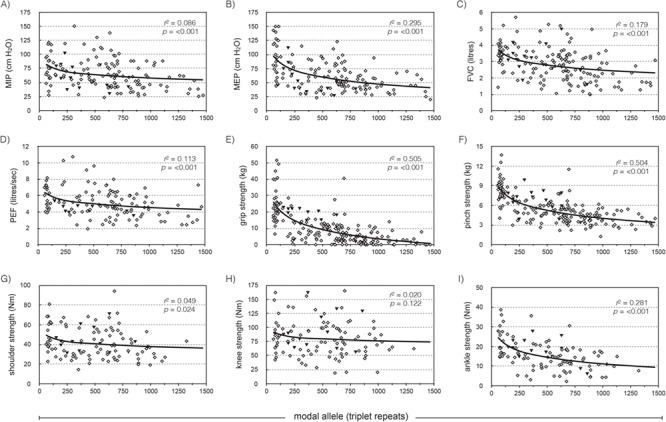
The modal allele length is a modifier of four measures of respiratory function and four measures of skeletal muscle power. The graphs show the relationship between modal allele length and (A) MIP, (B) MEP, (C) FVC, (D) PEF, (E) grip, (F) pinch, (G) shoulder, (H) knee and (I) ankle dorsiflexor strength, uncorrected for age, sex, height or weight. The solid line shows the logarithmic regression line for the cohort, r2 and P-values are for phenotype = log(modal). Solid black triangles represent patients with an AciI-sensitive CTG repeat tract.
Table 2.
Linear regression of nine respiratory function and skeletal muscle measures against sex, age, height, weight, ePAL and AciI sensitivity
| MIP | MEP | FVC | PEF | Grip | Pinch | Shoulder | Knee | Ankle | ||
|---|---|---|---|---|---|---|---|---|---|---|
| Sex | β | 0.198 | 0.238 | 0.206 | 0.217 | 0.121 | 0.222 | 0.627 | 0.496 | 0.221 |
| P-value | 0.008* | 0.001 | 0.006* | 0.034* | 0.112 | <0.001* | <0.001* | <0.001* | 0.008* | |
| Age | β | −0.426 | −0.198 | −0.333 | −0.337 | −0.105 | −0.192 | −0.119 | −0.314 | −0.237 |
| P-value | <0.001* | 0.006* | <0.001* | <0.001* | 0.057* | 0.001* | 0.072 | 0.001* | 0.011* | |
| Height | β | 0.071 | −0.013 | 0.465 | 0.285 | 0.161 | 0.045 | 0.145 | 0.000 | 0.056 |
| P-value | 0.503 | 0.903 | <0.001* | 0.006* | 0.002* | 0.546 | 0.107 | 0.997 | 0.648 | |
| Weight | β | 0.041 | 0.129 | −0.246 | −0.017 | 0.006 | 0.080 | 0.321 | 0.245 | 0.067 |
| P-value | 0.595 | 0.071* | <0.001* | 0.831 | 0.918 | 0.135 | <0.001* | 0.004* | 0.451 | |
| log(ePAL) | β | −0.387 | −0.590 | −0.468 | −0.485 | −0.718 | −0.724 | −0.271 | −0.283 | −0.580 |
| P-value | <0.001* | <0.001* | <0.001* | <0.001* | <0.001* | <0.001* | <0.001* | 0.002* | <0.001* | |
| AciI sensitivity | β | −0.053 | −0.057 | 0.125 | −0.066 | 0.116 | 0.217 | 0.173 | 0.226 | 0.264 |
| P-value | 0.471 | 0.414 | 0.015* | 0.364 | 0.002* | 0.001* | 0.004* | 0.004* | 0.002* | |
| Adjusted r2 | 0.244 | 0.347 | 0.586 | 0.376 | 0.495 | 0.522 | 0.655 | 0.419 | 0.317 | |
| Significance (P-value) | <0.001 | <0.001 | <0.001 | <0.001 | <0.001 | <0.001 | <0.001 | <0.001 | <0.001 | |
| Participants (n) | 144 | 142 | 166 | 125 | 189 | 188 | 106 | 105 | 106 | |
The table shows the adjusted r2 and P-value for each model and the standardized contribution (β) and significance (P-value) of each individual component of the model. The strongest contributor to each model (as determined from the standardized β) is shown in bold font. Only parameters considered significant (marked with an *) were included in the adjusted r2. Also shown is the number of participants (n) for which each phenotype measure was available.
Discussion
The Saguenay-Lac-Saint-Jean clinical cohort is phenotypically well characterized and genetic analysis has allowed us to correlate these phenotypes with DM1 genotype. By understanding the contribution of the DMPK CTG repeat to clinical phenotypes, we can both improve prognostic accuracy and identify further genetic factors that contribute to disease severity. Most importantly, we can also identify progressive symptoms that correlate robustly with the CTG expansion and can be used as an objective measure of disease severity in clinical trials.
Table 3.
Linear regression of nine respiratory function and skeletal muscle measures against sex, age, height, weight, modal allele length and AciI sensitivity
| MIP | MEP | FVC | PEF | Grip | Pinch | Shoulder | Knee | Ankle | ||
|---|---|---|---|---|---|---|---|---|---|---|
| Sex | β | 0.189 | 0.223 | 0.200 | 0.215 | 0.099 | 0.174 | 0.511 | 0.478 | 0.191 |
| P-value | 0.010* | 0.002* | 0.007* | 0.037* | 0.175 | 0.001* | <0.001* | <0.001* | 0.017* | |
| Age | β | −0.423 | −0.192 | −0.340 | −0.336 | −0.120 | −0.199 | −0.111 | −0.330 | −0.234 |
| P-value | <0.001* | 0.007* | <0.001* | <0.001* | 0.025* | <0.001* | 0.084* | <0.001* | 0.009* | |
| Height | β | 0.045 | −0.056 | 0.467 | 0.260 | 0.136 | 0.010 | 0.149 | 0.014 | 0.052 |
| P-value | 0.671 | 0.582 | <0.001* | 0.011* | 0.007* | 0.896 | 0.094* | 0.901 | 0.664 | |
| Weight | β | 0.039 | 0.129 | −0.237 | −0.014 | −0.003 | 0.088 | 0.299 | 0.266 | 0.079 |
| P-value | 0.607 | 0.066* | <0.001* | 0.863 | 0.952 | 0.084* | <0.001* | 0.001* | 0.365 | |
| log(modal) | β | −0.401 | −0.611 | −0.489 | −0.477 | −0.757 | −0.782 | −0.312 | −0.348 | −0.634 |
| P-value | <0.001* | <0.001* | <0.001* | <0.001* | <0.001* | <0.001* | <0.001* | <0.001* | <0.001* | |
| AciI sensitivity | β | −0.083 | −0.104 | 0.086 | −0.106 | 0.082 | 0.125 | 0.124 | 0.199 | 0.145 |
| P-value | 0.257 | 0.127 | 0.086* | 0.144 | 0.101 | 0.010* | 0.031* | 0.008* | 0.069* | |
| Adjusted r2 | 0.256 | 0.377 | 0.598 | 0.371 | 0.531 | 0.580 | 0.670 | 0.446 | 0.350 | |
| Significance (P-value) | <0.001 | <0.001 | <0.001 | <0.001 | <0.001 | <0.001 | <0.001 | <0.001 | <0.001 | |
The table shows the adjusted r2 and P-value for each model and the contribution (β) and significance (P-value) of each individual component of the model. The strongest contributor to each model (as determined from the standardized β) is shown in bold font. Only components considered significant (marked with an *) were included in the adjusted r2.
In the Saguenay cohort, 8.9% of participants have AciI-sensitive sites in the CTG repeat region, which significantly decrease somatic instability and increase age at symptom onset (Table 1, models 1b and 2c). This is higher than the 3% to 5% previously noted in studies of Serbian (34), French (25) and Czech (24) DM1 patients. As the Saguenay cohort share a relatively recent ancestor, and there were no AciI sites found in the smaller non-disease causing alleles, this suggests a high frequency of de novo mutations in the CTG tract subsequent to expansion into the disease range. These data show that the presence of AciI-sensitive variant repeats affects genotype/phenotype correlations, including progressive phenotypes likely to be measured in clinical trials. The data we present here indicate that in addition to having a greater absolute age at onset, variant repeat patients are less severely affected than would be expected at a given time point. It thus seems reasonable to assume that such patients will also have a slower rate of decline, although additional longitudinal data is required to verify this. Thus, until we understand better their role, we would suggest that for clinical trials, variant repeat patients are either excluded, or that any control/treated groups are matched to contain a similar number of variant repeat patients, to minimize the likelihood of skewing the rate of decline in either group.
ePAL and repeat tract AciI sensitivity are the most significant modifiers of age at symptom onset in the Saguenay study (r2 = 0.247, model 1b). The proportion of age at onset explained by ePAL and AciI sensitivity is lower than the 64% found in a previous study (22). This is likely due to having few late onset patients and no congenital/juvenile onset patients in the sampled Saguenay cohort. Although it is important to understand the correlation between genotype and age at symptom onset within the Saguenay cohort, for clinicians, objective measures of progressive phenotypes will be more informative.
The phenotypes affected by DM1, such as skeletal muscle power and respiratory function, can be influenced by many lifestyle and genetic parameters. Therefore, it is important to understand how much of the variation in these phenotypes can be attributed to the causative DMPK CTG repeat in DM1 patients. By identifying phenotypes strongly associated with the genetic cause of disease and less influenced by confounding factors, we can rationalize the best measures of disease status. Most crucially, this will identify progressive phenotypes that can be used as measures of symptom improvement or worsening during clinical trials and by practitioners. Although there have been some promising studies (35), CTG length hasn’t always correlated consistently with progressive phenotypes such as muscle maximal contraction and relaxation time (36,37). This is likely due to heterogeneity across tissues and small study size (28,29), as well as sampling biases and the progressive nature of both CTG expansion and symptom severity. Hogrel et al. (38) noted a correlation between modal CTG repeat length and myotonia and grip strength in a larger study of 144 patients. Although they considered the relationship not to be clinically meaningful, they noted that the study did not incorporate the relationship between phenotype and somatic instability or variant repeats, which may have improved their model. Determining CTG repeat size by SP-PCR, rather than restriction digest of genomic DNA, greatly improves accuracy, as restriction digest of genomic DNA does not separate larger alleles sufficiently to allow accurate sizing on a gel. Large fragments can have a migration difference of a few millimeters, but repeat size difference of hundreds of CTGs, resulting in imprecise estimation.
In this study, we analysed the genotype–phenotype correlation between ePAL and modal CTG allele length and nine common measures of respiratory function and skeletal muscle power. We also attempted to improve these models by including basic descriptors such as age, sex, height and weight. For seven of the nine measures, ePAL was a significant modifier without correction for age, sex, height, weight or other genetic factors (Fig. 3). This is perhaps the most striking in the more distal muscle measurements—grip strength (r2 = 0.443), pinch strength (r2 = 0.419) and ankle dorsiflexor strength (r2 = 0.202). As expected, the two skeletal muscle measurements for which ePAL was not individually significant are in more proximal muscle groups—knee extensor and shoulder abductor, which usually weaken later, if at all, in the disease. Nonetheless, when shoulder and knee strength are adjusted for sex, age, height, weight and AciI sensitivity, ePAL was a significant modifier of both phenotypes (Supplementary Material, Fig. 1G and H). This confirms that these basic descriptors are key contributors to muscle power phenotypes and must be factored during analysis. All five skeletal muscle phenotypes were improved by adding CTG repeat AciI sensitivity to the model, suggesting that the stabilizing effect of AciI-sensitive sequences is being translated in to a significant decrease in the severity of progressive symptoms (Table 2).
The modal repeat length during the study correlates significantly with eight of the nine phenotypes without correction for age or sex (Fig. 4). Like ePAL, this is most robust in the more distal muscle measurements—grip strength (r2 = 0.505), pinch strength (r2 = 0.504) and ankle dorsiflexor strength (r2 = 0.281). Modal allele length was a predictor of all nine phenotypes when age and sex were added to the model, and alongside age, was the only descriptor that contributed significantly to every phenotype (Table 3). Again, the combination of sex, age, height and weight measurements that add significantly to the regression was unique to every phenotype. The r2 for each model was marginally higher when using the modal CTG repeat length than the ePAL. Modal repeat length is nominally a measure of ePAL combined with individual dynamics of somatic mutation, and in this study, captures somatic instability better than ePAL factored with age at sampling. Accurate estimation of repeat length using SP-PCR is the most important factor for good correlation, no matter whether ePAL or modal repeat length is used.
These data suggest that objective phenotypes such as pinch strength could be utilized as outcome measurements in clinical trials. Genotype correlates better with pinch strength than age at symptom onset, even without the inclusion of mild or congenital DM1 patients. In a clinical trial, we would expect that symptom improvement would likelier be captured using pinch strength, for which DM1 genotype explains ~50% of muscle power, than other phenotypes such as FVC, where DM1 genotype only explains ~18% of respiratory capacity (Fig. 4F and C), and factors such as age and sex have a greater impact. All of the Saguenay cohort registered a pinch strength >0 kg, allowing for measurement of both muscle worsening and improvement over time. Grip strength has a similarly strong correlation with genotype, but numerous patients registered no grip strength (0 kg), making it impossible to measure worsening of the phenotype. Muscle power measurements such as grip and pinch strength are also relatively simple and inexpensive to assess annually by a clinician and could potentially be useful in the development of clinical biomarkers.
The models constructed in this study have all utilized CTG allele length as determined from blood DNA. Outcome measurements that correlate with repeat length in blood DNA, such as these, would be preferable for clinical trials as it negates the need for muscle biopsy samples. This analysis also factors sex, age, height and weight as individual factors in each model, rather than expressing phenotypes as a percentage of a predicted value for a ‘healthy’ individual. This allows us to perform analysis on clinical phenotypes for which extensive ‘normative’ data is not available, yet still account for natural variation in age, sex, height and weight. It also prevents the masking of interactions that may be specific to the DM1 population, such as the effect of age on both somatic instability and muscle power.
In conclusion, by factoring CTG allele length and the absence/presence of variant repeats in the CTG tract with basic descriptors such as sex and age, we can correlate DM1 genotype with progressive measures of phenotype that could be measured during clinical trials or by practitioners with DM1 patients. Recent studies suggest that drug mechanisms with genetic support are twice as likely to be approved during clinical trials (39), as it ensures a causal link between drug target and disease. Similarly, we would suggest that outcome measures that are best correlated with DM1 genotype are more likely to be useful during clinical studies, as they reflect a quantifiable causal relationship.
Materials and Methods
Participants
From 2002 to 2004, 200 patients of the Neuromuscular Clinic of the Centre de Santé et des services sociaux de Jonquière (Québec, Canada) were recruited into DM027, a longitudinal study aimed at finding the determinants of disability, social participation and quality of life in DM1. The study focused on adult and late onset DM1 patients, and those with congenital or childhood DM1 were excluded from participating.
Ethical standards and informed consent
This study was approved by the appropriate ethics committee [Ethics Review Board of the CIUSSS du Saguenay–Lac-St-Jean (Quebec, Canada)] and has been performed in accordance with the ethical standards laid down in the 1964 Declaration of Helsinki and its later amendments. All participants gave their informed consent before their inclusion in the study.
Clinical measurements
Age at symptom onset was estimated by an experienced DM1 clinician using a combination of patient interviews and available medical records. The symptoms first experienced by a patient are variable, and in this study, it was patient age at the first recognizable DM1 symptom, such as cataracts or weakness of the hand muscles, that was used. For 45 of the 192 Saguenay patients, it was not possible to confidently estimate an age at symptom onset, and as such, they were excluded from the age at symptom onset analysis.
Maximal inspiratory and expiratory pressure, FVC and PEF were measured by a respiratory therapist at the Jonquiere Hospital following a standardized protocol. Values used during analysis were uncorrected for age, height or sex, which were considered as independent variables in the multiple linear regression. Shoulder abductor, knee extensor and ankle dorsiflexor strength were measured twice for both left and right limbs, using a Microfet-2 (Hoggan Health Industries, USA), as previously described (40). The participant’s position was standardized for each muscle group before measurement. The maximal isometric torque was calculated by multiplying strength units (Newton) by the length of the corresponding lever (meters). The mean of the four values was calculated and used in the linear regression analysis. Grip strength was measured using a Jamar dynamometer (Asimow Engineering Co., USA) and lateral pinch strength using an A B & L Pinch Gauge (Fabrication Enterprises Inc, USA), following the protocols recommended by the American Society of Hand Therapists (41). Each standardized test was performed in triplicate, and the mean value used for linear regression. The cohort minimum, maximum and mean values for each measurement can be found in Supplementary Material, Table 1.
Small pool PCR amplification of DM1 alleles
For each patient, a blood sample was taken at entry into the DM027 study and genomic DNA extracted using the Gentra Puregene Blood Kit (Qiagen, USA). PCR amplification of the DMPK CTG repeat was carried out using the flanking primers DM-C and DM-DR as previously described (16). The PCR buffer was Custom PCR Master Mix-No Taq (Thermo Scientific #SM-0005) supplemented with 69 mm 2-mercaptoethanol. Taq polymerase (Sigma-Aldrich, UK) was used at 1 unit per 10 μl. Where required, reactions were supplemented with 10% DMSO (Sigma-Aldrich) and the annealing temperature reduced from 68°C to 63.5°C. PCR products were digested with AciI (42) in accordance with the manufacturer’s instructions (New England Biolabs Ltd, UK).
Small pool Southern blot hybridization
PCR amplified DM1 alleles were resolved on 1% agarose gels in 0.5X TBE, blotted and hybridized as described (16). Molecular weight marker (Invitrogen 1 kb+ ladder, Thermo Fisher Scientific, UK) and DNA probes were labeled using α-32P-dCTP (Perkin Elmer, UK) and the Invitrogen Random Primers DNA labeling system (Thermo Fisher Scientific). The CTG probe was amplified using flanking primers DM-C and DM-DR from a DM1 patient with 56 CTG repeats. After autoradiography, blot images were scanned, then ePAL and modal allele lengths were estimated from the lower boundary (16) and the densest part of the expanded allele distribution (22), respectively. Allele length was estimated by comparison to the 1 kb+ ladder, using CLIQS 1D gel analysis software (TotalLabs, UK).
Statistical analysis
Linear and multiple linear regressions were undertaken in IBM SPSS statistics version 22 (IBM, USA). ‘Stepwise’ regression was used, where all variables were considered for a model, and retained if they were significant coefficients (probability of ‘F’, entry < 0.1). Where variables were non-significant for a model, the β and significance are noted for reference. The β value is the absolute standardized coefficient and represents the contribution of each variable to the model. The greater the β value associated with a variable (whether positive or negative), the greater its contribution to the model. Adjusted r2 was used to account for the number of predictors in the model, and where r2 values are reported, it is the adjusted r2. A model was considered significant if P < 0.05.
Data availability policy
The data sets generated and/or analysed during this study are not currently publicly available because of the risk of patient de-identification, but are available for research upon reasonable request. The phenotypic data is available from Jean Mathieu and Cynthia Gagnon, and the genotypic data is available from Darren Monckton and Gayle Overend.
Supplementary Material
Acknowledgements
We would like to thank all the patients and their families who took the time to participate in this study.
Conflict of Interest statement. DGM has been a paid scientific consultant and/or received honoraria from Biogen Idec, AMO Pharma, Charles River and Vertex Pharmaceuticals and has provided scientific advice to BridgeBio, Pfizer, Third Rock, Atlas Ventures and the Dementia Discovery Fund. DGM also had a research contract with AMO Pharma and has received awards from the European Union, Muscular Dystrophy UK and the Myotonic Dystrophy Support Group. CG received an honorarium from Biogen Idec and funding from Bioblast Pharma Inc.
Funding
Muscular Dystrophy, UK (grant number RA3/3033); the Marigold Foundation; the Canadian Institutes of Health Research (grant number JNM-108412); the Fondation du grand défi Pierre Lavoie; the Fonds de la recherche du Québec en santé (to CL); the Fondation du grand défi Pierre Lavoie; the Corporation de recherche et d’action sur les maladies héréditaires; and the Centre de recherche médicale de l’Université de Sherbrooke.
Author biography
LB is a junior research scholar from the FRQS and is a member of the FRQS-funded Centre de recherche du CHUS (affiliated to the Centre hospitalier universitaire de Sherbrooke). CG is a member of the Centre de recherche—Hôpital Charles-Le Moyne. CG is also a junior research scholar from the FRQS.
References
- 1. Harper P.S. (2001) Myotonic Dystrophy. Harcourt Publishes Ltd, London. [Google Scholar]
- 2. Theadom A., Rodrigues M., Roxburgh R., Balalla S., Higgins C., Bhattacharjee R., Jones K., Krishnamurthi R. and Feigin V. (2014) Prevalence of muscular dystrophies: a systematic literature review. Neuroepidemiology, 43, 259–268. [DOI] [PubMed] [Google Scholar]
- 3. Brook J.D., Mccurrach M.E., Harley H.G., Buckler A.J., Church D., Aburatani H., Hunter K., Stanton V.P., Thirion J.P., Hudson T. et al. (1992) Molecular-basis of myotonic-dystrophy: expansion of a trinucleotide (CTG) repeat at the 3′ end of a transcript encoding a protein-kinase family member. Cell, 68, 799–808. [DOI] [PubMed] [Google Scholar]
- 4. Fu Y.H., Pizzuti A., Fenwick R.G. Jr., King J., Rajnarayan S., Dunne P.W., Dubel J., Nasser G.A., Ashizawa T., de Jong P. et al. (1992) An unstable triplet repeat in a gene related to myotonic muscular dystrophy. Science, 255, 1256–1258. [DOI] [PubMed] [Google Scholar]
- 5. Mahadevan M., Tsilfidis C., Sabourin L., Shutler G., Amemiya C., Jansen G., Neville C., Narang M., Barcelo J., O’Hoy K. et al. (1992) Myotonic dystrophy mutation: an unstable CTG repeat in the 3′ untranslated region of the gene. Science, 255, 1253–1255. [DOI] [PubMed] [Google Scholar]
- 6. Aslanidis C., Jansen G., Amemiya C., Shutler G., Mahadevan M., Tsilfidis C., Chen C., Alleman J., Wormskamp N.G., Vooijs M. et al. (1992) Cloning of the essential myotonic dystrophy region and mapping of the putative defect. Nature, 355, 548–551. [DOI] [PubMed] [Google Scholar]
- 7. Buxton J., Shelbourne P., Davies J., Jones C., Van Tongeren T., Aslanidis C., de Jong P., Jansen G., Anvret M., Riley B. et al. (1992) Detection of an unstable fragment of DNA specific to individuals with myotonic dystrophy. Nature, 355, 547–548. [DOI] [PubMed] [Google Scholar]
- 8. Harley H.G., Rundle S.A., Reardon W., Myring J., Crow S., Brook J.D., Harper P.S. and Shaw D.J. (1992) Unstable DNA sequence in myotonic dystrophy. Lancet, 339, 1125–1128. [DOI] [PubMed] [Google Scholar]
- 9. Ashizawa T., Dunne C.J., Dubel J.R., Perryman M.B., Epstein H.F., Boerwinkle E. and Hejtmancik J.F. (1992) Anticipation in myotonic dystrophy. I. Statistical verification based on clinical and haplotype findings. Neurology, 42, 1871–1877. [DOI] [PubMed] [Google Scholar]
- 10. Brunner H.G., Bruggenwirth H.T., Nillesen W., Jansen G., Hamel B.C.J., Hoppe R.L.E., Dedie C.E.M., Howeler C.J., Vanoost B.A., Wieringa B. et al. (1993) Influence of sex of the transmitting parent as well as of parental allele size on the CTG expansion in myotonic-dystrophy (DM). Am. J. Hum. Genet., 53, 1016–1023. [PMC free article] [PubMed] [Google Scholar]
- 11. Harley H.G., Rundle S.A., MacMillan J.C., Myring J., Brook J.D., Crow S., Reardon W., Fenton I., Shaw D.J. and Harper P.S. (1993) Size of the unstable CTG repeat sequence in relation to phenotype and parental transmission in myotonic dystrophy. Am. J. Hum. Genet., 52, 1164–1174. [PMC free article] [PubMed] [Google Scholar]
- 12. Lavedan C., Hofmannradvanyi H., Shelbourne P., Rabes J.P., Duros C., Savoy D., Dehaupas I., Luce S., Johnson K. and Junien C. (1993) Myotonic dystrophy: size-dependent and sex-dependent dynamics of CTG meiotic instability, and somatic mosaicism. Am. J. Hum. Genet., 52, 875–883. [PMC free article] [PubMed] [Google Scholar]
- 13. Howeler C.J., Busch H.F., Geraedts J.P., Niermeijer M.F. and Staal A. (1989) Anticipation in myotonic dystrophy: fact or fiction? Brain, 112Pt 3, 779–797. [DOI] [PubMed] [Google Scholar]
- 14. Jansen G., Willems P., Coerwinkel M., Nillesen W., Smeets H., Vits L., Howeler C., Brunner H. and Wieringa B. (1994) Gonosomal mosaicism in myotonic dystrophy patients: involvement of mitotic events in (CTG)n repeat variation and selection against extreme expansion in sperm. Am. J. Hum. Genet., 54, 575–585. [PMC free article] [PubMed] [Google Scholar]
- 15. Wong L.J.C., Ashizawa T., Monckton D.G., Caskey C.T. and Richards C.S. (1995) Somatic heterogeneity of the CTG repeat in myotonic dystrophy is age and size dependent. Am. J. Hum. Genet., 56, 114–122. [PMC free article] [PubMed] [Google Scholar]
- 16. Monckton D.G., Wong L.J., Ashizawa T. and Caskey C.T. (1995) Somatic mosaicism, germline expansions, germline reversions and intergenerational reductions in myotonic dystrophy males: small pool PCR analyses. Hum. Mol. Genet., 4, 1–8. [DOI] [PubMed] [Google Scholar]
- 17. Anvret M., Ahlberg G., Grandell U., Hedberg B., Johnson K. and Edstrom L. (1993) Larger expansions of the CTG repeat in muscle compared to lymphocytes from patients with myotonic dystrophy. Hum. Mol. Genet., 2, 1397–1400. [DOI] [PubMed] [Google Scholar]
- 18. Ishii S., Nishio T., Sunohara N., Yoshihara T., Takemura K., Hikiji K., Tsujino S. and Sakuragawa N. (1996) Small increase in triplet repeat length of cerebellum from patients with myotonic dystrophy. Hum. Genet., 98, 138–140. [DOI] [PubMed] [Google Scholar]
- 19. Jinnai K., Mitani M., Futamura N., Kawamoto K., Funakawa I. and Itoh K. (2013) Somatic instability of CTG repeats in the cerebellum of myotonic dystrophy type 1. Muscle Nerve, 48, 105–108. [DOI] [PubMed] [Google Scholar]
- 20. Thornton C.A., Johnson K. and Moxley R.T. 3rd. (1994) Myotonic dystrophy patients have larger CTG expansions in skeletal muscle than in leukocytes. Ann. Neurol., 35, 104–107. [DOI] [PubMed] [Google Scholar]
- 21. Morales F., Vasquez M., Santamaria C., Cuenca P., Corrales E. and Monckton D.G. (2016) A polymorphism in the MSH3 mismatch repair gene is associated with the levels of somatic instability of the expanded CTG repeat in the blood DNA of myotonic dystrophy type 1 patients. DNA Repair (Amst)., 40, 57–66. [DOI] [PubMed] [Google Scholar]
- 22. Morales F., Couto J.M., Higham C.F., Hogg G., Cuenca P., Braida C., Wilson R.H., Adam B., del Valle G., Brian R. et al. (2012) Somatic instability of the expanded CTG triplet repeat in myotonic dystrophy type 1 is a heritable quantitative trait and modifier of disease severity. Hum. Mol. Genet., 21, 3558–3567. [DOI] [PubMed] [Google Scholar]
- 23. Jeffreys A.J., Tamaki K., MacLeod A., Monckton D.G., Neil D.L. and Armour J.A. (1994) Complex gene conversion events in germline mutation at human minisatellites. Nat. Genet., 6, 136–145. [DOI] [PubMed] [Google Scholar]
- 24. Musova Z., Mazanec R., Krepelova A., Ehler E., Vales J., Jaklova R., Prochazka T., Koukal P., Marikova T., Kraus J. et al. (2009) Highly unstable sequence interruptions of the CTG repeat in the myotonic dystrophy gene. Am. J. Med. Genet. A, 149A, 1365–1374. [DOI] [PubMed] [Google Scholar]
- 25. Braida C., Stefanatos R.K., Adam B., Mahajan N., Smeets H.J., Niel F., Goizet C., Arveiler B., Koenig M., Lagier-Tourenne C. et al. (2010) Variant CCG and GGC repeats within the CTG expansion dramatically modify mutational dynamics and likely contribute toward unusual symptoms in some myotonic dystrophy type 1 patients. Hum. Mol. Genet., 19, 1399–1412. [DOI] [PubMed] [Google Scholar]
- 26. Santoro M., Masciullo M., Pietrobono R., Conte G., Modoni A., Bianchi M.L., Rizzo V., Pomponi M.G., Tasca G., Neri G. et al. (2013) Molecular, clinical, and muscle studies in myotonic dystrophy type 1 (DM1) associated with novel variant CCG expansions. J. Neurol., 260, 1245–1257. [DOI] [PubMed] [Google Scholar]
- 27. Botta A., Rossi G., Marcaurelio M., Fontana L., D’Apice M.R., Brancati F., Massa R., Monckton D.G., Sangiuolo F. and Novelli G. (2017) Identification and characterization of 5′ CCG interruptions in complex DMPK expanded alleles. Eur. J. Hum. Genet., 25, 257–261. [DOI] [PMC free article] [PubMed] [Google Scholar]
- 28. Thornton C.A. (2014) Myotonic dystrophy. Neurol. Clin. 32, 705–719, viii. [DOI] [PMC free article] [PubMed] [Google Scholar]
- 29. Yum K., Wang E.T. and Kalsotra A. (2017) Myotonic dystrophy: disease repeat range, penetrance, age of onset, and relationship between repeat size and phenotypes. Curr. Opin. Genet. Dev., 44, 30–37. [DOI] [PMC free article] [PubMed] [Google Scholar]
- 30. Mathieu J. and Prevost C. (2012) Epidemiological surveillance of myotonic dystrophy type 1: a 25-year population-based study. Neuromuscul. Disord., 22, 974–979. [DOI] [PubMed] [Google Scholar]
- 31. Mathieu J., De Braekeleer M. and Prevost C. (1990) Genealogical reconstruction of myotonic dystrophy in the Saguenay–Lac-Saint-Jean area (Quebec, Canada). Neurology, 40, 839–842. [DOI] [PubMed] [Google Scholar]
- 32. Mathieu J., De Braekeleer M., Prevost C. and Boily C. (1992) Myotonic dystrophy: clinical assessment of muscular disability in an isolated population with presumed homogeneous mutation. Neurology, 42, 203–208. [DOI] [PubMed] [Google Scholar]
- 33. Morales F., Vasquez M., Cuenca P., Campos D., Santamaria C., Del Valle G., Brian R., Sittenfeld M. and Monckton D.G. (2015) Parental age effects, but no evidence for an intrauterine effect in the transmission of myotonic dystrophy type 1. Eur. J. Hum. Genet., 23, 646–653. [DOI] [PMC free article] [PubMed] [Google Scholar]
- 34. Pesovic J., Peric S., Brkusanin M., Brajuskovic G., Rakocevic-Stojanovic V. and Savic-Pavicevic D. (2017) Molecular genetic and clinical characterization of myotonic dystrophy type 1 patients carrying variant repeats within DMPK expansions. Neurogenetics, 18, 207–218. [DOI] [PubMed] [Google Scholar]
- 35. Logigian E.L., Moxley R.T.t., Blood C.L., Barbieri C.A., Martens W.B., Wiegner A.W., Thornton C.A. and Moxley R.T. 3rd (2004) Leukocyte CTG repeat length correlates with severity of myotonia in myotonic dystrophy type 1. Neurology, 62, 1081–1089. [DOI] [PubMed] [Google Scholar]
- 36. Moxley R.T. 3rd, Logigian E.L., Martens W.B., Annis C.L., Pandya S., Moxley R.T.t., Barbieri C.A., Dilek N., Wiegner A.W. and Thornton C.A. (2007) Computerized hand grip myometry reliably measures myotonia and muscle strength in myotonic dystrophy (DM1). Muscle Nerve, 36, 320–328. [DOI] [PubMed] [Google Scholar]
- 37. Andersen G., Orngreen M.C., Preisler N., Colding-Jorgensen E., Clausen T., Duno M., Jeppesen T.D. and Vissing J. (2013) Muscle phenotype in patients with myotonic dystrophy type 1. Muscle Nerve, 47, 409–415. [DOI] [PubMed] [Google Scholar]
- 38. Hogrel J.Y., Ollivier G., Ledoux I., Hebert L.J., Eymard B., Puymirat J. and Bassez G. (2017) Relationships between grip strength, myotonia, and CTG expansion in myotonic dystrophy type 1. Ann. Clin. Transl. Neurol., 4, 921–925. [DOI] [PMC free article] [PubMed] [Google Scholar]
- 39. Nelson M.R., Tipney H., Painter J.L., Shen J., Nicoletti P., Shen Y., Floratos A., Sham P.C., Li M.J., Wang J. et al. (2015) The support of human genetic evidence for approved drug indications. Nat. Genet., 47, 856–860. [DOI] [PubMed] [Google Scholar]
- 40. Petitclerc E., Hebert L.J., Mathieu J., Desrosiers J. and Gagnon C. (2017) Lower limb muscle strength impairment in late-onset and adult myotonic dystrophy type 1 phenotypes. Muscle Nerve, 56, 57–63. [DOI] [PubMed] [Google Scholar]
- 41. American Society of Hand Therapists (1992) Clinical Assessment Recommendations. Chicago (401 N. Michigan Ave. Chicago IL 60611–4267). The Society.
- 42. Cumming S.A., Hamilton M.J., Robb Y., Gregory H., McWilliam C., Cooper A., Adam B., McGhie J., Hamilton G., Herzyk P. et al. (2018) De novo repeat interruptions are associated with reduced somatic instability and mild or absent clinical features in myotonic dystrophy type 1. Eur. J. Hum. Genet., 26, 1635–1647. [DOI] [PMC free article] [PubMed] [Google Scholar]
Associated Data
This section collects any data citations, data availability statements, or supplementary materials included in this article.
Supplementary Materials
Data Availability Statement
The data sets generated and/or analysed during this study are not currently publicly available because of the risk of patient de-identification, but are available for research upon reasonable request. The phenotypic data is available from Jean Mathieu and Cynthia Gagnon, and the genotypic data is available from Darren Monckton and Gayle Overend.