

Abstract
Centrosome abnormalities are emerging hallmarks of cancer. The overproduction of centrosomes (known as centrosome amplification) has been reported in a variety of cancers and is currently being explored as a promising target for therapy. However, to understand different types of centrosome abnormalities and their impact on centrosome function during tumor progression, as well as to identify tumor subtypes that would respond to the targeting of a centrosome abnormality, a reliable method for accurately quantifying centrosomes in human tissue samples is needed. Here, we established a method of quantifying centrosomes at a single-cell level in different types of human tissue samples. We tested multiple anti-centriole and pericentriolar-material antibodies to identify bona fide centrosomes and multiplexed these with cell border markers to identify individual cells within the tissue. High-resolution microscopy was used to generate multiple Z-section images, allowing us to acquire whole cell volumes in which to scan for centrosomes. The normal cells within the tissue serve as internal positive controls. Our method provides a simple, accurate way to distinguish alterations in centrosome numbers at the level of single cells.
INTRODUCTION
The centrosome is the major microtubule-organizing center in cells and is crucial in defining mitotic spindle poles and forming cilia (Conduit et al., 2015). Centrosomes consist of pairs of centrioles that serve as the duplicating elements of the organelle and organize surrounding layers of pericentriolar material (PCM), a protein matrix with microtubule-nucleating activity (Bettencourt-Dias and Glover, 2007; Lawo et al., 2012). Cells exert tight control over centrosome copy number. A centrosome duplicates only once during the S-phase to ensure that, during mitosis, only two centrosomes are present to guide assembly of a bipolar spindle and enhance the fidelity of chromosome segregation (Nigg, 2007). Centrosome numerical alterations, either extra copies of centrosomes (known as “centrosome amplification”) or centrosome loss, can lead to chromosome missegregation, resulting in the formation of micronuclei and aneuploid daughter cells (Khodjakov and Rieder, 2001; Ganem et al., 2009; Silkworth et al., 2009; Sir et al., 2013; Lambrus et al., 2015; Wong et al., 2015). In addition, centrosome amplification promotes an invasive phenotype in cultured cells and accelerates the rate of tumorigenesis (Godinho et al., 2014; Coelho et al., 2015; Sercin et al., 2016; Levine et al., 2017).
A century ago, Boveri proposed that increased numbers of centrosomes and aneuploidy promote tumor formation (Boveri, 1902/2008). At present, centrosome abnormalities, especially centrosome amplification, have been reported in a variety of tumors in clinical samples, including both solid tumors and hematological malignancies. Indeed, centrosome abnormalities have been reported to correlate with advanced tumor grade, metastasis, recurrence, and poor survival (Chan, 2011; Godinho and Pellman, 2014; Gonczy, 2015). Thus, centrosome amplification is an emerging cancer hallmark and a prominent mechanism promoting chromosomal instability.
Because centrosome amplification is unique in cancer cells, targeting cells containing extra centrosomes may be a promising treatment strategy. Cells possess the robust ability to cluster supernumerary centrosomes into a pseudobipolar spindle assembly and avoid multipolar division, which would be lethal (Ganem et al., 2009; Silkworth et al., 2009). However, such spindles frequently form incorrect merotelic kinetochore attachments, and the viable daughter cells that are produced often contain aneuploid genomes. Thus, targeting the centrosome-clustering pathway offers a promising clinical strategy for eliminating cancer cells containing amplified centrosomes (Leber et al., 2010; Kramer et al., 2011; Morris et al., 2017).
The compelling need for a companion assay to detect and quantitate centrosome abnormalities prompted the careful development of a reliable and accurate method for centrosome detection in human tissue specimens. The method described here would be useful to determine 1) inter- and intratumor heterogeneity, 2) whether different types of centrosome abnormalities exist in cancer (amplification or loss), 3) whether centrosome abnormalities change with cancer evolution, and 4) whether different centrosome abnormalities predominate in specific cancer types. Previous studies identified centrosomes using only PCM markers, which can form assemblies without centrioles, and thus are not representative of centrosomes (Woodruff et al., 2014). An increased amount of PCM can be considered either as a centrosome structural defect (D’Assoro et al., 2002) or as centrosome amplification, and produces results that are difficult to quantify (Godinho and Pellman, 2014).
Here, we developed an immunofluorescence microscopy–based method for quantifying centrosomes at a single-cell level using deidentified human Formalin-fixed paraffin-embedded (FFPE) tissue samples archived from a tumor bank. This method can be used to analyze normal biopsy specimens, surgical specimens, or tumor microarrays. Both centriole (e.g., CEP135) and PCM (e.g., γ-tubulin) proteins were targeted as markers to identify bona fide centrosomes. As a proof of principle, a similar strategy has been reported to score centrosomes successfully in Barrett’s esophagus (BE) tissue, which revealed that centrosome amplification arises early in this cancer and its incidence is dynamic during disease progression (Lopes et al., 2018). In our method, E-cadherin and α6-integrin were used as epithelial cell border markers to identify individual cell boundaries and to separate epithelial cells from stroma cells. High-resolution Z-section images were used to generate three-dimensional (3D) projections of tissue regions. Thus, our method identifies centrosomes of whole volumes of single cells within archived human FFPE samples.
RESULTS AND DISCUSSION
Selection of centrosome markers
To quantify centrosome features (e.g., number or size) in individual cells, the selection of the specific structural proteins with which to mark these organelles is critical. The centrosome duplicates in a cell cycle–dependent manner, and thus, centrosome copy number, structure, and the distribution of centriole and PCM proteins are dynamic during different cell cycle stages. Detailed centriole and PCM structure, as well as their assembly during the duplication cycle, has been well-documented (Gonczy, 2012; Brownlee and Rogers, 2013; Woodruff et al., 2014; Nigg and Holland, 2018).
The centrosome core contains a pair of centrioles with one fully matured mother centriole and a tightly associated daughter surrounded by layers of PCM (Figure 1A; Nigg and Holland, 2018). The mature centriole has a cylindrical shape and is ∼450–500 nm in length with a diameter of 200–250 nm and polarized along its longitudinal axis (Gonczy, 2012; Greenan et al., 2018). We first tested a battery of anti-centrosomal antibodies that stain discrete foci in human Formalin-fixed paraffin-embedded (FFPE) tissue samples and identified several that met these criteria, including antibodies recognizing centriole proteins CEP135, CETN3, and CP110, as well as PCM protein γ-tubulin (Figure 1B). Images of tissue samples were obtained using high-resolution deconvolution microscopy with a resolution of ∼200 nm. CEP135 is normally restricted to the proximal ends of centrioles (Lin et al., 2013), and appeared as a single spot. In contrast, centrin and CP110 localize to the distal tip of centrioles (Gonczy, 2012), and typically appeared as two foci. Anti–γ-tubulin resulted in one focus with an irregularly shaped pattern. The numbers of these foci were expected based on the distribution of the proteins during the cell cycle. In the G1 phase, a cell normally contains one mature mother centriole connected to its daughter through a proximally positioned flexible linker (Figure 1C). Thus, under these imaging conditions, a G1-phase cell normally contains two CEP135, centrin, CP110, and γ-tubulin foci (Figure 1D). After the G1-/S-phase transition, both centrioles duplicate and spawn orthogonally positioned procentrioles closely associated with their proximal ends. Procentrioles then elongate during the G2 phase (Figure 1C). Thus, cells in the S or G2 phase contain two centrosomes, each with a centriole pair and ensheathed in PCM. Because the distance between parent and procentriole is less than 200 nm, proximal-end markers of an “engaged” mother-procentriole/daughter pair appear as a single focus, but distal-end markers appear as two foci per centrosome. Thus, S- and G2-phase cells normally contain two CEP135 foci that overlap with γ-tubulin and colocalize with two centrin and CP110 spots each (total of four centrin/CP110 foci per cell; Figure 1D). Early mitotic cells contain an identical pattern until mitotic exit, when mother-daughter centriole pairs separate, termed “disengagement” (Tsou and Stearns, 2006; Figure 1D).
FIGURE 1:

The distribution and copy numbers of different centriole and PCM proteins at centrosomes vary during cell cycle phases. (A) Distributions of centriolar and PCM proteins at the centrosome. Scheme was adapted from Gonczy (2012). (B) Images show different combinations of centriole and PCM foci. Left panel: colocalization of CEP135 (red) and γ-tubulin (green); middle panel: colocalization of CEP135 (red) and CETN3 (green); right panel: colocalization of CP110 (red) and γ-tubulin (green). Scale bars: 1 μm. (C) Centrosome copy number changes as the centrosome duplicates during the cell cycle. (D) Numbers of centriolar and PCM foci per cell during cell cycle.
Cancer cells with centrosome amplification deviate from these numbers. During mitosis, extra centrosomes cluster at spindle poles, with each pole containing a varied number of centriole markers and typically surrounded by a single PCM cloud, making accurate measurement of centrosome numbers difficult. It follows that the use of PCM markers in mitotic cells is not a reliable method of measuring centrosome numbers. Thus, centrosome measurement in interphase cells is the preferred method. For detection of centrosome amplification in mitotic cells, multiplex of centriolar and PCM markers is critical, since each spindle pole could contain more than one centrosome; centriolar markers would appear as multiple distinct spots (e.g., >2 CEP135 foci per spindle pole) with PCM surrounding them.
To quantify centrosome numbers per cell, we selected CEP135 and γ-tubulin as the centrosome markers of choice, because this combination provides an easy-to-interpret result, since cells normally contain a constant two foci per cell throughout the cell cycle. More than two foci represent centrosome amplification, whereas less than two foci show centrosome loss. Only single uniformly shaped CEP135 foci that colocalized with γ-tubulin foci were scored as centrosomes. PCM proteins that appeared as multiple different-sized foci that lacked centriolar markers likely represent either PCM fragmentation or aggregates (Pihan et al., 2001; Denu et al., 2016), were not considered as centrosomes by this method, and were not scored. Aggregates of PCM are considered centrosomes only if they contain centrioles, even though they may display a microtubule-nucleating/organizing activity. We note that centrosomal markers should be carefully selected in pursuing specific questions. For example, to study PCM fragmentation or centrosome structural alterations, PCM proteins coupled with proximal-end and distal-end centriolar proteins are ideal. Centrosome amplification can manifest in different ways. For example, mother centrioles have the capacity to produce several daughters simultaneously, but normally do not. Marking both centriole proximal- and distal-end proteins can reveal this abnormal multiprocentriole configuration, known as a “centriole rosette” (Cosenza et al., 2017).
Centrosome detection at a single-cell level
To perform this procedure, FFPE tissue samples were sectioned at 5-μm thickness and immunostained for CEP135 as a centriolar marker, γ-tubulin as a PCM marker, and E-cadherin or α6 integrin as an epithelial cell membrane marker (Figure 2A). Stained samples can be stored at –20°C. To quantify centrosomes, samples were first scanned using a low-magnification objective (e.g., 4× or 10×) to identify informative regions of interest (ROI). Specific ROIs were then imaged with a high-resolution microscope with a resolution of ∼200 nm (e.g., confocal or deconvolution microscopy) using a high-magnification objective (60× or 100×). Z-sections were acquired to obtain entire cell volumes within the ROIs. Individual cell borders were defined with the E-cadherin or α6 integrin label (Figure 2B). A 3D reconstruction of the Z-section images was compiled using ImageJ, and specific single planes within the Z-stack were scanned to identify nearly every centrosome within single cells (Figure 2B).
FIGURE 2:

Scheme of the procedure. (A) Staining FFPE tissue. (B) Imaging acquisition and analysis.
Centriole and PCM proteins colocalize as distinct foci in human epithelial tissue
As a first test of our assay, we quantified centrosome numbers in normal human tissue. Tonsil tissue was initially used, because it is an industry standard for establishing a tissue-based method as it contains many different normal cell types. We found that CEP135 and γ-tubulin colocalized as discrete foci (Figure 3A) and accordingly scored them as centrosomes. Importantly, CEP135 appeared as distinct foci, whereas, in some cells, γ-tubulin foci were challenging to separate into individual foci. However, this appearance of γ-tubulin was expected (Woodruff et al., 2014).
FIGURE 3:

Centriole and PCM proteins colocalize at centrosomes as bright foci in human FFPE tissue. (A) A human normal tonsil FFPE tissue sample stained with CEP135 (red) and γ-tubulin (green). Nuclei in blue. Left panel: colocalization of CEP135 and γ-tubulin foci marks centrosomes in all cells. Scale bar: 100 μm. Middle panel: higher magnification of the boxed region in the left panel. Scale bar: 10 μm. Right panel: higher magnification of the boxed region in the middle panel. (B) Different staining patterns of centriolar protein CEP135 (red) in human prostate epithelial cancer tissue due to fixation artifact. Left panel: human prostate epithelial cancer tissue stained with E-cadherin (green), CEP135 (red), and DNA (blue). Right panel: CEP135 and DNA channels from the left image. Yellow arrowheads: CEP135 foci marking centrosomes. White arrowheads: CEP135 clouds due to fixation artifact. Yellow box: CEP135 foci marking centrosomes at high magnification. Scale bar: 1 μm. White box: CEP135 clouds at high magnification. Scale bar: 1 μm. (C) Optimization of centrosome foci counting in tissue by section thickness. The centrosome foci quantitation per cell is expressed as a percentage of the total cells counted (percentage of cells), and the counting accuracy was tested on either 4- or 5-µm-thick sections from prostate or breast tissue. Error bars indicate SD. The statistical significance was evaluated using unpaired t tests (* indicates 0.05 > p ≥ 0.01, ns is p ≥ 0.05 for the indicated pairwise comparison).
We next examined whether different fixation conditions could influence centrosome immunostaining. We used prostate cancer tissues that were Formalin-fixed after being stored in frozen blocks,- and performed the procedure as illustrated in Figure 2B. Interestingly, CEP135 appeared in different patterns: discrete bright foci as expected for centrosomes (Figure 3B, yellow arrowheads) and a roughly spherical collection of spots localized in nuclei (Figure 3B, white arrowheads). On the basis of the shape and overall distribution of this latter pattern, we considered this a fixation artifact. Thus, different fixation conditions should be tested, because they can alter centrosome staining.
We next determined whether the thickness of tissue sections impacted the ability to quantify centrosome numbers per cell accurately. Because different cell types within epithelial glands (e.g., basal compared with luminal epithelial cells) have different volumes, sectioning the tissue too thin can result in false-negative centrosome detection due to the loss of cell volume. Using normal prostate or breast tissue, sections at 4-μm thickness resulted in a severe loss of centrosomes; ∼60% of cells contained less than two centrosomes (Figure 3C). Sections at 5-μm thickness produced 30% of cells with less than two centrosomes (Figure 3C). Sectioning tissue too thick could result in overlapping cell layers (Figure 4, B and C), making centrosome numbers difficult to quantify. For these reasons, the use of maximum-intensity projections to identify centrosomes is not ideal. Thus, investigators should carefully test the appropriate tissue section thickness to avoid loss of tissue during sample preparation and prevent the complication of overlapping cells. Investigators can use normal tissue samples as controls to first test the maximum thickness one can use under the imaging conditions.
FIGURE 4:

Expected outcomes from FFPE nontumor epithelial tissue. (A) Left panel: a normal tonsil tissue sample stained with E-cadherin (green), CEP135 (red), and DNA (blue). Right panel: a normal tonsil tissue sample stained with γ-tubulin (green), α6 integrin (red), and DNA (blue). Scale bar: 100 μm. (B) A normal mammary gland tissue sample stained with E-cadherin (green), CEP135 (red), and DNA (blue). Scale bar: 100 μm. Top right panel: higher magnification of the boxed region at a single Z-section. Bottom right panel: higher magnification of the boxed region at a different Z-section. Yellow arrowheads: CEP135-marked centrioles. Note that centrioles appeared at different Z-sections in cells within the same imaging region. Scale bar: 10 μm. (C) A normal prostate tissue sample stained with γ-tubulin (green), α6 integrin (red), and DNA (blue). Scale bar: 100 μm. Top right panel: higher magnification of the boxed region at a single Z-section. Bottom right panel: higher magnification images of the boxed region at a different Z-section. Yellow arrowheads indicate γ-tubulin-marked centrosomes. Scale bar: 10 μm. (D) Normal tonsil (first panel), prostate (second panel), colon (third panel), and kidney (far right panel) epithelial tissue from TMA stained with E-cadherin (green), γ-tubulin (green), CEP135 (red), and DNA (blue). Scale bar: 100 μm in the top panels and 10 μm in the bottom panels.
Expected outcomes from nontumor epithelial tissues
After centrosome marker selection and tissue quality evaluation, we next used E-cadherin and α6 integrin as epithelial cell border markers to aid in identifying centrosomes in individual cells within nontumor epithelial tissues. E-cadherin was selected because it normally localizes to cell–cell adhesion sites known as adherens junctions in epithelial tissues (Gumbiner, 1996; Pecina-Slaus, 2003). However, advanced cancers often have abnormal E-cadherin expression with either loss of overall E-cadherin expression or loss of its normal localization at cell–cell adhesion (Birchmeier and Behrens, 1994; Thiery, 2002; Jeanes et al., 2008; Onder et al., 2008). We also tested α6 integrin, a laminin-binding integrin that can heterodimerize with β1 or β4 integrin and is normally localized at cell–ECM as well as cell–cell contacts (Hynes, 2002; Barczyk et al., 2010; Das et al., 2018). Further, α6β1 integrin has been used as a biomarker of aggressive tumor cells during cancer progression (Sroka et al., 2010; Harryman et al., 2016; Ramovs et al., 2017).
We first validated this method using normal tonsil tissue (Figure 4A). Both stromal cells and epithelial cells contain centrosome-marked CEP135 foci or γ-tubulin foci. E-cadherin or α6 integrin not only marked cell borders but also revealed the different differentiation states of the stratified squamous epithelium. We next examined glandular epithelium samples using normal mammary-gland FFPE tissue samples (Figure 4B) and normal prostate-gland FFPE samples (Figure 4C). In mammary glands, both epithelium and stroma cells contained CEP135-labeled centrosomes. E-cadherin revealed luminal cells in the mammary gland as well as surrounding myoepithelial cells. In the prostate tissue sample, α6 integrin labeled the cell–cell and cell–ECM borders for both the basal and luminal cells within prostate epithelial glands. α6 integrin also recognized blood vessels, which served as an internal control (Figure 4C). Specific Z-section planes allowed detection of centrosomes in individual cells from overlapping cell layers that would otherwise be difficult to score (Figure 4, B and C, boxed right panels). In the same ROI, centrosomes were detected in different Z-sections (Figure 4, B and C, yellow arrowheads). These results reinforce the importance of using Z-sections to accurately measure centrosomes in individual cells.
To evaluate the potential of high-throughput quantification of centrosomes with a large sample size, we tested our method using tissue microarrays (TMA). In the TMA we examined, the core size was 0.6 mm with a spacing of 0.9 mm and a total of 366 sample cores on each slide. TMA were immunostained for CEP135, γ-tubulin, and E-cadherin. Centrosomes that were labeled with both anti-CEP135 and γ-tubulin antibodies were detected in different types of normal epithelial tissue including tonsil, prostate, colon, and kidney (Figure 4D). In all the samples, CEP135 showed more quantifiable results than γ-tubulin. However, γ-tubulin staining contained bright and large foci compared with CEP135. Thus, an investment should be made to determine the most appropriate centrosome marker based on different tissue types and the imaging equipment available.
Expected outcomes from cancer epithelial tissues
We next used this method on cancer tissue. We first stained for centrosomes and E-cadherin in high-grade (Gleason 4) prostate cancer tissue (Figure 5A). Interestingly, as previously reported, centrosome abnormalities were observed in prostate cancer glands (Chan, 2011). Importantly, in the same glands, we detected both centrosome amplification (Figure 5A, yellow arrowheads) and loss (Figure 5A, white arrowheads). More detailed studies comparing centrosome numbers in different cancers can performed to determine whether similar types of centrosome abnormalities exist. Because advanced tumors can be associated with loss of E-cadherin, we next used α6 integrin as a cell border marker in Gleason 4 prostate cancer glands (Figure 5B) because α6β1 integrin is expressed in advanced cancers. We note that aggressive tumors can associate with an altered α6 integrin expression pattern (Das et al., 2018). Thus, in addition to E-cadherin and α6 integrin, other cell border markers may be required for other cancer subtypes.
FIGURE 5:
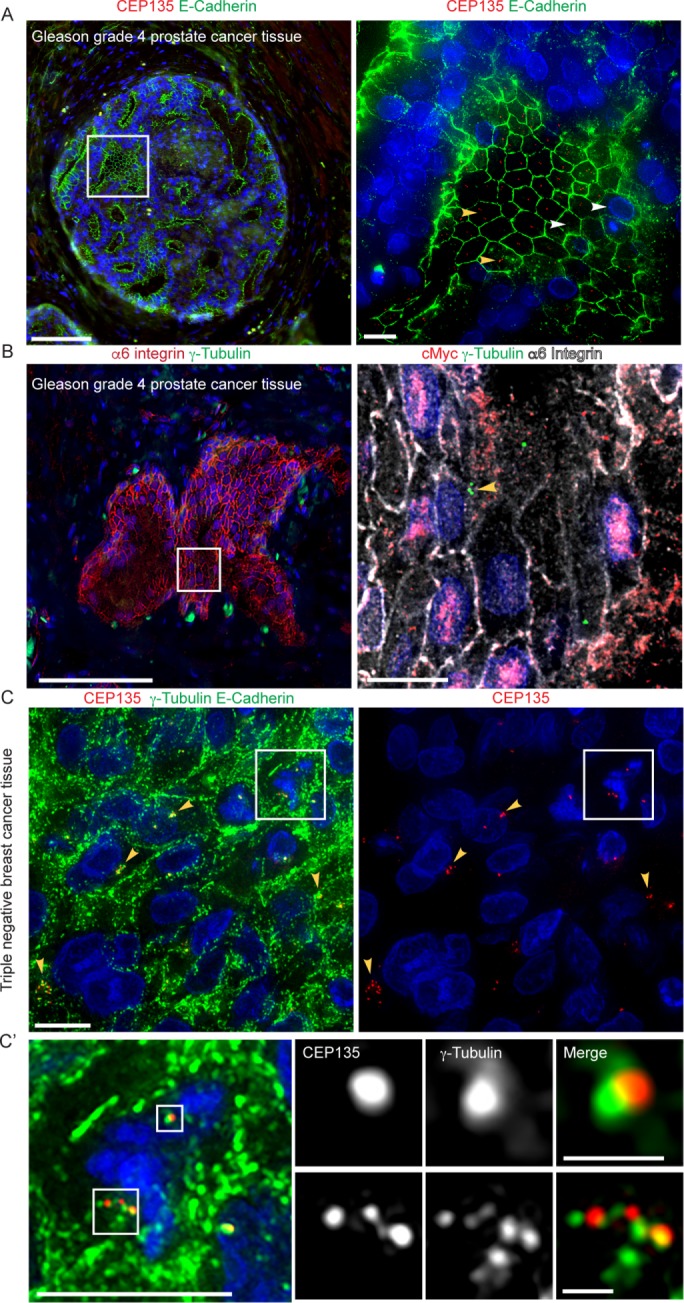
Expected outcomes from FFPE epithelial cancer tissue. (A) Left panel: a Gleason grade 4 prostate cancer gland stained with E-cadherin (green), CEP135 (red), and DNA (blue). Scale bar: 100 μm. Right panel: higher magnification of the boxed region. Yellow arrowheads: cells with centrosome amplification. White arrowheads: cells with centrosome loss. Scale bar: 10 μm. (B) Left panel: a Gleason grade 4 gland stained with α6 integrin (red), γ-tubulin (green), and DNA (blue). Scale bar: 100 μm. Right panel: higher magnification of the boxed region stained with cMyc (red,), γ-tubulin (green), α6 integrin (white), and DNA (blue). Yellow arrowheads: cells with centrosome amplification. Scale bar: 10 μm. (C) Left panel: TNBC stained with E-cadherin (green), γ-tubulin (green), CEP135 (red), and DNA (blue). Right panel: CEP135 (red) and DNA (blue) channels from left panel. Scale bar: 10 μm. Boxed region: a mitotic cell with centrosome clustering. Yellow arrowheads: cells with centrosome amplification. (C’) A higher magnification of the boxed region in C. Scale bar: 10 μm in the left panel, 1 μm in the boxed images.
It would be valuable to use this method to test whether centrosome abnormalities (amplification or loss) are associated with different genetic instabilities and other markers associated with tumor aggressiveness, such as cMyc overexpression. Therefore, we multiplexed γ-tubulin, α6 integrin, and cMyc (Figure 5B, right panel) on patient tissue with Gleason Score 4 + 3 prostate cancer. In a single tissue section, some cells contained centrosome amplification (Figure 5B, right panel, yellow arrowhead), while other cancer cells had nuclear cMyc expression and centrosome loss. Therefore, the method reported here could be used in a large cohort study to determine whether centrosome abnormalities are associated with cMyc protein overexpression in the same cancer cells within the same tissue section. Other technologies such as fluorescence in situ hybridization (FISH) may also be used to test whether changes in centrosome numbers are associated with certain chromosomal abnormalities.
Because cancer cells with centrosome amplification often undergo centrosome clustering during mitosis, we next tested whether our method can detect centrosome amplification in mitotic cells. We applied our method on a triple-negative breast cancer (TNBC) tissue sample with detectable centrosome amplification in interphase cancer cells marked by CEP135 and γ-tubulin (Figure 5C, yellow arrowheads). Mitotic cells were identified by the presence of condensed chromatin (Figure 5C, white box). In the mitotic cell shown in Figure 5C’, one of the spindle poles contained a single centrosome, marked by one CEP135 and γ-tubulin colocalizing foci (upper white box), while the other spindle pole contained supernumerary centrosomes marked by more than two distinct CEP135 foci with PCM aggregates (lower white box). Thus, centrosome amplification can be detected in mitotic cells exhibiting centrosome clustering using centriole markers.
Taking these results together, we established a method for accurately quantifying bona fide centrosome numbers at the level of single cells in human FFPE tissue samples using markers for centrioles, PCM, and the cell border. Using this method, we successfully detected and quantified centrosomes in individual cells using different tissue types. The selection of centrosome and cell border markers can be tailored to specific biological and clinical questions. Tissue quality is important in obtaining reliable, quantifiable, and reproducible results. Tissue thickness should be optimized based on tissue type. Limitations of this method include a requirement for high-resolution microscopy and the need to develop automated quantification. High-throughput automated quantification is challenging due to 1) difficulties in defining ROIs because of different cell types in tissue, 2) difficulties in defining individual cell borders in 3D, and 3) differences in the size of centrosome foci, which can be due to the centrosome markers. Not only will studies of centrosome abnormalities during tumor progression benefit from this method, but also it could be used to screen patient samples for potentially clinically aggressive cancers.
MATERIALS AND METHODS
Reagents
Reagents used were xylene (Fisher Scientific, cat no. HC7001GAL; 22-110-676; X16-4), 2-propanol (Fisher Scientific, cat no. A416-4), Antigen retrieval buffer (EnVision FLEX Target Retrieval Solution, high pH [50×], Dako Omnis, Code No. GV804), Tris-HCl (Sigma-Aldrich, cat no:T5941), NaCl (Sigma-Aldrich, cat no. S9888), Tween 20 (Sigma-Aldrich, cat no. BP337), Triton-100 (Sigma-Aldrich, cat no. X100), NaN3 (Fisher Scientific, cat no. S2271-25), normal goat serum (Sigma-Aldrich, cat no. G9023), bovine serum albumin (BSA) (Sigma-Aldrich, cat no. A7030), methanol (Fisher Scientific, cat no. A411-4), and ProLong Diamond Antifade Mountant (Thermo Fisher Scientific, P36970).
Antibodies
Primary antibodies are indicated in Supplemental Table 1. Secondary antibodies were purchased from Jackson Immunoresearch and used at 1:200 dilution. Hoechst 33342 (Life Technologies) was used at 1:1000 dilution.
Immunohistochemistry
FFPE blocks were sectioned at 5-µm thickness and mounted on slides. Slides were baked at 65°C overnight and deparaffined by washing in xylene three times, 7 min each, followed by passing through 100%, 75%, and 50% isopropanol and ddH2O for rehydration. Antigen retrieval was performed using EnVision FLEX target retrieval solution high pH (DAKO, DM828) buffer and heated at 97°C using a decloaking chamber for 20 min. Slides were washed in washing buffer (0.1 M Tris-HCl, 0.3 M NaCl, 0.1% Tween 20, and 7.7 mM NaN3, pH 7.6 at 25°C) following by blocking buffer (5% normal goat serum, 0.1 M Tris-HCl, and 0.15 M NaCl, pH 7.6 at 25°C) for 30 min at room temperature. Primary antibodies were diluted in blocking buffer and incubated at 4°C overnight in a humidified chamber. Slides were washed three times in washing buffer and incubated with secondary antibody and Hoechst 33342 (1:1000; Invitrogen) for 30 min–1 h at room temperature. Slides were washed three times in washing buffer, mounted using ProLong Diamond Antifade Mountant (Thermo Fisher Scientific, P36970), and stored overnight in the dark at room temperature to cure the mountant. Slides were imaged as above or stored at –20°C for future analysis. Specimens were imaged using a DeltaVision Core system (GE Healthcare Bio-Sciences) equipped with an Olympus IX71 microscope, a 60× objective (NA 1.42), and a cooled charge-coupled CoolSNAP HQ2 camera (Photometrics). Images were acquired with softWoRx v1.2 software (Applied Science).
Software
Software used was image acquisition software (softWoRx v1.2 software [Applied Science]) and imaging analysis software (Adobe Photoshop; www.adobe.com/products/photoshopfamily.html, ImageJ, or Fiji; Schindelin et al., 2012; Schneider et al., 2012).
Statistical analysis
The statistical significance of differences in average measurements was evaluated using unpaired t tests (GraphPad Prism 6.0). Means are taken to be significantly different if p < 0.05. In figures, “*” indicates 0.05 > p ≥ 0.01, and not significant, “ns,” indicates p ≥ 0.05 for the indicated pairwise comparison. Error bars in all figures indicate SD.
Supplementary Material
Acknowledgments
We are grateful for National Cancer Institute (NCI) P30CA23074, which provided the research support services of the Tissue Acquisition and Molecular Analysis Service. Tissue samples were obtained from the Prostate Cancer Biorepository Network (PCBN) created by Department of Defense Prostate Cancer Research Program Awards W81XWH-14-2-0182, W81XWH-14-2-0183, W81XWH-14-2-0185, W81XWH-14-2-0186, and W81XWH-15-2-0062. This work was also supported by National Institutes of Health (NIH) Grants R01GM110166 and R01GM126035 to G.C.R., NIH-NCI RO1CA159406 to A.E.C., and a Tim and Diane Bowden Cancer Biology Research Fellowship to M.W.
Abbreviations used:
- FFPE
Formalin-fixed paraffin-embedded
- PCM
pericentriolar material
- TMA
tissue microarrays.
Footnotes
This article was published online ahead of print in MBoC in Press (http://www.molbiolcell.org/cgi/doi/10.1091/mbc.E18-10-0651) on January 30, 2019.
REFERENCES
- Barczyk M, Carracedo S, Gullberg D. (2010). Integrins. Cell Tissue Res , 269–280. [DOI] [PMC free article] [PubMed] [Google Scholar]
- Bettencourt-Dias M, Glover DM. (2007). Centrosome biogenesis and function: centrosomics brings new understanding. Nat Rev Mol Cell Biol , 451–463. [DOI] [PubMed] [Google Scholar]
- Birchmeier W, Behrens J. (1994). Cadherin expression in carcinomas: role in the formation of cell junctions and the prevention of invasiveness. Biochim Biophys Acta , 11–26. [DOI] [PubMed] [Google Scholar]
- Boveri T. (1902/2008). Concerning the origin of malignant tumours, translated and annotated by Henry Harris. J Cell Sci (Suppl 1), 1–84. [DOI] [PubMed] [Google Scholar]
- Brownlee CW, Rogers GC. (2013). Show me your license, please: deregulation of centriole duplication mechanisms that promote amplification. Cell Mol Life Sci , 1021–1034. [DOI] [PMC free article] [PubMed] [Google Scholar]
- Chan JY. (2011). A clinical overview of centrosome amplification in human cancers. Int J Biol Sci , 1122–1144. [DOI] [PMC free article] [PubMed] [Google Scholar]
- Coelho PA, Bury L, Shahbazi MN, Liakath-Ali K, Tate PH, Wormald S, Hindley CJ, Huch M, Archer J, Skarnes WC, et al. (2015). Over-expression of Plk4 induces centrosome amplification, loss of primary cilia and associated tissue hyperplasia in the mouse. Open Biol , 150209. [DOI] [PMC free article] [PubMed] [Google Scholar]
- Conduit PT, Wainman A, Raff JW. (2015). Centrosome function and assembly in animal cells. Nat Rev Mol Cell Biol , 611–624. [DOI] [PubMed] [Google Scholar]
- Cosenza MR, Cazzola A, Rossberg A, Schieber NL, Konotop G, Bausch E, Slynko A, Holland-Letz T, Raab MS, Dubash T, et al. (2017). Asymmetric centriole numbers at spindle poles cause chromosome missegregation in cancer. Cell Rep , 1906–1920. [DOI] [PubMed] [Google Scholar]
- Das L, Gard JMC, Prekeris R, Nagle RB, Morrissey C, Knudsen BS, Miranti CK, Cress AE. (2018). Novel regulation of integrin trafficking by Rab11-FIP5 in aggressive prostate cancer. Mol Cancer Res , 1319–1331. [DOI] [PMC free article] [PubMed] [Google Scholar]
- D’Assoro AB, Barrett SL, Folk C, Negron VC, Boeneman K, Busby R, Whitehead C, Stivala F, Lingle WL, Salisbury JL. (2002). Amplified centrosomes in breast cancer: a potential indicator of tumor aggressiveness. Breast Cancer Res Treat , 25–34. [DOI] [PubMed] [Google Scholar]
- Denu RA, Zasadil LM, Kanugh C, Laffin J, Weaver BA, Burkard ME. (2016). Centrosome amplification induces high grade features and is prognostic of worse outcomes in breast cancer. BMC Cancer , 47. [DOI] [PMC free article] [PubMed] [Google Scholar]
- Ganem NJ, Godinho SA, Pellman D. (2009). A mechanism linking extra centrosomes to chromosomal instability. Nature , 278–282. [DOI] [PMC free article] [PubMed] [Google Scholar]
- Godinho SA, Pellman D. (2014). Causes and consequences of centrosome abnormalities in cancer. Philos Trans R Soc Lond B Biol Sci , 20130467. [DOI] [PMC free article] [PubMed] [Google Scholar]
- Godinho SA, Picone R, Burute M, Dagher R, Su Y, Leung CT, Polyak K, Brugge JS, Thery M, Pellman D. (2014). Oncogene-like induction of cellular invasion from centrosome amplification. Nature , 167–171. [DOI] [PMC free article] [PubMed] [Google Scholar]
- Gonczy P. (2012). Towards a molecular architecture of centriole assembly. Nat Rev Mol Cell Biol , 425–435. [DOI] [PubMed] [Google Scholar]
- Gonczy P. (2015). Centrosomes and cancer: revisiting a long-standing relationship. Nat Rev Cancer , 639–652. [DOI] [PubMed] [Google Scholar]
- Greenan GA, Keszthelyi B, Vale RD, Agard DA. (2018). Insights into centriole geometry revealed by cryotomography of doublet and triplet centrioles. Elife , e36851. [DOI] [PMC free article] [PubMed] [Google Scholar]
- Gumbiner BM. (1996). Cell adhesion: the molecular basis of tissue architecture and morphogenesis. Cell , 345–357. [DOI] [PubMed] [Google Scholar]
- Harryman WL, Hinton JP, Rubenstein CP, Singh P, Nagle RB, Parker SJ, Knudsen BS, Cress AE. (2016). The cohesive metastasis phenotype in human prostate cancer. Biochim Biophys Acta , 221–231. [DOI] [PMC free article] [PubMed] [Google Scholar]
- Hynes RO. (2002). Integrins: bidirectional, allosteric signaling machines. Cell , 673–687. [DOI] [PubMed] [Google Scholar]
- Jeanes A, Gottardi CJ, Yap AS. (2008). Cadherins and cancer: how does cadherin dysfunction promote tumor progression? Oncogene , 6920–6929. [DOI] [PMC free article] [PubMed] [Google Scholar]
- Khodjakov A, Rieder CL. (2001). Centrosomes enhance the fidelity of cytokinesis in vertebrates and are required for cell cycle progression. J Cell Biol , 237–242. [DOI] [PMC free article] [PubMed] [Google Scholar]
- Kramer A, Maier B, Bartek J. (2011). Centrosome clustering and chromosomal (in)stability: a matter of life and death. Mol Oncol , 324–335. [DOI] [PMC free article] [PubMed] [Google Scholar]
- Lambrus BG, Uetake Y, Clutario KM, Daggubati V, Snyder M, Sluder G, Holland AJ. (2015). p53 protects against genome instability following centriole duplication failure. J Cell Biol , 63–77. [DOI] [PMC free article] [PubMed] [Google Scholar]
- Lawo S, Hasegan M, Gupta GD, Pelletier L. (2012). Subdiffraction imaging of centrosomes reveals higher-order organizational features of pericentriolar material. Nat Cell Biol , 1148–1158. [DOI] [PubMed] [Google Scholar]
- Leber B, Maier B, Fuchs F, Chi J, Riffel P, Anderhub S, Wagner L, Ho AD, Salisbury JL, Boutros M, Kramer A. (2010). Proteins required for centrosome clustering in cancer cells. Sci Transl Med , 33ra38. [DOI] [PubMed] [Google Scholar]
- Levine MS, Bakker B, Boeckx B, Moyett J, Lu J, Vitre B, Spierings DC, Lansdorp PM, Cleveland DW, Lambrechts D, et al. (2017). Centrosome amplification is sufficient to promote spontaneous tumorigenesis in mammals. Dev Cell , 313–322 e315. [DOI] [PMC free article] [PubMed] [Google Scholar]
- Lin YC, Chang CW, Hsu WB, Tang CJ, Lin YN, Chou EJ, Wu CT, Tang TK. (2013). Human microcephaly protein CEP135 binds to hSAS-6 and CPAP, and is required for centriole assembly. EMBO J , 1141–1154. [DOI] [PMC free article] [PubMed] [Google Scholar]
- Lopes CAM, Mesquita M, Cunha AI, Cardoso J, Carapeta S, Laranjeira C, Pinto AE, Pereira-Leal JB, Dias-Pereira A, Bettencourt-Dias M, Chaves P. (2018). Centrosome amplification arises before neoplasia and increases upon p53 loss in tumorigenesis. J Cell Biol , 2353–2363. [DOI] [PMC free article] [PubMed] [Google Scholar]
- Morris EJ, Kawamura E, Gillespie JA, Balgi A, Kannan N, Muller WJ, Roberge M, Dedhar S. (2017). Stat3 regulates centrosome clustering in cancer cells via Stathmin/PLK1. Nat Commun , 15289. [DOI] [PMC free article] [PubMed] [Google Scholar]
- Nigg EA. (2007). Centrosome duplication: of rules and licenses. Trends Cell Biol , 215–221. [DOI] [PubMed] [Google Scholar]
- Nigg EA, Holland AJ. (2018). Once and only once: mechanisms of centriole duplication and their deregulation in disease. Nat Rev Mol Cell Biol , 297–312. [DOI] [PMC free article] [PubMed] [Google Scholar]
- Onder TT, Gupta PB, Mani SA, Yang J, Lander ES, Weinberg RA. (2008). Loss of E-cadherin promotes metastasis via multiple downstream transcriptional pathways. Cancer Res , 3645–3654. [DOI] [PubMed] [Google Scholar]
- Pecina-Slaus N. (2003). Tumor suppressor gene E-cadherin and its role in normal and malignant cells. Cancer Cell Int , 17. [DOI] [PMC free article] [PubMed] [Google Scholar]
- Pihan GA, Purohit A, Wallace J, Malhotra R, Liotta L, Doxsey SJ. (2001). Centrosome defects can account for cellular and genetic changes that characterize prostate cancer progression. Cancer Res , 2212–2219. [PubMed] [Google Scholar]
- Ramovs V, Te Molder L, Sonnenberg A. (2017). The opposing roles of laminin-binding integrins in cancer. Matrix Biol , 213–243. [DOI] [PubMed] [Google Scholar]
- Schindelin J, Arganda-Carreras I, Frise E, Kaynig V, Longair M, Pietzsch T, Preibisch S, Rueden C, Saalfeld S, Schmid B, et al. (2012). Fiji: an open-source platform for biological-image analysis. Nat Methods , 676–682. [DOI] [PMC free article] [PubMed] [Google Scholar]
- Schneider CA, Rasband WS, Eliceiri KW. (2012). NIH Image to ImageJ: 25 years of image analysis. Nat Methods , 671–675. [DOI] [PMC free article] [PubMed] [Google Scholar]
- Sercin O, Larsimont JC, Karambelas AE, Marthiens V, Moers V, Boeckx B, Le Mercier M, Lambrechts D, Basto R, Blanpain C. (2016). Transient PLK4 overexpression accelerates tumorigenesis in p53-deficient epidermis. Nat Cell Biol , 100–110. [DOI] [PubMed] [Google Scholar]
- Silkworth WT, Nardi IK, Scholl LM, Cimini D. (2009). Multipolar spindle pole coalescence is a major source of kinetochore mis-attachment and chromosome mis-segregation in cancer cells. PLoS One , e6564. [DOI] [PMC free article] [PubMed] [Google Scholar]
- Sir JH, Putz M, Daly O, Morrison CG, Dunning M, Kilmartin JV, Gergely F. (2013). Loss of centrioles causes chromosomal instability in vertebrate somatic cells. J Cell Biol , 747–756. [DOI] [PMC free article] [PubMed] [Google Scholar]
- Sroka IC, Anderson TA, McDaniel KM, Nagle RB, Gretzer MB, Cress AE. (2010). The laminin binding integrin alpha6beta1 in prostate cancer perineural invasion. J Cell Physiol , 283–288. [DOI] [PMC free article] [PubMed] [Google Scholar]
- Thiery JP. (2002). Epithelial-mesenchymal transitions in tumour progression. Nat Rev Cancer , 442–454. [DOI] [PubMed] [Google Scholar]
- Tsou MF, Stearns T. (2006). Mechanism limiting centrosome duplication to once per cell cycle. Nature , 947–951. [DOI] [PubMed] [Google Scholar]
- Wong YL, Anzola JV, Davis RL, Yoon M, Motamedi A, Kroll A, Seo CP, Hsia JE, Kim SK, Mitchell JW, et al. (2015). Cell biology. Reversible centriole depletion with an inhibitor of Polo-like kinase 4. Science , 1155–1160. [DOI] [PMC free article] [PubMed] [Google Scholar]
- Woodruff JB, Wueseke O, Hyman AA. (2014). Pericentriolar material structure and dynamics. Philos Trans R Soc Lond B Biol Sci , 20130459. [DOI] [PMC free article] [PubMed] [Google Scholar]
Associated Data
This section collects any data citations, data availability statements, or supplementary materials included in this article.