

Abstract
Background
Clinical practice is not always evidence‐based and, therefore, may not optimise patient outcomes. Local opinion leaders (OLs) are individuals perceived as credible and trustworthy, who disseminate and implement best evidence, for instance through informal one‐to‐one teaching or community outreach education visits. The use of OLs is a promising strategy to bridge evidence‐practice gaps. This is an update of a Cochrane review published in 2011.
Objectives
To assess the effectiveness of local opinion leaders to improve healthcare professionals' compliance with evidence‐based practice and patient outcomes.
Search methods
We searched CENTRAL, MEDLINE, Embase, three other databases and two trials registers on 3 July 2018, together with searching reference lists of included studies and contacting experts in the field.
Selection criteria
We considered randomised studies comparing the effects of local opinion leaders, either alone or with a single or more intervention(s) to disseminate evidence‐based practice, with no intervention, a single intervention, or the same single or more intervention(s). Eligible studies were those reporting objective measures of professional performance, for example, the percentage of patients being prescribed a specific drug or health outcomes, or both. We included all studies independently of the method used to identify OLs.
Data collection and analysis
We used standard Cochrane procedures in this review. The main comparison was (i) between any intervention involving OLs (OLs alone, OLs with a single or more intervention(s)) versus any comparison intervention (no intervention, a single intervention, or the same single or more intervention(s)). We also made four secondary comparisons: ii) OLs alone versus no intervention, iii) OLs alone versus a single intervention, iv) OLs, with a single or more intervention(s) versus the same single or more intervention(s), and v) OLs with a single or more intervention(s) versus no intervention.
Main results
We included 24 studies, involving more than 337 hospitals, 350 primary care practices, 3005 healthcare professionals, and 29,167 patients (not all studies reported this information). A majority of studies were from North America, and all were conducted in high‐income countries. Eighteen of these studies (21 comparisons, 71 compliance outcomes) contributed to the median adjusted risk difference (RD) for the main comparison. The median duration of follow‐up was 12 months (range 2 to 30 months). The results suggested that the OL interventions probably improve healthcare professionals' compliance with evidence‐based practice (10.8% absolute improvement in compliance, interquartile range (IQR): 3.5% to 14.6%; moderate‐certainty evidence).
Results for the secondary comparisons also suggested that OLs probably improve compliance with evidence‐based practice (moderate‐certainty evidence): i) OLs alone versus no intervention: RD (IQR): 9.15% (‐0.3% to 15%); ii) OLs alone versus a single intervention: RD (range): 13.8% (12% to 15.5%); iii) OLs, with a single or more intervention(s) versus the same single or more intervention(s): RD (IQR): 7.1% (‐1.4% to 19%); iv) OLs with a single or more intervention(s) versus no intervention: RD (IQR):10.25% (0.6% to 15.75%).
It is uncertain if OLs alone, or in combination with other intervention(s), may lead to improved patient outcomes (3 studies; 5 dichotomous outcomes) since the certainty of evidence was very low. For two of the secondary comparisons, the IQR included the possibility of a small negative effect of the OL intervention. Possible explanations for the occasional negative effects are, for example, the possibility that the OLs may have prioritised some outcomes, at the expense of others, or that an unaccounted outcome difference at baseline, may have given a faulty impression of a negative effect of the intervention at follow‐up. No study reported on costs or cost‐effectiveness.
We were unable to determine the comparative effectiveness of different approaches to identifying OLs, as most studies used the sociometric method. Nor could we determine which methods used by OLs to educate their peers were most effective, as the methods were poorly described in most studies. In addition, we could not determine whether OL teams were more effective than single OLs.
Authors' conclusions
Local opinion leaders alone, or in combination with other interventions, can be effective in promoting evidence‐based practice, but the effectiveness varies both within and between studies.The effect on patient outcomes is uncertain. The costs and the cost‐effectiveness of the intervention(s) is unknown. These results are based on heterogeneous studies differing in types of intervention, setting, and outcomes. In most studies, the role and actions of the OL were not clearly described, and we cannot, therefore, comment on strategies to enhance their effectiveness. It is also not clear whether the methods used to identify OLs are important for their effectiveness, or whether the effect differs if education is delivered by single OLs or by multidisciplinary OL teams. Further research may help us to understand how these factors affect the effectiveness of OLs.
Plain language summary
Are local opinion leaders effective in promoting best practice of healthcare professionals and improving patient outcomes?
Background
In order to improve patient outcomes, it is important to translate evidence‐based research into practice. One way of doing this may be through the use of local opinion leaders (OLs). OLs are people who are seen as likeable, trustworthy and influential, and who through the use of different methods, e.g. community outreach visits and small group teaching, can educate healthcare professionals and persuade them to use the best available evidence.
What is the aim of this review?
The aim of this Cochrane review was to find out whether OLs can persuade healthcare professionals to follow evidence‐based guidelines when treating patients with the goal of improving patient health outcomes. This is an update of a systematic review published in 2011.
Key messages
The use of OLs probably improves the ability of healthcare professionals to follow evidence‐based guidelines, but we do not know if patient outcomes are improved. To optimise the use of OLs, we need to know more details about what they actually do and how they do it.
What was studied in this review?
Cochrane review authors searched for all relevant studies evaluating the effects of OLs and found 24 relevant studies.
The healthcare professionals targeted by the OL intervention were usually physicians. The clinical condition varied across studies, with the most common being cancer.
The main comparison was between any intervention including OLs as compared to no intervention or interventions that did not involve OLs. We also wanted to find out whether the effects of OLs would vary depending on a) the method used by researchers to identify OLs; b) the educational methods used by OLs to encourage practice change; or c) whether a single OL, or a multidisciplinary OL team delivered the intervention.
We examined whether the intervention had an effect on healthcare professional compliance with evidence‐based practice, patient outcomes, and costs.
What are the main results of the review?
We included 24 studies, involving 337 hospitals, 350 primary care practices, 3005 healthcare professionals, and 29,167 patients (not all studies reported this information). Most studies were from North America (N = 20) and all were conducted in high‐income countries. Eighteen of the 24 studies reported the effects of healthcare professional compliance with evidence‐based practice.
The review found that, overall, any intervention involving OLs probably improves healthcare professionals' compliance with evidence‐based practice. The effect, however, varies within and across studies. The certainty of evidence was moderate for all comparisons. Occasional results suggested the possibility of a small negative effect of the OL intervention on some outcomes, which may have been caused by OLs prioritising some outcomes, at the expense of others, or that an unfavourable baseline difference might have given a faulty impression of a negative effect at follow‐up.
We know little about the effectiveness of OLs on patient outcomes, since few studies reported patient outcomes and the certainty of this evidence was very low. No study reported on costs. We could not determine whether different methods used to identify OLs had an impact on their effectiveness, as the same method was used in most studies. We were unable to determine which types of educational strategies used by OLs to implement best practice were most effective, as in many studies there was very little description. Lastly, we could not tell whether OL teams were more effective than single OLs because there were no comparisons.
How up‐to‐date is this review?
The review authors searched for studies that had been published up to July 2018.
Summary of findings
Background
Description of the condition
The translation of evidence into clinical practice is often slow, unpredictable and incomplete (Grimshaw 2012, Grol 1999; Morris 2011). Studies have estimated that between 30% to 40% of patients do not receive treatment that accords with research evidence. Further, 20% of patients receive treatments that have been proven to be detrimental (Grol 2001; Schuster 1998).There is significant interest in devising innovative methods to promote knowledge transfer of evidence into practice and ultimately improve patient healthcare (Curtis 2016; Grimshaw 2012; Grol 1999), including the use of opinion leaders to disseminate evidence‐based practice.
Description of the intervention
Social Learning Theory hypothesises that individuals perceived as 'credible', 'likeable' and 'trustworthy' are likely to be persuasive agents of behavioural change. Such 'opinion leaders' may play a key role in assisting individuals to identify the evidence underpinning best practice and to facilitate behaviour change (Rogers 1976). Opinion leadership (more properly termed 'Informal Opinion Leadership') is the degree to which an individual is able to influence other individuals' attitudes or overt behaviour informally, in a desired way with relative frequency (Rogers 1995). This informal leadership is not a function of the individual's formal position or status in the system; it is earned and maintained by the individual's technical competence, social accessibility, and conformity to the system's norms. When compared to their peers, opinion leaders (hereafter OLs) tend to be more exposed to all forms of external communication, have somewhat higher social status, and to be more innovative. However, the most striking feature of OLs is their unique and influential position in their system's communication structure; they are at the centre of interpersonal communication networks – interconnected individuals who are linked by patterned flows of information. Their use has been explored in different clinical disciplines such as surgery, obstetrics, paediatrics, neurology, general medicine, nursing and infection control (Albrecht 2016; Gifford 1999; Rogers 1995; Ryan 2002). OLs are a specific type of 'change agent'. The underlying theory about why OLs work is that they socially influence other professionals and that their influence is a function of the respect of their peers (Mittman 1992). As a result, it is important that the method of identification respects this mechanism of action. OLs should not be confused with 'champions'. Champions are appointed by management. It is unclear whether they function as OLs and whether they function through social influence or managerial status/process. Hence, they are a different type of 'change agent', and a different type of intervention.
How the intervention might work
Theoretically, OLs use a range of interpersonal skills in order to achieve desired behavioural change. However, there is considerable variation in the types of educational initiatives OLs use to implement best practice. Informal one‐to‐one teaching, community outreach education visits, small group teaching, academic detailing, and preceptorships are examples of strategies used by OLs for disseminating and implementing evidence‐based practice (Rogers 1995; Ryan 2002;). Whilst OLs have also used formal strategies, such as delivering didactic lectures, education delivered informally is regarded as a key ingredient in marketing and innovation diffusion (Rogers 1976). However, it is unclear whether education delivered by OLs in an informal way is more persuasive compared with formal strategies. Formalising the educational process may produce more diverse results than those in which the role of OLs is allowed to be self‐directed (Rogers 1995; Ryan 2002). It has been suggested that OLs may be less influential when their role is formalised through mail‐outs, workshops or teaching rounds (Ryan 2002). Research also suggests that the setting of an opinion leader intervention may be important for its success, that is, that opinion leader interventions in secondary care may be more effective than in primary care, due to more complex social networks in the former (Grimshaw 2006a). It has also been proposed that different OLs may be needed for different clinical issues (Grimshaw 2006a). Finally, if there is a feasibility issue with using OLs, due to their temporal instability, there may be a need for successive identification processes (Doumit 2006).
Another issue is whether the process by which OLs are selected affects the success or otherwise of their educational initiatives. Theory‐based methods used to identify OLs can be broadly classified into four categories: the observation method, the self‐designating method, the informant method, and the sociometric method (Rogers 1995) though this list of methods has recently been expanded (Valente 2007).The observation method employs an independent observer to identify OLs amongst a group of professionals interacting with one another in a work context. The self‐designating method requires that members of a professional network report their own perceptions of their role as an opinion leader. The informant method relies on asking individuals to identify those individuals who act as principal sources of influence. Via a standardised, self‐reported questionnaire, the sociometric method asks members of a social network to judge individuals according to the extent to which they are educationally influential, knowledgeable and humanistic. Methods used to select OLs have not been consistent across studies. Moreover, different methods result in different individuals being identified as OLs (Grimshaw 2006a). The question of whether any one method is more likely to identify OLs that are more effective in promoting knowledge transfer remains open to empirical assessment. We have expanded this review to also include studies that have used other methods than the four previously defined to identify OLs (Valente 2007). The methods, which show some overlap with those described above, include: i) the use of celebrities; ii) self‐selection, that is, individuals, who are not necessarily seen as educationally influential, are selected via word‐of‐mouth, printed material, or other forms of media, and essentially volunteer as an opinion leader; iii) self‐identification, by which individuals respond to a survey measuring their perceptions of their own opinion leadership and who select those as OLs who score the highest on the scale and/or who perceive themselves as influential; iv) staff selection, that is, project staff select OLs based on community observations; v) positional approach, that is, selection of OLs are based on their occupational or organisational roles; vi) judges’ ratings method, which uses key informants to identify potential OLs; and vii) expert Identification method, which uses trained scientists who act as participant observers to identify potential OLs. The latter two methods rely on knowledgeable individuals within a community to identify leaders rather than project staff, and are both similar to the informant method described above. Three methods use social network analysis methods to identify OLs: viii) snowball method, ix) sample sociometric method, and x) sociometric method. The snowball method is an iterative process, which starts with a randomly selected sample who are asked to nominate OLs in the community. Individuals nominated in the first round can be interviewed in the second round, and so forth, and this process is repeated until a sufficient number of OLs are identified. The sample sociometric method starts with a representative sample who are asked to nominate OLs, while the sociometric method involves interviewing all (or almost all) community members whereafter a social network is constructed from the nominations. These three methods select OLs based on a predetermined threshold of nominations. The comparable effectiveness of all these methods is unknown.
Why it is important to do this review
In order to improve patient outcomes and decrease inappropriate or potentially harmful patient treatments, it is important to speed up and optimise the process of translating evidence‐based research into practice. One way of doing this may be through the use of local OLs. Several aspects of OL interventions need further investigation to be able to advise on their best use. We report an update of the previous Cochrane review to determine the effectiveness of the use of OLs targeted at changing the behaviours of professionals and improving the healthcare outcomes of their patients. This is the third update of the Cochrane review (Thomson 1999). Our update uses revised methods to systematically assess the overall risk of bias of included studies and to grade the certainty of evidence; it extends the previously published review (Flodgren 2011) by including studies independently of methods used to identify OLs (i.e. not only the four previously described methods). We did this, since is not known which method is most effective in identifying OLs, and also to provide decision‐ and policy‐makers with a fuller picture of the effectiveness of OLs.
Objectives
To assess the effectiveness of local OLs in improving healthcare professionals' compliance with evidence‐based practice and patient outcomes.
We sought to answer the following questions:
What is the effectiveness of OLs alone compared to no intervention?
What is the effectiveness of OLs alone compared to a single intervention?
What is the effectiveness of OLs plus a single or more intervention(s) compared to the same single or more intervention(s)?
What is the effectiveness of OLs plus a single or more intervention(s) compared to no intervention?
Does the effectiveness of OLs vary according to the method used by researchers to identify OLs?
Does the effectiveness of OLs vary according to the educational methods used by OLs to encourage knowledge translation? We intended to compare informal education (e.g. one‐to‐one teaching) versus formal education (e.g. community outreach education, small group teaching, academic detailing, and preceptorships).
Does the effectiveness of a OLs vary according to whether a single opinion leader or a multidisciplinary opinion leader team deliver the intervention?
Methods
Criteria for considering studies for this review
Types of studies
We considered randomised trials only (including cluster‐randomised trials) only, since they provide the best available evidence of effect.
Types of participants
Healthcare professionals in charge of patient care. We excluded studies involving undergraduate students.
Types of interventions
Any intervention evaluating the effectiveness of OLs, either alone or in combination with other interventions, for improving the behaviour of healthcare professionals, i.e. compliance with evidence‐based practice (evidence‐based guidelines or recommendations) and patient outcomes. OLs could have been identified by either the four previously defined methods: sociometric method, informant method, self designating method, observation method, or by other methods (e.g. judge's rating, snowball method) (Valente 2007).
Types of outcome measures
Objective dichotomous measures of professional performance (i.e. compliance with evidence‐based practice), for example, the percentage of patients being prescribed a specific drug (receiving a target process of care), documentation of performance of a specific task, such as weight counselling, or proportion of patients whose care is in compliance with an overall guideline) or patient outcomes. We included cost data, if available. We excluded studies that measured knowledge or performance in a test situation only. We did not address equity issues in this review.
Search methods for identification of studies
Electronic searches
We searched the following electronic databases for primary studies on 3 July 2018:
Cochrane Central Register of Controlled Trials (CENTRAL; 2018, Issue 6) in The Cochrane Library;
MEDLINE, Ovid (including Epub Ahead of Print, In‐Process & Other Non‐Indexed Citations and Versions);
Embase, Ovid;
ProQuest Dissertations & Theses: Global, UK & Ireland;
Science Citation Index Expanded (SCI‐Expanded);
Social Sciences Citation Index (SSCI);
Conference Proceedings Citation Index‐ Science (CPCI‐S).
Search strategies were comprised of keywords and controlled vocabulary terms. We applied no language limits. We searched all databases from the date of the last search in the previous version of the review (Flodgren 2011). One review author (GF) also searched the reference lists of included studies.
All strategies used are provided in Appendix 1.
Searching other resources
Trial Registries
We searched the following trials registers on 3 July 2018:
International Clinical Trials Registry Platform (ICTRP), Word Health Organization (WHO) www.who.int/ictrp/en/;
ClinicalTrials.gov, US National Institutes of Health (NIH) clinicaltrials.gov/.
Grey Literature
We also searched the following databases for grey literature not indexed in the databases listed above:
Index to Theses (http://www.theses.com/) (2005, July 2018);
WorldCat Dissertations, OCLC (2005, July 2018);
HMIC, Ovid (2005, July 2018).
We also conducted a cited reference search for citations of any previous version of the review using Science Citation Index (searched 3 July 2018).
Data collection and analysis
Selection of studies
See Figure 1. Two review authors (GF, EP or MAOB) independently screened all titles and abstracts applying the inclusion criteria. We retrieved the full text of all potentially relevant studies. Where there was any doubt about a study's eligibility, a third review author assessed its eligibility. We resolved disagreements by consensus. Studies that were excluded after scrutiny are documented in the Characteristics of excluded studies table.
1.
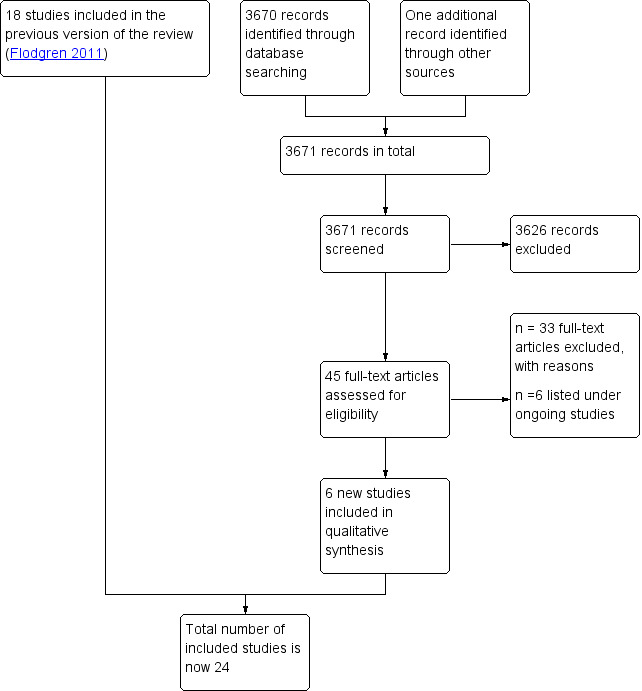
Study flow diagram
Data extraction and management
Two review authors (GF, EP, or MAOB) independently extracted data from each included study, and results for the longest follow‐up, into a modified data extraction form (EPOC 2017). We reconciled data and resolved any disagreements by consensus.
Assessment of risk of bias in included studies
Two review authors (GF, EP, or MAOB) independently assessed the risk of bias of each included study in accordance with the Cochrane Handbook for Systematic Reviews of Interventions (Higgins 2011), and three additional criteria specified by EPOC (EPOC 2016).
The criteria included:
Random sequence generation;
Allocation concealment;
Similarity of baseline outcome measurements;
Similarity of baseline characteristics (for providers and patients);
Blinding;
Incomplete outcome data;
Protection against contamination;
Selective outcome reporting;
Other risks of bias.
Studies that used cluster randomisation were scored as adequate for the protection against contamination and on concealment of allocation (if the randomisation sequence generation was adequate). We assessed the overall risk of bias (high, moderate or low) of each included study using the approach suggested in Chapter 8 of the Cochrane Handbook (Higgins 2011). Studies achieved an overall 'low' risk of bias score if all key domains were judged as 'adequate' or when it seemed unlikely that bias would seriously alter the results. A score of overall moderate risk of bias was given to studies that scored unclear on at least one domain or when judged to have some bias that possibly could raise doubts about the conclusions. Studies that scored high risk in at least one domain or were judged to have serious concerns that questioned the certainty of the conclusions were assigned as having an overall high risk of bias. We updated studies included in the previous review using this approach. We resolved disagreements by consensus. No studies were excluded because of poor methodological quality. We compared results between studies considered as having 'low risk' of bias with studies judged to be at either 'moderate' or 'high' risk of bias.
Measures of treatment effect
We calculated the adjusted risk differences (RD) for dichotomous compliance outcomes, and expressed all outcomes as compliance with evidence‐based practice, that is, improved compliance was always represented by higher proportions, even if a reduction in behaviour was desired (for example, if the targeted clinical behaviour was to reduce the number of episiotomies, this was expressed as the number of women not receiving an episiotomy and for which an increase was desired). An adjusted risk difference is the difference between intervention and control group means of compliance after ('post') the intervention minus the difference between groups before ('pre') the intervention which may be expressed as:
Adjusted risk difference (RD) = (risk of compliance (intervention ‐ control) post‐intervention) ‐ (risk of compliance (intervention ‐ control) pre‐intervention)
A positive adjusted RD indicates that compliance improved more in the opinion leader intervention group that in the control group. Therefore, a positive adjusted RD (e.g. of + 0.12) indicates an absolute improvement in compliance with evidence‐based practice (of 12%) whilst a negative adjusted RD represents decreased compliance.
For continuous outcomes, we reported means and standard deviations in additional tables and in the text, but these data were not included in the primary analyses. When necessary, results were approximated from graphical representations of results.
Unit of analysis issues
Cluster‐randomised trials
We assessed whether analyses of studies using cluster randomisation had taken into account the design effect, as not taking into account the effect of clustering risk inflates the type 1 error‐rate and results in artificially narrow confidence intervals. For cluster‐randomised trials not accounting for the design effect, we did not report P values or confidence intervals . We did not adjust the results as with no meta‐analysis, this was not needed. We noted in text and tables which studies had a unit of analysis error.
Studies with more than two arms
If more than one comparison from multi‐arm studies (i.e. studies with more than two arms) were eligible for the same comparison, we did as follows: for dichotomous compliance outcomes, we divided the number of events and participants as equally as possible between the shared arms. We did not provide a summary estimate of the effect for the continuous outcomes, but reported the results from each study separately. We did not divide the number of participants between shared arms, as suggested in Chapter 16 of the Cochrane Handbook for Systematic Reviews of Interventions (Higgins 2011b).
Dealing with missing data
We contacted authors if primary outcomes data were missing or reported in a way that prevented them being included in the median adjusted RD calculations. We did not impute data.
Assessment of heterogeneity
We made no statistical assessment of heterogeneity as meta‐analyses were not feasible.
Assessment of reporting biases
We did not attempt to assess reporting biases through examinations of funnel plots as no meta‐analyses were conducted.
Data synthesis
As expected, meta‐analysis was not feasible, since the included studies were too heterogenous in terms of populations (patients and healthcare professionals), settings, targeted clinical behaviours, and characteristics of the interventions. We chose to report the improvement in compliance with evidence‐based practice using the median adjusted risk difference (ARD), with interquartile range (IQR). This method was developed by Grimshaw 2004, and has since been used in a number of systematic reviews (for example, Ivers 2012; Shojania 2009). It should be noted that this method uses the 'median' in two different ways. If a single primary outcome measure was specified by the authors, we calculated the adjusted RD for that outcome measure only. However, If more than one primary outcome was reported in a study, or if a primary outcome measure was not specified among a number of outcomes reported by the authors, we calculated an adjusted RD for each outcome measure reported, and extracted the median value across outcomes for each study. In the result tables, we tabulated the median adjusted RD for studies that reported an odd number of primary outcomes. For studies that reported an even number of outcomes, we averaged the risk difference for the two middlemost to produce the median study adjusted RD. We then extracted the single median value from each study and calculated the median (and IQR) across studies for the compliance outcomes and for each comparison. For outcomes that lacked baseline outcome measures, we calculated the unadjusted risk difference. For dichotomous patient outcomes, we calculated the adjusted RD. For continuous patient outcomes, we reported the adjusted mean difference in the text. When there was additional outcome information that could not be incorporated into the median adjusted RD calculations, we noted this in the text, and stated if the additional result data supported or contradicted the information from the median ARD calculations.
Summary of findings
Two review authors (GMF, EP or MAOB) independently assessed the certainty of the evidence (high, moderate, low, and very low) using the five GRADE considerations (study limitations/risk of bias, consistency of effect, imprecision, indirectness and publication bias; Guyatt 2008), for the following outcomes in order to draw conclusions about the certainty of the evidence within the text of the review: compliance with evidence‐based practice, patient outcomes, and costs. We used methods and recommendations described in Section 8.5 and Chapter 12 of the Cochrane Handbook for Systematic Reviews of Interventions (Higgins 2011) and the EPOC worksheets (EPOC 2016). We resolved disagreements on certainty of ratings by discussion. We provided justification for decisions to down‐ or up‐grade the ratings using footnotes in the table and made comments to aid readers' understanding of the review, where necessary.
Subgroup analysis and investigation of heterogeneity
We did not conduct subgroup analysis.
Sensitivity analysis
We performed sensitivity analyses by excluding studies with a high or moderate overall risk of bias. We also investigated whether excluding studies with unadjusted outcomes (with no baseline measure of outcomes) would change the results, as it has been suggested by others that cluster‐randomised trials may suffer from large baseline differences (Ivers 2012). None of these analyses showed any differences in the median effect between groups.
Results
Description of studies
Results of the search
See Figure 1. We screened 3671 citations, and retrieved and reviewed 45 possibly eligible studies in full text. We listed six studies under ongoing studies (Alsweiler 2017; Bosch 2014; ISRCTN50041378; Johnson 2006; McKenzie 2013; Tello‐Bernabe 2011). We found six new studies which met our inclusion criteria (Johnston 2007; O'Connor 2009; Rebbeck 2006; Rycroft‐Malone 2012; Schectman 2003; Simunovic 2010). We had previously excluded four of these studies but now judged them to be eligible, due to our expanded inclusion criteria (Johnston 2007; O'Connor 2009; Rebbeck 2006; Schectman 2003). We included 24 randomised studies in the review.
Included studies
For details see the Characteristics of included studies table.
Study design and setting
All included studies were randomised trials, of which a majority were cluster‐randomised trials.
Twelve of the 24 studies were based in the United States, eight in Canada, one in Australia, the UK, and Hong Kong respectively, and one in Argentina and Uruguay. No studies were from low‐ or middle income countries. The setting of the interventions were as follows: hospitals (17 studies), primary care practices (3 studies; McAlister 2009; O'Connor 2009; Schectman 2003), and physiotherapy clinics (one study; Rebbeck 2006). One study involved both primary and secondary care (Elliott 1997). In two studies, the setting was unclear (Cabana 2006; Majumdar 2007).
Sample sizes
The number of hospitals randomised in the included studies ranged from 6 to 37 (median: 17), and the number of communities or regions randomised ranged from 6 to 10. Among the studies that randomised healthcare professionals, the number of these professionals ranged from 52 to 272. One study randomised 252 primary care practices, and one study randomised six wards at one hospital.
Participants
When reported, the total number of healthcare professionals in the included studies was 3005 (median: 103; range 6 to 769). Four studies did not report the number of healthcare professionals. The type of healthcare professionals targeted by the intervention were as follows: physicians (16 studies), nurses (3 studies), physiotherapists (one study), and four studies targeted a combination of healthcare professionals. In all but one study (Rycroft‐Malone 2012), OLs delivered educational initiatives to members of their own healthcare profession.
A total of 29,167 patients (median: 728; range 103 to 6798) were recruited in the included studies. The type of patients varied widely and constituted: mothers with their newborns receiving pre and postnatal care, people with chronic respiratory conditions (asthma, COPD), people with cardiovascular conditions (unstable angina, coronary heart disease, myocardial infarction), people with diabetes, with cancer, with conditions of the bone, joints and surrounding tissue (osteoporosis, rheumatoid arthritis, osteoarthritis), with traumatic or idiopathic musculoskeletal pain (whiplash, acute low‐back pain), and people receiving pre or postoperative care.
Interventions
Methods used to identify OLs
In 14 studies, OLs were identified using the sociometric method in which healthcare professionals were asked to complete a self‐administered questionnaire to identify educationally influential colleagues (Hiss 1978; Rogers 1995). Response rates varied between 30% to 67% (7 studies). Eight studies used methods equivalent to the informant method (Hong 1990; Johnston 2007; Leviton 1999; O'Connor 2009; Rebbeck 2006; Rycroft‐Malone 2012; Schectman 2003; Simunovic 2010). Two studies (Cabana 2006; Sisk 2004) described two methods of identification: in Sisk 2004, the informant method and the sociometric method (Coleman 1966) were used, and in Cabana 2006, the informant and the self‐designating method. We found no studies using other methods of identifying OLs than the four previously predefined methods (Valente 2007). The four previously excluded studies did not explicitly state what methods they had used, however based on their description we classified them as using the informant method.
Targeted behaviours
Targeted behaviours involved the general management of various clinical condition and evidence‐based practices: increased use of prophylactic oxytocin and decreased use of episiotomy in vaginal deliveries (Althabe 2008); decreased use of epidural anaesthesia (Hodnett 1996); increased rates of trial of labour and vaginal birth (Lomas 1991); guideline consistent care of people with unstable angina (Berner 2003); improved care of people with asthma (Cabana 2006); improved cancer pain management (Elliott 1997); discussing treatment options for early breast cancer (Guadagnoli 2000); improved urinary catheter care (Hong 1990); improved paediatric pain management (Johnston 2007); provision of antenatal corticosteroids for foetal maturation (Leviton 1999); statin management in coronary heart disease (McAlister 2009); appropriate medication for heart failure and Ischaemic heart disease (Majumdar 2007); improved osteoporosis care (Majumdar 2008); improved diabetes safety and care (O'Connor 2009); guideline‐consistent care of people with whiplash (Rebbeck 2006); improving perioperative fluid‐fast times (Rycroft‐Malone 2012); appropriate care of people with acute low‐back pain (Schectman 2003); improved rectal cancer surgical treatment (Simunovic 2010); increased breastfeeding rate (Sisk 2004); improved care of people post‐myocardial infarction (Soumerai 1998); improved care for people with rheumatoid arthritis (Stross 1980); improved care for people with chronic obstructive pulmonary disease (Stross 1983); improved care for people with osteoarthritis (Stross 1985); improved colon cancer staging (Wright 2008).
Characteristics of the interventions
OLs was the only intervention in five studies (Hong 1990; Lomas 1991; Stross 1980; Stross 1983; Stross 1985). In 19 studies, OLs were supplemented by other interventions such as audit and feedback, chart reminders, faxed evidence summaries, educational materials, seminars, learning cases, web resources, one‐to‐one coaching, workshops and lectures. The median duration of the Interventions was seven months (range: one week (Cabana 2006) to 18 months (Althabe 2008)). The median duration of follow‐up was 12 months (range 2 to 30 months).
The OLs in the included studies used both formal (e.g. educational meetings, group tutorials, conferences, grand rounds) and informal methods of educating their peers (e.g. one‐to‐one teaching), which typically took place face‐to‐face. In four of the included studies, there was no face‐to‐face interaction; instead OL‐endorsed evidence summaries were faxed to the patients clinician (Majumdar 2007; Majumdar 2008; McAlister 2009), or the interaction was web‐based (Rycroft‐Malone 2012). In one study, the role of the OL was described as 'being a support person' which required encouragement of their peers to take part in demonstrations. In many cases, however, the methods used by the OLs were not clear. The frequency with which OLs engaged with the target professionals was clearly described in six studies (Cabana 2006; Johnston 2007; O'Connor 2009; Rebbeck 2006; Schectman 2003; Sisk 2004), and two more attempted a description (Hodnett 1996; Lomas 1991), while no description was provided in the remaining 16 studies.
In eight studies, teams of OLs were used (Althabe 2008; Cabana 2006; Elliott 1997; Hong 1990; Leviton 1999; Majumdar 2007; Majumdar 2008; Stross 1980), of which four were multidisciplinary (Althabe 2008; Cabana 2006; Leviton 1999; Majumdar 2007), and in one study identification of more than one OL was permitted (Rycroft‐Malone 2012) .
Comparisons
The comparisons were as follows: OLs alone versus no intervention (5 studies); OLs alone versus a single intervention (2 studies); OLs with a single or more other intervention(s) versus the same single or more intervention(s) (5 studies); and OLs with a single or more intervention(s) versus no intervention (10 studies).
Outcomes
The type of compliance outcomes varied greatly across studies, as did the type of patient outcomes. Eighteen of the 24 included studies reported compliance outcomes: 10 studies reported outcomes involving prescribing practices; five studies reported outcomes related to test ordering; documentation and referrals; and 12 studies reported on compliance with a number of miscellaneous evidence‐based practices. Three studies reported five dichotomous patient outcomes, and five studies reported eight continuous patient outcomes. None of the included studies reported on costs or cost‐effectiveness.
Nine of 24 studies reported having conducted a sample size calculation (Althabe 2008; Majumdar 2007; Majumdar 2008; McAlister 2009; O'Connor 2009; Rycroft‐Malone 2012; Schectman 2003; Simunovic 2010; Wright 2008).
Excluded studies
See Characteristics of excluded studies
We excluded 69 studies with reasons, such as ineligible intervention (e.g. not OLs) (17 studies), ineligible study design (not randomised: 11 studies), or ineligible (nonobjective) outcomes (three studies).
Risk of bias in included studies
See Figure 2, Figure 3 and the risk of bias tables within the Characteristics of included studies table.
2.
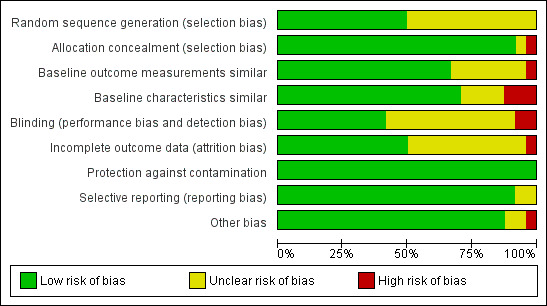
Methodological quality graph: review authors' judgements about each methodological quality item presented as percentages across all included studies.
3.
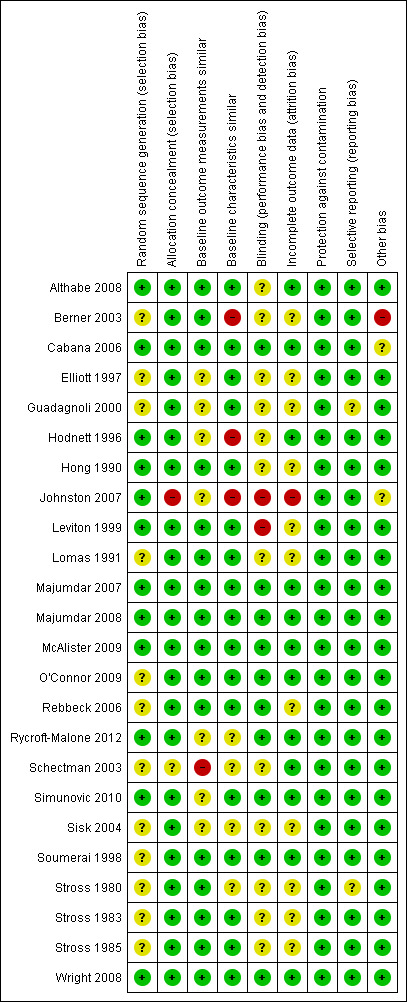
Methodological quality summary: review authors' judgements about each methodological quality item for each included study.
Nine studies (38%) were judged to have an overall high risk of bias (Berner 2003; Elliott 1997; Guadagnoli 2000; Johnston 2007; Schectman 2003; Sisk 2004; Stross 1980; Stross 1983; Stross 1985), four (17%) to be at overall moderate risk of bias (Hodnett 1996; Leviton 1999; Lomas 1991; Rebbeck 2006) and eleven studies (46%) were assigned an overall low risk of bias (Althabe 2008; Cabana 2006; Hong 1990; Majumdar 2007; Majumdar 2008; McAlister 2009; O'Connor 2009; Rycroft‐Malone 2012; Simunovic 2010; Soumerai 1998; Wright 2008).
Random sequence generation
Twelve studies reported adequate sequence generation in the randomisation process (Althabe 2008; Cabana 2006; Hodnett 1996; Hong 1990; Johnston 2007; Leviton 1999; Majumdar 2008; Majumdar 2008; McAlister 2009; Rycroft‐Malone 2012; Simunovic 2010; Wright 2008). The sequence generation was unclear in the remaining 12 studies (Berner 2003; Elliott 1997; Guadagnoli 2000; Lomas 1991; Majumdar 2007; O'Connor 2009; Rebbeck 2006; Sisk 2004; Soumerai 1998; Stross 1980; Stross 1983; Stross 1985).
Similarity of baseline outcome measures
Fifteen of the included studies had similar baseline outcome measures (Althabe 2008; Berner 2003; Cabana 2006; Hong 1990; Leviton 1999; Lomas 1991; Majumdar 2007; Majumdar 2008; McAlister 2009; O'Connor 2009; Rebbeck 2006; Soumerai 1998; Stross 1980; Stross 1983; Stross 1985). In one study (Wright 2008), baseline differences were adjusted for in the analysis. In seven studies, it was not clear if the baseline outcomes were similar (Elliott 1997; Guadagnoli 2000; Hodnett 1996; Johnston 2007; Rycroft‐Malone 2012; Simunovic 2010; Sisk 2004). One study was at high risk due to differences in baseline outcome measures (Schectman 2003) .
In one study (Berner 2003), less than half of eligible hospitals agreed to participate, creating a potential risk of self‐selection bias as the hospitals that declined to participate were different from the others. In two studies (Cabana 2006,Johnston 2007), a low proportion of eligible providers agreed to participate: 8% and 30% respectively, and it was unclear if those who agreed to participate were different from those who declined. This may affect the generalisability of the results.
Similarity of baseline characteristics
The baseline characteristics were similar in 15 of the included studies (Althabe 2008; Cabana 2006; Elliott 1997; Guadagnoli 2000; Hong 1990; Leviton 1999; Lomas 1991; Majumdar 2007; McAlister 2009; O'Connor 2009; Rebbeck 2006; Soumerai 1998; Stross 1983; Stross 1985; Wright 2008). In three studies (Berner 2003; Hodnett 1996; Johnston 2007), the baseline characteristics were significantly different between intervention and control group. In one of the studies (Johnston 2007), the number of nurses who agreed to participate differed between sites (range 17% to 68%). In one study (Majumdar 2008), baseline differences were adjusted for in the analysis. In four studies (Rycroft‐Malone 2012; Schectman 2003; Sisk 2004; Stross 1980), the risk of bias was unclear as no baseline characteristics were reported.
Allocation
The concealment of allocation was adequate in all but two studies (Johnston 2007; Schectman 2003). It was unclear in one of the studies (Schectman 2003). In one study, the allocation was not concealed as randomisation was by a coin toss (Johnston 2007).
Blinding
Ten studies were at low risk of bias either because patient, healthcare professionals and outcome assessors were all blinded, or the patient/healthcare professional were blinded and it was stated that the outcomes were objective and/or retrieved from registers (Cabana 2006; Majumdar 2007; Majumdar 2008; McAlister 2009; O'Connor 2009; Rebbeck 2006; Rycroft‐Malone 2012; Simunovic 2010; Soumerai 1998; Wright 2008). In 12 studies, it was not clear whether or not the patients, the healthcare professionals or the outcome assessor were blinded (Althabe 2008; Berner 2003; Elliott 1997; Guadagnoli 2000; Hodnett 1996; Hong 1990; Lomas 1991; Schectman 2003; Sisk 2004; Stross 1980; Stross 1983; Stross 1985). In two studies (Johnston 2007; Leviton 1999), the risk of performance (and detection) bias was high due to non‐blinding.
Incomplete outcome data
Outcome data were either complete or incomplete data adequately addressed in 12 studies (Althabe 2008; Cabana 2006; Hodnett 1996; Majumdar 2007; Majumdar 2008; McAlister 2009; O'Connor 2009; Rycroft‐Malone 2012; Schectman 2003; Simunovic 2010; Soumerai 1998; Wright 2008), but for the remaining studies it was unclear whether the outcome data were complete or adequately addressed, or both. One study (Johnston 2007) suffered from a large variation in attrition rate between sites.
Protection against contamination
All studies were protected against contamination.
Selective reporting
All but two of the included studies were free from selective reporting. In these studies (Guadagnoli 2000; Stross 1980), it was not clear if the reporting of outcomes was selective, as the outcomes of interest were not listed in the methods section.
Other potential sources of bias
In 19 studies, the results were appropriately analysed at the cluster level or by considering the intra‐cluster correlation when the analysis was conducted using data from individual patients. Five studies had unit of analysis errors (Hong 1990; Lomas 1991; Stross 1980; Stross 1983; Stross 1985).
Effects of interventions
See: Table 1; Table 2; Table 3; Table 4; Table 5
for the main comparison.
| Local opinion leaders alone or with one or more other intervention(s) compared with no intervention, a single intervention, or the same single or more intervention(s) | |||
|
Population: Healthcare professionals (e.g. primary care physicians, surgeons, obstetricians, birth attendants, nurses) Setting: Primary and secondary care Countries: USA, Canada, Australia, United Kingdom, Hong Kong, Argentina and Uruguay Intervention: Local OLs alone, or with one or more other intervention(s) Comparison: No intervention, a single intervention, or the same single or more other intervention(s) | |||
| Outcomes |
Compliance outcomes: Adjusted absolute improvement (Risk difference)* Median (Interquartile range) |
No of Studies (no of healthcare professionals/ no of sites) |
Certainty of the evidence (GRADE) |
| Compliance with evidence‐based practice* | 10.8% (3.5% to 14.6%) absolute improvement in compliance |
18 randomised studies (2216 healthcare professionals; 249 hospitals, 284 practices) |
⊕⊕⊕⊖a MODERATE |
| Patient (dichotomous) outcomes (including adverse events) |
It is uncertain whether OLs (alone, or with one or more other interventions), improve patient outcomes (postpartum haemorrhage rate, local cancer reoccurrence, permanent colostomy rate, and breastfeeding rate). |
3 studies (370 health care professionals; 53 hospitals) |
⊕⊖⊖⊖b,c VERY LOW |
| Costs | Not reported | Not reported | Not reported |
| *The post‐intervention risk differences were adjusted for pre‐intervention differences between the comparison groups, where pre values were available. Five out of six (unadjusted) studies, that did not report a baseline measure of outcome, stated that there were no baseline differences across groups. aWe downgraded the certainty of evidence one step due to high risk of bias (a majority of studies had high or moderate risk of bias), bWe downgraded the certainty of evidence two steps due to indirectness (all three studies compared a multifaceted OL intervention with no intervention, which makes it difficult to separate out the effect of the OLs per se. Also one study evaluated surrogate outcomes i.e. breastfeeding rate instead of infant health outcomes). cWe downgraded the certainty of evidence one step due to imprecision (fewer than 400 participating healthcare professionals, the effect varying across studies from a beneficial effect in one, to little or no effect in the other two, and, in addition, the types of outcomes that were assessed varied across studies). | |||
| GRADE Working Group grades of evidence High certainty: Further research is very unlikely to change our confidence in the estimate of effect. Moderate certainty: Further research is likely to have an important impact on our confidence in the estimate of effect and may change the estimate. Low certainty: Further research is very likely to have an important impact on our confidence in the estimate of effect and is likely to change the estimate. Very low certainty: We are very uncertain about the estimate. | |||
*Eighteen of the 24 included studies (21 comparisons; 71 outcomes) contributed to the calculation of the median adjusted risk difference (RD) for the main comparison.
The remaining six studies did not provide data that could be included in the adjusted RD calculations. Three of the 24 included studies reported in total 5 dichotomous patient outcomes.
Summary of findings 2. Summary of findings for secondary comparison 1.
| Local opinion leaders alone compared with no intervention | |||
|
Patient or population: Healthcare professionals (nurses, primary care physicians) Setting: Primary and secondary care Country: USA and Canada Intervention: Local OLs Comparison: No intervention | |||
| Outcomes |
Adjusted absolute improvement (Risk difference)* Median (Interquartile range) |
No of Studies (no of healthcare professionals/ no of sites) |
Certainty of the evidence (GRADE) |
| Compliance with evidence‐based practice* | 9.15% (‐0.3% to 15%) absolute improvement in compliance |
5 randomised studies (769 primary care physicians, 28 groups/clusters of physicians, 20 groups of nurses, 48 hospitals and one large health system) |
⊕⊕⊕⊖a MODERATE |
| Patient (dichotomous) outcomes (including adverse events) |
Not reported | Not reported | ‐ |
| Costs | Not reported | Not reported | ‐ |
| *The post‐intervention risk differences were adjusted for pre‐intervention differences between the comparison groups, where pre values were available. aWe downgraded the certainty of evidence one step due to high risk of bias (three studies were at high risk of bias and one at moderate risk). | |||
| GRADE Working Group grades of evidence High certainty: Further research is very unlikely to change our confidence in the estimate of effect. Moderate certainty: Further research is likely to have an important impact on our confidence in the estimate of effect and may change the estimate. Low certainty: Further research is very likely to have an important impact on our confidence in the estimate of effect and is likely to change the estimate. Very low certainty: We are very uncertain about the estimate. | |||
*Five of the 24 included studies (5 comparisons; 37 dichotomous outcomes) contributed to the calculation of the median adjusted risk difference (RD).
Summary of findings 3. Summary of findings for secondary comparison 2.
| Local opinion leaders alone compared with a single intervention | |||
|
Patient or population: Healthcare professionals (nurses, physicians including obstetricians) Setting: Secondary care Country: Hong Kong and Canada Intervention: Local OLs Comparison: A single other intervention | |||
| Outcomes |
Adjusted absolute improvement (Risk difference)* Median (interquartile range) |
No of Studies (no of healthcare professionals/ no of sites) |
Certainty of the evidence (GRADE) |
| Compliance with evidence‐based practice* | 13.8% (12% to 15.5%) absolute improvement in compliance |
2 randomised studies (147 nurses, 76 physicians, 16 hospitals, and 6 wards at one hospital) |
⊕⊕⊕⊖a MODERATE |
| Patient (dichotomous) outcomes (including adverse events) |
Not reported | Not reported | ‐ |
| Costs | Not reported | Not reported | ‐ |
| *The post‐intervention risk differences were adjusted for pre‐intervention differences between the comparison groups, where pre values were available. aWe downgraded the certainty of evidence one step due to imprecision (fewer than 400 healthcare professionals received the intervention). | |||
| GRADE Working Group grades of evidence High certainty: Further research is very unlikely to change our confidence in the estimate of effect. Moderate certainty: Further research is likely to have an important impact on our confidence in the estimate of effect and may change the estimate. Low certainty: Further research is very likely to have an important impact on our confidence in the estimate of effect and is likely to change the estimate. Very low certainty: We are very uncertain about the estimate. | |||
*Two of the 24 included studies (2 comparisons; 3 dichotomous outcomes) contributed to the calculation of the median RD.
Summary of findings 4. Summary of findings for secondary comparison 3.
| Local opinion leaders with a single or more other intervention(s) compared with the same single or more intervention(s) | |||
|
Patient or population: Healthcare professionals (nurses, physicians including surgeons) Setting: Primary and secondary care Contry: USA, Canada and Hong Kong Intervention: Local OLs with one or more other intervention(s) Comparison: The same one or more other intervention(s) | |||
| Outcomes |
Adjusted absolute improvement (Risk difference)* Median (Interquartile range) |
No of Studies (no of healthcare professionals/no of sites) |
Certainty of the evidence (GRADE) |
| Compliance with evidence‐based practice* | 7.1% (‐1.4% to 19%) absolute improvement in compliance |
5 randomised studies (618 physicians/surgeons, 220 nurses, 66 hospitals, 18 primary care clinics in one health system) |
⊕⊕⊕⊖a MODERATE |
| Patient (dichotomous) outcomes | Intervention may lead to little or no difference in HbA1c and LDL levels. |
1 randomised study (38 physicians; 18 clinics ‐ medical groups) |
⊕⊕⊖⊖b,c LOW |
| Costs | Not reported | Not reported | ‐ |
| *The post‐intervention risk differences were adjusted for pre‐intervention differences between the comparison groups, where pre values were available. aWe downgraded the certainty of evidence one step due to high risk of bias (two of five studies had high risk of bias). bWe downgraded the certainty of evidence one step due to imprecision (fewer than 400 healthcare professionals receiving the intervention). cWe downgraded the certainty of evidence one step due to indirectness (surrogate outcomes, i.e. HbA1c and LDL levels instead of patient‐important outcomes like diabetes symptoms or QOL). | |||
| GRADE Working Group grades of evidence High certainty: Further research is very unlikely to change our confidence in the estimate of effect. Moderate certainty: Further research is likely to have an important impact on our confidence in the estimate of effect and may change the estimate. Low certainty: Further research is very likely to have an important impact on our confidence in the estimate of effect and is likely to change the estimate. Very low certainty: We are very uncertain about the estimate. | |||
*Five of the 24 included studies (five comparisons; 12 dichotomous outcomes) contributed to the calculation of the median adjusted risk difference (RD).
Summary of findings 5. Summary of findings for secondary comparison 4.
| Local opinion leaders plus a single or more intervention(s) compared with no intervention | |||
|
Patient or population: Healthcare professionals Setting: Primary and secondary care Country: Canada, USA, Argentina and Uruguay Intervention: Local OLs plus a single or more intervention(s) Comparison: No intervention | |||
| Outcomes |
Adjusted absolute improvement (Risk difference)* Median (Interquartile range) |
No of Studies (no of sites) |
Certainty of the evidence (GRADE) |
| Compliance with evidence‐based practice* | 10.25% (0.6% to 15.75%) absolute improvement in compliance |
10 randomised trials (136 hospitals; 284 primary care practices; two EDs and two fracture clinics) |
⊕⊕⊕⊖a MODERATE |
| Patient (dichotomous) outcomes | It is uncertain if OLs with a single or more intervention(s), improve patient outcomes (postpartum haemorrhage rate, local cancer reoccurrence, permanent colostomy rate, and breastfeeding rate). |
3 studies (370 healthcare professionals; 53 hospitals) |
⊕⊖⊖⊖b,c VERY LOW |
| Costs | Not reported | Not reported | ‐ |
| *The post‐intervention risk differences were adjusted for pre‐intervention differences between the comparison groups, where pre values were available.
aWe downgraded the certainty of evidence one step due to indirectness (the OL intervention was one of multiple interventions) bWe downgraded the certainty of evidence one step due to imprecision (fewer than 400 participating healthcare professionals, the effect varying across studies from a beneficial effect in one, to little or no effect in the other two, and, in addition, varying types of outcomes were reported). cWe downgraded the certainty of evidence two steps due to indirectness (all three studies compared OLs with one or more intervention(s) with no intervention, which makes it difficult to separate out the effect of the OLs per se. Also, one study evaluated a surrogate outcome i.e. breastfeeding rate instead of infant health outcomes). | |||
| GRADE Working Group grades of evidence High certainty: Further research is very unlikely to change our confidence in the estimate of effect. Moderate certainty: Further research is likely to have an important impact on our confidence in the estimate of effect and may change the estimate. Low certainty: Further research is very likely to have an important impact on our confidence in the estimate of effect and is likely to change the estimate. Very low certainty: We are very uncertain about the estimate. | |||
*Ten of the 24 included studies (10 comparisons; 20 dichotomous outcomes) contributed to the calculation of the median adjusted risk difference (RD). The same three trials as in the main comparison reported five dichotomous patient outcomes.
Comparison 1. Effects of local OLs alone, or plus a single or more intervention(s) versus no intervention, a single intervention, or the same single or more intervention(s)(main comparison)
For a summary of the evidence, see Table 1. For detailed results, see Appendix 3, Appendix 4, Appendix 5, and Appendix 6. For the evidence profiles, see Appendix 7.
i) Compliance with evidence‐based practice
There were 71 usable objective dichotomous outcomes from 18 studies (Althabe 2008,Berner 2003; Guadagnoli 2000; Hodnett 1996; Hong 1990,Johnston 2007; Leviton 1999,Lomas 1991; Majumdar 2007,Majumdar 2008; McAlister 2009; O'Connor 2009; Schectman 2003; Soumerai 1998; Stross 1980; Stross 1983; Stross 1985; Wright 2008). Six studies did not contribute dichotomous outcomes to the median adjusted RD calculation (Cabana 2006,Elliott 1997,Rebbeck 2006; Rycroft‐Malone 2012; Simunovic 2010; Sisk 2004).
The studies involved in total more than 3005 healthcare professionals and 104 groups/clusters of healthcare professionals, 249 hospitals, 284 primary care practices, and more than 29,167 patient participants.
OLs alone, or plus a single or more intervention(s), as compared to no intervention, a single intervention, or the same single or more intervention(s), probably improve healthcare professionals' compliance with evidence‐based practice (median adjusted RD 10.8%, interquartile range (IQR) 3.5% to 14.6% absolute improvement in compliance in the intervention group; moderate‐certainty evidence).
ii) Patient outcomes
Eight studies, all of which evaluated OLs plus a single or more intervention(s), as compared to no intervention, reported 10 comparisons, five dichotomous outcomes and eight continuous patient outcomes.
Dichotomous patient outcomes
Three studies reported five dichotomous patient outcomes. One study reported that using OLs may lead to less postpartum haemorrhage for women receiving obstetric care (relative rate reduction > 500 mL: 45%; 95% confidence interval (CI): 9% to 71%; > 1000 mL: 70%; 95% CI, 16% to 78%; Althabe 2008). One study reported that OLs may lead to little or no difference in local cancer reoccurrence (RD 0.1%) and in permanent colostomy rate (RD ‐1.4%) for people with colon cancer (Simunovic 2010). One study reported similar breastfeeding rates across groups (Sisk 2004). We are however uncertain if OLs alone, or with a single or more intervention(s), may lead to improved patient (dichotomous) outcomes since the certainty of evidence was very low.
Continuous patient outcomes
Five studies reported eight continuous outcomes: one study reported slightly fewer parent‐reported emergency department visits for children with asthma who received care from intervention group physicians (adjusted mean difference (MD): ‐0.25 visits per year; P < 0.05), and similar number of admissions to hospital and urgent office visits (P > 0.05). Six percent of the parent‐reported data were checked against registers for accuracy (Cabana 2006). One study reported similar pain scores for people with cancer in intervention and control groups (adjusted MD: +0.86 scale steps; P = 0.66) (Elliott 1997). One study reported similar glycated haemoglobin (HbA1c) and low‐density lipoprotein (LDL) levels for people with diabetes in the intervention group (adjusted MD: +0.123 units greater increase in HbA1c, P > 0.05; and 0.4 units lower decrease in LDL level, P > 0.05) (O'Connor 2009). One study reported similar functional rating scores for people with whiplash who received care from intervention physicians as for those receiving care from control physicians (MD: ‐0.6 score, 95% CI:‐7.8 to 6.6; P = 0.87) (Rebbeck 2006), and one study reported similar fluid fast time for surgical patients in intervention (OLs + web‐based intervention) and control groups (0.33, 95% CI ‐0.70 to 1.12; P > 0.05) (Rycroft‐Malone 2012). We are uncertain if OLs alone, or with a single or more intervention(s), may improve patient (continuous) outcomes (5 studies; very low‐certainty of evidence).
iii) Costs
We did not find studies that reported on costs or cost‐effectiveness.
Comparison 2. Effects of local OLs alone versus no intervention
See Table 2, and Appendix 3.
i) Compliance with evidence‐based practice
Five studies reported 37 dichotomous outcomes (and one continuous outcome) for this comparison (Hodnett 1996; Majumdar 2007; Stross 1980; Stross 1983; Stross 1985).
The studies involved in total 48 hospitals, one large health system, and more than 884 patient participants. The healthcare professionals targeted by the intervention were nurses (Hodnett 1996) and primary care physicians (Majumdar 2007; Stross 1980; Stross 1983; Stross 1985). The number of participating healthcare professionals was unclear.
Hodnett 1996 reported one primary outcome: rates of epidural anaesthesia for women in labour. Majumdar 2007 assessed two primary outcomes: use of angiotensin‐converting enzyme (ACE) inhibitors or angiotensin receptor blockers (ARBs) for people (N = 55) with heart failure (HF) and statins for people (N = 117) with Ischaemic coronary disease (ICD). Stross 1980 assessed 14 outcomes concerning care of people with rheumatoid arthritis (N = 114). Stross 1983 assessed 14 outcomes for care of people (N = 510) with chronic obstructive pulmonary disease (COPD), and Stross 1985 assessed six outcomes concerning care of people with osteoarthritis (N = 89). The duration of the interventions ranged from six to 18 months.
OLs alone, as compared to no intervention, probably improve healthcare professionals' compliance with evidence‐based practice (median adjusted RD (IQR): 9.15% (‐0.3% to 15% absolute improvement in the intervention group; moderate‐certainty evidence). Two of the five studies (Hodnett 1996,Majumdar 2007) did not report baseline measures of outcome, and the results were therefore not baseline‐adjusted. Majumdar 2007 reported that none of the participants were taking or had previously been taking the study medications (ARBs or ACEs), and there were no baseline differences for any other cardiovascular medication between groups.
ii) Patient outcomes
We did not find studies that reported on (primary) patient outcomes.
iii) Costs
We did not find studies that reported on costs or cost‐effectiveness.
Comparison 3. Effects of Local OLs alone versus a single intervention
See Table 3 and Appendix 4.
i) Compliance with evidence‐based practice
Two studies reported three dichotomous outcomes for this comparison. The comparison interventions were standardised lectures (Hong 1990) and audit and feedback (Lomas 1991).
The studies involved in total 17 hospitals, 148 nurses and 76 physicians, with an unclear number of patients in one study (Hong 1990), while in the other, 3552 patient charts were reviewed (Lomas 1991).
OLs alone, as compared to a single intervention, probably improve healthcare professionals' compliance with evidence‐based practice (median RD (range): 13.75% (12% to 15.5%) absolute improvement in compliance in the intervention group; moderate‐certainty evidence). P values were not reported due to unit of analysis issues. Neither study reported a baseline measure of outcomes, and were therefore not baseline‐adjusted. Authors of both studies stated that the baseline outcome measures did not differ across groups.
ii) Patient outcomes
We did not find studies that reported on (primary) patient outcomes.
iii) Costs
We did not find studies that reported on costs or cost‐effectiveness.
Comparison 4. Effects of local OLs with a single or more intervention(s) versus the same single or more intervention(s)
See Table 4 and Appendix 5.
i) Compliance with evidence‐based practice
Five studies reported 12 dichotomous outcomes for this comparison (and two continuous outcomes). The additional interventions included standardised lectures (Hong 1990), learning cases (O'Connor 2009) and, in three studies, audit and feedback (Berner 2003,Guadagnoli 2000; Soumerai 1998).
The studies involved in total 86 hospitals, 18 primary care clinics, 147 nurses, more than 57 physicians (three studies did not report the number of healthcare professionals), and 11,891 participating patients.
Berner 2003 reported five primary outcomes concerned with compliance with guidelines for unstable angina. O'Connor 2009 reported two primary outcomes concerned with diabetes care. Soumerai 1998 reported three outcomes concerned with care for people post‐acute myocardial infarction. Two of the studies reported only one primary outcome, discussion of breast cancer treatment options (Guadagnoli 2000), and correct urinary catheter practices (Hong 1990). The median duration of follow‐up was 12 months (range 2 to 12 months).
OLs, with one or more additional intervention, as compared to the same one or more additional interventions, probably improve healthcare professionals' compliance with evidence‐based practice (median adjusted RD (IQR) 7.1% (‐1.4% to 19%) absolute improvement in compliance in the intervention group; moderate‐certainty evidence). Two of the five studies were not adjusted for baseline differences (Berner 2003; Hong 1990).
ii) Patient outcomes
OLs with a single or more intervention(s), as compared with the same single or more intervention(s) may lead to little or no difference in the levels of HbA1c (MD: 0.19 units higher; P= 0.04) or LDL (MD: 1.3 units higher levels, P> 0.05) in people with diabetes (low‐certainty evidence) (O'Connor 2009).
iii) Costs
We did not find studies that reported on costs or cost‐effectiveness.
Comparison 5. Effects of Local OLs plus a single or more intervention(s) versus no intervention
See Table 5 and Appendix 6.
i) Compliance with evidence‐based practice
Fifteen studies (Althabe 2008; Berner 2003,Cabana 2006; Elliott 1997; Johnston 2007; Leviton 1999; Lomas 1991; Majumdar 2008; McAlister 2009; O'Connor 2009; Rycroft‐Malone 2012; Schectman 2003; Simunovic 2010; Sisk 2004; Wright 2008) contributed 20 dichotomous outcomes for this comparison. One of the studies reported two dichotomous patient outcomes (Simunovic 2010), and four studies reported continuous patient outcomes (Althabe 2008; Cabana 2006; Elliott 1997; Rycroft‐Malone 2012). One study provided no numerical data (Sisk 2004). Thus, ten studies contributed data to calculations of the median adjusted RD.
The studies involved in total 176 hospitals; 284 primary care practices; two emergency departments, two fracture clinics, more than 1895 healthcare professionals, and more than 19,914 patients.
Five of the studies assessed one primary outcome: antenatal corticosteroids for foetal maturation (Leviton 1999), bisphosphonate treatment for people with osteoporosis (Majumdar 2008), statin management for people with CHD (McAlister 2009), patient care compliant with low back guidelines (Schectman 2003), and lymph node assessment in stage II colon cancer (Wright 2008). Four studies reported two primary outcomes each: use of prophylactic oxytocin and use of episiotomy during third stage of labour (Althabe 2008), HbA1C and LDL test rate (O'Connor 2009), offer of trial of labour and vaginal birth (Lomas 1991), and permanent colostomy rate and local cancer reoccurrence (Simunovic 2010). One study reported three outcomes related to pain management (Johnston 2007), and one study contributed five primary outcomes related to unstable angina care to the analysis (Berner 2003). Three studies did not report any baseline measure of outcome, and were therefore not baseline‐adjusted (Lomas 1991; Majumdar 2008; McAlister 2009). In one of those studies none of the participants received bisphosphonate treatment at baseline according to the authors (Majumdar 2008), and, in one study, the authors stated that the proportion of participants who received statins (and standardised statin dose) at baseline were similar across groups (McAlister 2009). The duration of follow‐up was a median of 12 months (range 6 to 24 months).
OLs, plus a single or more intervention(s), as compared to no intervention, probably improve healthcare professionals' compliance with evidence‐based practice (median adjusted RD (IQR): 10.25% (0.6% to 15.75%) absolute improvement in compliance in the intervention group; moderate‐certainty evidence).
ii) Patient outcomes
See patient outcomes under Comparison 1.
iii) Costs
We did not find studies that reported on costs or cost‐effectiveness.
Effects of local OLs identified by different methods
Fifteen of the included studies used the sociometric method (Althabe 2008; Berner 2003; Elliott 1997; Guadagnoli 2000; Hodnett 1996; Lomas 1991; Majumdar 2007; Majumdar 2008; McAlister 2009; Simunovic 2010; Soumerai 1998; Stross 1980; Stross 1983; Stross 1985,Wright 2008), and seven studies used methods equivalent to the informant method to identify OLs (Hong 1990; Johnston 2007; Leviton 1999; O'Connor 2009; Rebbeck 2006; Rycroft‐Malone 2012; Schectman 2003). Two studies used a combination of two methods (Cabana 2006; Sisk 2004).
We reported the effect of OLs identified by different methods classified according to each of the four a priori group comparisons, as none of the new included studies used other methods to identify OLs.
i) OLs versus no intervention
All studies included used the sociometric method; the median adjusted RD was 9%.
ii) OLs versus a single intervention
Lomas 1991 used the sociometric method; the RD was 15%. Hong 1990 used the informant method; the RD was 12%.
iii) OLs plus a single or more intervention(s) versus the same one or more intervention(s)
Three studies used the sociometric method to identify OLs (Berner 2003; Guadagnoli 2000; Soumerai 1998).Two studies used the informant method (Hong 1990; O'Connor 2009). The effects of the three studies using the sociometric method varied from 7% to 13% (median adjusted RD: 7%). The RD for the compliance outcomes in the two studies using the informant method was 25% (Hong 1990), and 8% (O'Connor 2009).
iv) OLs plus a single or more intervention(s) versus no intervention
For the six studies which used the sociometric method to identify OLs, the median adjusted RD was 10% (Althabe 2008; Berner 2003; Elliott 1997, Majumdar 2008; McAlister 2009, Wright 2008). The median adjusted RD for the three studies that used the informant method was 11% (0.85% to 21%) (Johnston 2007; Leviton 1999; O'Connor 2009). The two remaining studies used the informant method (Sisk 2004) and the sociometric method (Coleman 1966). It was not possible to calculate a median RD for Sisk 2004 or for Cabana 2006 which used the informant and the self‐designating method.
Comparison across all studies irrespective of comparison
Overall, the absolute increase in evidence‐based practice (median adjusted RD) for studies using the sociometric method of identification was 10% and for the informant method was 11%.
Effects of method of delivering the opinion leader education and effect of frequency of opinion leader involvement
We intended to determine whether OLs were more or less effective depending on whether education was delivered formally or informally. Due to a limited amount of detail, most studies could not be reliably categorised according to the educational method OLs used. Too little detail was also provided on the frequency of involvement of OLs, to make further investigation feasible.
Effects of using a multidisciplinary opinion leader team versus a single opinion leader to deliver the intervention
Across outcomes for the three studies involving multidisciplinary OL teams, the median adjusted RD (IQR) was 11% (9.15% to 42.1%). Across outcomes for the 11 studies involving single OLs, the median adjusted RD (IQR) was 8.1% (‐0.75% to 13%).
Effects for studies considered as having low risk of bias versus studies judged to be at either moderate or high risk of bias
Across outcomes for studies judged to be at low risk of bias, the median adjusted RD (IQR) was 11.5% (0.85% to 14%) (Althabe 2008; Cabana 2006; Hong 1990; McAlister 2009; Majumdar 2007; Majumdar 2008; O'Connor 2009; Rycroft‐Malone 2012; Simunovic 2010; Soumerai 1998; Wright 2008). For the 13 studies judged to be of either moderate (Hodnett 1996; Leviton 1999; Lomas 1991; Rebbeck 2006) or high risk of bias (Berner 2003; Elliott 1997; Guadagnoli 2000; Lomas 1991; Sisk 2004; Soumerai 1998; Stross 1980; Stross 1983; Stross 1985), the median adjusted RD (IQR) was 11.0% (4.5% to 15.5%).
Certainty of the evidence
All included studies were randomised and were initially considered to have a high certainty of evidence (before assessment of quality). We downgraded the certainty of evidence for the main outcome (compliance with evidence‐based practice) from high to moderate certainty of evidence due to high risk of bias. We downgraded the dichotomous patient outcomes (postpartum haemorrhage rate, local cancer reoccurrence, permanent colostomy rate, and breastfeeding rate) one step due to indirectness, since all three studies compared a multifaceted OL intervention with no intervention, which makes it difficult to separate out the effect of the OLs per se. One study evaluated surrogate outcomes (i.e. breastfeeding rate instead of infant health outcomes). In addition, we downgraded the certainty of evidence two steps due to imprecision, because fewer than 400 healthcare professionals participated in the included studies and the intervention effect varied across studies (i.e. from a relatively large beneficial effect in one study, to little or no effect in the other two).
As for the dichotomous patient outcomes, we downgraded the certainty of evidence two steps due to indirectness (all three studies compared a multifaceted OL intervention with no intervention, which makes it difficult to separate out the effect of the OLs per se). Also one study evaluated surrogate outcomes (i.e. breastfeeding rate instead of infant health outcomes) and one step due to imprecision (fewer than 400 participating healthcare professionals, the effect varied across studies from a beneficial effect in one, to little or no effect in the other two, and in addition varying types of outcomes were assessed in the studies), i.e. from high to very low certainty of evidence.
Discussion
Summary of main results
OLs alone, or in combination with other interventions, can be of help to promote evidence‐based practice, but their effectiveness varies both within and between studies. We included 24 randomised studies evaluating the effectiveness of OLs to disseminate and implement evidence‐based practice in this review. Overall, for the main comparison, the median adjusted risk difference of compliance with evidence‐based practice was 10.8% absolute increase (IQR: 3.5% to 14.6%; 18 studies; moderate‐certainty evidence). The other four comparisons also produced beneficial effects (range +7.1% to +13.7% absolute improvement in compliance; moderate‐certainty evidence).
For two of the four secondary comparisons, the IQR included the possibility of a small negative effect of the OL intervention (‐0.3% and ‐1.4% respectively). However, since in both cases the other end of the IQR suggests an appreciable benefit of the intervention (+15% and +19% absolute improvement, respectively), and the possible harm was small, we did not downgrade the evidence because of this. In an attempt to find possible explanations to the occasional negative effects of the OL interventions on some of the outcomes, we scrutinised the study reports once more, and came up with the following:
When a large number of outcomes are assessed in a study, the OLs may have found some of these outcomes more important than others, which could have resulted in a beneficial effect on these select outcomes, at the expense of other outcomes (see Stross 1980).
In a trial showing no effect, an unaccounted baseline outcome difference can give a faulty impression of a negative effect of the intervention at the final assessment (see Hodnett 1996).
There are outcomes where the health professionals' behaviour, although important, is outweighed by the patients preferences/circumstances. For instance, as noted in Hodnett 1996, the intentions and effort made by midwifes to reduce the rate of epidural anaesthesia may not be well received by women who perceive epidural anaesthesia as a superior form of patient care. Also, as noted in Sisk 2004, the aim to increase breastfeeding rate can be in conflict, say, with the mothers' preference to return early to work, or other socioeconomic and cultural factors. In that case, the efforts of healthcare professionals are outweighed by the preferences/circumstances of the mothers, whose decision ultimately it is whether or not to breastfeed.
Patient‐reported outcomes on the behaviour of healthcare professionals (e.g. doctors discussing early breast cancer treatment options) may be affected by recollection bias (e.g. Guadagnoli 2000).
One can speculate about the existence of a ceiling effect. For instance, in the study by Wright 2008, a standardised lecture was provided by an expert OL to both the control and the intervention group just before the local OL intervention, which led to a greatly improved practice (staging of colon cancer with 12 or more lymph nodes) in both groups, which may have prevented any further improvement being made through the influence of the local OL.
The lack of effect may be due to incorrect identification of OLs, or due to the possibility that OLs were insecure about how to enact change and did not effectively implement the intervention (e.g. as suggested by Wright 2008), or it could be due to the healthcare professional not welcoming the intervention.
Interestingly, OLs alone compared to a single intervention showed the greatest intervention effect. However, only two studies provided data for this comparison (reporting three outcomes and no baseline measure of outcome). The smallest median effect was for OLs plus a single or more intervention(s) compared to the same single or more intervention(s) (without OLs). The latter may provide a better estimate of the true effect of OLs, than for example when comparing OLs plus a single or more intervention(s) with no intervention, as in this comparison, it is difficult to tease out the effect of OLs per se. The median duration of follow‐up after the intervention was 12 months (range 2 to 30 months). The effect of OLs on patient outcomes is uncertain, because of the scarce and low‐certainty evidence. Since no studies reported on costs, the cost‐effectiveness of OLs remain unknown.
We judged eleven of the included studies to be at overall low risk of bias and 13 studies to be at overall moderate or high risk of bias. However, a sensitivity analysis showed that the median intervention effect was similar across the two groups. Another sensitivity analysis indicated a similar median effect for studies that did not report a baseline measure of outcome (i.e. unadjusted studies), and studies that were adjusted for baseline differences.
Our results are based on heterogeneous studies differing in type of population, intervention, setting, target behaviour, and outcomes. Also, the sample size, as well as the duration of interventions, varied across studies. In most studies, the role and actions of the OL were not clearly described, and we cannot therefore comment on strategies to enhance their effectiveness. It is also not clear whether the methods used to identify OLs are important for their effectiveness, or whether education delivered by single OLs or by multidisciplinary OL teams, are equally effective. It appeared there was little difference between studies with small and large sample sizes in terms of effect on compliance with desired practice. The one study, however, that reported a large beneficial effect on both compliance and patient outcomes (Althabe 2008) had one of the largest sample sizes, a large team of OLs (3 to 6 birth attendants) delivering the complex intervention, and also the longest duration of intervention and follow‐up among the included studies. We could not determine whether the varying effects depended on the type of healthcare professionals targeted, the targeted behaviour, or the patient conditions.
Overall completeness and applicability of evidence
All included studies were conducted in high‐income countries and it is, therefore, not clear whether the results of this review can be generalised to low‐ and middle‐income countries. In addition, most of the studies were conducted in secondary care. As it has been suggested that secondary care involves more complex social networks (Grimshaw 2006a), which hypothetically may result in more effective OL interventions, it is uncertain if our findings can be generalised to other settings (e.g. primary care).
We sought to identify variables associated with the effectiveness of OLs. We hypothesised that informal methods of delivering education would be more conducive to successful dissemination of new innovations. However, we found that most studies lacked the necessary information to reliably categorise them according to the educational method used by the OLs. Hence, there is insufficient evidence to confirm that formalisation of the OLs role can diminish the influence of OLs, as suggested by Ryan 2002. We were also interested in investigating whether or not the frequency of involvement of OLs, or whether multidisciplinary OL teams as compared to single OLs, would impact on the effectiveness of intervention, but again, too little detail was reported to make comparisons feasible.
Another factor that may affect the effectiveness of intervention is the 'intensity' of involvement of OLs. Overall, it was very difficult to quantify this. In three studies (Majumdar 2007; Majumdar 2008; McAlister 2009), the intensity of the OL intervention was very low, in that OLs only signed patient‐specific evidence summaries that were faxed to the patient's physician. No effect of the intervention was reported in Majumdar 2007 and McAlister 2009, while in Majumdar 2008, a difference in median effect between intervention and control groups was reported. However, in the latter study, the intervention was multifaceted, involving patient education and reminders, which may explain the beneficial effect of intervention found in this study. This study is a good example of a more general problem with the comparison of OLs plus a single or more intervention(s) versus no intervention ‐ that it is not possible to separate out the effects of the OL component from the combined effect of the co‐interventions.
The most common method for identifying OLs was the sociometric method (Rogers 1995). Most commonly, this method involves the distribution of a self‐reported questionnaire to members of a professional group. The questionnaire asks respondents to rate individuals according to the extent to which they are educationally influential, knowledgeable and humanistic. However, the sociometric method may be prone to incomplete identification of OLs within a community if only a select number of those asked to identify OLs respond. For example, in the 15 studies which used the sociometric method, responses to surveys ranged from between 30% to 67%. It is therefore unclear whether the OLs identified in studies with low response rates had the potential to influence non responding study participants.There is also uncertainty concerning the sustainability of the results, due to the instability of OLs over time.
Few of the 24 studies included in this review reported patient outcomes. It would be preferable if studies of interventions aimed at improving healthcare delivery would report not only professional compliance outcomes, but also patient outcomes (Guyatt 2004), to give a better understanding of how improved compliance would affect outcomes important to patients. As it is, we now know that OLs can be effective in improving compliance with evidence‐based practice, but, in most cases, we do not know if this transfers into improved health and quality of life for the patients. None of the included studies of effect on compliance reported on the cost of using OLs, which would be desirable, as such information would provide valuable information on whether the use of OLs is cost‐effective.
We are not aware of any relevant disadvantaged groups for which the intervention might have a different relative effect based on the intervention’s mechanism of action, and we therefore did not search for this type of data, or address any equity issues in this review update.
Certainty of the evidence
All the evidence included in this systematic review was from randomised studies that were heterogenous in terms of populations, interventions, and comparisons. A little more than half of the studies were judged to be at either high or moderate risk of bias (13 out of 24 studies), and we therefore downgraded the certainty of evidence for the main outcome (compliance with evidence‐based practice) one step, from high to moderate certainty of evidence. Only three of the included studies reported dichotomous patient outcomes. We downgraded these outcomes (postpartum haemorrhage rate, local cancer reoccurrence, permanent colostomy rate, and breastfeeding rate), two steps due to indirectness and one step due to imprecision, i.e. from high to very low certainty of evidence.
Potential biases in the review process
In order to minimise selection bias, we aimed to include not only studies in which one of the four predefined theory‐based methods for identification of OLs had been used (i.e. the observation method, the self‐designating method, the informant method, and the sociometric method), but also other methods described in the literature (Valente 2007). However, we did not find any eligible studies using other methods. All references found by the electronic searches were screened and data were extracted by two review authors independently. Only randomised trials were included in the review as they generally provide the strongest level of evidence of causation available (Higgins 2008). Assessment of risk of bias and grading of the certainty of evidence were also done in duplicate. Hence, we have attempted to reduce bias in the review process. Although a comprehensive search was performed by an experienced information specialist (including a search of grey literature), and reference lists of the included studies were searched by the authors, the possibility of having missed relevant studies cannot be excluded.
In addition, there is the possible risk of publication bias, which constitutes another threat to the conclusions of this review. Studies reporting a beneficial effect of the intervention or a larger effect size may be published, while a similar amount of data pointing in the other direction may remain unpublished (Hopewell 2009). We were unable to assess publication bias in this review because of the heterogeneity of the interventions assessed.
Agreements and disagreements with other studies or reviews
The results of this systematic review are in agreement with the results reported by its previous version (Flodgren 2011), where we concluded that "the use of OLs can successfully promote evidence‐based practice". The present review, which includes six additional studies, reported a 10.5% increase in compliance due to the OL intervention and is similar to the results of a 12% improved compliance with evidence‐based practice reported in the previous update.
The effectiveness of OLs as a strategy appears comparable, or sometimes even superior, to other strategies used to disseminate and implement evidence‐based practice in healthcare. Other Cochrane systematic reviews summarising the effectiveness of different methods to improve dissemination report comparably lower median effect sizes e.g. RD 4.3% (IQR 0.5% to 16%) for audit and feedback (Ivers 2012), RD 5.6% (IQR 3.0% to 9.0%) for educational outreach visits (O'Brien 2008), and RD 0.02 (range 0 to +0.11) for printed educational materials (Giguiere 2012).
Authors' conclusions
Implications for practice.
The translation of evidence into clinical practice is often slow and incomplete, which is why many patients do not receive appropriate care. The median effect of OLs in this review (around 10%; moderate‐certainty evidence) suggests that OLs can be of help to persuade healthcare professionals to comply with evidence‐based practice. However, the effects of OLs varies within and between studies, and we know little about the cause of this variation. We did not identify any undesirable anticipated effects of the intervention. Since most of the included studies were conducted in hospital centres (secondary care) in high‐income countries, it is unclear whether these findings will generalise to other healthcare settings, or to low‐ and middle‐income countries. Further, we know little about the cost and cost‐effectiveness of OL interventions .
Implications for research.
We included 24 randomised controlled studies in this review, so there is no lack of randomised studies. However, as most of the studies provided little information on what the OLs did, when they did it, and how often, future studies should aim to provide a detailed description of the intervention, e.g. the actual activity of education delivered by the OLs. This would allow for replication across studies and contexts, and to find out the cause of the different effects of OLs across studies. Future work on the methods of identifying OLs, e.g. those involving technology‐assisted social network analyses, could usefully inform decisions on how best to identify OLs, and at the lowest cost. Research could also be directed towards identifying the context in which OLs are most effective, and which characteristics of OLs contribute to better compliance and outcomes. Additional implications for research are to estimate the impact of OLs over time on compliance and outcomes. We repeat that future studies should involve also other settings, and low‐ and middle‐income countries. The costs and human resources needed to identify OLs, to train them, and for delivering the intervention (e.g. educational material) need further study, Possible harms related to the intervention may also need further study.
Future updates may want to consider the inclusion of study designs suitable for addressing questions related to how the intervention might work, or consider a separate qualitative (or mixed‐methods) review addressing this and other questions that require a qualitative approach.
Feedback
Study inaccurately summarised
Summary
Ellen Hodnett commented that her study had been inaccurately summarised and pointed out the necessary corrections.
Reply
These have now been incorporated into the review.
Contributors
Ellen Hodnett
What's new
| Date | Event | Description |
|---|---|---|
| 6 July 2018 | New citation required but conclusions have not changed | This is the third update of this review (Thomson 1999). In this update, we expanded the inclusion criteria to also include studies using other methods to identify opinion leaders than the four previously pre‐defined, and as a result, we included four studies that we had previously excluded. We conducted a new search and other content updated. There were changes to the author team, with two authors leaving. We updated the methods to comply with new EPOC and MECIR standards and added five summary of findings tables to the review. |
| 3 July 2018 | New search has been performed | New searches performed to July 2018. We added six new studies to this update. The total number of studies is now 24.The conclusions are unchanged. |
History
Protocol first published: Issue 3, 1996 Review first published: Issue 3, 1997
| Date | Event | Description |
|---|---|---|
| 7 July 2011 | New citation required and conclusions have changed | New update completed in Sept 2010, but new citation generated August 2011. Search was done up to May 2009. We included six new trials in this update.We assessed the risk of bias of all included trials using the new risk of bias tool (EPOC 2009), and we also added a summary of findings table. |
| 7 July 2011 | New search has been performed | New update completed in Sept 2010, but new citation generated August 2011. Search was done up to May 2009. We included six new trials in this update. |
| 12 November 2008 | Amended | Minor changes |
| 30 July 2008 | Amended | Converted to new review format. |
| 15 November 2006 | New citation required and conclusions have changed | Substantive amendment |
Acknowledgements
We would like to acknowledge all authors who contributed to previous versions of this review: professor Martin Eccles, Melina Gattelari, Gaby Doumit, Andy Oxman, Brian Haynes, Dave Davis, Nick Freemantle, and Emma Harvey. We also would like to acknowledge senior information specialists Nia Roberts from the Bodleian Library, and Paul Miller at the EPOC editorial base for running the electronic database searches, and managing editor Julia Worswick for editorial assistance. We also wish to thank the contact editor Luciana Ballini, the consumer reviewers: Ivana Turdic and Silvana Simi, the specialist referee Rema Padman, the editors Etienne Langlois and Cristian Herrera Riquelue, statistician Jemma Hudson, as well as the statistical editor Craig Ramsay for helpful comments on the review.
National Institute for Health Research, via Cochrane Infrastructure funding to the Effective Practice and Organisation of Care Group. The views and opinions expressed therein are those of the authors and do not necessarily reflect those of the Systematic Reviews Programme, NIHR, NHS or the Department of Health.
Appendices
Appendix 1. Search strategies
MEDLINE (OVID)
| No. | Search terms | Results |
| 1 | (opinion adj3 leader?).ti,ab. | 1233 |
| 2 | (educational* adj10 influential*).ti,ab. | 99 |
| 3 | ((physician? or clinician? or doctor? or nurse? or professional?) adj10 influential*).ti,ab. | 680 |
| 4 | ((physician? or clinician? or doctor? or nurse? or professional?) adj10 champion*).ti,ab. | 569 |
| 5 | ((physician? or clinician? or doctor? or nurse? or professional?) adj10 motivator?).ti,ab. | 180 |
| 6 | ((physician? or clinician? or doctor? or nurse? or professional?) adj10 (mobiliser? or mobilizer?)).ti,ab. | 5 |
| 7 | ((physician? or clinician? or doctor? or nurse? or professional?) adj3 leader?).ti,ab. | 3645 |
| 8 | ((physician? or clinician? or doctor? or nurse? or professional?) adj3 (endorser? or endorsement)).ti,ab. | 135 |
| 9 | (peer? adj3 leader?).ti,ab. | 350 |
| 10 | (peer? adj3 influential*).ti,ab. | 41 |
| 11 | (peer? adj3 champion?).ti,ab. | 16 |
| 12 | (peer? adj3 motivator?).ti,ab. | 13 |
| 13 | (peer? adj3 (mobiliser? or mobilizer?)).ti,ab. | 8 |
| 14 | (peer? adj3 (endorser? or endorsement)).ti,ab. | 15 |
| 15 | (popular adj3 (peer? or leader?)).ti,ab. | 129 |
| 16 | (expert adj3 leader?).ti,ab. | 44 |
| 17 | (leader? or champion? or motivator? or mobiliser? or mobilizer? or endorser?).ti. | 10182 |
| 18 | *leadership/ | 21438 |
| 19 | or/1‐18 | 33216 |
| 20 | exp randomized controlled trial/ | 463484 |
| 21 | controlled clinical trial.pt. | 92470 |
| 22 | randomi#ed.ti,ab. | 533178 |
| 23 | placebo.ab. | 189867 |
| 24 | randomly.ti,ab. | 293673 |
| 25 | Clinical Trials as topic.sh. | 183971 |
| 26 | trial.ti. | 183895 |
| 27 | exp animals/ not humans/ | 4468922 |
| 28 | or/20‐26 | 1195607 |
| 29 | 28 not 27 | 1102660 |
| 30 | 19 and 29 | 792 |
Embase (OVID)
| No. | Search terms | Results |
| 1 | (opinion adj3 leader?).ti,ab. | 1673 |
| 2 | (educational* adj10 influential*).ti,ab. | 108 |
| 3 | ((physician? or clinician? or doctor? or nurse? or professional?) adj10 influential*).ti,ab. | 798 |
| 4 | ((physician? or clinician? or doctor? or nurse? or professional?) adj10 champion*).ti,ab. | 944 |
| 5 | ((physician? or clinician? or doctor? or nurse? or professional?) adj10 motivator?).ti,ab. | 220 |
| 6 | ((physician? or clinician? or doctor? or nurse? or professional?) adj10 (mobiliser? or mobilizer?)).ti,ab. | 5 |
| 7 | ((physician? or clinician? or doctor? or nurse? or professional?) adj3 leader?).ti,ab. | 3927 |
| 8 | ((physician? or clinician? or doctor? or nurse? or professional?) adj3 (endorser? or endorsement)).ti,ab. | 183 |
| 9 | (peer? adj3 leader?).ti,ab. | 455 |
| 10 | (peer? adj3 influential*).ti,ab. | 45 |
| 11 | (peer? adj3 champion?).ti,ab. | 23 |
| 12 | (peer? adj3 motivator?).ti,ab. | 14 |
| 13 | (peer? adj3 (mobiliser? or mobilizer?)).ti,ab. | 8 |
| 14 | (peer? adj3 (endorser? or endorsement)).ti,ab. | 17 |
| 15 | (popular adj3 (peer? or leader?)).ti,ab. | 137 |
| 16 | (expert adj3 leader?).ti,ab. | 64 |
| 17 | (leader? or champion? or motivator? or mobiliser? or mobilizer? or endorser?).ti. | 10833 |
| 18 | *leadership/ | 19966 |
| 19 | or/1‐18 | 33538 |
| 20 | random*.ti,ab. | 1314799 |
| 21 | factorial*.ti,ab. | 33074 |
| 22 | (crossover* or cross over*).ti,ab. | 94686 |
| 23 | ((doubl* or singl*) adj blind*).ti,ab. | 210062 |
| 24 | (assign* or allocat* or volunteer* or placebo*).ti,ab. | 912835 |
| 25 | crossover procedure/ | 55942 |
| 26 | single blind procedure/ | 31716 |
| 27 | randomized controlled trial/ | 507881 |
| 28 | double blind procedure/ | 151282 |
| 29 | or/20‐28 | 2026800 |
| 30 | exp animal/ not human/ | 4884494 |
| 31 | 29 not 30 | 1824346 |
| 32 | 19 and 31 | 1840 |
The Cochrane Library (Wiley)
| No. | Search terms | Results |
| #1 | (opinion near/3 leader*):ti,ab,kw | 187 |
| #2 | (educational* near influential*):ti,ab,kw | 10 |
| #3 | ((physician* or clinician* or doctor* or nurse* or professional*) near influential*):ti,ab,kw | 25 |
| #4 | ((physician* or clinician* or doctor* or nurse* or professional*) near champion*):ti,ab,kw | 25 |
| #5 | ((physician* or clinician* or doctor* or nurse* or professional*) near motivator*):ti,ab,kw | 3 |
| #6 | ((physician* or clinician* or doctor* or nurse* or professional*) near (mobiliser* or mobilizer*)):ti,ab,kw | 0 |
| #7 | ((physician* or clinician* or doctor* or nurse* or professional*) near/3 leader*):ti,ab,kw | 143 |
| #8 | ((physician* or clinician* or doctor* or nurse* or professional*) near/3 (endorser* or endorsement)):ti,ab,kw | 24 |
| #9 | (peer* near/3 leader*):ti,ab,kw | 177 |
| #10 | (peer* near/3 influential*):ti,ab,kw | 8 |
| #11 | (peer* near/3 champion*):ti,ab,kw | 1 |
| #12 | (peer* near/3 motivator*):ti,ab,kw | 4 |
| #13 | (peer* near/3 (mobiliser* or mobilizer*)):ti,ab,kw | 0 |
| #14 | (peer* near/3 (endorser* or endorsement)):ti,ab,kw | 0 |
| #15 | (popular near/3 (peer* or leader*)):ti,ab,kw | 28 |
| #16 | (expert near/3 leader*):ti,ab,kw | 13 |
| #17 | (leader* or champion* or motivator* or mobiliser* or mobilizer* or endorser*):ti | 414 |
| #18 | {or #1‐#17} | 881 |
ProQuest Dissertations & Theses: UK & Ireland
ProQuest Dissertations & Theses Global
| No. | Search terms | Results |
| S1 | noft((opinion NEAR/3 leader*)) | 1024 |
| S2 | noft((educational* NEAR/ influential*)) | 174 |
| S3 | noft(((physician* or clinician* or doctor* or nurse* or professional*) NEAR/5 influential*)) | 353 |
| S4 | noft(((physician* or clinician* or doctor* or nurse* or professional*) NEAR/5 champion*)) | 63 |
| S5 | noft(((physician* or clinician* or doctor* or nurse* or professional*) NEAR/5 motivator*)) | 76 |
| S6 | noft(((physician* or clinician* or doctor* or nurse* or professional*) NEAR/5(mobiliser* or mobilizer*))) | 1 |
| S7 | noft(((physician* or clinician* or doctor* or nurse* or professional*) NEAR/3 leader*)) | 4308 |
| S8 | noft(((physician* or clinician* or doctor* or nurse* or professional*) NEAR/3 (endorser* or endorsement))) | 49 |
| S9 | noft((peer* NEAR/3 leader*)) | 637 |
| S10 | noft((peer* NEAR/3 influential*)) | 102 |
| S11 | noft((peer* NEAR/3 champion*)) | 2 |
| S12 | noft((peer* NEAR/3 motivator*)) | 8 |
| S13 | noft((peer* NEAR/3 (mobiliser* or mobilizer*))) | 0 |
| S14 | noft((peer* NEAR/3 (endorser* or endorsement))) | 8 |
| S15 | noft((popular NEAR/3 (peer* or leader*))) | 310 |
| S16 | noft((expert NEAR/3 leader*)) | 326 |
| S17 | [S1‐S16] | 7220 |
| S18 | noft(random* or blind* or allocat* or assign* or trial* or placebo* or crossover* or cross‐over*) | 744528 |
| S19 | [S17 AND S18] | 868 |
Science Citation Index Expanded (SCI‐EXPANDED) ‐ 1945‐present Social Sciences Citation Index (SSCI) ‐ 1956‐present Conference Proceedings Citation Index‐ Science (CPCI‐S) ‐ 1990‐present
| No. | Search terms | Results |
| #1 | TS=((opinion NEAR/3 leader*)) | 2,212 |
| #2 | TS=((educational* NEAR/3 influential*)) | 69 |
| #3 | TS=(((physician* or clinician* or doctor* or nurse* or professional*) NEAR/5 influential*)) | 375 |
| #4 | TS=(((physician* or clinician* or doctor* or nurse* or professional*) NEAR/5 champion*)) | 320 |
| #5 | TS=(((physician* or clinician* or doctor* or nurse* or professional*) NEAR/5 motivator*)) | 78 |
| #6 | TS=(((physician* or clinician* or doctor* or nurse* or professional*) NEAR/5 (mobiliser* or mobilizer*))) | 1 |
| #7 | TS=(((physician* or clinician* or doctor* or nurse* or professional*) NEAR/3 leader*)) | 4,620 |
| #8 | TS=(((physician* or clinician* or doctor* or nurse* or professional*) NEAR/3 (endorser* or endorsement))) | 160 |
| #9 | TS=((peer* NEAR/3 leader*)) | 683 |
| #10 | TS=((peer* NEAR/3 influential*)) | 88 |
| #11 | TS=((peer* NEAR/3 champion*)) | 28 |
| #12 | TS=((peer* NEAR/3 motivator*)) | 23 |
| #13 | TS=((peer* NEAR/3 (mobiliser* or mobilizer*))) | 8 |
| #14 | TS=((peer* NEAR/3 (endorser* or endorsement))) | 39 |
| #15 | TS=((popular NEAR/3 (peer* or leader*))) | 516 |
| #16 | TS=((expert NEAR/3 leader*)) | 372 |
| #17 | #16 OR #15 OR #14 OR #13 OR #12 OR #11 OR #10 OR #9 OR #8 OR #7 OR #6 OR #5 OR #4 OR #3 OR #2 OR #1 | 9,196 |
| #18 | TS=(random* or blind* or allocat* or assign* or trial* or placebo* or crossover* or cross‐over*) | 3,257,818 |
| #19 | #18 AND #17 | 1,285 |
ClinicalTrials.gov
leader OR champion OR motivator OR mobiliser OR mobilizer OR endorser [TITLE]
WHO International Clinical Trials Registry Platform (ICTRP)
leader OR champion
Appendix 2. Data extraction form
Modified EPOC Group ‐ Data Extraction Form
LOCAL OPINION LEADERS: EFFECTS ON PROFESSIONAL PRACTICE
AND HEALTH CARE OUTCOMES
Data collection
Name of reviewer:
Date:
Study reference:
Trial Identifier:
Author:
Title of paper:
Full reference:
1. Inclusion criteria
1.1 Study design
RCT designs: Yes X No
If “Yes” what (i.e. cluster, parallel ...)?
1.2 Methodological inclusion criteria
a) The objective measurement of performance/provider behaviour or health/patient outcome(s):
b) Relevant and interpretable data presented or obtainable
NB A study must meet the minimum criteria for EPOC scope, design, and methodology for inclusion in EPOC reviews. If it does not, COLLECT NO FURTHER DATA.
2. Interventions
2.1 Type of intervention (state all interventions for each comparison/study group)
a) Group 1:
b) Group 2:
c) Group 3:
Interventions are:
Opinion leader +/‐ (audit & feedback, reminders, outreach visits, academic detailing, marketing strategies etc).
2.2 Method of Identification of opinion leaders
a) Sociometric method
If yes, what is the percentage of network coverage obtained for opinion leaders during the identification process (i.e. survey)?
a) Informant method
b) Self‐designating method
c) Observation method
e) Other methods: ___________________________
If other method used, exclude study.
2.3 Opinion Leader or Opinion Leader teams
Was a sole OL identified/selected or was a team of leaders identified at each intervention site?
Opinion Leaders (one) YES NO
Opinion Leader teams YES NO
If YES, how many OLs were selected at each intervention site and what was their occupation? (cut and paste from the paper verbatim)
2.4 Duration of the interventions
a) Group 1:
b) Group 2:
c) Group 3:
2.5 Control(s)
3. Type of targeted behaviour (state more than one where appropriate)
a)
b)
c)
4. Participants
4.1 Characteristics of participating providers
a) Profession (absolute numbers or reported percentages):
b) Level of training:
c) Clinical specialty:
Primary Care: ________________________
Secondary Care: ______________________
Other (state): _________________________
Unclear:_____________________________
d) Age
Mean: __________
Score 'unclear' if data not available
e) Time since graduation (or years in practice):
4.2 Characteristics of participating patients
a) Clinical problem (e.g. hypertension ..):
b) Age:
c) Gender:
d) Ethnicity:
e) Other (specify): ____________
4.3 Numbers included in the study (e.g. patients that entered the study) (report numbers and/or percentages when available)
(State unclear if information not available)
a) Episodes of care:
b) Patients:
c) Providers:
d) Practices:
e) Hospitals:
f) Communities or regions:
g) Proportion of eligible providers (or allocation units) who participated in the study:
5. Setting
State Unclear if information not available
a) Reimbursement system:
b) Location of care:
c) Academic status:
Teaching versus non‐teaching centres
d) Country:
6. Methods
a) Unit of allocation:
b) Unit of analysis:
c) Power calculation:
Score 'done" if study has sufficient statistical power to detect clinically important effects as statistically significant and record power.
7.0 Risk of bias
7.1 Was the allocation sequence adequately generated ? (cut and paste from the paper verbatim)
| Score YES |
If a random component in the sequence generation process is described (e.g. referring to a random numbers table) |
|
| Score NO |
If a non‐random method is used (e.g. performed by date of submission) | |
| Score UNCLEAR |
If not specified in the paper |
7.2 Was the allocation adequately concealed?
| Score YES |
If the unit of allocation was by institution, team or professional and allocation was performed at all units at the start of the study; or if the unit of allocation was by patient or episode of care and there was some kind of centralised randomisation scheme; an on‐site computer system or if sealed opaque envelopes were used | |
| Score NO |
If none of the above mentioned methods were used (or if a CBA) | |
| Score UNCLEAR |
If not specified in the paper |
7.3 Were baseline outcome measurements similar?
| Score YES |
If performance or patient outcomes were measured prior to the intervention, and no important differences were present across study groups | |
| Score NO |
If important differences were present and not adjusted for in analysis | |
| Score UNCLEAR |
If RCTs had no baseline measure of outcome |
7.4 Were baseline characteristics similar?
| Score YES |
If baseline characteristics of the study and control providers were reported and similar | |
| Score NO |
If there was no report of characteristics in the text or tables or if there were differences between control and intervention providers | |
| Score UNCLEAR |
If it was not clear in the paper (e.g. characteristics were mentioned in the text but no data were presented) |
7.5 Were incomplete outcome data adequately addressed?
| Score YES |
If missing outcome variables were unlikely to bias the results (e.g. the proportion of missing data was similar in the intervention and the control group, or the proportion of missing data was less than the effect size, i.e. unlikely to overturn the study results | |
| Score NO |
If missing data were likely to bias the results | |
| Score UNCLEAR |
If not specified in the paper (do not assume 100% follow‐up unless stated explicitly) |
7.6 Was knowledge of the allocated interventions adequately addressed?
| Score YES |
If the authors stated explicitly that primary outcome variables were assessed blindly, or the outcomes were objective e.g. length of hospital stay. Primary outcomes are defined as those variables that correspond to the primary hypothesis or question as defined by the authors. | |
| Score NO |
If the outcomes were not assessed blindly | |
| Score UNCLEAR |
If not specified in the paper |
7.7 Was the study adequately protected against contamination?
| Score YES |
If allocation was by community, institution or practice and it was unlikely that the control group received the intervention | |
| Score NO |
If it was likely that the control group received the intervention (e.g. if patients rather than professionals were randomised) | |
| Score UNCLEAR |
If professionals were allocated within a clinic or practice and it was possible that communication between intervention and control professionals could have occurred (e.g. physicians within practices were allocated to intervention or control) |
7.8 Was the study free from selective outcome reporting?
| Score YES |
If there was no evidence that outcomes were selectively reported (e.g. all relevant outcomes in the methods section were reported in the results section) | |
| Score NO |
If some important outcomes were subsequently omitted from the results | |
| Score UNCLEAR |
If not specified in the paper |
7.9 Was the study free from other risks of bias?
| Score YES |
If no evidence of other risks of bias | |
| Score NO |
||
| Score UNCLEAR |
8. Prospective identification by investigators of barriers to change
Investigators identified specific barriers to change in the target population, which were addressed by the intervention (information management, clinical uncertainty, sense of competence, perceptions of liability, patient expectations, standards of practice, financial disincentives, administrative constraints, other)
9. Intervention
Description of the intervention (cut and paste from the paper verbatim, and separate the different parts of the intervention, if possible):_______________________________________________
Rate your assessment of the proportion of the 'active ingredients' of the intervention contributed by the OL part of the intervention (on a scale from 0 to 100):____________
9.1 Characteristics of the intervention
a) Evidence base of recommendation:
Score 'done' if recommendations appeared to be based on good evidence
b) Purpose of recommendations:
(Appropriate management, cost‐containment, other)
9.2 Nature of desired change
(Initiation of new management, stopping introduction of new management, reduction of established management, increase in established management, cessation of established management, modification of established management)
9.3 Method that opinion leaders use to transfer evidence‐based medicine
a) Informal education (e.g. informal one to one teaching): _________
b) Formal education: ___________
(conferences, community outreach education, academic detailing, dissemination of clinical practice guidelines, small group teaching etc.)
c) Unclear (other):__________
9.4 What was the frequency of involvement of the Opinion Leader(s) during intervention?
9.5 Was the content of the education delivered by the OL based upon implementation of clinical practice guidelines?
Yes No Unclear
If 'yes', were these evidence‐based:
Yes No Unclear
9.6 Timing
a) Proximity to clinical decision‐making
a) Group 1:
b) Group 2:
c) Group 3:
b) Frequency/number of intervention events
a) Group 1:
b) Group 2:
c) Group 3:
c) Duration of intervention
a) Group 1:
b) Group 2:
c) Group 3:
9.7 Setting of intervention
(In practice setting, not in practice setting)
10 Outcomes
10.1 Description of the main outcome measure(s)
a) Health professional outcomes/process measures:
b) Patient outcomes:
10.2 Length of time during which outcomes were measured after initiation of the intervention
a) Group 1:
b) Group 2:
c) Group 3:
10.3 Length of post‐intervention follow‐up period
a) Group 1:
b) Group 2:
c) Group 3:
10.4 Identification of a possible ceiling effect
For example, there was little room for improvement in provider performance, because it was adequate without the intervention (based on baseline measurements or control group performance)
a) Identified by investigator:
b) Identified by reviewer:
11. Results
State the results as they will be entered in the review, and describe how these were calculated (e.g. relative percentage differences attributable to the intervention).
a) Group 1:
b) Group 2:
c) Group 3:
Appendix 3. Results Table 1. Local opinion leaders alone versus no intervention
| Study | Median effect outcomes | # participants (hospitals) |
Control ‐ compliance |
Intervention ‐ compliance | Adjusted RD (P value) |
| Hodnett 1996 | Women in labour who did not receive epidural anaesthesia. Desired change: increase |
Unclear (20) | Pre: N/A Post: 49.6% |
Pre: N/A Post 44.5% |
‐0.05 (p < 0.001) Note: the epidural rate was higher in the intervention group than in the control group at month 0 to 6 |
| Majumdar 2007 | Participants with heart failure (HF) and ischaemic heart disease (IHD) who received efficacious medication Desired change: (i) increased use of ACE inhibitors or ARBs in HF (ii) increased use of statins in IHD |
171 (unclear) | i) Pre: N/A Post: 5/25 ii) Pre: N/A Post: 10/59 |
i) Pre: N/A Post: 11/29 ii) Pre: N/A Post: 10/58 |
Median adjusted RD range): +0.0915 (+0.003 to +0.18) i) +0.18 (P = 0.15) ii) +0.003 (P = 0.97) Note: None of the participants were prescribed any of the study medications (ACE inhibitors, ARBs, or statins) at baseline |
| Stross 1980 | Care of people with rheumatoid arthritis History/diagnosis i) Symptoms of inflammation ii) Extraarticular manifestations iii) Medications iv) Complications of therapy Physical examination v) Heat, redness, swelling vi) Range of motion vii) Deformity Diagnostic studies viii) Sedimentation rate ix) Latex fixation x) Joint roentgenogram Management xi) Participants who received aspirin xii) Participants who received nonsteroidal anti‐inflammatory agents (NSAIDS) xiii) Participants who received gold ‐ desired direction of effect not clear xiv) Participants who did not receive corticosteroids xv) Participants who received physical therapy Desired change: increase in all outcomes (note that bolded outcomes were: "stressed' in the educational program) |
114 (6) | i) Pre: 1/34 Post: 7/33 ii) Pre: 3/34 Post: 4/33 iii) Pre: 17/34 Post: 24/33 iv) Pre: 3/34 Post: 5/33 v) Pre: 8/34 Post: 15/33 vi) Pre: 19/34 Post: 9/33 vii) Pre: 12/34 Post: 18/33 viii) Pre: 20/34 Post: 12/33 ix) Pre: 3/34 Post: 6/33 x) Pre: 5/34 Post: 12/33 xi) Pre: 19/34 Post: 15/33 xii) Pre: 8/34 Post: 18/33 xiii) Pre: 7/34 Post: 6/33 xiv) Pre: 21/34 Post: 15/33 xv) Pre: 21/34 Post: 16/33 |
i) Pre: 0 Post: 12/29 ii) Pre: 1/18 Post: 2/29 iii) Pre: 8/18 Post: 23/29 iv) Pre: 2/18 Post: 5/29 v) Pre: 5/18 Post: 22/29 vi) Pre: 7/18 Post: 14/29 vii) Pre: 8/18 Post: 19/29 viii) Pre: 12/18 Post: 22/29 ix) Pre: 3/18 Post: 14/29 x) Pre: 3/18 Post: 8/29 xi) Pre: 13/18 Post: 19/29 xii) Pre: 4/18 Post: 11/29 xiii) Pre: 5/18 Post: 3/29 xiv) Pre: 10/18 Post: 19/29 xv) Pre: 12/18 Post: 23/29 |
Median adjusted RD (IQR): +0.17 (‐0.002 to +0.25) (*) (P value not reported due to unit of analysis error) i) +0.23 ii) ‐0.02 iii) +0.12 iv) ‐0.002 v) : +0.26 vi) +0.38 vii) +0.02 viii) : +0.32 ix) : +0.22 x) : ‐0.04 xi) : +0.04 xii) ‐0.15 xiii) not included in calculations xiv) +0.26 xv) +0.27 |
| Stross 1983 | Care of people with COPD i) Participants who received IV fluids ii) Participants who received antibiotics iii) Participants who received antibiotics seven days or more iv) Participants who received bronchodilators ‐ intravenous v) Participants who received bronchodilators ‐ loading dose vi) Participants who received bronchodilators ‐ aerosolised vii) Participants who did not receive bronchodilators ‐ oral viii) Participants who received bronchodilators ‐ single agent ix) Participants who did not receive bronchodilators ‐ combination x) Participants who did not receive intermittent positive pressure breathing xi) Oxygen xii) Respiratory therapy referrals (xiii) Chest radiograph (xiv) Sputum gram stain (xv) Arterial blood gas measurement (xvi) Pulmonary function studies Desired effect: increase in all but two outcomes (i) and (xi), for which the desired effect was unclear |
510 (16) | i) Pre: 133/237 Post: 118/221 ii) Pre: 153/237 Post: 131/221 iii) Pre: 83/237 Post: 77/221 iv) Pre: 118/237 Post: 99/221 v) Pre: 51/237 Post: 86/221 vi) Pre: 11/237 Post: 8/221 vii) Pre: 94/237 Post: 73/221 viii) Pre: 85/237 Post: 89/221 ix) Pre: 179/237 Post: 162/221 x) Pre: 84/237 Post: 82/221 xi) Pre: 130/237 Post: 148/221 xii) Pre: 31/237 Post: 33/221 xiii) Pre: 223/237 Post: 199/221 xiv) Pre: 92/237 Post: 48/221 xv) Pre: 101/237 Post: 107/221 xvi) Pre: 33/237 Post: 35/221 |
i) Pre: 120/227 Post: 189/289 ii) Pre: 160/227 Post: 200/289 iii) Pre: 87/227 Post: 225/289 iv) Pre: 129/227 Post: 156/289 v) Pre: 50/227 Post: 171/289 vi) Pre: 14/227 Post: 75/289 vii) Pre: 60/227 Post: 80/289 viii) Pre: 104/227 Post: 185/289 ix) Pre: 164/227 Post: 265/289 x) Pre: 63/227 Post: 107/289 xi) Pre: 139/227 Post: 177/289 xii) Pre: 46/227 Post: 88/289 xiii) Pre: 222/227 Post: 265/289 (xiv) Pre: 61/227 Post: 81/289 (xv) Pre: 61/227 Post: 134/289 (xvi) Pre: 33/227 Post: 44/289 |
Median adjusted RD (IQR): +0.13 (+0.05 to +0.21) (*) (P value not reported due to unit of analysis error) i) not included in calculations ii) ‐0.03 iii) +0.35 iv) +0.05 v) +0.2 vi) +0.21 vii) +0.08 viii) +0.26 ix) +0.22 x) +0.07 xi) not included in calculations xii) +0.11 xiii) ‐0.03 (xiv) +0.19 (xv) +0.15 (xvi) ‐0.05 |
| Stross 1985 | Care of people with osteoarthritis i) Length of stay (days) ‐ not included in analysis (ii) Participants who received ASA (iii) Participants who received NSAIDS (iv) Participants who did not receive corticosteroids (systemic) (v) Participants who received corticosteroids (intra‐articular) (vi) Participants who received physical therapy (vii) Referrals Desired change: increase in all outcomes |
89 (6) | i) Pre: 8.4 Post: 8.6 ii) Pre: 9/18 Post: 5/18 iii) Pre: 14/18 Post: 17/18 iv) Pre: 15/18 Post: 14/18 v) Pre: 2/18 Post: 2/18 vi) Pre: 15/18 Post: 15/18 vii) Pre: 7/18 Post: 6/18 |
i) Pre: 8.8 Post: 8.4 ii) Pre: 9/23 Post: 6/30 iii) Pre: 19/23 Post: 26/30 iv) Pre: 20/23 Post: 29/30 v) Pre: 4/23 Post: 12/30 vi) Pre: 20/23 Post: 28/30 vii) Pre: 9/23 Post: 9/30 |
Median adjusted RD (IQR): +0.045 (‐0.03 to +0.15) (*) (P value not reported due to unit of analysis error) i) not included in calculation ii) +0.03 iii) ‐0.12 iv) +0.15 v) +0.23 vi) +0.06 vii) ‐0.03 |
| *: P value reported by author Footnotes ACE inhibitor: angiotensin converter enzyme inhibitor; ASA: acetylic acid; ARB: angiotensin receptor blocker; COPD: chronic obstructive pulmonary disease; HF: heart failure; IHD: ischemic heart disease; IQR: interquartile range; IV fluids: intravenous fluids; N/A: not available; NSAIDS: nonsteroidal anti‐inflammatory drug; Post: after (intervention); Pre: before (intervention); RD: risk difference | |||||
Appendix 4. Results Table 2. Local opinion leaders alone versus a single intervention
| Study | Median effect outcome | 2nd group intervention | # participants (hospitals) | Control ‐ compliance | Intervention ‐ compliance | RD (P Value) |
| Hong 1990 | Correct urinary catheter practices Desired change: increase |
Standardised lecture | unclear (1) | Pre: N/A Post: 39/75 | Pre: N/A Post: 83/129 | +0.12
(P value not reported due to unit of analysis error) Note: The authors stated that the baseline outcome measures were similar across groups (but provided no numerical data) |
| Lomas 1991 | Eligible women with previous caesarean section who underwent (i) a trial of labour and (ii) vaginal birth Desired change: increase |
Audit and feedback | 1972 (16) | i) Pre: N/A Post: 21.4% ii) Pre: N/A Post: 11.8% |
i) Pre: N/A Post: 38.2% ii) Pre: N/A Post: 25.3% |
Median RD: +0.155
(P value not reported due to unit of analysis error) i) +0.17 ii) +0.14 Note: The authors stated that the baseline outcome measures were similar across groups (but provided no numerical data) |
| Footnotes N/A : not available; Post: after (intervention); Pre: before (intervention); RD: risk difference | ||||||
Appendix 5. Results Table 3. Local opinion leaders plus one or more intervention(s) versus the same single or more intervention(s)
| Study | Median effect outcomes | 2nd group intervention | # Participants (hospitals/other) | Control ‐ compliance | Intervention ‐ compliance |
Adjusted RD (P value) |
| Berner 2003 | Eligible participants with unstable angina who received: i) ECG in 20 min ii) Antiplatelet medication within 24 hours iii) Antiplatelet medication at discharge iv) Heparin v) Beta blockers during hospitalisation Desired change: increase |
Health Care Quality Improvement Program (HCQIP) (Audit and feedback) |
2210 (21) | % change from BL: i) 6.6% ii) ‐3.9% iii) 13.3% iv) 9.1% v) ‐3.1% |
% change from BL: i) 7.2% ii) 20.2% iii) 5.2% iv) 31% v) 4.0% |
Median adjusted RD (IQR): +0.071 (‐0.037 to 0.23) i) +0.006 (P = 0.9) ii) +0.24 (P = 0.016) iii): ‐0.08 (P = 0.5) iv) +0.22 (P = 0.051) v) +0.071 (P = 0.6) P values* |
| Guadagnoli 2000 | Women who reported that their surgeon discussed treatment options for early breast cancer prior to surgery Desired change: increase |
Performance feedback | 2314 (28) | Pre: 69% Post: 87% |
Pre: 67% Post: 83% |
‐0.02 (P > 0.05) |
| Hong 1990 | Correct urinary catheter practices Desired change: increase |
Standardised lecture | unclear (1) | Pre: N/A Post: 39/75 | Pre: N/A Post: 39/51 | +0.25 (P value not reported due to unit of analysis error) |
| O'Connor 2009 | Care of people with diabetes i) HbA1c test rates ii) LDL test rates Desired change: increase |
Learning cases | 1329 (18 primary care clinics) | i) Pre: 91.6% Post: 88.9% Change: ‐0.027 ii) Pre: 70.2% Post: 74.9% |
i) Pre: 89.6% Post: 88.2% Change ‐0.014 ii) Pre: 70.2% Post: 72.1% |
‐0.0075 i) +0.013 (P = 0.63) ii) ‐0.028 (P = 0.30) |
| O'Connor 2009 |
Patient outcomes: i) HbA1c level ii) LDL level Desired change: decrease (normalisation) |
Learning cases | 1329 (18 primary care clinics) | i) Pre: 7.47 Post: 7.46 Absolute change: ‐0.01 ii) Pre: 106.3 Post: 103.9 Absolute change: ‐2.4 |
i) Pre: 7.32 Post: 7.50 Absolute change: 0.18 ii) Pre: 104.5 Post: 100.8 Absolute change: ‐3.7 |
Patient outcomes: Adjusted mean difference: i) 0.19 units higher levels (P = 0.04) ii) 1.3 units lower levels (P > 0.05) |
| Soumerai 1998 | Improving care for people post acute myocardial infarction Eligible participants receiving i) Aspirin ii) Beta blockers and participants who did not receive iii) Prophylactic lidocaine Desired change: increase |
Audit and feedback | 5347 (30) | i) Pre: 80% Post: 77% ii) Pre: 60% Post: 78%. iii) Pre: 75% Post: 88% |
i) Pre: 77% Post: 90% ii) Pre: 49% Post: 80% iii) Pre: 81% Post: 90% |
Median adjusted RD (range): +0.13 (‐0.04 to +0.16) i) +0.16 (P = 0.04) ii) +0.13 (P = 0.02*) iii) ‐0.04 (P = 0.29*) |
| *: P value reported by author Footnotes BL: baseline; ECG: electrocardiogram; HbA1c: glycated haemoglobin; HCQIP: health care quality improvement progam; IQR: interquartile range; LDL: low‐density lipoprotein; NS: not significant; RD: risk difference | ||||||
Appendix 6. Results Table 4. Local opinion leaders plus a single or more intervention(s) versus no intervention
| Study | Outcome | Additional intervention | # participants (hospitals) | Control ‐ compliance | Intervention ‐ compliance | Adjusted RD (P Value) |
| Althabe 2008 | Eligible patients receiving improved care during third stage of labour: i) Patients who received prophylactic oxytocin and ii) Patients who did not receive an episiotomy Desired change: increase in all outcomes |
Interactive workshops, training of manual skills, one‐to‐one academic detailing, reminders and feedback | 4299 (19) | i) Pre: 2.6% Post: 12.3% ii) Pre: 56.5% Post: 55.5% |
i) Pre: 2.1% Post: 83.6% ii) Pre: 58.9% Post: 70.1% |
Median adjusted RD: +0.421 i) Adjusted RD +0.72 (P = 0.01*) ii) Adjusted RD +0.122 (P < 0.001*) |
|
Patient outcomes: i) Rate of postpartum haemorrhage > 500 mL ii) Rate of postpartum haemorrhage > 1000 mL |
Median rate i) Pre: 9.8 Post: 8.1 Median rate ratio: 0.55 ii) Pre: 1.5 Post: 0.6 Median rate ratio: 0.88 |
Median rate i) Pre: 18.6 Post: 6.9 Median rate ratio: 0.31 II) Pre 3.0 Post: 0.8 Median rate ratio: 0.26 |
Patient outcomes: relative rate reduction: i) 45% (95% CI, 9 to 71), P < 0.01 ii) 70% (95% CI, 16 to 78), P < 0.001 |
|||
| Berner 2003 | Eligible patients with unstable angina who received: i) ECG in 20 min ii) Antiplatelet medication within 24 hours iii) Antiplatelet medication at discharge iv) Heparin v) Beta blockers during hospitalisation Desired change: increase in all outcomes |
Health Care Quality Improvement Program, HCQIP (Audit and feedback) | 2210 (21) | i) Pre: 44% Post: 49% ii) Pre: 74% Post: 75% iii) Pre: 68% Post: 72% iv) Pre: 46% Post: 56% v) Pre: 61% Post: 65% |
i) Pre: 67% Post: 68% ii) Pre: 63% Post: 79% iii) Pre: 69% Post: 73% iv) Pre: 36% Post: 46% v) Pre: 56% Post: 57% |
Median adjusted RD (IQR): 0 (‐0.035 to 0.075) i) ‐0.04 (P > 0.05) ii) +0.15 (P = 0.01) iii) 0 iv) 0 v) ‐0.03 (P > 0.05) (extrapolated from graph) |
| Cabana 2006 | Asthma (patient) outcomes: (i) Mean days affected by asthma symptoms per year (ii) Mean urgent asthma office visits per year (iii) Mean ED asthma visits per year (iv) Mean hospitalisations for asthma per year Desired change: decrease in all outcomes |
Two interactive seminar sessions (2.5 hours each) that reviewed national asthma guidelines, communication skills, and key educational messages | 870 (66 private practices and 6 hospitals or government clinics) | i) Pre: 28.5 Post: 20.0 Absolute change: ‐8.5 ii) Pre: 1.67 Post: 0.77 Absolute change: ‐0.9 iii) Pre: 0.65 Post: 0.35 Absolute change: ‐0.3 iv) Pre: 0.13 Post: 0.07 Absolute change: 0.06 |
i) Pre: 30.2 Post: 14.6 Absolute change: ‐15.6 ii) Pre: 1.83 Post: 0.75 Absolute change: ‐1.08 iii) Pre: 0.86 Post: 0.31 Absolute change: ‐0.55 iv) Pre: 0.12 Post: 0.06 Absolute change: 0.06 |
Patient outcomes: adjusted mean difference (change from baseline): i) 7.1 fewer days with asthma symptoms (P < 0.05) ii) 0.18 fewer urgent asthma office visits (P > 0.05) iii) 0.25 fewer asthma ED visits (P < 0.05) iv) 0 fewer hospitalisations due to asthma (P > 0.05) |
| Elliott 1997 | Cancer pain management ‐ mean pain score/pain intensity (patient outcomes) Desired change: decrease |
Community outreach meetings and local TV (2/3 communities) | Unclear (6) | Pre: 11.1 (0.940) Post: 11.2 (0.961) Absolute change: 0.1 Percentage change: 0.9 |
Pre: 9.94 (0.954) Post: 10.9 (0.934) Absolute change: 0.96 Percentage change: 9.66 |
Patient outcomes: adjusted mean difference (change from baseline): 0.86 scale steps higher in the intervention group (P = 0.659) Note: in neither group did the pain scores decrease |
| Johnston 2007 | i) Rate of documented pain assessments ii) Analgesic administration rate iii) Non‐pharmacological strategies Desired change: increase |
One‐on‐one coaching based on audit with feedback and 'think‐aloud' interactions with an opinion leader | 141 (6) | i) Pre: 24% Post: 9% ii) Pre: 32.7% Post: 15.8% iii) Pre: 1.5% Post: 0.2% |
i) Pre: 15% Post: 58% ii) Pre: 32.1% Post: 36.2% iii) Pre: 5% Post: 16% |
Median adjusted RD (range): +0.21 (+0.123 to +0.58) (no P values) i) +0.58 ii) +0.21 iii) +0.123 Note: large differences between sites |
| Leviton 1999 | Patients receiving antenatal corticosteroids Desired change: increase |
Audit & feedback, chart reminders and grand rounds | 3239 (27) | Pre: 33.0% Post: 57.6% |
Pre: 32.9% Post: 68.3% |
+0.11 (P < 0.01*) |
| Lomas 1991 | Eligible women with previous history of caesarean section who (i) underwent a trial of labour and (ii) had vaginal birth Desired change: increase |
Distribution of educational material | 1972 (16) | i) Pre: N/A Post: 28.3% ii) Pre: N/A Post:14.5% |
i) Pre: N/A Post: 38.2% ii) Pre: N/A Post: 25.3% |
Median RD: +0.105 i) RD +0.10 ii) RD +0.11 (P value not reported due to unit of analysis error) |
| Majumdar 2008 | Osteoporosis care Eligible patients with osteoporosis and previous fracture who received bisphosphonate treatment within six months after fracture Desired change: increase |
Telephone education, OL endorsed guidelines and reminders | 272 (2 emergency clinics and 2 fracture clinics) |
Pre: N/A Post: 10/135 |
Pre: N/A Post: 30/137 |
+0.14 (P = 0.008) Note: None of the participants received bisphosphonate treatment at baseline. |
| McAlister 2009 | Patients with coronary heart disease whose statin management at 6‐month post‐ catheterisation was improved Desired change: increase |
Opinion Leader endorsed faxed evidence summaries | 480 (252 primary care practices) | Pre: N/A Post: 79/157 |
Pre: N/A Post: 99/165 |
+0.10 (P = 0.09 ) Note:Similar proportion of participants in both groups received statins (and standardised statin dose) at baseline |
| O'Connor 2009 | Care of people with diabetes i) HbA1c test rates ii) LDL test rates Desired change: increase |
Learning cases and opinion leader feedback | 1295 (18 clinics) | i) Pre: 90.9%: Post: 90.2% Change: ‐0.007 ii) Pre: 74.2% Post: 73.7% Change: ‐0.005 |
i) Pre: 89.6% Post: 88.2% Change: ‐0.014 ii) Pre: 70.2% Post: 72.1% Change: 0.019 |
Median adjusted RD: +0.0085 (NS) i) ‐0.007 (P = 0.63) ii) +0.024 (P = 0.15) |
| O'Connor 2009 | Patient outcomes i) HbA1c level ii) LDL level Desired effect: decrease |
i) Pre: 7.33 Post: 7.39 Absolute change: 0.06 increase Percentage change: 0.82 ii) Pre: 107 Post: 102.9 Absolute change: ‐4.1 decrease Percentage change: 3.83% |
i) Pre: 7.32 Post: 7.5 Absolute change: 0.18 increase Percentage change: 2.46 ii) Pre: 104.5 Post: 100.8 Absolute change: ‐3.7 decrease Percentage change: 3.54% |
Patient outcomes: adjusted mean difference (change from baseline): i) 0.12 units higher increase (P > 0.05) ii) 0.4 units lower decrease (P > 0.05) Both outcomes showed undesired effects HbA1c:: > 0.5% (5.5 mmol/moL) change in HbA1c is generally considered a clinically meaningful LDL cholesterol: we have not been able to find information on the minimum clinically important difference |
||
| Rebbeck 2006 |
Patient outcomes: Functional rating index (FRI) Note: A 10% absolute change is estimated to represent a minimally clinically important change. FRI Scale Estimates of Disability: 0 to 20% = minimal disability 21 to 40% = moderate disability 41 to 60% = severe disability 61% + = very severe disability |
Initial education by OLs, and follow‐up education. A one‐day (8‐hour) workshop. Local OLs were used to deliver some of the program content. A laminated copy of the algorithms outlining the process of care, appointment cards, and marketing material to be used for general practitioners who usually refer to the practice, a follow‐up educational outreach visit (2 hours) |
103 (27) | Pre: 23.9 (N = 28) Post: 12.0 (N = 26) Absolute change: ‐11.9 Percentage change: 49.8% |
Pre: 22.8 (N = 71) Post: 11.4 (N = 67) Absolute change: ‐11.4 Percentage change: 50.0% |
Patient outcomes: adjusted mean difference: ‐0.6 scale steps (95% CI: ‐7.8 to 6.6) higher decrease in FRI scores in the intervention group, P = 0.87, ICC: 0.31 |
| Rycroft‐Malone 2012 | Patient outcomes: Fluid fasting time (hours) Desired effect: decrease |
Web resource + OL + standard dissemination | 3505 (19) | Pre: 10.1 (95% CI 7.74 to 12.5) Post: 8.97 (95% CI 6.77 to 11.2) Absolute change: 1.16 (95% CI ‐0.64 to 2.95) Percentage change: 11.48 |
Pre: 8.83 (95% CI 7.27 to 10.4) Post: 8.25 (95% CI 6.92 to 9.58) Absolute change: 0.58 (95% CI ‐1.06 to 2.21) Percentage change: 6.57 |
Patient outcomes: adjusted mean difference (change from baseline): 0.58 hours lower reduction in fluid fasting time in the intervention group |
| Schectman 2003 | Total utilisation of clinical services and % of patients based on episode of care in baseline and intervention year ‐ reported as consistent with guidelines Desired change: increase |
Physician strategy combined use of OLs, small group educational sessions, and individual performance feedback utilising principles of academic detailing plus copy of guideline) | Unclear (14) | An absolute decline in compliant behaviour of 2.7% | An absolute increase in compliant behaviour of 5.4% | +0.081 (P = 0.04) |
| Simunovic 2010 | Patient outcomes: i) Local cancer re‐occurrence (%) ii) Permanent colostomy (%) Desired change: decrease |
Five surgeon‐directed components: workshops, OLs delivering intraoperative demonstrations, postoperative questionnaires and audit and feedback | 1015 (16) | i) Pre: N/A Post: 6.4% ii) Pre: N/A Post: 40.5% |
i) Pre: N/A Post: 6.5% ii) Pre: N/A Post: 39.1% |
Patient outcomes: unadjusted risk difference (RD): i) ‐0.001 ii) +0.014 |
| Sisk 2004 | Patient outcomes: Mothers' intention to breastfeed Desired change: increase |
Audit & feedback and printed educational material | Unclear (18) | Pre: N/A Post: N/A | Pre: N/A Post: N/A |
Patient outcomes: No difference in intention to breastfeed/ breastfeeding rate between groups (no numerical data provided) |
| Wright 2008 | Cancer care in stage II colon cancer i) mean number of lymph nodes assessed and ii) proportion of cases staged with a minimum of 12 lymph nodes Desired change: increase |
Academic detailing, toolkit and reminder package Both groups received a standardised lecture delivered by an expert opinion leader. |
> 616 (34) | i) Pre: 12.4 (9.5) Post: 14.9 (9.7) ii) Pre: 47.6% Post: 63.7% |
i) Pre: 14.3 (8.1) Post: 18.1 (10.2) ii) Pre: 61.7% Post: 75.6% |
‐0.022 i) not included in calculations (P = 0.54) ii) ‐0.022 (P = 0.99) Note: There was a significant increase in the mean number of lymph nodes assessed and the proportion of cases with 12 or more lymph nodes retrieved for both groups after the standardised lecture (P < 0.001) |
| *: P value reported by author Footnotes ECG: electrocardiogram; ED: emergency department; FRI: Functional Rating Index; HbA1c: Glycated haemoglobin; HCQIP: health care quality improvement program; ICC:Intensive Care Consortium; LDL: low‐density lipoprotein; OL: opinion leader; NA: not avalaible; NS: not significant; RD: risk difference | ||||||
Appendix 7. Evidence profiles from GRADEpro
SoF table 1. Main Comparison.
Local opinion leaders alone, or with a single or more intervention(s), compared to no intervention, a single intervention, or the same single or more intervention(s)
Certainty assessment of evidence for each outcome
| No of studies | Design | Risk of bias | Inconsistency | Indirectness | Imprecision | Other | Certainty (overall score) |
| Outcome: Compliance with evidence‐based practice | |||||||
| 18 | RCT | ‐1 | 0 | 0 | 0 | 0 | +3 Moderate |
| Outcome: Patient (dichotomous) outcomes (5 outcomes) | |||||||
| 3 | RCT | 0 | 0 | ‐1 | ‐2 | 0 | +1 Very low |
| Outcome: Costs | |||||||
| ‐ | ‐ | ‐ | ‐ | ‐ | ‐ | ‐ | ‐ |
1 We downgraded the certainty of evidence for the compliance outcomes one step due to high risk of bias (a majority of studies had high or moderate risk of bias).
2 We downgraded the certainty of evidence for the patient outcomes one step due to imprecision (fewer than 400 participating healthcare professionals, the effect varying across studies from a beneficial effect in one, to little or no effect in the other two, and, in addition, varying types of outcomes assessed in the studies).
3 We downgraded the certainty of evidence two steps due to indirectness (all three studies compared a multifaceted OL intervention with no intervention, which makes it difficult to separate out the effect of the OLs per se. Also one study evaluated surrogate outcomes i.e. breastfeeding rate instead of infant health outcomes).
* Eighteen of the 24 included studies (21 comparisons; 71 outcomes) contributed to the calculation of the median adjusted RD (ARD) for the main comparison (compliance with desired practice). The remaining six studies did not provide outcome data that could be included in the ARD calculations. Three studies reported in total 5 dichotomous patient outcomes.
Comparison 2. Local opinion leaders alone compared with no intervention
Certainty assessment of evidence for each outcome
| No of studies | Design | Risk of bias | Inconsistency | Indirectness | Imprecision | Other | Certainty (overall score) |
| Outcome: Compliance with evidence‐based practice | |||||||
| 5 | RCT | ‐1 | 0 | 0 | 0 | 0 | +3 Moderate |
| Outcome: Patient (dichotomous) outcomes | |||||||
| ‐ | ‐ | ‐ | ‐ | ‐ | ‐ | ‐ | ‐ |
| Outcome: Costs | |||||||
| ‐ | ‐ | ‐ | ‐ | ‐ | ‐ | ‐ | ‐ |
1 We downgraded the certainty of evidence for the compliance outcome one step due to high risk of bias (3 of 5 studies were at high risk of bias).
* Five of the 24 included studies (5 comparisons; 37 dichotomous outcomes) contributed to the calculation of the median adjusted RD (ARD).
Comparison 3. Local opinion leaders compared to a single intervention
Certainty assessment of evidence for each outcome
| No of studies | Design | Risk of bias | Inconsistency | Indirectness | Imprecision | Other | Certainty (overall score) |
| Outcome: Compliance with desired practice | |||||||
| 2 | RCT | 0 | 0 | 0 | ‐1 | 0 | +3 Moderate |
| Outcome: Patient (dichotomus) outcomes | |||||||
| ‐ | ‐ | ‐ | ‐ | ‐ | ‐ | ‐ | ‐ |
| Outcome: Cost | |||||||
| ‐ | ‐ | ‐ | ‐ | ‐ | ‐ | ‐ | ‐ |
1 We downgraded the certainty of evidence 1 step due to imprecision (fewer than 400 healthcare providers received the intervention).
* Two of the 24 included studies (2 comparisons; 3 dichotomous outcomes) contributed to the calculation of the median adjusted RD (ARD).
Comparison 4. Local opinion leaders, with a single or more intervention(s) compared to the same single or more intervention(s)
Certainty assessment of evidence for each outcome
| No of studies | Design | Risk of bias | Inconsistency | Indirectness | Imprecision | Other | Certainty (overall score) |
| Outcome: Compliance with evidence‐based practice | |||||||
| 5 | RCT | ‐1 | 0 | 0 | 0 | 0 | +3 Moderate |
| Outcome: Patient (dichotomous) outcomes | |||||||
| 1 | RCT | 0 | 0 | ‐1 | ‐1 | 0 | +2 Low |
| Outcome: Costs | |||||||
| ‐ | ‐ | ‐ | ‐ | ‐ | ‐ | ‐ | ‐ |
Compliance outcomes:
1 We downgraded the certainty of evidence one step due to high risk of bias.
* Five of the 24 included studies (five comparisons; 12 dichotomous outcomes) contributed to the calculation of the median adjusted RD (ARD).
Comparison 5. Local opinion leaders plus a single or more intervention(s) versus no intervention
Certaity assessment of evidence for each outcome
| No of studies | Design | Risk of bias | Inconsistency | Indirectness | Imprecision | Other | Certainty (overall score) |
| Outcome: Compliance with evidence‐based practice | |||||||
| 10 | RCT | ‐1 | 0 | 0 | 0 | 0 | +3 Moderate |
| Outcome: Patient outcomes‐ the same as in the main comparison | |||||||
| ‐ | ‐ | ‐ | ‐ | ‐ | ‐ | ‐ | ‐ |
| Outcome: Costs | |||||||
| ‐ | ‐ | ‐ | ‐ | ‐ | ‐ | ‐ | ‐ |
1 We downgraded the certainty of evidence one step due to indirectmess (as the OL intervention was one of many interventions)
Fifteen of the 24 included studies (10 comparisons; 20 dichotomous outcomes) contributed to the calculation of the median adjusted RD (ARD) .The same three trials as in the main comparison reported five dichotomous patient outcomes.
Characteristics of studies
Characteristics of included studies [ordered by study ID]
Althabe 2008.
| Methods |
Study design: Cluster‐randomised trial with hospitals as the unit of randomisation Unit of analysis: hospitals Sample size calculation: "The sample size was based on the hospital as the unit of analysis. On the assumption of a rate of episiotomy of 42% at baseline, with a standard deviation of 15%, we needed 18 hospitals (9 intervention and 9 control) to identify a decrease in the episiotomy rate from 40% to 20% (with a two‐sided test at a 0.05 significance level and 80% power). That sample size would provide a power of more than 95% to identify an increase in the rate of oxytocin use from 10% to 50% and a power of more than 80% to identify a reduction in the rate of postpartum haemorrhage of at least 500 mL from 15% to 8%. To allow for hospitals to drop out or to be excluded before randomisation, we collected baseline data from 24 hospitals." |
|
| Participants |
Providers: 53 birth attendants: Intervention: N = 27 (13‐47); Control: 26 (17‐43) Participants (patients):: Total N: 4299 women with vaginal delivery; Intervention: N = 2114; Control: N = 2185 at 12 months after the intervention Setting: 19 public maternity hospitals; Intervention: N = 10; Control: N = 9 Country: Argentina and Uruguay Type of targeted behaviour: general management of a problem (obstetrical care) |
|
| Interventions |
Description of the intervention: local OLs + interactive workshops + training of manual skills + one‐to‐one academic detailing visits with birth attendants + reminders and feedback "The teams then disseminated the guidelines, trained and visited birth attendants, and developed reminders to be placed in labor and delivery wards, inside surgical packages for birth attendants, and on clinical records. The teams also produced monthly reports on rates of use of episiotomy and prophylactic oxytocin based on hospital clinical data. Regional coordinators met monthly with each team to assess completion of the activities. Each intervention hospital received a computer with intervention materials installed on it, copies of the guidelines, the WHO Reproductive Health Library and BMJ Clinical Evidence." Method of OL identification: sociometric OL training: the OL teams all received a 5‐day workshop to develop and disseminate the guidelines."The workshops focused on critical evaluation of the medical literature, development of clinical practice guidelines, communication skills, and methods of conducting one‐on‐one academic detailing visits with hospital birth attendants to discuss their views regarding implementation of the intervention at the hospital. After returning to their respective hospitals, the teams participated in 1‐day workshops to develop their training skills". Proportion of social network that nominated OL: unclear OLs (single or teams): teams of three to six birth attendants (resident physicians, staff and head obstetrician and midwifes) OL disseminated information: informal (one‐to‐one teaching), formal (academic detailing, dissemination of guidelines) OL frequency of involvement: unclear Control: standard care Duration of intervention: 18 months Funding: “Supported by grants from the Eunice Kennedy Shriver National Institute of Child Health and Human Development (U01 HD40477 and U01 HD40636) and the Bill and Melinda Gates Foundation within the Global Network for Women’s and Children’s Health Research, as well as the National Institutes of Health Fogarty International Center (D43 TW005492) and Clinical Nutrition Research Center (DK 56350) and the Pan American Health Organization”. |
|
| Outcomes |
Primary outcomes:
Other outcomes:
Follow‐up: the primary outcomes were assessed at the end of the 18 months intervention, and 12 months after the end of the intervention. |
|
| Notes | * Sample size calculation was based on these outcomes. | |
| Risk of bias | ||
| Bias | Authors' judgement | Support for judgement |
| Random sequence generation (selection bias) | Low risk | pg 1930/col 2/para 2 "A balanced randomisation procedure ensured that the intervention and control hospitals were balanced with respect to the rates of prophylactic use of oxytocin and episiotomy, the presence or absence of residency programmes, the country and region where the hospital was located, and the annual number of births at the hospital. Of 184,756 possible ways of assigning hospitals to the intervention and control groups with acceptable balance, one sequence was randomly selected to determine the composition of the two groups." |
| Allocation concealment (selection bias) | Low risk | pg 1930/col 2/para1 The design was a cluster‐randomised trial, with hospitals as the randomisation unit. |
| Baseline outcome measurements similar | Low risk | pg 1933/col 2/table 1 "The groups were similar with respect to maternal characteristics, rates of prophylactic use of oxytocin and episiotomy, and prevalence of low‐birth‐weight infants". |
| Baseline characteristics similar | Low risk | pg 1933/col 2/table 1 "The characteristics of the hospitals and delivery staff were similar in the two groups". |
| Blinding (performance bias and detection bias) All outcomes | Unclear risk | No information in the paper |
| Incomplete outcome data (attrition bias) All outcomes | Low risk | "Data were missing for less than 0.2% of births." Intention‐to‐treat analysis was applied. |
| Protection against contamination | Low risk | Allocation by hospital |
| Selective reporting (reporting bias) | Low risk | Results for all outcomes listed in the methods section were reported in the results section. |
| Other bias | Low risk | No other risk of bias identified |
Berner 2003.
| Methods |
Study design: Cluster‐randomised trial, with hospitals as the unit of randomisation Unit of analysis: hospitals Sample size calculation: no |
|
| Participants |
Providers: 21 groups/clusters of physicians (family practitioners, general internists, cardiologists, emergency medicine physicians) Participants (patients): 2210 patients with unstable angina Setting: 21 hospitals; OL intervention + HCQIP: N = 7; HCQIP: N = 8; Control (no intervention): N = 6 Country: USA Type of targeted behaviour: general management of a problem (appropriate care for patients with unstable angina) |
|
| Interventions |
Description of the interventions: 1. Local OLs + Audit & Feedback; 2. Audit & Feedback
Method of OL identification: sociometric
Proportion of social network that nominated OL: unclear
OLs (single or teams): single OL physician OL disseminated information: formal (conferences, educational material); informal: unclear OL frequency of involvement: unclear Control: standard dissemination/no intervention Duration of intervention: unclear Funding: supported by grant number HS08843 from the Agency for Healthcare Research and Quality and conducted in cooperation with the Alabama Quality Assurance Foundation and the Centers for Medicare and Medicaid Services. This material was prepared by Alabama Quality Assurance Foundation under a contract with the Centers for Medicare & Medicaid Services (CMS). |
|
| Outcomes | Main outcome variable was change in percentage compliant to guidelines and eligible participants with unstable angina who received:
Note: The hospitals could chose which quality of care indicators to target. Follow‐up: 9 months (beginning three months after the orientation sessions) |
|
| Notes | ||
| Risk of bias | ||
| Bias | Authors' judgement | Support for judgement |
| Random sequence generation (selection bias) | Unclear risk | pg 422 /col1/para.3/line 9‐14 “Using a restricted randomisation procedure based on hospital bed size, we randomly assigned the participating hospitals to one of the three intervention groups”. |
| Allocation concealment (selection bias) | Low risk | It was a cluster‐randomised trial, with the hospital as the unit of randomisation. |
| Baseline outcome measurements similar | Low risk | pg 427/fig 1 |
| Baseline characteristics similar | High risk | pg 425 /col1/para 2/line 1‐14 “Fewer control hospitals were large and teaching hospitals than either of the intervention group hospitals, and more of the hospitals that declined to participate were small and rural”. Pg 427/table 2 “For patients, the racial and gender distribution and receipt of cardiac consultation was similar across the three groups. pg 426/table 1 |
| Blinding (performance bias and detection bias) All outcomes | Unclear risk | No information in the paper |
| Incomplete outcome data (attrition bias) All outcomes | Unclear risk | No information in the paper |
| Protection against contamination | Low risk | Randomisation was by hospital. |
| Selective reporting (reporting bias) | Low risk | Results were presented for all outcomes mentioned in the methods section. |
| Other bias | High risk | pg 422/col 1/para 3 Only fewer than half of eligible hospitals agreed to participate which creates a greater risk of selection bias since the hospitals that declined to participate were different from the others (small and rural). |
Cabana 2006.
| Methods |
Study design: Cluster‐randomised trial, with randomisation by site (region) Unit of analysis: parents of asthma children. "We calculated the intra cluster correlation and found that the values were close to 0 (0.024 at the physician level; 0.003 at the site level), suggesting negligible clustering. However, because there may be clustering at other levels simultaneously, we included an over dispersion parameter in the logistic and Poisson regression analyses to allow for more robust estimates." Sample size calculation: no |
|
| Participants |
Providers: 101 primary care providers (99 paediatricians, 1 family physician, and 1 nurse practitioner). Intervention: N = 53; Control: N = 48. Eight percent of the 1219 primary care providers in 10 regions agreed to participate. Participants (patients):: 870 children with asthma (and their parents) were randomly assigned to: Intervention group: N = 418, Control group: N = 452. Setting: primary care practices in 10 regions (Corpus Christi, Texas; Fresno/Bakersfield, California; Nashville, Tennessee; Jacksonville, Florida; Omaha, Nebraska; St Paul, Minnesota; Kent County, Michigan; New Castle County, Delaware; Columbus, Ohio; and Indianapolis, Indiana); unknown number of practices Country: USA Type of targeted behaviour: General management of a clinical problem (appropriate asthma care) |
|
| Interventions |
Description of the intervention: Local OLs + continuing medical education programme (Physician Asthma Care Education ‐ PACE). The programme consisted of: two interactive seminar sessions that reviewed national asthma guidelines, communication skills, and key educational messages. Format included short lectures, case discussions, and a video modelling communication techniques. Assessment of barriers to change: The PACE intervention was designed to address barriers to asthma education described by primary care physicians (e.g. perceived poor reimbursement for patient education, low outcome expectancy regarding patient performance). Method of OL identification: Two methods were used: informative method and self‐designation method. Proportion of social network that nominated OL: unclear OLs (single or teams): a team consisting of a primary care paediatrician, a paediatric subspecialist (board‐certified pulmonologist or allergist), and a behavioural scientist/health educator OL disseminated information: Formal: PACE programme, 2 X 2.5 hours interactive seminars OL frequency of involvement: 2 X 2.5 hours performed within a weeks time Control: no intervention. Control community physicians received training once collection of evaluation data was collected. Duration of the intervention: one week Funding: "The effectiveness trial was funded by the Robert Wood Johnson Foundation (Princeton, NJ) and based on an earlier efficacy trial (MD/Family Partnership: Education in Asthma Management; grant HL‐44976) funded by the Lung Division of the National Heart, Lung, and Blood Institute of the National Institutes of Health”. |
|
| Outcomes |
Follow‐up: 12 months after the seminar |
|
| Notes | Reimbursement: Participating clinicians received 5 CME credits for attending the programme, a certificate, and $50.00 honorarium per year for participating in the study. | |
| Risk of bias | ||
| Bias | Authors' judgement | Support for judgement |
| Random sequence generation (selection bias) | Low risk | Providers: pg 2155/col 2/para 2 "We matched each of the 10 sites into 5 similar pairs on the basis of population, asthma prevalence, percentage of the population that is Hispanic and/or black, climate, and managed care penetration in the health care market. Within each pair, using a coin toss, we randomly selected 1 site as a control and 1 site for the intervention." Patients: pg 2155/col 2/para 4 "Each study physician provided a list of their paediatric asthma patients. From these lists, we developed a registry of 3368 patients. From the 3368 patients, using a random‐number generator, we randomly selected 2300 patients (only 1 child per family) to be contacted to recruit a final sample of more than 1000 patients." |
| Allocation concealment (selection bias) | Low risk | It was a cluster‐randomised trial, with randomisation by site (region). |
| Baseline outcome measurements similar | Low risk | pg 2153 and 2554/table 1 and 3. Analyses were adjusted for baseline differences. |
| Baseline characteristics similar | Low risk | pg 2153/table 1 and pg 2154/table 1 The characteristics of the providers, the patients, the survey respondents, and households in the control and intervention groups were similar (Tables 1 and 2) and suggested that the randomisation was successful. |
| Blinding (performance bias and detection bias) All outcomes | Low risk | pg 2151/col 1/para 3 "Patients and their parents were blind to physicians involvement in the intervention. Physicians were blinded to which patients were selected for the survey." |
| Incomplete outcome data (attrition bias) All outcomes | Low risk | We completed follow‐up telephone interviews with the parents of 731 of the 870 patients (84%). 363 of 418 (86.4%) intervention patients and 368 of 452 (81.4%) control patients completed follow‐up. |
| Protection against contamination | Low risk | Randomisation was by site. |
| Selective reporting (reporting bias) | Low risk | Results were presented for all outcomes mentioned in the methods section. |
| Other bias | Unclear risk | Only a total of 101 (8%) of the 1219 primary care providers invited to the study agreed to participate. |
Elliott 1997.
| Methods |
Study design: Cluster‐randomised trial, the community was the unit of randomisation. Unit of analysis: patients Sample size calculation: no |
|
| Participants |
Providers: physicians: N = 167 (73% primary care specialists, 22% surgeons, 5% medical subspecialists) and nurses: N = 177 (75% hospital setting) Participants (patients):: 438 patients with cancer Setting: 6 communities: Intervention: N = 3; Control: N = 3 Country: USA Type of targeted behaviour: general management of a clinical problem (appropriate cancer pain management) |
|
| Interventions |
Description of the Intervention: Local OLs + community outreach meetings + local TV programme (2/3 communities)
Method of OL identification: sociometric
Proportion of social network that nominated OL: unclear OLs (single or teams): teams of clinicians, unclear number OL disseminated information: informal & formal (conferences, educational material) OL frequency of involvement: unclear Control: standard dissemination Duration of intervention: 15 months Funding: "This study was supported by a U.S. Public Health Service grant from the National Cancer Institute of Health, Betheseda, MD." |
|
| Outcomes |
Primary outcome:
Other outcomes:
Follow‐up: 15 months after randomisation |
|
| Notes | ||
| Risk of bias | ||
| Bias | Authors' judgement | Support for judgement |
| Random sequence generation (selection bias) | Unclear risk | pg 193/col 1/para 2 "Three pairs of communities were matched according to the selection criteria. Within each pair, one was randomly assigned to the intervention condition and the other to the control condition." |
| Allocation concealment (selection bias) | Low risk | It was a cluster‐randomised trial, with the community as the unit of randomisation. |
| Baseline outcome measurements similar | Unclear risk | Table 2 and 3 |
| Baseline characteristics similar | Low risk | pg 197/col1/para 1 The six communities recruited into the study were similar in several key characteristics as follows: population (mean 32,000), number of practicing physicians (mean, 56), and miles distant from Minneapolis ‐ St. Paul (mean, 129). There were no significant differences in variables of interest between the six communities at baseline. |
| Blinding (performance bias and detection bias) All outcomes | Unclear risk | Not mentioned in the paper. All outcomes were either provider‐ or patient‐reported. |
| Incomplete outcome data (attrition bias) All outcomes | Unclear risk | 85.5% of physicians and 86.2% of nurses completed follow‐up. Unclear how the losses to follow‐up were divided between groups. |
| Protection against contamination | Low risk | Randomisation was done at the community level. |
| Selective reporting (reporting bias) | Low risk | Results for all outcomes described in the methods section were presented in the result section. |
| Other bias | Low risk | No other risk of bias identified |
Guadagnoli 2000.
| Methods |
Study design:Cluster‐randomised trial, the hospital was the unit of randomisation. Unit of analysis: hospitals Sample size calculation: no |
|
| Participants |
Providers: 186 surgeons (in pre‐intervention period). Note: 300 individuals form various disciplines attended the OL meetings. Participants (patients):: 2314 patients with breast cancer Setting: 28 academic/community hospitals; Intervention: N = 18, Control: N = 10 Country: USA Type of targeted behaviour: general management of a clinical problem (appropriate care for patients with breast cancer) |
|
| Interventions |
Description of the Intervention: Local OLs + performance feedback
Method of OL identification: sociometric
Proportion of social network that nominated OL: 50% OLs (single or teams): single OL surgeon OL disseminated information: Formal: grand rounds & dissemination of graphical material. Informal: unclear OL frequency of involvement: unclear Control: performance feedback (distributing performance reports that contained data on the outcomes of interest) Duration of intervention: 10 months Funding: "This research was supported by grants (CA59408 and CA57755) from the National Cancer Institute.“ |
|
| Outcomes |
Primary outcomes:
Other outcomes:
Follow‐up: 12 months after the end of the intervention |
|
| Notes | ||
| Risk of bias | ||
| Bias | Authors' judgement | Support for judgement |
| Random sequence generation (selection bias) | Unclear risk | Pg 172/col 2/para 2 Hospitals in Minneapolis and St.Paul were assigned as clusters to separate treatment groups because cross‐over from one city to the other did not occur. Hospitals outside the metropolitan area and affiliated with a metropolitan hospital were assigned to the metropolitan hospital cluster, the without affiliations were randomly assigned to a hospital cluster. We randomly assigned a cluster of 18 hospitals to the OL intervention and a cluster of 10 hospitals to the performance feedback group. |
| Allocation concealment (selection bias) | Low risk | It was a cluster‐randomised trial, with the hospital as the unit of randomisation. |
| Baseline outcome measurements similar | Unclear risk | No information in the paper |
| Baseline characteristics similar | Low risk | pg 173/col 2/para 2 The characteristics of patients treated at experimental and control hospitals were comparable. |
| Blinding (performance bias and detection bias) All outcomes | Unclear risk | No information in the paper |
| Incomplete outcome data (attrition bias) All outcomes | Unclear risk | No information in the paper |
| Protection against contamination | Low risk | Randomisation was done at the hospital level. |
| Selective reporting (reporting bias) | Unclear risk | The outcomes reported in the results section were not described in the methods section. |
| Other bias | Low risk | No other risk of bias identified |
Hodnett 1996.
| Methods |
Study design: Cluster‐randomised trial, with the hospital as the unit of randomisation. Unit of analysis: hospitals Sample size calculation: no |
|
| Participants |
Providers: 20 groups of nurses Participants (patients): obstetric patients. The number of annual births at each hospital in fiscal year 1990 ranged from 1106 to 4969 (M = 2529.6, SD = 967.9). Setting: 20 hospitals (17 community and 3 tertiary teaching hospitals); Intervention group: N = 10; Control group: N = 10 Country: Canada Type of targeted behaviour: general management of a clinical problem (decreased rate of epidural anaesthesia). |
|
| Interventions |
Description of the Intervention: Local OLs/Education influentials (EIs) "EIs and managers reported that they used a variety of methods to increase colleagues’ labor support; the modal number of different methods reported by EIs was 5 (range = 3‐8) and by managers, 6 (range = 2‐6). In keeping with the need to tailor activities to local norms, there was considerable variation in the strategies used. At one hospital, the EIs and manager reported that they removed comfortable chairs from the nursing station and placed them in the labor rooms. At four hospitals, the EIs conducted surveys of patients and staff and chart audits. Other strategies included play‐acting and role modelling. Informal, spontaneous small‐group interactions were viewed as the most successful change strategies by the majority of EIs (n = 16), whereas formal presentations and distributing printed materials were judged to be the least successful methods (n = 15)." Method of OL identification: sociometric Proportion of social network that nominated OL: unclear OLs (single or teams): teams of nurses (in hospitals where teams of nurses rotated shifts together, one nurse was allowed per team. Two hospitals had four OLs, two hospitals had three, and six hospitals had two) OL disseminated information: unclear OL frequency of involvement: the majority of OLs (62%) at nine hospitals reported that they worked on trial activities on every shift (10 OLs ) or weekly (6 OLs ). Nurses at the remaining hospital reported only monthly participation in trial activities. Control: standard dissemination Duration of intervention:12 months Funding: “This trial was funded by a grant from the National Health Research and Development Program, Health Canada, Ottawa.“ |
|
| Outcomes |
Primary outcome:
Follow‐up: 18 months after the first workshop |
|
| Notes | ||
| Risk of bias | ||
| Bias | Authors' judgement | Support for judgement |
| Random sequence generation (selection bias) | Low risk | pg 16/col 1/para 2 "Using computer generated random allocation performed by a statistician with no knowledge of the hospitals 10 hospitals were allocated to the control group and 10 to the experimental group." |
| Allocation concealment (selection bias) | Low risk | This was a cluster‐randomised trial, with the hospital as the unit of randomisation.. |
| Baseline outcome measurements similar | Unclear risk | No baseline measures of outcomes |
| Baseline characteristics similar | High risk | There were significant between hospital differences. |
| Blinding (performance bias and detection bias) All outcomes | Unclear risk | No information in the paper |
| Incomplete outcome data (attrition bias) All outcomes | Low risk | Not mentioned in the paper. However, should be complete as all data were retrieved from patient records, by two research assistants. |
| Protection against contamination | Low risk | The hospital was the unit of allocation. |
| Selective reporting (reporting bias) | Low risk | Results for all outcomes mentioned in the methods section were presented in the results section. |
| Other bias | Low risk | No other risk of bias identified |
Hong 1990.
| Methods |
Study design: Cluster‐randomised trial, with the ward as the unit of randomisation Unit of analysis : the nurse Sample size calculation: no |
|
| Participants |
Providers: 220 nurses; OL + lecture: 72; OL: 73; Lecture: 75 Participants (patients): unclear no of inpatients with a urinary catheter Setting: 6 medical & surgical wards in one teaching hospital; OL + lecture: N = 2; OL; N = 2; Lecture: N = 2 Country: China (Hong Kong) Type of targeted behaviour: general management of a problem (appropriate urinary catheter practices) |
|
| Interventions |
Description of the Intervention: 1. Local OLs + standardised 30‐minute lectures; 2. Local OLs (small group tutorials)
Method of OL identification: informant
Proportion of social network that nominated OL: N/A OLs (single or teams)::teams consisting of a staff nurse + a nursing officer OL disseminated information: formal (small group demonstration tutorials) OL frequency of involvement: unclear Control: standardised 30‐minute lectures Duration of intervention: the duration of the small group tutorials (maximum half a day) Funding: no information. |
|
| Outcomes |
Primary outcomes:
Follow‐up: 2 months after the education programme |
|
| Notes | ||
| Risk of bias | ||
| Bias | Authors' judgement | Support for judgement |
| Random sequence generation (selection bias) | Low risk | pg 210/para 3 "The three male medical and three female surgical wards in the hospital were divided by a random draw into three groups." |
| Allocation concealment (selection bias) | Low risk | It was a cluster‐randomised trial, with the ward as the unit of allocation. |
| Baseline outcome measurements similar | Low risk | pg 213/table 1 |
| Baseline characteristics similar | Low risk | pg 213/table 1 |
| Blinding (performance bias and detection bias) All outcomes | Unclear risk | No information in the paper |
| Incomplete outcome data (attrition bias) All outcomes | Unclear risk | No information in the paper |
| Protection against contamination | Low risk | Randomisation was made at the level of the wards. |
| Selective reporting (reporting bias) | Low risk | Results reported for all outcomes listed in the methods section |
| Other bias | Low risk | No other risk of bias identified |
Johnston 2007.
| Methods |
Study design: Cluster‐randomised trial; with hospital the unit of randomisation Unit of analysis: hospitals Sample size calculation: no |
|
| Participants |
Providers:141 paediatric nurses Participants (patients): 464 paediatric inpatients (1602 chart records audited) Setting: 6 university‐affiliated paediatric hospitals/pavilions; Intervention: N = 3; Control: N = 3 Country: Canada Type of targeted behaviour: To change attitudes and knowledge about pain in children and improve pain practices, specifically assessment and management by paediatric nurses with paediatric inpatients |
|
| Interventions |
Description of the Intervention: "A 2‐day workshop that focused on the coaching session interactions was given to the coaches. The process of interactions during the coaching sessions was to use information from the nurses' audit and a think aloud strategy to assist the nurses in explaining why a particular action or non‐action was taken. Based on what was expressed, the coach would provide evidence‐based information. A resource kit was developed at each site for the coach to use as a reference both for herself or himself and the participating nurses. The resource material was reviewed during the training workshop with the coaches. After the training of the coaches, a schedule was set at each site to have a coaching session every 2 weeks. Audits began at the experimental sites and continued until every nurse received at least 10 coaching sessions. Two weeks after the audits began, the coaches met with the nurses. Investigators of the research team were also available for consultation."
Method of OL identification: the investigators affiliated with the intervention hospitals met with nursing education departments and pain services to identify coaches. Individuals were eligible to be coaches if they were (1) respected by peers, (2) viewed as a leader, (3) knowledgeable about pain in children, (4) interested in research, and (5) able to be released from their usual position to take a part‐time role as a coach (judge's rating).
Proportion of social network that nominated OL: N/A OLS (single or teams): single OL OL disseminated information: a resource kit, audit information OL frequency of involvement: at least 10 OL coaching sessions per nurse (up to 12) Control: monthly audits, with four audits per nurse for the duration of the time that the partnered site was undergoing the intervention Duration of intervention: approximately 20 weeks (one coaching session every two weeks); 18 months study period Funding: "This study was made possible with the support of the Canadian Institutes of Health Research through Grant No. MOP‐37885. Career support to CJ was provided by the James McGill Chair Program, and that to AG was provided by Fonds de la Recherche en Santé du Québec." |
|
| Outcomes |
Follow‐up: 18 months after randomisation |
|
| Notes | NOTE: The coaches/OLs were trained to start with assessment and to move into focusing on management when 75%–80% of a nurse's patients had documented assessments. However, only one of the three coaching sites reached an overall assessment rate level of 80%, so it is likely that the coaches did not move into management as much as they did into assessment. | |
| Risk of bias | ||
| Bias | Authors' judgement | Support for judgement |
| Random sequence generation (selection bias) | Low risk | pg 469, col.2, para.3 QUOTE: "Based on the average percentage of pain documentation in the medical records, hospitals were matched into pairs and a coin toss determined which hospital in each pair would be in the experimental group". |
| Allocation concealment (selection bias) | High risk | A coin toss does not conceal the allocation. In this cluster‐randomised trial, not all nurses agreed to participate and of an eligible pool of 464 nurses (at the 6 participating hospitals randomised), 141 consented to participate, for a rate of 30% .The range per site varied considerably from 17% to 68%. |
| Baseline outcome measurements similar | Unclear risk | No statistical comparison of baseline outcome measures reported |
| Baseline characteristics similar | High risk | No baseline characteristics reported for the control and intervention groups separately. The proportion of nurses who agreed to participate per site varied considerably from 17% to 68%. |
| Blinding (performance bias and detection bias) All outcomes | High risk |
Outcome group: pain assessment, analgesic distribution and non‐pharmacological pain management The participating nurses could not be blinded to the intervention, which is why the overall risk of bias due to non‐blinding was judged to be high. It can be noted that the auditors did not know if the hospital was in the experimental group or the control group in that there were different auditors for each site, with the exception of two sites, both of which were experimental. Although the auditors in the experimental site knew that they were providing information to the coach on a biweekly basis, they were not aware that there were control sites. The control site auditors did not know that there were experimental sites as they were requested to monitor pain practices in that site. |
| Incomplete outcome data (attrition bias) All outcomes | High risk | 51 of the 141 (35%) nurses were lost to follow‐up, unclear from which group.The attrition rates ranged from 18% to 53% across sites. |
| Protection against contamination | Low risk | Hospitals the unit of randomisation |
| Selective reporting (reporting bias) | Low risk | Results reported for all outcomes mentioned in the methods section |
| Other bias | Unclear risk | Risk of selection bias since only 30% of eligible nurses agreed to participate, and it was unclear if they were different from the nurses who declined participation. |
Leviton 1999.
| Methods |
Study design: Cluster‐randomised trial, with the hospital as the unit of randomisation. Unit of analysis: hospitals (and the patients) Sample size calculation: no |
|
| Participants |
Providers: 27 groups/clusters of obstetricians, number not known Participants (patients):: women with preterm delivery; 6798 discharge abstracts Setting: 27 tertiary care hospitals. (one hospital withdrew post randomisation); Intervention: N = 13; Control: N = 14 Country: USA Type of targeted behaviour: general management of a clinical problem (appropriate use of corticosteroids for foetal maturation) |
|
| Interventions |
Description of the Intervention: local OLs + audit & feedback + chart reminder + clinical guideline + grand rounds.
Method of OL identification: informant
Proportion of social network that nominated OL: N/A OLs (single or teams): teams of two persons (one nurse + one physician) OL disseminated information: audit & feedback + chart reminder + clinical guideline OL frequency of involvement: unclear Control: standard dissemination of clinical guideline Duration of intervention: 12 months Funding: "This study was supported by the Patient Outcomes Research Team on Low Birth‐weight Contract 290‐92‐0055 from the Agency for Healthcare, Policy and Research, Rockville, Md". |
|
| Outcomes |
Primary outcome:
Follow‐up: 12 months after the start of the intervention |
|
| Notes | ||
| Risk of bias | ||
| Bias | Authors' judgement | Support for judgement |
| Random sequence generation (selection bias) | Low risk | Pg 47/col 3/para 2 We assigned hospitals by random number table either to the active dissemination (N = 13) or usual dissemination control (N = 14) group. |
| Allocation concealment (selection bias) | Low risk | It was a cluster‐randomised trial, with the institution as the unit of randomisation. |
| Baseline outcome measurements similar | Low risk | Pg 50/table 1 |
| Baseline characteristics similar | Low risk | Pg 49/col 3/para 2 There were no baseline differences between intervention and control hospitals for the following characteristics: geographic region, median number of active obstetricians, births per hospital, NICU beds, percentage of Medicaid patients, race, PROM diagnosis, GA, and indicated deliveries. Hospital characteristics were generally the same in both the NPIC and AECOM hospitals. A difference between intervention and control cases in the frequency of abnormal foetal conditions or foetal distress was significant at the patient level due to the large sample size. |
| Blinding (performance bias and detection bias) All outcomes | High risk | pg 47/col 3/para 2 and pg 48/col 1/para 1 "The study was not blinded because physicians in the active dissemination condition were aware of the situation, and the leadership of all hospitals were aware of the condition of assignment". |
| Incomplete outcome data (attrition bias) All outcomes | Unclear risk | No information in the paper |
| Protection against contamination | Low risk | Pg 47/col 2/para 1 "To avoid diffusion of the active dissemination treatment to the control group, the unit of randomisation was the hospital." |
| Selective reporting (reporting bias) | Low risk | Results for all outcomes listed in the methods section presented in the results section |
| Other bias | Low risk | No other risk of bias identified |
Lomas 1991.
| Methods |
Study design: Cluster‐randomised trial, with hospitals the unit of randomisation. Sample size calculation: no |
|
| Participants |
Providers: 76 physicians (family physicians & obstetricians): Intervention:(OL) N = 19; Intervention (A&F): N = 19; Control; N = 38 Participants (patients): 3552 charts of obstetric patients Setting: 16 community hospitals: Intervention (OL): N = 4; Intervention (A&F): N = 4 and Control: N = 8 Country: Canada Type of targeted behaviour: general management of a clinical problem (improved obstetric care) |
|
| Interventions |
Description of the intervention: 1. Local OLs + distribution of educational materials; 2. Audit & feedback + distribution of educational material
Method of OL identification: sociometric
Proportion of social network that nominated OL: 65% OLs (single or teams): single OL OL disseminated information: informal & formal OL frequency of involvement: action taken at least at three distinct points in time + one: unclear Control: distribution of educational material Duration of intervention: 12 months Funding: "This research was supported by a grant from the National Health Research and Development Programme of Health and Welfare Canada. Mr Lomas receives support as a career scientist from the Ontario Ministry of Health." |
|
| Outcomes |
Primary outcomes:
Follow‐up: 24 months after randomisation |
|
| Notes | ||
| Risk of bias | ||
| Bias | Authors' judgement | Support for judgement |
| Random sequence generation (selection bias) | Unclear risk | pg 2202/col 1/para 1 "we first randomly selected and assigned 16 eligible counties to one of the intervention or the control group. One eligible hospital was then randomly selected from each county to receive an invitation to participate in its assigned study group." |
| Allocation concealment (selection bias) | Low risk | It was a cluster‐randomised trial, with the community hospitals the unit of randomisation. |
| Baseline outcome measurements similar | Low risk | pg 2205/col 1/para 1, pg 2205/table 1 There were no significant differences for baseline outcome measures. |
| Baseline characteristics similar | Low risk | pg 2205/col 1/para 1, pg 2205/table 1 There were no significant differences for baseline characteristics. |
| Blinding (performance bias and detection bias) All outcomes | Unclear risk | No information in the paper |
| Incomplete outcome data (attrition bias) All outcomes | Unclear risk | No information in the paper |
| Protection against contamination | Low risk | pg 2202/col 1/para 1 "the unit of randomisation and intervention was the community hospital." |
| Selective reporting (reporting bias) | Low risk | Results for all outcomes described in the methods section were presented in the results section. |
| Other bias | Low risk | No other risk of bias identified |
Majumdar 2007.
| Methods |
Study design: Cluster‐randomised trial, with the healthcare professional as the unit of randomisation Sample size calculation: with a 20% intervention‐related increase in the primary outcome as the effect size, setting ą error at .05 (2‐sided) and β error at .20, a minimal sample size of 140 was estimated. To allow for losses, one secondary analysis, and the possibility of a small design effect associated with statistical clustering, we adjusted the sample size to 160 patients. |
|
| Participants |
Providers: 769 primary care physicians were randomised but only 128 physicians contributed any patients. Participants (patients): 171 patients with heart failure (HF) and Ischaemic heart disease (IHD): Intervention: N = 87 (29 HF and 58 IHD); Control: N = 84 (26 HF and 59 IHD) Setting: one large health system Country: Canada Type of targeted behaviour: general management of a clinical problem (improved prescribing for HF and IHD) |
|
| Interventions |
Description of the intervention: one page evidence summaries generated and endorsed by OLs Method of OL identification: sociometric Proportion of social network that nominated OL: 30% of 788 physicians who were faxed a one‐page sociometric questionnaire that asked them to nominate physicians who best matched validated descriptions of OLs. OLs (single or teams): teams of five physicians (3 cardiologists, 2 general internists, none was a university based academic cardiologist) OL disseminated information: formal (faxed evidence summaries) OL frequency of involvement: one action taken at one time point (most physicians received only one faxed evidence summary) Control: standard care (the patients most recent medication profile was faxed to the physician) Duration of intervention: 6 months Funding: "This study was supported by grants from the AHFMR (Alberta Heritage Foundation for Medical Research; Edmonton, Alberta, Canada) and the Institute of Health Economics. Drs Majumdar and McAlister received salary awards from the AHFMR and the Canadian Institutes of Health Research (Ottawa, Ontario, Canada). Drs McAlister and Tsuyuki are supported by the Merck Frosst/Aventis Chair in Patient Health Management." |
|
| Outcomes |
Primary outcomes:
Secondary outcomes:
Follow‐up: 6 months after enrolment |
|
| Notes | * Sample size calculation was based on this outcome. | |
| Risk of bias | ||
| Bias | Authors' judgement | Support for judgement |
| Random sequence generation (selection bias) | Low risk | pg 22.e2/col 2/para 5 "Simple randomisation with concealment of allocation was performed at the level of the physician before patient recruitment started with the use of a computer‐generated sequence." |
| Allocation concealment (selection bias) | Low risk | pg 22.e2/col 2/para 5 "Simple randomisation with concealment of allocation was performed at the level of the physician before patient recruitment started with the use of a computer‐generated sequence." "Each physician was randomly allocated to the HF intervention or to HF control; physicians allocated to the HF intervention were automatically assigned to IHD control and vice versa." |
| Baseline outcome measurements similar | Low risk | pg 22.e4/col 1/para 2 "The intervention patients and control subjects were comparable, with no important differences between them (Table I)." None of the participants had previously been prescribed any of the study medications. |
| Baseline characteristics similar | Low risk | pg 22.e4/col 1/para 2 The intervention patients and control subjects were comparable, with no important differences between them (Table I). |
| Blinding (performance bias and detection bias) All outcomes | Low risk | pg 22.e2/col 1/para 3 "All outcomes were ascertained in an independent and blinded fashion, and allocation was concealed from patients, investigators, data collectors, and analysts." |
| Incomplete outcome data (attrition bias) All outcomes | Low risk | No study patient was lost to follow‐up. |
| Protection against contamination | Low risk | Cluster‐randomised trial protected against contamination. |
| Selective reporting (reporting bias) | Low risk | All outcomes mentioned in the methods section were presented in the results. |
| Other bias | Low risk | No other risk of bias identified |
Majumdar 2008.
| Methods |
Study design: Cluster‐randomised trial, with the patient as the unit of randomisation. Sample size calculation: With bisphosphonate treatment at 6 months as the primary outcome, control treatment rates of no more than 10%, a 20% increase in treatment attributable to the intervention, α = 0.05 and β = 0.10, we calculated a minimum sample size of 184 patients (92 per arm) and then inflated this value by about one‐half, to 272 patients. |
|
| Participants |
Providers: 266 physicians, Intervention: 135; Control: 131 Participants (patients): 272 patients with osteoporosis; Intervention: N = 137, Control: N = 135 Setting: 2 emergency departments and 2 fracture clinics (four hospitals) Country: Canada Type of targeted behaviour: General management of a clinical problem (care of people with osteoporosis) |
|
| Interventions |
Description of the intervention: opinion‐endorsed guidelines sent to physicians + telephone‐based patient education (performed by nurses) + reminders sent to physicians Method of OL identification: sociometric method Proportion of social network that nominated OL: unclear OLs (single or teams): teams of five physicians OL disseminated information: formal (dissemination of guidelines) OL frequency of involvement: 'one‐off' i.e. sending a signed guideline on osteoporosis care to physician at one time point Control: usual care (provision of printed materials to patients) Duration of intervention: a one‐off faxed evidence summary Funding: "Sumit Majumdar, Jeffrey Johnson, Finlay McAlister and Walter Maksymowych receive salary support awards from the Alberta Heritage Foundation for Medical Research; Sumit Majumdar and Finlay McAlister receive salary support awards from the Canadian Institutes of Health Research; Jeffrey Johnson and Brian Rowe hold Canada Research Chairs; and Finley McAlister holds the Aventis/Merck‐Frosst Chair in Patient Health Management. The study was supported by peer‐reviewed grants from the Canadian Institutes of Health Research." |
|
| Outcomes |
Primary outcomes:
Other outcomes:
Follow‐up: 6 months after enrolment |
|
| Notes | * Sample size calculation was based on this outcome. | |
| Risk of bias | ||
| Bias | Authors' judgement | Support for judgement |
| Random sequence generation (selection bias) | Low risk | pg 570/col 1/para 3 "In this randomised controlled trial, patients were assigned to either the intervention group or the control group. Allocation was concealed by application of variable block sizes and by use of a secure, centralized, Internet‐based, computer‐generated randomisation system housed within the Epidemiology Coordinating and Research Centre at the University of Alberta in Edmonton." |
| Allocation concealment (selection bias) | Low risk | pg 570/col 1/para 3 "Allocation was concealed by application of variable block sizes and by use of a secure, centralized, Internet‐based, computer‐generated randomisation system." |
| Baseline outcome measurements similar | Low risk | pg. 572/table 1. None of the participants had previously been prescribed biphosphonate treatment. |
| Baseline characteristics similar | Low risk | pg 572/table 1. Baseline differences were adjusted for in the analyses. |
| Blinding (performance bias and detection bias) All outcomes | Low risk | pg 570/col 1/para 3 "Patients could not be blinded to the fact that they were part of an osteoporosis quality improvement study. However, physicians were not informed that their patients were part of a study, and neither physicians nor patients were aware of the study outcomes. Research nurses collected outcomes data without knowledge of allocation status. Investigators were blinded at all times." |
| Incomplete outcome data (attrition bias) All outcomes | Low risk | pg 571/figure 1 |
| Protection against contamination | Low risk | The study was a cluster‐randomised trial. |
| Selective reporting (reporting bias) | Low risk | All outcomes mentioned in the methods section were also presented in the results. |
| Other bias | Low risk | No other risk of bias identified |
McAlister 2009.
| Methods |
Study design: Cluster‐randomised trial, with the primary care physician as the unit of randomisation. Sample size calculation: "We targeted a total sample size of 480 patients (160 patients per arm) to detect a 15% absolute difference in the primary outcome over control rates, with an α of 0.05 (2‐sided) and 80% power." |
|
| Participants |
Providers: > 252 primary care physicians (at least one per clinic) Participants (patients)::480 adults with coronary heart disease: OL statement: N = 165; (unsigned statement: N = 158); Control: N = 157 Setting: 252 practices in Edmonton and Calgary Country: Canada Type of targeted behaviour: general management of a clinical problem (secondary care for CHD statin management) |
|
| Interventions |
Description of the intervention: 1. OL‐endorsed/signed evidence summary; 2. unsigned evidence summary (not included as not compared to OL‐endorsed statement) Method of OL identification: sociometric Proportion of social network that nominated OL: unclear OLs: (single or teams): single OL OL disseminated information: formal (faxed evidence summaries) OL frequency of involvement: action taken at one time point Control: no intervention (physicians only received a coronary chart for their patients, which is considered somewhat more than standard care in this region) Duration of intervention: one‐off faxed evidence summary Funding: "APPROACH was initially funded with a grant from the W.Garfield Weston Foundation. The ongoing operation of APPROACH has been made possible by contributions from the Provincial Wide Services Committee of Alberta Health and Wellness as well as the Libin Cardiovascular Institute and Mazankowski Heart Institute and the following industry sponsors: Merck Frosst Canada Inc., Roche Canada, Eli Lilly Canada Inc., Bristol‐Myers Squibb, Philips Medical Systems Canada, Searle Pharmaceuticals, Boston Scientific Ltd and Cordis.The ESP‐CAD Trial was funded by 3 peer‐reviewed grants (Alberta Heritage Foundation for Medical Research, the Heart and Stroke Foundation of Canada and Pfizer Canada Inc.).None of the funding organisations had a role in the conception or design, conduct, analysis, interpretation, or reporting of the study, and none had access to the data. None of the investigators or local OLs received any financial compensation." |
|
| Outcomes |
Primary outcome:
Follow‐up: 6 months after enrolment |
|
| Notes | * Sample size calculation was based on this outcome. | |
| Risk of bias | ||
| Bias | Authors' judgement | Support for judgement |
| Random sequence generation (selection bias) | Low risk | pg 898/col 2/para 1 "Randomization took place 1:1:1 following the completion of the patients angiogram using a computer‐generated central randomisation system with concealment of the randomisation list." |
| Allocation concealment (selection bias) | Low risk | pg 898/col 2/para 1 Although primary care physicians were not blinded to allocation status, both allocation concealment and blinding were achieved for investigators, patients, outcome assessors, and analysts. |
| Baseline outcome measurements similar | Low risk | pg 28/table 1 At baseline, there were no statistically significant differences between groups. A similar proportion of participants in both groups received statins (and standardised statin dose at baseline). |
| Baseline characteristics similar | Low risk | pg 28/table 1 At baseline, there were no statistically significant differences between groups. |
| Blinding (performance bias and detection bias) All outcomes | Low risk | Although primary care physicians were not blinded to allocation status, both allocation concealment and blinding were achieved for investigators, patients, outcome assessors, and analysts. pg 900/col 2/para 2 Follow‐up data were collected by independent and blinded outcome assessors, clinical events were independently adjudicated by two blinded investigators (FAM and SRM) who then met to resolve discrepancies, and statistical analyses were conducted by a statistician blinded to allocation status. |
| Incomplete outcome data (attrition bias) All outcomes | Low risk | pg 901/col 2/para 1 We evaluated the status of 466 patients (97%) after six months (2 patients were lost to follow‐up, 6 withdrew consent, 3 died and 3 were excluded due to protocol violations). |
| Protection against contamination | Low risk | This was a randomised clinical trial clustered at the level of the primary care physician to avoid contamination. |
| Selective reporting (reporting bias) | Low risk | All outcomes mentioned in the methods section were also presented in the results. |
| Other bias | Low risk | No other risk of bias identified |
O'Connor 2009.
| Methods |
Study design: Cluster‐randomised trial with PCPs as the unit of allocation Sample size calculation: a priori sample size calculations assumed 20 providers with 30 diabetic patients each (600 people with diabetes per study arm) would be available for analysis. Effective sample size was estimated as n = 311 participants per arm due to clustering using a measured intra‐class correlation coefficient of 0.032 based on eligible physicians. This study was designed with 80% power to detect an HbA1C difference of 0.3% between study arms, with a two‐tailed 0.05. |
|
| Participants |
Providers: 57 physicians: Learning cases + OL: N = 19; Learning cases: N = 19; Control: N = 19 Characteristics of providers: Female (%): Control: 37; Learning: 26; Learning + OL: 16 Physician age (mean) : Control: 49.6; Learning: 47.6; Learning + OL: 48.0 Years since graduation (mean): Control: 22.7; Learning: 20.8; Learning + OL: 21.5 80% time spent on patient care (%): Control: 77; Learning: 75; Learning + OL: 72 Family practitioners: Control: 47%; Learning: 42%; Learning + OL: 42% Participants (patients):: 2020 adults with diabetes Setting: Health Partners Medical Group, an 18‐clinic multispecialty group Country: USA Type of targeted behaviour: general management of a clinical problem (improved safety and quality of diabetes care i.e. improved test rate and level of HbA1c and LDL cholesterol) |
|
| Interventions |
Description of the intervention: Learning intervention + OL feedback: "Three simulated cases as in the learning group below, the same “learning by doing” feedback based on actions taken, and the same printed feedback summary of actions taken compared with those of an expert physician. In addition, upon completion of the three cases, these physicians received 60 min of verbal interaction and feedback from a physician OL who observed the physician while he/she performed the simulations and used a pre‐designed checklist at the completion of the three cases as a tool to discuss potentially problematic treatment issues, as well as to give positive reinforcement for good practice patterns that were observed. Therefore, OL feedback included both positive and negative aspects of physician performance." Learning intervention: "Three clinical scenarios in the same fixed order. An electronic medical record–like interface permitted multiple virtual patient‐physician encounters with each case in the presence of a research assistant with no clinical training. At each simulated patient encounter, the PCP viewed history and physical exam data, recorded impressions, and took a series of actions that were not scripted and could include ordering tests, making referrals to specialists and educators, recommending diet and physical activity, and initiating or titrating various medications for glucose, blood pressure, lipids, or depression. Actions could be taken at each scheduled visit or phone contact. Follow‐up was scheduled at any interval recommended by the physician. At the next encounter, the patient’s clinical data (HbA1C, LDL cholesterol, and blood pressure levels and other data) reflected the effect of actions taken in previous encounters, attenuated by the time‐dependent effects of medications, lifestyle recommendations, and recognition and treatment of depression. At each follow‐up encounter with the simulated patient, the physician received “learning by doing” feedback in the form of patient responses to actions taken in previous encounters. Each physician dealt with three simulated cases over 60 min; each case was treated for a series of simulated encounters over variable lengths of simulated calendar time. At the end of the three cases, each physician received a printed feedback record of the actions they had taken in each case compared with actions taken by an expert physician who performed the same cases. A more complete description of this intervention software is available. The patient cases seen by each physician were initialised for three important clinical situations: 1) a newly diagnosed type 2 diabetic patient on no medications, 2) a patient with contraindications to insulin sensitisers (metformin and thiazolidine) who required insulin initiation and subsequent titration, and 3) a depressed individual with resulting low adherence who required insulin titration." Method of OL identification: the OL identified to work with providers and as a co‐investigator in the study was chosen because, at the time, this person was the medical director of our care organisation’s Diabetes Improvement Project, leader of the ICSI Type 2 Diabetes Guideline for the state of Minnesota, and also a certified trainer for Staged Diabetes Management through the International Diabetes Center and a practicing internist at one of the HP clinics and well‐known as a diabetes champion/expert by his/her colleagues who were participating in the study (personal communication with authors). Proportion of social network that nominated OL: N/A OLs: (single or team): single OL disseminated information: 60‐min preprepared feedback after learning session OL frequency of involvement: one‐off interactive feedback session Control: no intervention, PCPs randomised to this group completed baseline surveys Duration of the intervention: 60 + 60 min Funding: "This project was supported by the Agency for Healthcare Research and Quality (grant no. RO1 HS 10639)." |
|
| Outcomes |
Follow‐up: 12 months after enrolment |
|
| Notes | Note: participating PCPs received compensation of $100 for control, $200 for learning group, or $600 for learning + OL feedback group, predicated on the differential time commitment to each intervention. *The sample size calculation was based on this outcome. |
|
| Risk of bias | ||
| Bias | Authors' judgement | Support for judgement |
| Random sequence generation (selection bias) | Unclear risk | Before randomisation, 67 consenting physicians were blocked into groups of three based on 1) same specialty (family medicine or internal medicine) and 2) whether they provided care to 50 versus 50 or more diabetic patients. No information about the sequence generation |
| Allocation concealment (selection bias) | Low risk | Block randomisation so adequate allocation concealment |
| Baseline outcome measurements similar | Low risk | No differences in baseline measures of HbA1c and LDL cholesterol between groups |
| Baseline characteristics similar | Low risk | Randomisation at the physician level resulted in similar patient samples except that patients of physicians in the learning group more often had coronary artery disease and higher Charlson scores. Physician attributes did not differ by group. |
| Blinding (performance bias and detection bias) All outcomes | Low risk | The providers could not be blinded to the intervention. However, the outcomes were objective.and retrieved from records. |
| Incomplete outcome data (attrition bias) All outcomes | Low risk | Attrition occurred evenly across randomised groups, and final analysis included 19 physicians in each group. |
| Protection against contamination | Low risk | Cluster‐randomised trial protected against decontamination. |
| Selective reporting (reporting bias) | Low risk | Results for all outcomes listed in the trial protocol were reported. |
| Other bias | Low risk | No other risk of bias identified |
Rebbeck 2006.
| Methods |
Study design: cluster‐randomised trial, with the physiotherapist the unit of randomisation Sample size calculation: no |
|
| Participants |
Providers: 27 physiotherapists (one from each clinic): Intervention: N = 14; Control: N = 13. No information on provider characteristics Participants (patients): N = 103 whiplash patients (4 dropouts); Intervention: N = 72; Control: N = 31 (N = 67 and N = 26 patients at 12 months) Setting: 27 physiotherapy clinics: Intervention:N = 14; Control: N = 13 (56% of invited private physiotherapy clinics) ‐ only 5/13 control providers recruited whiplash patients, and 13/14 in the intervention group (one physiotherapist was lost to follow‐up) Country: Australia Type of targeted behaviour: general management of a clinical problem( Improved use of guideline based whiplash care). |
|
| Interventions |
Description of intervention: Education by OLs about whiplash guidelines: Intervention for the implementation group consisted of dissemination of guidelines, initial education by OLs, and follow‐up education. Physiotherapists in the implementation group initially attended a one‐day (8‐hour) workshop. The workshop included interactive sessions outlining the content of the guidelines, practical sessions covering the treatments endorsed in the guidelines, particularly those that were relatively ‘new’ for physiotherapists (i.e. ‘reassure patient’ and ‘advise to act as usual’), and the use of functional outcome measures. Local OLs were used to deliver some of the programme content. Physiotherapists were given a laminated copy of the algorithms outlining the process of care, appointment cards, and marketing material to be used for general practitioners who usually refer to the practice. They received a follow‐up educational outreach visit (2 hours) approximately six months later. At this session, problem‐solving regarding use of the guidelines in clinical practice was undertaken and an update of the evidence given. Method of OL identification: the ' OLs' were chosen based on track record for research publications in the area and on clinical specialisation in the area, as well as general reputation (judge's rating or positional approach) Proportion of social network that nominated OL: N/A OLs (single or team): single OL disseminated information: unclear OL frequency of involvement: unclear Duration of intervention: 12 months Control: dissemination of guidelines by mail, i.e. physiotherapists in this group were given but not directed to use the guidelines/standard dissemination. Funding: "This study was funded by the Motor Accidents Authority of New South Wales, who also provided administrative assistance. This organisation, which is the regulator of compulsory third party insurance companies, had no part in the analysis of the data or reporting of this study." |
|
| Outcomes |
Primary outcomes:
Secondary outcomes:
Follow‐up: at 12 months after randomisation |
|
| Notes | ||
| Risk of bias | ||
| Bias | Authors' judgement | Support for judgement |
| Random sequence generation (selection bias) | Unclear risk | pg 166, col 1, para 4 QUOTE: "Physiotherapists were stratified into low and high cost providers and the physiotherapists in each stratum were randomised into an implementation or a dissemination group by an insurer." |
| Allocation concealment (selection bias) | Low risk | pg 166, col 1, para 4 QUOTE: "Interventions were coded so that the purpose of allocation was concealed from the insurer. Stratification was concealed from the trial centre." |
| Baseline outcome measurements similar | Low risk | pg 167, col 1, para 4 QUOTE: "Similarly, there were no significant differences between physiotherapists in the implementation group (N = 14) and dissemination group (N = 13) in billing history or knowledge of the guidelines". |
| Baseline characteristics similar | Low risk | pg 167, col 1, para 4 QUOTE: "The characteristics of participating physiotherapists did not differ from non‐participating physiotherapists, other than that a greater percentage of participating physiotherapists resided in the ACT". |
| Blinding (performance bias and detection bias) All outcomes | Low risk | pg 166, col 1, para 4 QUOTE: "Physiotherapists were blinded to the study hypothesis by being informed that they were randomised into one of two implementation groups." The primary outcome was patient disability, measured using the Functional Rating Index, collected on admission to the trial and at 1.5, 3, 6 and 12 months. Unlikely that patients knew of the intervention groups |
| Incomplete outcome data (attrition bias) All outcomes | Unclear risk | One physiotherapist from the dissemination group subsequently withdrew, leaving 12 physiotherapists enrolled in this group. Eight physiotherapists, the majority of whom were allocated to the dissemination group (N = 7), did not recruit patients. Reasons for nonrecruitment included not seeing acute whiplash patients (2) and being a sole practitioner with no support (2). Three were not available to be contacted,The characteristics of physiotherapists who did not recruit patients (N = 8) did not differ from physiotherapists who did (N = 18). |
| Protection against contamination | Low risk | Cluster‐randomised trial so therefore protected against contamination. |
| Selective reporting (reporting bias) | Low risk | Results reported for all relevant outcomes were mentioned in the methods section. |
| Other bias | Low risk | No other risk of bias identified |
Rycroft‐Malone 2012.
| Methods |
Study design:cluster‐randomised trial, with hospitals as the unit of allocation Sample size calculation: "The sample size calculation was based on information from an audit of fasting time. The study had 80% power to detect an effect size of 2 (a difference of 4 hours and SD 2 hours) with a two‐sided 5% significance level, which required six trusts in each of the three intervention groups." |
|
| Participants |
Providers: multi‐professional staff; number of staff not reported Participants (patients): 3505 patients undergoing elective and routine general, orthopaedic, or gynaecological surgery Setting: 19 acute NHS hospitals; standard dissemination + web‐based tool championed by OL: N = 6; standard dissemination + PlanDoStudyAct: N = 6; standard dissemination: N = 7 N = 188 trusts were eligible, but only 19 (10.1%) agreed to participate. Country: UK Type of targeted behaviour: Improved compliance with perioperative fasting recommendations |
|
| Interventions |
Description of intervention: Group 1: Standard dissemination plus a web‐based resource championed by an OL(s). A web‐based resource was developed from the content of the guideline package accessible to trusts allocated to this intervention. The web‐based resource was interactive, incorporating educational tools such as self‐check tests, working through clinical scenarios, and a patient digital story (http://www.rcn.org.uk/development/practice/perioperative_fasting). The resource was championed by OLs working in participating surgical areas. Group 2: Standard Dissemination plus plan‐do‐study‐act (PDSA) The PDSA quality improvement approach includes making small changes and test cycles to see whether an improvement occurs in the system or process. Critical to this intervention is the potential to collaborate, which in this study was possible at a local level between teams and individuals. This intervention also included a ‘diagnosis’ phase based on the Seven S Model. A dedicated facilitator with relevant clinical and/or managerial experience was identified by each trust’s key contact. Facilitators had a one‐day training session. The PDSA package used in this study is available on request. All trusts received their individual baseline mean food and fluid fasting times at the beginning of the intervention phase. Method of OL identification: OLs were identified by key contacts at the NHS Trusts through a nomination process based on criteria developed from previous research: 1. Does this person have credibility across different professional groups? i.e. will different professional groups all take on knowledge from this person and respect their ability? 2. Do they have an authority and presence recognised by their colleagues? 3. Do they have good communication skills? 4. Do they treat all colleagues with respect? 5. Do they have the ability to convince colleagues about reducing fasting times through the intervention? Training on the use of the web‐based resource was provided to OLs at the start of the implementation phase. OLs (single or teams): identification of one or more OLs was permitted. OL disseminated information: web‐based interactive intervention OL frequency of involvement: unclear Duration of intervention:12 months Control: standard dissemination of a guideline package, which included: 1. A copy of the RCN/RCA guideline, which included an overview of the guideline development process and those involved, recommendations, algorithm poster, and audit criteria. 2. A patient version of the guideline. 3. A PowerPoint presentation outlining some principles of guideline implementation. We attempted to mirror, as far as possible, the dissemination process of the National Institute for Health and Clinical Excellence (NICE). The package was distributed once via post at the beginning of the intervention period and was targeted at the senior levels of the NHS Trust organisation. Packs were posted to named medical directors, nursing directors, clinical governance leads, and audit leads at each Trust. Packs were also sent to the English Strategic Health Authorities and the Health Boards in Northern Ireland, Wales and Scotland. Funding: "The authors gratefully acknowledge funding of this research from The Health Foundation’s Engaging with Quality Initiative." |
|
| Outcomes | Primary outcomes:
Secondary outcomes:
Follow‐up: 8 months after the intervention |
|
| Notes | Data were collected between November 2006 and February 2009 at a time where the NHS was undergoing major reform under a previous administration (see Table 3 for data collected). Anecdotal feedback from some sites that made further enquiries, but who then did not participate, would suggest that engaging in an additional initiative at a time of change was not feasible for them. *Sample size calculation was based on fasting times. |
|
| Risk of bias | ||
| Bias | Authors' judgement | Support for judgement |
| Random sequence generation (selection bias) | Low risk | pg 7, col 1, para 3 QUOTE: "Each participating Trust was given an ID number. The randomisation schedule was computer‐generated centrally and prepared by a statistician who was independent of the project team. Allocation was thus concealed and could not be foreseen in advance of, or during enrolment." |
| Allocation concealment (selection bias) | Low risk | see quote above |
| Baseline outcome measurements similar | Unclear risk | N/A |
| Baseline characteristics similar | Unclear risk | We have no reason to believe that the characteristics of participating Trusts were different from any other NHS Trusts. However, given their willingness to participate, we have to assume they have an interest and therefore motivation to want to do something about their fasting times, which may have made them atypical of other non‐participating trusts. |
| Blinding (performance bias and detection bias) All outcomes | Low risk | pg 7, col 1, para last QUOTE: "Blinding of local investigators, research fellows or trust staff to interventions was not possible because the intervention required their active participation. Patients were aware of the study, but not informed of the intervention allocated to the trust." |
| Incomplete outcome data (attrition bias) All outcomes | Low risk | One trust did not implement the intervention due to facilitator illness. Across all hospitals, information was gathered from 1575 patients in total in the pre‐intervention period (fluid fast time was missing for 135 patients and food fast time missing for 140 patients). Unclear if the missing data was equally divided between groups. |
| Protection against contamination | Low risk | Yes, cluster‐randomised trial |
| Selective reporting (reporting bias) | Low risk | Results for all outcomes listed in the trial protocol provided in paper |
| Other bias | Low risk | No other risk of bias identified |
Schectman 2003.
| Methods |
Study design: Cluster‐randomised trial, with practices as the unit of allocation Sample size calculation: "A two‐tailed P value of .05 was the criterion for statistical significance of the principal summary outcome measure (i.e. overall guideline‐consistent utilization of services). Power analysis indicated that there was > 80% probability of detecting a 10% difference between groups with respect to aggregate utilization rates based on the actual sample size". |
|
| Participants |
Providers: 120 internists, family physicians, and associate practitioners (nurse practitioners, NPs and physician assistants, PAs). Fourteen of these clinicians did not accrue eligible patients in both the baseline and intervention periods and were excluded from analysis (effective clinician sample size, N = 106). Characteristics of providers: N (physicians): Total: N = 85; Control: 20; Patient intervention: 24; Clinician intervention: 20; Clinician and patient intervention: 21 N (NP or PA): Total: N = 21; Control: 6; Patient intervention: 6; Clinician intervention: 4; Clinician and patient intervention: 5 Years practice, mean: Control: 8.7; Patient intervention: 9.3; Clinician intervention: 10.5; Clinician and patient intervention: 11.0 Gender, % female: Control: 64; Patient intervention: 42; Clinician intervention: 47; Clinician and patient intervention: 55 Participants (patients): patients with diagnosis codes related to back pain or spinal disorders, number of participants not reported Setting: 14 group practice sites affiliated with two not‐for‐profit group model HMOs in metropolitan Washington, District of Columbia Country: USA Type of targeted behaviour: general management of a clinical problem (to use optimal strategies for the initial evaluation, testing, and treatment of acute low back.pain) |
|
| Interventions |
Description of the intervention: (1) a physician education and feedback intervention supporting the guidelines: Prior to the start of the study year, clinicians assigned to receive guideline implementation completed a standardised 90‐minute educational session, which included an introduction to the guideline, a description of its development, and a series of interactive educational vignettes designed to highlight application of the guideline to various types of patients. These educational sessions were delivered by recognised clinical leaders at each of the respective institutions. Ninety percent of the assigned clinicians attended the education sessions. All clinicians received a copy of the guideline. Following the educational session, each clinician was given an audit report summarising their performance vis‐à‐vis the guideline in the care of patients with acute low back pain during the baseline year. Over and under‐utilisation of clinical services were highlighted and the rationale for each classification was explained (see below). Non‐attendees received a copy of the guideline, their individualised audit report, and a follow‐up phone call from one of the study investigators. All clinicians in the guideline implementation group also received an individual follow‐up visit from one of the study investigators 6 months into the study year. At this meeting, the guideline was reviewed, questions or concerns were addressed, and another audit report covering low back pain encounters for the first 6 months of the study year was reviewed. (2) patient educational materials (written and video) consistent with the guideline: Clinical sites assigned to receive patient education materials received copies of the videotape and pamphlet along with a TV/VCR during a visit by one of the study investigators. Both the pamphlet and the video conveyed general information about acute low back pain and translated the guideline recommendations into lay terms. All clinicians were encouraged to review the pamphlet and videotape personally. Clinicians at patient education sites received two additional written reminders to use the materials during the first 3 months of the study year. (3) both of these interventions Method of OL identification: clinician leaders were identified informally – these were two relatively small HMOs in DC where the administrative physician leadership knew who were respected/influential clinicians practicing at the respective institutions (there were no personal characteristics a priori). OLs (single or team): no information OL disseminated information: no information OL frequency of involvement: no information Duration of intervention: 12 months Control: no intervention. Funding: "Agency for Health Care Policy and Research, Public Health Service, Department of Health and Human Services, Grant #: RO1 HS07069." |
|
| Outcomes |
Primary outcomes:
Follow‐up: 12 months after randomisation |
|
| Notes | *Sample size calculation (on the actual sample) was based on the primary outcome. | |
| Risk of bias | ||
| Bias | Authors' judgement | Support for judgement |
| Random sequence generation (selection bias) | Unclear risk | QUOTE: "Clinician practices were stratified by affiliation (academic vs nonacademic) and then, using sealed envelopes, randomised by an investigator to 4 groups in a 2 × 2 factorial design." Comment: specific randomisation process not reported |
| Allocation concealment (selection bias) | Unclear risk | Not reported if the envelopes were opaque |
| Baseline outcome measurements similar | High risk | pg 776, col 1, para 1 QUOTE: "Though randomisation appeared successful in achieving fairly similar groups (Table 1), subsequent analysis of utilization data (Table 2) suggested important differences between them. The intervention group had substantially higher utilization of radiologic and specialty services during the baseline period. Similar baseline differences were found for utilization of services inconsistent with the guideline." |
| Baseline characteristics similar | Unclear risk | Fewer years in practice and larger proportion females in the control group |
| Blinding (performance bias and detection bias) All outcomes | Unclear risk | No information |
| Incomplete outcome data (attrition bias) All outcomes | Low risk | Should be 100% if retrieved from registers |
| Protection against contamination | Low risk | Cluster‐randomised trial and therefore low risk of contamination |
| Selective reporting (reporting bias) | Low risk | Results for all outcomes described in the methods section were reported in the results section. |
| Other bias | Low risk | No other risk of bias identified |
Simunovic 2010.
| Methods |
Study design: cluster‐randomised trial; with hospitals the unit of randomisation Sample size calculation: "Sample size calculations were two‐sided, considered the clustering of data at the hospital level, and were driven by requirements for the outcome local recurrence. To detect an improvement in local recurrence from 20% to 8% with confidence we required 16 hospitals and 672 patients – 8 hospitals and 336 patients in each arm." |
|
| Participants |
Providers: Total no: N = 105 surgeons: Intervention: 56; Control: 49 (96 (91%) of the 105 surgeons), with five nonconsenting surgeons in the intervention arm and four in the control arm) Participants (patients):: underwent major rectal surgery (i.e. partial or complete segmental resection of the rectum with or without an anastomosis) because of a diagnosis of primary rectal cancer. Total N = 1015 patients; Intervention: 558; Control: 457 Setting: 16 hospitals; Intervention: N = 8; Control: N = 8, in the Ontario region. Of the 33 hospitals identified, nine were not eligible: three participated in pilot study; in two laparoscopic techniques were used for rectal surgery in most patients; at four hospitals surgeons at the site were involved in trial as experts in rectal surgery. Of the remaining 24, six hospitals were not approached because sample size reached and two hospitals did not meet one eligibility criterion (hospital’s research ethics board did not approve study). Country: Canada Type of targeted behaviour: quality and technique of colorectal cancer surgery to reduce hospital rates of permanent colostomy or local recurrence to encourage surgeons to provide optimal total mesorectal excision to patients with rectal cancer |
|
| Interventions |
Description of the intervention: The QIRC strategy consisted of five surgeon‐directed components: i) Workshops: Workshops preceded other interventions at participating hospitals. Workshop topics included techniques of total mesorectal excision and quality improvement. At each workshop, participating surgeons selected an OL for their hospital using a validated approach. ii) Use of OLs: The OL acted as a local resource person on issues pertinent to the study. For example, the OL encouraged colleagues to participate in operative demonstrations. Method of OL identification: Hiss' method. In summary, the selection was based on the OL having three attributes including a high level of clinical expertise, a willingness to share knowledge, and being educationally influential. Proportion of social network that nominated OL: unclear, surgeons who participated at workshop selected OL. OLs (single or team): single OL disseminated information: the OL acted as a local resource person on issues pertinent to the study. OL frequency of involvement: unclear iii) Intraoperative demonstrations: For intraoperative demonstrations, participating surgeons invited a study team surgeon to assist them with a patient’s rectal cancer surgery. The intent was for the invited surgeon to demonstrate optimal techniques of total mesorectal excision. Demonstrators were recognised experts in total mesorectal excision, although participating surgeons retained full control over decision‐making. iv) Postoperative questionnaires: A postoperative questionnaire was designed to prompt surgeons to re‐examine key steps in total meso‐rectal excision. v) Audit and feedback: For audit and feedback, data (e.g. rates of permanent colostomy) were provided to individual surgeons for their own results and those of their hospital. Duration of intervention: not reported Control: Participating surgeons at hospitals in the control arm received no interventions. The onus was on individual surgeons to obtain new knowledge or skills for any aspect of care they provided. Funding: "The trial was funded by a grant from the Canadian Institutes of Health Research (grant no. MCT‐50013)." |
|
| Outcomes |
Primary outcomes:
Follow‐up: median follow‐up 3.6 years (at least 30 months) |
|
| Notes | Clustering was taken into account in the analysis. *Sample size calculation was based on this outcome. |
|
| Risk of bias | ||
| Bias | Authors' judgement | Support for judgement |
| Random sequence generation (selection bias) | Low risk | pg 1303, col 1, para 2 QUOTE: "A study statistician (C.H.G.) generated and administered a blocked 1:1 allocation arrangement for randomisation of the 16 study hospitals." |
| Allocation concealment (selection bias) | Low risk | pg 1303, col 1, para 2 QUOTE: "Because hospitals were our unit of analysis, consecutive patients had to be included to prevent potential selection bias by surgeons (e.g. excluding patients with difficult tumours perceived to be at high‐risk of negative outcomes)." |
| Baseline outcome measurements similar | Unclear risk | N/A |
| Baseline characteristics similar | Low risk | The two arms of the trial were evenly matched on most of the patient and tumour characteristics (Table 1). |
| Blinding (performance bias and detection bias) All outcomes | Low risk | pg 1303, col 1, para 2 QUOTE: "Surgeons were not blinded to group assignment, since those in the intervention group had to actively engage in the QIRC strategy." However, all main outcomes were objective and retrieved from hospital registers. |
| Incomplete outcome data (attrition bias) All outcomes | Low risk | All data were retrieved from hospital records which should provide data for all included patients. |
| Protection against contamination | Low risk | pg 1303, col 1, para 2 QUOTE: "We used a cluster‐randomised design at the hospital level to minimize the chances of contamination among surgeons and patients in the control arm". |
| Selective reporting (reporting bias) | Low risk | Results for secondary outcomes listed in the trial protocol (quality of life, bowel, bladder and sexual function) were not reported in the paper. However, these outcomes were planned to be obtained only from a subset of patients who the surgeon judged were not too ill.. |
| Other bias | Low risk | No other risk of bias identified |
Sisk 2004.
| Methods |
Study design: Cluster‐randomised trial, with the hospitals as the unit of randomisation. Sample size calculation: no |
|
| Participants |
Providers: 212 obstetric providers (129 obstetricians, 56 family practitioners, 27 certified nurse midwives) Participants (patients): mothers of newborns; no not reported Setting: 18 hospitals. Intervention: N = 9 and Control: N = 9 Country: USA Type of targeted behaviour: mothers' intention to breastfeed during the early postpartum period |
|
| Interventions |
Description of the Intervention:
Local OLs + audit & feedback + formal meetings + printed educational material.
Method of OL identification: both the sociometric method (if you wish to discuss practice questions with other clinicians in your hospital, on whom would you most likely call?) and the informant method (OLs in the study were nominated also by the obstetric nurse‐manager)
Proportion of social network that nominated OL: 56% OLs (single or team): single OL OL disseminated information: formal OL frequency of involvement: 2 hours monthly during the study year Control: standard dissemination Duration: the two workshops were delivered 3 months apart. Funding: "Supported by the New York State Department of Health (C‐ 012597) through the New York Chapter of the American College of Obstetricians and Gynecologists." |
|
| Outcomes |
Primary outcome:
Follow‐up: 12 months after the intervention |
|
| Notes | ||
| Risk of bias | ||
| Bias | Authors' judgement | Support for judgement |
| Random sequence generation (selection bias) | Unclear risk | Pg 414/col 2/para 2 We randomly allocated hospitals between intervention and control groups and conducted the 1‐year OL intervention. |
| Allocation concealment (selection bias) | Low risk | It was a cluster‐randomised trial, with the hospitals as the unit of randomisation. |
| Baseline outcome measurements similar | Unclear risk | Unclear if the baseline outcome measures were similar |
| Baseline characteristics similar | Unclear risk | Mentioned that the characteristics did not differ but did not report baseline data |
| Blinding (performance bias and detection bias) All outcomes | Unclear risk | Not mentioned in the paper |
| Incomplete outcome data (attrition bias) All outcomes | Unclear risk | Not mentioned in the paper |
| Protection against contamination | Low risk | Pg 415/col 2/para 1 "As the setting where obstetric providers interact, the hospital was the appropriate unit of randomisation. To avoid contamination among Binghamton and Syracuse clinicians with admitting privileges at multiple hospitals in those cities, we treated as 1 unit for randomisation the 3 hospitals in the Syracuse area versus the 2 in Binghamton and 1 in the surrounding area. (...) We matched the 18remaining hospitals on characteristics that might affect breast‐feeding or avoided contamination of the control group by clinicians in the intervention group." |
| Selective reporting (reporting bias) | Low risk | All outcomes mentioned in the methods section were also presented in the results. |
| Other bias | Low risk | No other risk of bias identified |
Soumerai 1998.
| Methods |
Study design: Cluster‐randomised trial, with the hospital as the unit of randomisation. Sample size calculation: no |
|
| Participants |
Providers: 37 clinician groups: unclear no of clinicians Participants (patients): 2938 people with myocardial infarction (MI) Setting: 37 hospitals. Intervention: N = 20 and Control: N = 16 Country: USA Type of targeted behaviour: general management of a problem (appropriate drug treatment for people with acute MI) |
|
| Interventions |
Description of the intervention: local OLs + distribution of educational materials
Method of OL identification: sociometric
Proportion of social network that nominated OL: 38% Single OL or OL teams identified: one single OL per hospital OL disseminated information: informal & formal (conferences, clinical practice guidelines, audit & feedback) OL frequency of involvement: unclear Control: audit & feedback Duration of intervention: 7 months Funding: “This study was supported by the Agency for Health Care, Policy and Research (Grant HSO 7357), the Healthcare Research and Education Foundation, and the Harvard Pilgrim Health Care Foundation.“ |
|
| Outcomes |
Primary outcomes:
Follow‐up: 10 months after the intervention |
|
| Notes | ||
| Risk of bias | ||
| Bias | Authors' judgement | Support for judgement |
| Random sequence generation (selection bias) | Unclear risk | pg 1369 "..hospitals were stratified and randomised by size from within each of the nine strata to experimental or control condition (standard care). |
| Allocation concealment (selection bias) | Low risk | It was a cluster‐randomised trial, with the hospitals as the unit of randomisation. |
| Baseline outcome measurements similar | Low risk | pg 1361/col 2/para 1 There were no significant differences in baseline rates of use of study drugs between experimental and control hospitals. pg 1362/table 2 |
| Baseline characteristics similar | Low risk | pg 1361/col 1/para 3 “Table 1 presents demographic and clinical characteristics of experimental and control patients before and after the intervention. Both groups were comparable overall and with respect to several characteristics that predicted use of study drugs at baseline, namely, old age (> 75 years), female sex, severe comorbidity, recent symptom‐onset (6 hours) and heart failure." pg 1361/col 3/table 1 |
| Blinding (performance bias and detection bias) All outcomes | Low risk | pg 1359/col 2/para 2 Hospital administrators, physicians, AMI patients and nurse abstractors were all blinded with respect to study hypothesis and experimental assignment at each hospital. |
| Incomplete outcome data (attrition bias) All outcomes | Low risk | All hospitals completed the study except one that closed before the intervention. |
| Protection against contamination | Low risk | pg 1359/col 1/para 3 To minimise contamination of control hospitals, large cities (i.e. St. Paul ‐ 7 hospitals and 1430 patients) and Minneapolis (11 hospitals and 2536 patients) were randomised as clusters, resulting in a state‐wide sample of 20 experimental and 17 control hospitals. |
| Selective reporting (reporting bias) | Low risk | All outcomes mentioned in the methods section were also presented in the results. |
| Other bias | Low risk | No other risk of bias identified |
Stross 1980.
| Methods |
Study design: Cluster‐randomised trial, with the community as the unit of randomisation Sample size calculation: no |
|
| Participants |
Providers: 6 groups/clusters of primary care practitioners; unclear no Participants (patients): N = 114 people with rheumatoid arthritis: Intervention: Pre: 18; Post: 29; Control: Pre: 34; Post: 33 Setting: 6 community hospitals Country: USA Type of targeted behaviour: general management of a problem (rheumatoid arthritis care) |
|
| Interventions |
Description of the Intervention: local OLs
Method of OL identification: sociometric
Proportion of social network that nominated OL: unclear OLs (single or team): teams of GPs, unclear number OL disseminated information: unclear OL frequency of involvement: unclear Control: standard dissemination Duration of intervention: unclear Funding: "Supported by Multipurpose Arthritis Center Grant 1 P60 AM 20557‐02, National Institute of Arthritis, Metabolism, and DigestiveDiseases." |
|
| Outcomes |
Primary outcome:
Follow‐up: unclear |
|
| Notes | ||
| Risk of bias | ||
| Bias | Authors' judgement | Support for judgement |
| Random sequence generation (selection bias) | Unclear risk | pg 847/col 1/para 1 "Six communities were utilised in this program, and they were randomly assigned to a control or an intervention group." |
| Allocation concealment (selection bias) | Low risk | It was a cluster‐randomised trial, with the community as the unit of randomisation. |
| Baseline outcome measurements similar | Low risk | pg 847/table 1 |
| Baseline characteristics similar | Unclear risk | pg 848/table 1 |
| Blinding (performance bias and detection bias) All outcomes | Unclear risk | No information |
| Incomplete outcome data (attrition bias) All outcomes | Unclear risk | No information |
| Protection against contamination | Low risk | The community was the unit of allocation. |
| Selective reporting (reporting bias) | Unclear risk | Did not say in the methods section which outcomes they would retrieve. No protocol |
| Other bias | Low risk | No other risk of bias identified |
Stross 1983.
| Methods |
Study design: Cluster‐randomised trial, with the hospital as the unit of randomisation Sample size calculation: no |
|
| Participants |
Providers: unclear no of primary care physicians Participants (patients): 510 people with chronic obstructive pulmonary disease (COPD) Setting: 16 community hospitals: Intervention: N = 8 and Control: N = 8 Country: USA Type of targeted behaviour: general management of a clinical problem (appropriate treatment of COPD) |
|
| Interventions |
Description of the Intervention: local OLs. The OLs used self‐study materials, which were followed by a 2‐week preceptorship.
Method of OL identification: sociometric
Proportion of social network that nominated OL: unclear. OLs had contact with 69% (160/233) of primary practitioners & 83% with MDs that cared for the intervention group. Single OL or OL teams identified: single OL disseminated information: informal education (50%) & formal consultations (50%) OL frequency of involvement: 56 hours of formal training Duration of the intervention: 6 months Control: standard dissemination Funding: "Supported in part by Grant No. HL‐62931‐4F from the National Heart, Lung and Blood Institute." |
|
| Outcomes |
Primary outcome:
Follow‐up: 6 months |
|
| Notes | ||
| Risk of bias | ||
| Bias | Authors' judgement | Support for judgement |
| Random sequence generation (selection bias) | Unclear risk | pg 140/col 1/para 1 "Sixteen hospitals agreed to participate and they were randomly assigned to control or intervention status. |
| Allocation concealment (selection bias) | Low risk | It was a cluster‐randomised trial, with the hospital as the unit of randomisation. |
| Baseline outcome measurements similar | Low risk | pg 743/table 3 and pg 744/table 4 |
| Baseline characteristics similar | Low risk | pg 742/table 1 |
| Blinding (performance bias and detection bias) All outcomes | Unclear risk | Not mentioned in the paper |
| Incomplete outcome data (attrition bias) All outcomes | Unclear risk | Not mentioned in the paper |
| Protection against contamination | Low risk | The hospital was the unit of randomisation. |
| Selective reporting (reporting bias) | Low risk | All outcomes mentioned in the methods section were also presented in the results. |
| Other bias | Low risk | No other risk of bias identified |
Stross 1985.
| Methods |
Study design: Cluster‐randomised trial, with the community as the unit of randomisation Sampla size calculation: no |
|
| Participants |
Providers: unclear no of primary care practitioners Participants (patients): 89 people with osteoarthritis; Intervention: pre: 23; post: 30; Control: pre: 18; post: 18 Setting: 6 community hospitals; Intervention: 3; Control: 3 Country: USA Type of targeted behaviour: general management of a clinical problem (appropriate osteoarthritis care) |
|
| Interventions |
Description of the Intervention: local OLs. An educational programme was delivered to the OLs, who then had the responsibility of disseminating the information to their peers. "The educational program was self study in design, utilizing a syllabus and audiovisual aids to minimize faculty teaching time."
Method of OL identification: sociometric
Proportion of social network that nominated OL: unclear OLs (single or team): single OL OL disseminated information: unclear OL frequency of involvement: unclear Control: standard dissemination Duration of intervention: 12 months Funding: "Supported by Multipurpose Arthritis Center grant 2P 60 AM20557 from the National Institute of Arthritis, Diabetes, Digestive and Kidney Diseases" |
|
| Outcomes |
Primary outcome:
Follow‐up: 12 months after completion of the educational programme |
|
| Notes | ||
| Risk of bias | ||
| Bias | Authors' judgement | Support for judgement |
| Random sequence generation (selection bias) | Unclear risk | pg 109/col 1/para 1 "Letters were sent to all communities with these characteristics, and 6 communities agreed to participate. Three were randomly selected to be controls, while the other three were designated as intervention communities." |
| Allocation concealment (selection bias) | Low risk | It was a cluster‐randomised trial, with the community as the unit of randomisation. |
| Baseline outcome measurements similar | Low risk | pg 110/col 1/table 1 |
| Baseline characteristics similar | Low risk | pg 109/col 1 |
| Blinding (performance bias and detection bias) All outcomes | Unclear risk | Not mentioned in the paper |
| Incomplete outcome data (attrition bias) All outcomes | Unclear risk | Not mentioned in the paper |
| Protection against contamination | Low risk | The community was the unit of allocation. |
| Selective reporting (reporting bias) | Low risk | All outcomes mentioned in the methods section were also presented in the results. |
| Other bias | Low risk | No other risk of bias identified |
Wright 2008.
| Methods |
Study design: Cluster‐randomised trial with the hospital as unit of randomisation Sample size calculation: assuming an average of 3 patients per hospital at the final assessment, and an intra‐cluster correlation coefficient of 0.1, this sample size provides 80% power to detect an increase from 26% to 52% in the proportion of people with stage II colon cancer having at least 12 nodes examined at a 2‐tailed type I error rate of 5%. |
|
| Participants |
Providers: 34 groups/clusters of surgeons (unclear number) Participants (patients): people with stage II colon cancer (N = 616 before the intervention; unclear no patients after the intervention) Setting: 34 hospitals in Ontario; Intervention: N = 18; Control: N = 16. Note: 42 hospitals were randomised but 3 intervention and 5 control hospitals were excluded due to ongoing mergers with other hospitals, and no people with colon cancer at one hospital Country: Canada Type of targeted behaviour: general management of a clinical problem (stage II colon cancer management i.e. improved colon cancer staging) |
|
| Interventions |
Description of the intervention: local OLs + academic detailing (by the expert OL) + a toolkit (containing a pathology template and a poster and pocket cards that emphasised that 12 lymph nodes should be assessed in colon cancer, to be used by the local OL) + a follow‐up reminder package (including a cover letter from the expert OL in colon cancer, a peer‐reviewed article regarding optimisation of lymph node assessment by using lymph node clearing solutions, and more of the same pocket cards). Both the intervention and the control group first received a standardised formal lecture about colon cancer lymph node assessment by the expert OL, with hospital data. Method of OL identification: sociometric Proportion of social network that nominated OL: 42 of 99 hospitals (42%) OLs (single or team ): single OL OL disseminated information: informal (the local OLs were not instructed in how to use the toolkit) OL frequency of involvement: unclear Control: a standardised lecture about colon cancer lymph node assessment delivered by an expert OL in colon cancer Duration of intervention: 360 days after the initial lecture Funding: "This study was funded by the Ontario Cancer Research Network, by The Change Foundation, and by a University of Toronto continuing education grant. Dr Law is funded by a Ministry of Health Career Scientist Award." |
|
| Outcomes |
Primary outcomes:
Follow‐up: outcomes were assessed 360 days before the standardised lecture and 360 days after. |
|
| Notes | *Sample size calculation based on this outcome | |
| Risk of bias | ||
| Bias | Authors' judgement | Support for judgement |
| Random sequence generation (selection bias) | Low risk | pg 1052/col 1/para 4 Using a computer‐generated scheme we randomised 21 hospitals to the treatment arm and 21 to the control arm. |
| Allocation concealment (selection bias) | Low risk | Allocation was by hospital with hospitals as the unit of random assignment at which a local OL had been identified. |
| Baseline outcome measurements similar | Low risk | pg 1052/col 2/para 3 There was a baseline difference in the mean number of lymph nodes removed between the 2 arms of the study that occurred despite randomisation. This factor was adjusted for in the statistical analysis. All other patient and hospital factors were equally distributed (table 1). |
| Baseline characteristics similar | Low risk | pg 1052/col 2/para 3 No clinically important differences in either patient or tumour characteristics were identified between the colon cancer cases in the control and intervention arms 360 days before or 360 days after the standardised lecture (table 1). |
| Blinding (performance bias and detection bias) All outcomes | Low risk | The outcomes were objective. |
| Incomplete outcome data (attrition bias) All outcomes | Low risk | Outcome data were most likely retrieved from patient records and therefore there should be no attrition. |
| Protection against contamination | Low risk | The hospital was the unit of allocation. |
| Selective reporting (reporting bias) | Low risk | All outcomes mentioned in the methods section were presented in the results. |
| Other bias | Low risk | No other risk of bias identified |
A&F: audit and feedback; ACE: angiotensin‐converting‐enzyme; AECOM: Architecture, Engineering, Consulting and Maintenance; AMI: acute myocardial infarction; APPROACH: Alberta Provincial Project for Outcome Assessment in Coronary Heart Disease; ARB: angiotensin II receptor blocker; CME: continuing medical education; col: column; COPD: chronic obstructive pulmonary disease; ECG: electrocardiogram; ED: emergency department; EI: education influentials; ESP‐CAD: Enhancing Secondary Prevention in Coronary Artery Disease; fig: figure; GA: gestational age; HbA1C: Glycated haemoglobin (haemoglobin A1c); HCQIP: Health Care Quality Improvement Program; HF: heart failure; HMO: Health Maintenance Organisation; HP: health partners; ICSI: Institute for Clinical Systems Improvement; IHD: ischaemic heart disease; LDL: low density lipoprotein; MAA: Motor Accidents Authority; MD: mean difference; min: minutes; NICE: National Institute of Clinical Excellence; NICU: neonatal intensive care unit; NHS: National Health Services; NP: nurse practitioner; NPIC: national perinatal information centre; OH: overhead; OL: opinion leader; PA: physician assistants; PACE: physician asthma care education; para: paragraph; PCP: primary care physician; PDSA: Plan‐Do‐Study‐Act; pg: page; PROM: preterm premature rupture of membranes; QIRC: the quality initiative in rectal cancer; RD: risk difference; SD: standard deviation; TV: television; VCR: videocassette recorder.
Characteristics of excluded studies [ordered by study ID]
| Study | Reason for exclusion |
|---|---|
| Abgrall 2015 | No description of OLs, or of how they might have been identified |
| Amanyire 2016 | No description of OLs or of how they might have been identified |
| Bloomfield 2005 | Not a randomised trial |
| Brown 2014 | The authors of this paper included local clinical leaders (not OLs) and national opinion leaders (not OLs/peer leaders but the president of the Urological Society of Australia and New Zealand ) |
| Campbell 2013 | Ineligible outcomes |
| Closs 1999 | Method of opinion leaders identification unclear |
| Crowther 2013 | Ineligible study design |
| Denton 2001 | Method of opinion leaders identification unclear |
| Dijkstra 2006 | Unspecified opinion leaders identification method |
| Doyne 2004 | Method of opinion leaders identification unclear |
| Dranitsaris 2001 | Method of opinion leaders identification unclear |
| Dumont 2013 | Ineligible intervention |
| Elliott 2001 | Primary outcome measured knowledge and attitude |
| Enns 2014 | Ineligible study design |
| Eskicioglu 2015 | Not a randomised trial; no description of OLs or of how they might have been identified |
| Finkelstein 2005 | Unspecified opinion leader identification method |
| Gifford 1999 | Primary outcome measured knowledge. Only provider‐reported outcomes |
| Ginsburg 2005 | Not a randomised trial |
| Goldstein 2005 | Did not use opinion leaders |
| Hanson 2005 | Not a randomised trial |
| Harbarth 2002 | Method of opinion leaders identification unclear |
| Haskell 2018 | Protocol. Not OLs |
| Helder 2013 | Ineligible study design |
| Heller 2001 | Unspecified opinion leader identification method. Both groups received OLs |
| Hogg 2005 | Not a randomised trial |
| Holt 2013 | Ineligible study design |
| Huis 2013 | Ineligible intervention |
| Jeffries 2017 | Not OLs, not a randomised trial |
| Jureidini 2009 | Not a randomised trial |
| Kennedy 2012 | Not a local (peer) opinion leader but an expert opinion leader. The authors explain the difference in their paper as "an expert opinion leader was considered distinct from peer opinion leaders who are role models in daily practice, and was a ‘credible authority (often an academic or consultant) able to explain the evidence and respond convincingly to challenges and debate’.” (page 5, 1st column) |
| Kennedy 2014 | Ineligible study design |
| Kennedy 2015 | Clinical experts, not OLs |
| Lakshinarayan 2010 | Both intervention and control groups selected and used OLs. |
| Leathers 2016 | Nominated OLs, not objective outcomes. |
| Li 2013 | Ineligible outcomes |
| Lynch 2016 | OLs were 'informally' observed. Non‐systematic way of identfying OLs |
| Mant 1999 | Opinion leaders not identified by peers |
| McLean 2008 | Not a randomised trial |
| Mehta 2002 | Opinion leaders not identified by peers |
| Mello 2018 | Leadership coaching, not OLs |
| Middleton 2011 | Not OLs |
| Middleton 2016 | Not OLs |
| Middleton 2016b | Not OLs |
| Minto 2006 | Unspecified opinion leader identification method |
| Nicolas 1996 | Not a randomised trial |
| Nilsson 2001 | Ineligible study design |
| Obua 2004 | Unspecified opinion leader identification method |
| Ofman 2003 | Unspecified opinion leader identification method |
| Park 2014 | Ineligible study design |
| Perez 2013 | Ineligible intervention |
| Pinto 2014 | Ineligible intervention |
| Reed 2005 | Not a randomised trial |
| Rubenstein 1999 | Used expert opinion leaders |
| Scholes 2006 | Unspecified opinion leader identification method. Some of the selected OLs declined participation and were replaced by volunteers. We contacted authors to find out how many OLs did decline and were replaced by volunteers, but received no response. |
| Schouten 2007 | Unspecified opinion leader identification method |
| Searle 2002 | Improper opinion leader identification method |
| Seto 1991 | Duplicate publication |
| Shafer 2002 | Intervention did not involve opinion leaders |
| Simon 2006 | Unspecified opinion leader identification method |
| Simunovic 2013 | Ineligible intervention |
| Sinuff 2013 | Ineligible study design |
| Stevenson 2004 | Primary outcome measured attitude |
| Stevenson 2006 | Unspecified opinion leader identification method |
| Sullivan 2005 | Unspecified opinion leader identification method |
| Valero 2014 | Ineligible study design |
| Van Der Meer 2014 | Role models, not opinion leaders |
| Weingarten 1993 | No formal process of identifying opinion leaders identified |
| Wolfenden 2007 | Unspecified opinion leader identification method |
| Wright 2007 | Unspecified opinion leader identification method. Also, both intervention and control groups received the OL intervention |
OL: opinion leader
Characteristics of ongoing studies [ordered by study ID]
Alsweiler 2017.
| Trial name or title | Midwife or doctor local opinion leader to implement a national guideline in babies on postnatal wards ‐ the DesIGN‐project |
| Methods | Multicentre blinded cluster‐randomised trial |
| Participants | New Zealand maternity hospitals that care for babies born at risk of neonatal hypoglycaemia |
| Interventions | Midwife or doctor local opinion leader to implement a national guideline |
| Outcomes | The primary outcome will be the change in the proportion of hypoglycaemic babies treated with dextrose gel from before implementation of the guideline to 3 months after implementation. |
| Starting date | 01/05/2015 |
| Contact information | Dr Jane Alsweiler University of Auckland Private Bag 92019 Auckland 1142 New Zealand |
| Notes | Protocol |
Bosch 2014.
| Trial name or title | Part of the Neurotrauma Evidence Translation (NET) programme |
| Methods | Cluster‐randomised trial |
| Participants | Australian emergency departments and people with mild traumatic brain injury (18 years of age or older) who present at the ED following mild head injuries (concussion) |
| Interventions | OLs part of multifaceted intervention. A targeted, theory‐ and evidence‐informed implementation intervention to increase the uptake of three key clinical recommendations regarding the emergency department management of adult people compared with passive dissemination of these recommendations |
| Outcomes | Percentage of people for which appropriate post‐traumatic amnesia screening is performed |
| Starting date | 12/12/12 |
| Contact information | Correspondence: Marie Bosch. Email: marije.bosch@monash.edu Department of Surgery, Central Clinical School, Monash University, Melbourne, Australia and National Trauma Research Institute, The Alfred & Monash University,Melbourne, Australia |
| Notes | Protocol |
ISRCTN50041378.
| Trial name or title | A feasibility study and pilot randomised trial of an intervention designed to reduce unnecessary caesarean section in Ireland (REDUCE‐project) |
| Methods | Feasibility study and pilot cluster‐randomised trial |
| Participants | N = 2 hospital sites in Ireland 1. Pregnant women 2. Aged over 18 3. Speak either English or a language for which translation is available 4. Give informed consent |
| Interventions | Based on existing evidence, the intervention will likely consist of an appointment of an obstetric and midwife opinion leader (OOL, MOL) who will facilitate women‐centred, evidence‐based antenatal classes (2 classes) and information session for clinicians, providing accurate information on the risks and benefits of both VBAC and repeat CS, second opinions for all CSs (other than category 1), peer review of each CS and feedback, reducing induction of labour rates, support of clinicians and women to choose normal options over medical intervention (e.g. mobility instead of oxytocin, water bath instead of pharmacological pain relief, reducing use of EFM in low‐risk women). Participants at the control site receive usual care as per current hospital practice. Participants at both sites are followed through pregnancy, up to 6 months postpartum. |
| Outcomes | Primary outcome: Caesarean section rate (overall per site) is measured using hospital birth records. Secondary outcomes: 1. Labour interventions (e.g. induction and acceleration of labour, pain relief used, electronic foetal monitoring) are measured by reviewing women's hospital labour and birth records. 2. Maternal/neonatal morbidities (e.g. postpartum haemorrhage, perineal trauma, wound infection, need for neonatal resuscitation, neonatal admission to intensive care, readmission to hospital) are assessed using hospital records. 3. Mother and baby health problems are assessed using self‐completion surveys (health and well‐being questionnaires that include the SF‐36 instrument) during pregnancy and at 3 and 6 months postnatal. 4. Clinician attitudes to caesarean section are measured by a self‐completion questionnaire adapted from the UK National Sentinel Caesarean Section Audit. 5. Feasibility and pilot outcomes (% eligible and participating, time to recruit, etc.) are assessed using trial screening and eligibility forms, numbers participating (consent forms) and time to recruit full sample size (months). |
| Starting date | 01/09/2017 |
| Contact information | Prof Cecily Begley (Public), cbegley@tcd.ie |
| Notes | Trial registration |
Johnson 2006.
| Trial name or title | A cluster randomised controlled trial comparing three methods of disseminating practice guidelines for children with croup [ISRCTN73394937]. |
| Methods | Cluster‐randomised trial "We propose to use a matched pair cluster trial in 24 Alberta hospitals randomised into three intervention groups. We will use mixed methods to assess outcomes including linkage and analysis of administrative databases obtained from Alberta Health and Wellness, retrospective medical chart audit, and prospective telephone surveys of the parents of children diagnosed to have croup." |
| Participants | Children with croup |
| Interventions | The intervention strategies to be compared will be mailing of printed educational materials (low‐intensity intervention), mailing plus a combination of interactive educational meetings, educational outreach visits, and reminders (intermediate‐intensity intervention), and a combination of mailing, interactive sessions, outreach visits, reminders plus identification of local OLs and establishment of local consensus processes (high‐intensity intervention). |
| Outcomes | The primary objective is to determine which of the three intervention strategies are most effective at lowering the rate of hospital days per 1,000 disease episodes. Secondary objectives are to determine which of the three dissemination strategies are most effective at increasing the use of therapies of known benefit. An economic analysis will be conducted to determine which of the three intervention strategies will most effectively reduce total societal costs including all health care costs, costs borne by the family, and costs stemming from the strategies for disseminating guidelines. |
| Starting date | 01/12/2001 |
| Contact information | Email: David W Johnson ‐ david.johnson@calgaryhealthregion.ca Address: Department of Pediatrics, Faculty of Medicine, University of Calgary, Calgary Alberta, Canada |
| Notes | Study results not published. Only the protocol |
McKenzie 2013.
| Trial name or title | The Implementing Research Implementation Streategies (IRIS) trial |
| Methods | Cluster‐randomised trial |
| Participants | Older people with suspected cognitive impairment in general practice; 60 practices per group |
| Interventions | Interactive educational face‐to‐face workshop led by a geriatrician (OL) with expertise in dementia |
| Outcomes | GPs’ detection and diagnosis of behaviours directed toward people meeting the inclusion criteria. |
| Starting date | September 2011 |
| Contact information | Correspondance: joanne.mckenzie@monash.edu School of public Health and Preventive Medicine; Monash University; The Alfred Centre, 99 Commercial Road, Melbourne , Australia |
| Notes | Protocol only |
Tello‐Bernabe 2011.
| Trial name or title | Cluster randomised trial for evaluate the effectiveness of an implementation strategy of a clinical practice guideline for patients with anxiety disorders (GRITA in Spanish) |
| Methods | Cluster‐randomised trial |
| Participants | The intervention will be made on health professionals (physicians, nurses, and social workers) of primary healthcare centres (PHCC) in the region of Madrid, Spain. Participants are people with anxiety disorder. The number of participants required is 296 (148 in each arm), all older than 18 years and diagnosed with generalised anxiety disorder, panic disorder, and panic attacks by the Diagnostic and Statistical Manual of Mental Disorders‐IV (DSM‐IV). They are chosen by consecutive sampling. |
| Interventions | The project aims to determine whether the use of implementation strategy (including training session, information, OL, reminders, audit, and feed‐back) of CPG for people with anxiety disorders in primary care is more effective than usual diffusion. |
| Outcomes | The main outcome variable is the change in two or more points in Goldberg anxiety scale at six and twelve months. Secondary outcome variables include quality of life (EQ 5D), and degree of compliance with the CPG recommendations on treatment, information, and referrals to mental health services. |
| Starting date | 15/09/2010 |
| Contact information | Correspondence: Eugenia Tello‐Barnabe, Email: mtello.gapm09@salud.madrid.org Centro de Salud El Naranjo. Gerencia Atención Primaria. Servicio Madrileño de Salud, Spain |
| Notes | Protocol only |
CPG: clinical practice guidelines; CS: caesarean section; DSM‐IV: the Diagnostic and Statistical Manual of Mental Disorders‐IV; ED: emergency department; EFM: electronic fetal monitor; EuroQol 5D: standardised instrument for measuring generic health status; IRIS: Implementing Research Implementation Strategies; LTC: long‐term care; MOL: midwife opinion leader; OL: opinion leader; OOL: obstetric opinion leader; PHCC: primary health care centres; SF‐36: the short from (36) health survey; VBAC: vaginal birth after caesarian delivery
Differences between protocol and review
Two of the authors who contributed to the previous version of the review (Flodgren 2011) have left the review author team (Professor Martin Eccles and Melina Gattellari).
We expanded the scope of the review to include not only studies in which one of the four predefined (named) methods was used to identify OLs, but also studies that used other methods, as described by Valente and colleagues (Valente 2007).
We did not search SIGLE for this update, as it was no longer being updated.
We updated the methods used in this review to comply with current EPOC and MECIR standards. We used the GRADE tool to assess the certainty of the included evidence and added four 'summary of findings' tables to the review.
The protocol for this review was published over twenty years ago. Since then, there have been changes in the authorship, the predefined comparisons are slightly different, the methods outlined in the review are more comprehensive than the original plan and meet the current Cochrane/ EPOC standards for systematic reviews of interventions . We expanded the list of eligible outcomes with the inclusion of cost and cost‐effectiveness but found no eligible studies.
Contributions of authors
GF: screening of titles for inclusion, data extraction and risk of bias assessment, grading of the evidence, screening a second update search, producing a long list of possible included studies, and leading the writing of the review
EP: screening of titles for inclusion, data extraction, 'risk of bias' assessment and grading of the evidence
MAO'B: data extraction, 'risk of bias' assessment, grading of the evidence, and assessment of the citations of the second update search for eligibility
JG: commenting on review drafts
All authors commented on and approved the final version.
Sources of support
Internal sources
University of New South Wales and Sydney South West Area Health Service, Australia.
Institute of Population Health, University of Ottawa, Ottawa, Canada.
Supportive Cancer Care Research Unit, Hamilton, Canada.
Department of General Surgery, Ottawa Hospital, Ottawa, Canada.
Department of Epidemiology & Community Medicine, University of Ottawa, Canada.
Institute of Health and Society, Newcastle University, UK.
External sources
Canada Research Chair in Health Knowledge Transfer and Uptake, Canada.
NHMRC Post‐doctoral Training Fellowship, Australia.
NHR EPOC Program Grant, UK.
Declarations of interest
Authors
GF: declares no conflicts of interests.
MAOB: declares no conflicts of interest
EP: declares no conflicts of interests
JG: holds a 'Canada Research Chair in Health Knowledge Transfer and Uptake’
Referees
IT: was a Board Member of MHE in 2016, which included some trips abroad
SS: declares no conflict of interest
AI: declares no conflict of interest
RP: declares no conflict of interest
EL: declares a potential COI: "I am a member of the Board of Directors of Evidence Synthesis International (ESI), which is co‐chaired by one of the authors of the review (JG)"
CHR: declares no conflict of interest
JH: declares no conflict of interest
New search for studies and content updated (no change to conclusions)
References
References to studies included in this review
Althabe 2008 {published data only}
- Althabe F, Buekens P, Bergel E, Belizán JM, Campbell KM, Moss N, et al. A behavioural intervention to Improve obstetrical care. New England Journal of Medicine 2008;358:1929‐40. [DOI] [PubMed] [Google Scholar]
Berner 2003 {published data only}
- Berner ES, Baker CS, Funkhouser E, Heudebert GR, Allison JJ, Fargason CA, et al. Do local opinion leaders augment hospital quality improvement efforts? A randomized trial to promote adherence to unstable angina guidelines. Medical Care 2003;41(3):420‐31. [DOI] [PubMed] [Google Scholar]
Cabana 2006 {published data only}
- Cabana KK, Evans SD, Mellins RB, Brown RW, Lin X, Kacirotiand N, et al. Impact of physician asthma care education on patient outcomes. Pediatrics 2006;117:2149‐57. [DOI] [PubMed] [Google Scholar]
Elliott 1997 {published data only}
- Elliott TE, Murray DM, Oken MM, Johnson KM, Braun BL, Elliott BA, et al. Improving cancer pain management in communities: main results from a randomized controlled trial. Journal of Pain & Symptom Management 1997;13:191‐203. [DOI] [PubMed] [Google Scholar]
Guadagnoli 2000 {published data only}
- Guadagnoli E, Soumerai SB, Gurwitz JH, Borbas C, Shapiro CL, Weeks JC, et al. Improving discussion of surgical treatment options for patients with breast cancer: local medical opinion leaders versus audit and performance feedback. Breast Cancer Research and Treatment 2000;61(2):171‐5. [DOI] [PubMed] [Google Scholar]
Hodnett 1996 {published and unpublished data}
- Hodnett E, Kaufmann K, O’Brien‐Pallas L, Chipman M. A Strategy to Promote Research‐Based Nursing Care: Effects on Childbirth Outcomes (final report of project no. 6606‐4076‐57E). Canada: National Health Research and Development Program, 1994. [DOI] [PubMed] [Google Scholar]
- Hodnett ED, Kaufmann K, O'Brien‐Pallas L, Chipman M, Watson‐MacDonell J, Hunsberger W. A strategy to promote research‐based nursing care: effects on childbirth outcomes. Research in Nursing and Health 1996;19:13‐20. [DOI] [PubMed] [Google Scholar]
Hong 1990 {published data only}
- Hong SW, Ching TY, Fung JP, Seto WL. The employment of ward opinion leaders for continuing education in the hospital. Medical Teacher 1990;12:209‐17. [DOI] [PubMed] [Google Scholar]
Johnston 2007 {published data only}
- Johnston CC, Gagnon A, Rennick J, Rosmus C, Patenaude H, Ellis J, et al. One to one coaching to improve pain assessment and management practices of pediatric nurses. Journal of Pediatric Nursing 2007;22(6):467‐8. [DOI] [PubMed] [Google Scholar]
Leviton 1999 {published data only}
- Leviton LC, Goldenberg RL, Baker CS, Schwartz RM, Freda MC, Fish LJ, et al. Methods to encourage the use of antenatal corticosteroid therapy for fetal maturation. A randomized controlled trial. JAMA 1999;281(1):46‐52. [DOI] [PubMed] [Google Scholar]
Lomas 1991 {published data only}
- Lomas J, Enkin M, Anderson GM, Hannah WJ, Vayda E, Singer J. Opinion leaders vs audit and feedback to implement practice guidelines. Delivery after previous cesarean section. JAMA 1991;265(17):2202‐7. [PubMed] [Google Scholar]
Majumdar 2007 {published data only}
- Majumdar SR, Tsuyuki RT, McAlister FA. Impact of opinion leader‐endorsed evidence summaries on the quality of prescribing for patients with cardiovascular disease: a randomized controlled trial. American Heart Journal 2007;153:22.e1‐.e8. [DOI] [PubMed] [Google Scholar]
Majumdar 2008 {published data only}
- Majumdar SR, Johnson JA, McAlister FA, Bellerose D, Russell AS, Hanley DA, et al. Multifaceted intervention to improve diagnosis and treatment of osteoporosis in patients with recent wrist fracture: a randomized controlled trial . Canadian Medical Association Journal 2008;178(5):569‐75. [DOI] [PMC free article] [PubMed] [Google Scholar]
McAlister 2009 {published data only}
- McAlister FA, Fradette M, Majumdar SR, Williams R, Graham M, McMeekin J, et al. The enhancing secondary prevention in coronary artery disease trial: principal results. Canadian Medical Association Journal 2009;181(12):897‐904. [DOI] [PMC free article] [PubMed] [Google Scholar]
O'Connor 2009 {published data only}
- O'Connor PJ, Sperl‐Hillen JM, Johnson PE, Rush WA, Asche SE, Dutta P, et al. Simulated physician learning intervention to improve safety and quality of diabetes care: a randomized trial. Diabetes Care 2009;32(4):585‐90. [DOI] [PMC free article] [PubMed] [Google Scholar]
Rebbeck 2006 {published data only}
- Rebbeck T, Maher CG, Refshauge KM. Evaluating two implementation strategies for whiplash guidelines in physiotherapy: a cluster‐randomised trial. Australian Journal of Physiotherapy 2006;52:165‐74. [DOI] [PubMed] [Google Scholar]
Rycroft‐Malone 2012 {published data only}
- Rycroft‐Malone J, Seers K, Crichton N, Chandler J, Hawkes CH, Allen C, et al. A pragmatic cluster randomised trial evaluating three implementation interventions. Implementation Science 2012;7(80):1‐17. [DOI] [PMC free article] [PubMed] [Google Scholar]
Schectman 2003 {published data only}
- Schectman JM, Schroth WS, Verme D, Voss JD. Randomized controlled trial of education and feedback for implementation of guidelines for acute low back pain. Journal of General Internal Medicine 2003;18(10):773‐80. [DOI] [PMC free article] [PubMed] [Google Scholar]
Simunovic 2010 {published data only}
- Simunovic M, Coates A, Goldsmith CH, Thabane L, Reeson D, Smith A. The cluster‐randomized quality Initiative in rectal cancer trial: evaluating a quality‐improvement strategy in surgery. Canadian Medical Association Journal 2010;182(12):1301‐6. [DOI: 10.1503/cmaj.091883] [DOI] [PMC free article] [PubMed] [Google Scholar]
Sisk 2004 {published data only}
- Sisk JE, Greer AL, Wojtowycz M, Pincus LB, Aubry RH. Implementing evidence‐based practice: evaluation of an opinion leader strategy to improve breast‐feeding rates. American Journal of Obstetrics and Gynecology 2004;190(2):413‐21. [DOI] [PubMed] [Google Scholar]
Soumerai 1998 {published data only}
- Soumerai SB, McLaughlin TJ, Gurwitz JH, Guadagnoli E, Hauptman PJ, Borbas C, et al. Effect of local medical opinion leaders on quality of care for acute myocardial infarction. A randomized controlled trial. JAMA 1998;279:1358‐63. [DOI] [PubMed] [Google Scholar]
Stross 1980 {published data only}
- Stross JK, Bole GG. Evaluation of a continuing education program in rheumatoid arthritis. Arthritis and Rheumatology 1980;23(7):846‐9. [DOI] [PubMed] [Google Scholar]
Stross 1983 {published data only}
- Stross JK, Hiss RG, Watts CM, Davis WK, MacDonald R. Continuing education in pulmonary disease for primary‐care physicians. American Review of Respiratory Disease 1983;127(6):739‐46. [DOI] [PubMed] [Google Scholar]
Stross 1985 {published data only}
- Stross JK, Bole GG. Evaluation of an educational program for primary care practitioners, on the management of osteoarthritis. Arthritis and Rheumatology 1985;28(1):108‐11. [DOI] [PubMed] [Google Scholar]
Wright 2008 {published data only}
- Wright FC, Gagliardi AR, Law CHL, Last LD, Klevan EA, Hongjinda S, et al. A randomized controlled trial to Improve lymph node assessment in stage II colon cancer. Archives of Surgery. 2008;143(11):1050‐5. [DOI] [PubMed] [Google Scholar]
References to studies excluded from this review
Abgrall 2015 {published data only}
- Abgrall S, Rachas A, Tourret J, Isnard‐Bagnis C, Billaud E, Tattevin P, et al. A multifaceted intervention designed to improve medical management of moderate to advanced chronic kidney disease in HIV‐infected patients: a cluster randomized trial. Clinical Infectious Diseases 2015;61(3):375‐84. [DOI] [PubMed] [Google Scholar]
Amanyire 2016 {published data only}
- Amanyire G, Semitala FC, Namusobya J, Katuramu R, Kampiire L, Wallenta J, et al. Effects of a multicomponent intervention to streamline initiation of antiretroviral therapy in Africa: a stepped‐wedge cluster‐randomised trial. Lancet HIV 2016;3(11):e539‐e548. [DOI] [PMC free article] [PubMed] [Google Scholar]
- Amanyire G, Semitala FC, Namusobya J, Katuramu R, Kampiire L, Wallenta J, et al. Streamlining antiretroviral therapy uptake: a stepped‐wedge cluster randomized trial. Topics in Antiviral Medicine 2016;24(e‐1):45‐46. [Google Scholar]
Bloomfield 2005 {published data only}
- Bloomfield HE, Nelson DB, Ryn M, Neil BJ, Koels NJ, Basile JN, et al. A trial of education, prompts, and opinion leaders to improve prescription of lipid modifying therapy by primary care physicians for patients with ischaemic heart disease. Quality and Safety in Health Care 2005;14:258‐63. [DOI] [PMC free article] [PubMed] [Google Scholar]
Brown 2014 {published data only}
- Brown B, Young J, Smith DP, Kneebone AB, Brooks AJ, Xhilaga M, et al. Clinician‐led improvement in cancer care (CLICC) ‐ testing a multifaceted implementation strategy to increase evidence‐based prostate cancer care: phased randomised controlled trial ‐ study protocol. Implementation Science 2014;9:1‐11. [DOI] [PMC free article] [PubMed] [Google Scholar]
Campbell 2013 {published data only}
- Campbell L, Novak I, McIntyre S, Lord S. A KT intervention including the evidence alert system to improve clinician's evidence‐based practice behavior ‐ a cluster randomized controlled trial. Implementation Science 2013;8:1‐15. [DOI] [PMC free article] [PubMed] [Google Scholar]
Closs 1999 {published data only}
- Closs SJ, Briggs M, Everitt VE. Implementation of research findings to reduce postoperative pain at night. International Journal of Nursing Studies 1999;36(1):21‐31. [DOI] [PubMed] [Google Scholar]
Crowther 2013 {published data only}
- Crowther CA, Middleton PF, Bain E, Ashwood P, Bubner T, Flenady V, et al. Working to improve survival and health for babies born very preterm: the WISH project protocol. BMC Pregnancy and Childbirth 2013;13:1‐7. [DOI] [PMC free article] [PubMed] [Google Scholar]
Denton 2001 {published data only}
- Denton GD, Smith J, Faust J, Holmboe E. Comparing the efficacy of staff versus housestaff instruction in an intervention to improve hypertension management. Academic Medicine 2001;76(12):1257‐60. [DOI] [PubMed] [Google Scholar]
Dijkstra 2006 {published data only}
- Dijkstra RF, Niessen W, Braspenning JCC, Adang E, Grol R. Patient‐centred and professional‐directed implementation strategies for diabetes guidelines: a cluster‐randomised trial‐based cost‐effectiveness analysis. Diabetic Medicine 2005;23:164‐70. [DOI] [PubMed] [Google Scholar]
Doyne 2004 {published data only}
- Doyne EO, Alfaro MP, Siegel RM, Atherton HD, Schoettker PJ, Bernier J, et al. A randomized controlled trial to change antibiotic prescribing patterns in a community. Archives of Pediatrics and Adolescent Medicine 2004;158(6):577‐83. [DOI] [PubMed] [Google Scholar]
Dranitsaris 2001 {published data only}
- Dranitsaris G, Leung P, Warr D. Implementing evidence based antiemetic guidelines in the oncology setting: results of a 4‐month prospective intervention study. Supportive Care in Cancer 2001;9(8):611‐8. [DOI] [PubMed] [Google Scholar]
Dumont 2013 {published data only}
- Dumont A, Fournier P, Abrahamowicz M, Traore M, Haddad S, Fraser WD, et al. Quality of care, risk management, and technology in obstetrics to reduce hospital‐based maternal mortality in Senegal and Mali (QUARITE): a cluster‐randomised trial. Lancet 2013;382:146‐57. [DOI] [PubMed] [Google Scholar]
Elliott 2001 {published data only}
- Elliott TE, Elliott BA, Regal RR, Renier CM, Crouse BJ, Gangeness DE, et al. Lake Superior rural cancer care project, part II: provider knowledge. Cancer Practice 2001;9(1):37‐46. [DOI] [PubMed] [Google Scholar]
Enns 2014 {published data only}
- Enns E, Rhemtulla R, Ewa V, Fruetel K, Holroyd‐Leduc JM. A controlled quality improvement trial to reduce the use of physical restraints in older hospitalized adults. Journal of the American Geriatrics Society 2014;62:541‐5. [DOI] [PubMed] [Google Scholar]
Eskicioglu 2015 {published data only}
- Eskicioglu C, Pearsall E, Victor CJ, Aarts M‐A, Okrainec A, McLeod RS. A multifaceted knowledge translation strategy can increase compliance with guideline recommendations for mechanical bowel preparation. Journal of Gastrointestinal Surgery 2015;19(1):39‐45. [DOI] [PubMed] [Google Scholar]
Finkelstein 2005 {published data only}
- Finkelstein JA, Lozano P, Fuhlbrigge AL, Carey VJ, Inui TS, Soumerai SB, et al. Practice‐level effects of interventions to improve asthma care in primary care settings: the pediatric asthma care patient outcomes research team. Health Service Research 2005;40(6):1737‐57. [DOI] [PMC free article] [PubMed] [Google Scholar]
Gifford 1999 {published data only}
- Gifford DR, Holloway RG, Frankel MR, Albright CL, Meyerson R, Griggs RC, et al. Improving adherence to dementia guidelines through education and opinion leaders. A randomized, controlled trial. Annals of Internal Medicine 1999;131(4):237‐46. [DOI] [PubMed] [Google Scholar]
Ginsburg 2005 {published data only}
- Ginsburg L, Norton PG, Casebeer A, Lewis S. An educational intervention to enhance nurse leaders' perceptions of patient safety culture. Health Service Research 2005;40:997‐1020. [DOI] [PMC free article] [PubMed] [Google Scholar]
Goldstein 2005 {published data only}
- Goldstein MK, Lavori P, Coleman R, Advani A, Hoffman BB. Improving adherence to guidelines for hypertension drug prescribing: cluster‐randomized controlled trial of general versus patient‐specific recommendations. American Journal of Managed Care 2005;11:677‐85. [PubMed] [Google Scholar]
Hanson 2005 {published data only}
- Hanson LC, Reynolds KS, Henderson M, Pickard CG. A quality improvement intervention to increase palliative care in nursing homes. Journal of Palliative Medicine 2005;8:576‐84. [DOI] [PubMed] [Google Scholar]
Harbarth 2002 {published data only}
- Harbarth S, Pittet D, Grady L, Zawacki A, Potter‐Bynoe G, Samore MH, et al. Interventional study to evaluate the impact of an alcohol‐based hand gel in improving hand hygiene compliance. Pediatric Infectious Disease Journal 2002;21(6):489‐95. [DOI] [PubMed] [Google Scholar]
Haskell 2018 {published data only}
- Haskell L, Tavender E, Wilson C, O'Brien S, Babl FE, Borland ML, et al. Implementing evidence‐based practices in the care of infants with bronchiolitis in Australasian acute care settings: study protocol for a cluster randomised controlled study. BMC Pediatrics 2018; Vol. 6, issue 1:218. [DOI] [PMC free article] [PubMed]
Helder 2013 {published data only}
- Helder O, Kornelisse R, Starre C, Tibboel D, Looman C, Wijnen R, et al. Implementation of a children's hospital‐wide central venous catheter insertion and maintenance bundle. BMC Health Services Research 2013;13:417. [DOI] [PMC free article] [PubMed] [Google Scholar]
Heller 2001 {published data only}
- Heller RF, D'Este C, Lim LL, O'Connell RL, Powell H. Randomised controlled trial to change the hospital management of unstable angina. Medical Journal of Australia 2001;174(5):217‐21. [DOI] [PubMed] [Google Scholar]
Hogg 2005 {published data only}
- Hogg W, Baskerville N, Lemelin J. Cost savings associated with improving appropriate and reducing inappropriate preventive care: cost‐consequences analysis. BMC Health Service Research 2005;5:1‐15. [DOI] [PMC free article] [PubMed] [Google Scholar]
Holt 2013 {published data only}
- Holt R, Young J, Heseltine D. Effectiveness of a multi‐component intervention to reduce delirium incidence in elderly care wards. Age and Ageing 2013;42:721‐7. [DOI] [PubMed] [Google Scholar]
Huis 2013 {published data only}
- Huis A, Hulscher M, Adang E, Grol R, Achterberg T, Schoonhoven L. Cost‐effectiveness of a team and leaders‐directed strategy to improve nurses' adherence to hand hygiene guidelines: a cluster randomised trial. International Journal of Nursing Studies 2013;50:518‐26. [DOI] [PubMed] [Google Scholar]
- Huis A, Schoonhoven L, Grol R, Donders R, Hulscher M, Achterberg T. Impact of a team and leaders‐directed strategy to improve nurses' adherence to hand hygiene guidelines: a cluster randomised trial. International Journal of Nursing Studies 2013;50:464‐74. [DOI] [PubMed] [Google Scholar]
Jeffries 2017 {published data only}
- Jeffries IV WL, Garrett S, Phields M, Olubajo B, Lemon E, Valdes‐Salgado R, et al. Implementation of evidence‐based HIV interventions for gay, bisexual, and other men who have sex with men. Aids and Behavior 2017;21(10):3000‐12. [DOI] [PubMed] [Google Scholar]
Jureidini 2009 {published data only}
- Jureidini JN, McHenry LB. Key opinion leaders and paediatric antidepressant overprescribing. Psychotherapy and Psychosomatology 2009;78:197‐201. [DOI] [PubMed] [Google Scholar]
Kennedy 2012 {published data only}
- Kennedy CC, Ioannidis G, Giangregorio LM, Adachi JD, Thabane L, Morin SN, et al. An interdisciplinary knowledge translation intervention in long‐term care: study protocol for the vitamin D and osteoporosis study (ViDOS) pilot cluster randomized controlled trial. Implementation Science 2012;7:48. [DOI] [PMC free article] [PubMed] [Google Scholar]
Kennedy 2014 {published data only}
Kennedy 2015 {published data only}
- Kennedy CC, Ioannidis G, Thabane L, Adachi JD, Marr S, Giangregorio LM, et al. Successful knowledge translation intervention in long‐term care: final results from the vitamin D and osteoporosis study (ViDOS) pilot cluster randomized controlled trial. Trials. 2015;12(16):214. [DOI] [PMC free article] [PubMed] [Google Scholar]
Lakshinarayan 2010 {published data only}
- Lakshminarayan K, Borbas C, McLaughlin B, Morris NE, Vazquez G, Luepker RV, et al. A cluster‐randomized trial to improve stroke care in hospitals. Neurology 2010;74:1634‐42. [DOI] [PMC free article] [PubMed] [Google Scholar]
Leathers 2016 {published data only}
- Leathers SJ, Spielfogel JE, Blakey J, Christian E, Atkins MS. The effect of a change agent on use of evidence‐based mental health practices. Administration and Policy in Mental Health and Mental Health Services Research 2016; Vol. 43, issue 5:768‐82. [DOI] [PMC free article] [PubMed]
Li 2013 {published data only}
- Li L, Guan J, Liang LJ, Lin C, Wu Z. Popular opinion leader intervention for HIV stigma reduction in health care settings. AIDS Education & Prevention 2013;25:327‐35. [DOI] [PMC free article] [PubMed] [Google Scholar]
- Li L, Liang LJ, Wu Z, Lin C, Guan J. Assessing outcomes of a stigma‐reduction intervention with venue‐based analysis. Social Psychiatry & Psychiatric Epidemiology 2014;49:991‐9. [DOI] [PMC free article] [PubMed] [Google Scholar]
- Li L, Lin C, Guan J, Wu Z. Implementing a stigma reduction intervention in healthcare settings. Journal of the International AIDS Society 2013;16:1‐8. [DOI] [PMC free article] [PubMed] [Google Scholar]
- Li L, Wu Z, Liang LJ, Lin C, Guan J, Jia M, et al. Reducing HIV‐related stigma in health care settings: a randomized controlled trial in China. American Journal of Public Health 2013;103:286‐92. [DOI] [PMC free article] [PubMed] [Google Scholar]
Lynch 2016 {published data only}
- Lynch EA, Cadilhac DA, Luker JA, Hillier SL. Education‐only versus a multifaceted intervention for improving assessment of rehabilitation needs after stroke; a cluster randomised trial. Implementation Science 2016; Vol. 11, issue 1:120. [DOI] [PMC free article] [PubMed]
Mant 1999 {published data only}
- Mant J, Hicks NR, Dopson S, Hurley P. Uptake of research findings in clinical practice: a controlled study of the impact of a brief external intervention on the use of corticosteroids in preterm delivery. Journal of Evaluation in Clinical Practice 1999;5(1):73‐9. [DOI] [PubMed] [Google Scholar]
McLean 2008 {published data only}
- McLean DL, McAlister FA, Johnson JA, King KM, Makowsky MJ, Jones CA, et al. A randomised trial of the effect of community pharmacist and nurse care on improving blood pressure management in patients with diabetes mellitus. Archives of Internal Medicine 2008;168(21):2355‐61. [DOI] [PubMed] [Google Scholar]
Mehta 2002 {published data only}
- Mehta RH, Montoye CK, Gallogly M, Baker P, Blount A, Faul J, et al. Improving quality of care for acute myocardial infarction: the Guidelines Applied in Practice (GAP) initiative. JAMA 2002;287(10):1269‐76. [DOI] [PubMed] [Google Scholar]
Mello 2018 {published data only}
- Mello MJ, Becker SJ, Bromberg J, Baird J, Zonfrillo MR, Spirito A. Implementing alcohol misuse SBIRT in a national cohort of pediatric trauma centers ‐ a type III hybrid effectiveness‐implementation trial. Implementation Science 2018; Vol. 13, issue 35:1‐10. [DOI] [PMC free article] [PubMed]
Middleton 2011 {published data only}
- Middleton S, McElduff P, Ward J, Grimshaw JM, Dale S, D'Este C, et al. Implementation of evidence‐based treatment protocols to manage fever, hyperglycaemia, and swallowing dysfunction in acute stroke (QASC): a cluster randomised controlled trial. Lancet 2011; Vol. 378, issue 9804:1699‐1706. [DOI] [PubMed]
Middleton 2016 {published data only}
- Middleton S, Considine J, Dale S, Cheung NW, McInnes E, Considine J, et al. Improving triage, treatment and transfer of patients with stroke in Emergency Departments: the T3 trial. Emergency Medicine Australasia 2018;30 Suppl 1:12. [Google Scholar]
- Middleton S, Levi C, Dale S, Cheung NW, McInnes E, Considine J, et al. The T3 trial: triage, treatment and transfer of patients with stroke in emergency departments. European Stroke Journal 2017;2(1 Suppl 1):490‐1. [Google Scholar]
- Middleton S, Levi C, Dale S, Cheung NW, McInnes E, Considine J, et al. Triage, treatment and transfer of patients with stroke in emergency department trial (the T3 trial): a cluster randomised trial protocol. Implementation Science 2016; Vol. 11, issue 1:139. [DOI] [PMC free article] [PubMed]
- Middleton S, Levi C, Dale S, Wah CN, McInnes E, Considine J, et al. The T3 Trial: triage, treatment and transfer of patients with stroke in emergency departments. International Journal of Stroke 2017;12(2 Suppl 1):15. [Google Scholar]
Middleton 2016b {published data only}
- Middleton S, Lydtin A, Comerford D, Cadilhac DA, McElduff P, Dale S, et al. From QASC to QASCIP: successful Australian translational scale‐up and spread of a proven intervention in acute stroke using a prospective pre‐test/post‐test study design. BMJ Open 2016; Vol. 6, issue 5:1‐13. [DOI] [PMC free article] [PubMed]
Minto 2006 {published data only}
- Jain MK, Heyland D, Dhaliwal R, Day AG, Drover J, Keefe L, et al. Dissemination of the Canadian clinical practice guidelines for nutrition support: result of a cluster randomised trial. Critical Care Medicine 2006;34(9):2362‐9. [DOI] [PubMed] [Google Scholar]
Nicolas 1996 {published data only}
- Nicolas F, Raimondeau J, Blanloeil Y, Le CP, Villers D, Touze MD. Cost analysis, consensus conference, medical audit. Journal D'Economie Medicale 1996;14(3):145‐57. [Google Scholar]
Nilsson 2001 {published data only}
- Nilsson G, Hjemdahl P, Hassler A, Vitols S, Wallen NH, Krakau I. Feedback on prescribing rate combined with problem‐orientated pharmacotherapy education as a model to improve prescribing behaviour among general practitioners. European Journal of Clinical Pharmacology 2001;56(11):843‐8. [DOI] [PubMed] [Google Scholar]
Obua 2004 {published data only}
- Obua C, Ogwal‐Okeng JW, Waako P, Aupont O, Ross‐Degnan D. Impact of an educational intervention to improve prescribing by private physicians in Uganda. East African Medical Journal 2004;2:S17‐24. [PubMed] [Google Scholar]
Ofman 2003 {published data only}
- Ofman JJ, Segal R, Russell WL, Cook DJ, Sandhu M, Maue SK, et al. A randomized trial of an acid‐peptic disease management program in a managed care environment. American Journal of Managed Care 2003;9(6):425‐33. [PubMed] [Google Scholar]
Park 2014 {published data only}
- Park MM, Zafran H, Stewart J, Salsberg J, Ells C, Rouleau S, et al. Transforming mental health services: a participatory mixed methods study to promote and evaluate the implementation of recovery‐oriented services. Implementation Science 2014;9:1‐11. [DOI] [PMC free article] [PubMed] [Google Scholar]
Perez 2013 {published data only}
- Perez J, Russo DA, Stochl J, Byford S, Zimbron J, Graffy JP, et al. Comparison of high and low intensity contact between secondary and primary care to detect people at ultra‐high risk for psychosis: study protocol for a theory‐based, cluster randomized controlled trial. Trials 2013;14:1‐13. [DOI] [PMC free article] [PubMed] [Google Scholar]
Pinto 2014 {published data only}
- Pinto D, Heleno B, Rodrigues DS, Papoila AL, Santos I, Caetano PA. An open cluster‐randomized, 18‐month trial to compare the effectiveness of educational outreach visits with usual guideline dissemination to improve family physician prescribing. Implementation Science 2014;9:1‐9. [DOI] [PMC free article] [PubMed] [Google Scholar]
Reed 2005 {published data only}
- Reed RL, Revel AD, Carter AO, Saadi HF, Dunn EV. A controlled before‐after trial of structured diabetes care in primary health centres in a newly developed country. International Journal for Quality in Health Care 2005;17(4):281‐6. [DOI] [PubMed] [Google Scholar]
Rubenstein 1999 {published data only}
- Rubenstein LV, Jackson‐Triche M, Unutzer J, Miranda J, Minnium K, Pearson ML, et al. Evidence‐based care for depression in managed primary care practices. Health Affairs 1999;18(5):89‐105. [DOI] [PubMed] [Google Scholar]
Scholes 2006 {published data only}
- Scholes D, Grothaus L, McLure J, Reid R, Fishman P, Sisk C, et al. A randomised trial of strategies to increase chlamydiae screening in young women. Preventive Medicine 2006;43:342‐50. [DOI] [PubMed] [Google Scholar]
Schouten 2007 {published data only}
- Schouten JA, Hulscher MEJL, Trap‐Liefers J, Akkermans RP, Kullberg BJ, Grol R, et al. Tailored interventions to improve antibiotic use for lower respiratory tract infections in hospitals: a cluster randomised trial. Clinical Infectious Disease 2007;44:931‐41. [DOI] [PubMed] [Google Scholar]
Searle 2002 {published data only}
- Searle J, Grover S, Santin A, Weideman P. Randomised trial of an integrated educational strategy to reduce investigation rates in young women with dysfunctional uterine bleeding. Australian and New Zealand Journal of Obstetrics and Gynaecology 2002;42(4):395‐400. [DOI] [PubMed] [Google Scholar]
Seto 1991 {published data only}
- Seto WH, Ching TY, Yuen KY, Chu YB, Seto WL. The enhancement of infection control in‐service education by ward opinion leaders. American Journal of Infection Control 1991;19(2):86‐91. [DOI] [PubMed] [Google Scholar]
Shafer 2002 {published data only}
- Shafer M‐A, Tebb KP, Pantell RH, Wibbelsman CJ, Neuhaus JM, Tipton AC, et al. Effect of a clinical practice improvement intervention on chlamydial screening among adolescent girls. JAMA 2002;288(22):11. [DOI] [PubMed] [Google Scholar]
Simon 2006 {published data only}
- Simon SR, Smith DH, Feldstein AC, Perrin N, Yang X, Zhou Y, et al. Computerised prescribing alerts and group academic detailing to reduce the use of potentially inappropriate medications in older people. Journal of American Geriatric Society 2006;54:963‐8. [DOI] [PubMed] [Google Scholar]
Simunovic 2013 {published data only}
- Simunovic M, Coates A, Smith A, Thabane L, Goldsmith CH, Levine MN. Uptake of an innovation in surgery: observations from the cluster‐randomized Quality Initiative in Rectal Cancer trial. Canadian Journal of Surgery 2013;56:415‐21. [DOI] [PMC free article] [PubMed] [Google Scholar]
- Simunovic M, Stephen W, Kelly S, Forbes S, Cadeddu M, Thabane L, et al. Quality improvement in colorectal cancer in local health integration network 4 (LHIN 4) project (QICC‐L4): integrated knowledge translation in a large geographic region. Annals of Surgical Oncology 2013;20:4067‐72. [DOI] [PubMed] [Google Scholar]
Sinuff 2013 {published data only}
- Sinuff T, Muscedere J, Cook DJ, Dodek PM, Anderson W, Keenan SP, et al. Implementation of clinical practice guidelines for ventilator‐associated pneumonia: a multicenter prospective study. Critical Care Medicine 2013;41:15‐23. [DOI] [PubMed] [Google Scholar]
Stevenson 2004 {published data only}
- Stevenson K, Lewis M, Hay E. Do physiotherapists' attitudes towards evidence‐based practice change as a result of an evidence‐based educational programme?. Journal of Evaluation in Clinical Practice 2004;10(2):207‐17. [DOI] [PubMed] [Google Scholar]
Stevenson 2006 {published data only}
- Stevenson K, Lewis M, Hay E. Does physiotherapy management of low back pain change as a result of an evidence‐based educational programme?. Journal of Evaluation in Clinical Practice 2006;12(3):365‐75. [DOI] [PubMed] [Google Scholar]
Sullivan 2005 {published data only}
- Sullivan SD, Lee TA, Blough DK, Finkelstein JA, Lozano P, Inui TS, et al. A multisite randomised trial of the effects of physician education and organisational change in chronic asthma care. Archives of Pediatric Adolescent Medicine 2005;159:428‐34. [DOI] [PubMed] [Google Scholar]
Valero 2014 {published data only}
- Valero R, Orrego C, Mayoral V, Masso E, Lopez A, Sabate S, et al. Collaborative intervention to improve airway assessment and safety in management for anaesthesia. European Journal of Anaesthesiology 2014;31:143‐52. [DOI] [PubMed] [Google Scholar]
Van Der Meer 2014 {published data only}
- Meer EWC, Boot CRL, Jungbauer FHW, Coenraads PJ, Gulden JWJ, Anema JR. Implementation of recommendations for hand eczema through a multifaceted strategy. A process evaluation among health care workers. Acta Dermato‐Venereologica 2014;94(6):651‐7. [DOI] [PubMed] [Google Scholar]
Weingarten 1993 {published data only}
- Weingarten S, Agocs L, Tankel N, Sheng A, Ellrodt AG. Reducing lengths of stay for patients hospitalized with chest pain using medical practice guidelines and opinion leaders. American Journal of Cardiology 1993;71(4):259‐62. [DOI] [PubMed] [Google Scholar]
Wolfenden 2007 {published data only}
- Wolfenden L, Wiggers J, Knight J, Campbell E, Spigelman A, Kerridge R, et al. Increasing smoking cessation care in a preoperative clinic: a randomised controlled trial. Preventive Medicine 2005;41:284‐90. [DOI] [PubMed] [Google Scholar]
Wright 2007 {published data only}
- Wright J, Bibby J, Eastham J, Harrison S, McGeorge M, Patterson C, et al. Multifaceted implementation of stroke prevention guidelines in primary care: cluster‐randomised evaluation of clinical and cost effectiveness. Quality and Safety in Health Care 2006;16:51‐9. [DOI] [PMC free article] [PubMed] [Google Scholar]
References to ongoing studies
Alsweiler 2017 {published data only}
- Alsweiler JM, Crowther CA, Harding JE. Midwife or doctor local opinion leader to implement a national guideline in babies on postnatal wards (DesIGN): protocol of a cluster‐randomised, blinded, controlled trial. BMJ Open 2017;7(11):e017516. [DOI] [PMC free article] [PubMed] [Google Scholar]
Bosch 2014 {published data only}
- Bosch M, McKenzie JE, Mortimer D, Tavender EJ, Francis JJ, Brennan SE, et al. Implementing evidence‐based recommended practices for the management of patients with mild traumatic brain injuries in Australian emergency care departments: study protocol for a cluster randomised controlled trial. Trials 2014;15:281. [DOI] [PMC free article] [PubMed] [Google Scholar]
ISRCTN50041378 {published data only}
- ISRCTN50041378. A feasibility study and pilot randomised trial of an intervention designed to reduce unnecessary caesarean section in Ireland. www.isrctn.com/ISRCTN50041378 (first received 12 February 2018).
Johnson 2006 {published data only}
- Johnson DW, Craig W, Brant R, Mitton C, Svenson L, Klassen TP. A cluster randomized controlled trial comparing three methods of disseminating practice guidelines for children with croup. Implementation Science 2006;1:10. [DOI] [PMC free article] [PubMed] [Google Scholar]
McKenzie 2013 {published data only}
- McKenzie JE, French SD, O'Connor DA, Mortimer DS, Browning CJ, Russell GM, et al. Evidence‐based care of older people with suspected cognitive impairment in general practice: protocol for the IRIS cluster randomised trial. Implementation Science 2013; Vol. 8:91. [DOI] [PMC free article] [PubMed]
Tello‐Bernabe 2011 {published data only}
- Tello‐Bernabe E, Sanz‐Cuesta T, Cura‐Gonzalez I, Santiago‐Hernando ML, Jurado‐Sueiro M, Fernandez‐Giron M, et al. Effectiveness of a clinical practice guideline implementation strategy for patients with anxiety disorders in primary care: cluster randomized trial. Implementation Science 2011;6:123. [DOI] [PMC free article] [PubMed] [Google Scholar]
Additional references
Albrecht 2016
- Albrecht L, Archibald M, Snelgrove‐Clarke E, Scott SD. Systematic review of knowledge translation strategies to promote research uptake in childhealth settings. Journal of Pediatric Nursing. 2016;31(3):235‐54. [DOI] [PubMed] [Google Scholar]
Coleman 1966
- Coleman J, Katz E, Menzel H. Medical Innovation: A Diffusion Study. Indianapolis (IN): Bobbs‐Merrill, 1966. [Google Scholar]
Curtis 2016
- Curtis K, Fry M, Shaban RZ, Considine J. Translating research findings to clinical nursing practice. Journal of Clinical Nursing 2016;26:862–72. [DOI] [PMC free article] [PubMed] [Google Scholar]
Doumit 2006
- Doumit G, Grimshaw J, Graham I, Smith A, Wright F. Opinion Leaders ‐ Effectiveness, Identification, Stability, Specificity, and Mechanism of Action [Masters thesis]. Ottawa, Canada: Uinversity of Ottawa, 2006. [Google Scholar]
EPOC 2016
- Effective Practice, Organisation of Care (EPOC). Suggested risk of bias criteria for EPOC reviews. epoc.cochrane.org/epoc‐specific‐resources‐review‐authors (accessed prior to 17 May 2019).
EPOC 2017
- Cochrane Effective Practice and Organisation of care group (EPOC). Good practice data extraction form. epoc.cochrane.org/epoc‐resources‐review‐authors (accessed prior to 17 May 2019).
Giguiere 2012
- Giguère A, Légaré F, Grimshaw J, Turcotte S, Fiander M, Grudniewicz A, et al. Printed educational materials: effects on professional practice and healthcare outcomes. Cochrane Database of Systematic Reviews 2012, Issue 10. [DOI: 10.1002/14651858.CD004398.pub3] [DOI] [PMC free article] [PubMed] [Google Scholar]
Grimshaw 2004
- Grimshaw JM, Thomas RE, MacLennan G, Fraser C, Ramsay CR, Vale L. Effectiveness and efficiency of guideline dissemination and implementation strategies. Health Technology Assessment 2004;8(iii‐iv):1‐72. [DOI] [PubMed] [Google Scholar]
Grimshaw 2006a
- Grimshaw J, Eccles MP, Greener J, Maclennan G, Ibbotson T, Kahan JP, et al. Is the involvement of opinion leaders in the implementation of research findings a feasible strategy?. Implementation Science 2006;1(3):1‐12. [DOI] [PMC free article] [PubMed] [Google Scholar]
Grimshaw 2012
- Grimshaw JM, Eccles MP, Lavis JN, Hill SJ, Squires JE. Knowledge translation of research findings. Implementation Science 2012;7(50):1‐17. [DOI] [PMC free article] [PubMed] [Google Scholar]
Grol 1999
- Grol R, Grimshaw J. Evidence‐based implementation of evidence‐based medicine. Joint Commission Journal of Quality Improvement 1999;25(10):503‐13. [DOI] [PubMed] [Google Scholar]
Grol 2001
- Grol R. Successes and failures in the implementation of evidence‐based guidelines for clinical practice. Medical Care 2001;39(8 Suppl 2):II46‐54. [DOI] [PubMed] [Google Scholar]
Guyatt 2004
- Guyatt G, Montori V, Devereaux PJ, Schunemann H, Bhandari M. Patients at the center: in our practice, and in our use of language. ACP Journal Club 2004;140(1):A11–2. [PubMed] [Google Scholar]
Guyatt 2008
- Guyatt GH, Oxman AD, Vist GE, Kunz R, Falck‐Ytter Y, Alonso‐Coello P, et al. GRADE: an emerging consensus on rating quality of evidence and strength of recommendations. British Medical Journal 2008;336(7650):924‐6. [DOI] [PMC free article] [PubMed] [Google Scholar]
Higgins 2008
- Higgins JPT, Altman DG. Chapter 8: Assessing risk of bias in included studies. In: Higgins JPT, Green S editor(s). Cochrane Handbook for Systematic Reviews of Interventions. 5.0.0. Chichester (UK): John Wiley & Sons, 2008. [Google Scholar]
Higgins 2011
- Higgins JPT, Altman DG, Gøtzsche PC, Jüni P, Moher D, Oxman AD, et al. The Cochrane Collaboration’s tool for assessing risk of bias in randomised trials. BMJ 2011;343(d5928):1‐9. [DOI] [PMC free article] [PubMed] [Google Scholar]
Higgins 2011b
- Higgins JPT, Deeks JJ, Altman DG, editor(s). Chapter 16: Special topics in statistics. In Higgins JP, Green S, editor(s). Cochrane Handbook for Systematic Reviews of Interventions Version 5.1.0 (updated March 2011). The Cochrane Collaboration, 2011. Available from handbook.cochrane.org.
Hiss 1978
- Hiss RG, MacDonald R, David WR. Identification of physician educational influentials in small community hospitals. Seventeenth Annual Conference on Research in Medical Education; 1978. Washington DC, 1978.
Hopewell 2009
- Hopewell S, Loudon K, Clarke MJ, Oxman AD, Dickersin K. Publication bias in clinical trials due to statistical significance or direction of trial results. Cochrane Database of Systematic Reviews 2009, Issue 1. [DOI: 10.1002/14651858.MR000006.pub3] [DOI] [PMC free article] [PubMed] [Google Scholar]
Ivers 2012
- Ivers N, Jamtvedt G, Flottorp S, Young JM, Odgaard‐Jensen J, French SD, et al. Audit and feedback: effects on professional practice and healthcare outcomes. Cochrane Database of Systematic Reviews 2012, Issue 6. [DOI: 10.1002/14651858.CD000259.pub3] [DOI] [PMC free article] [PubMed] [Google Scholar]
Mittman 1992
- Mittman BS, Tonesk X, Jacobson PD. Implementing clinical practice guidelines: social influence strategies and practitioner behavior change. Quality Review Bulletin 1992;18(12):413‐22. [DOI] [PubMed] [Google Scholar]
Morris 2011
- Morris ZS, Wooding S, Grant J. The answer is 17 years, what is the question: understanding time lags in translational research. Journal of the Royal Society of Medicine 2011;104:510‐20. [DOI] [PMC free article] [PubMed] [Google Scholar]
O'Brien 2008
- O'Brien MA, Rogers S, Jamkvedt G, Oxman AD, Odgaard‐Jensen J, Kristoffersen DT, et al. Educational outreach visits: effects on professional practice and health care outcomes. Cochrane Database of Systematic Reviews 2008, Issue 4. [DOI: 10.1002/14651858.CD000409.pub2] [DOI] [PMC free article] [PubMed] [Google Scholar]
Rogers 1976
- Rogers EM. New product adoption and diffusion. Journal of Consumer Research 1976;2:290‐301. [Google Scholar]
Rogers 1995
- Rogers EM. Diffusion of Innovations. New York: Free Press, 1995. [Google Scholar]
Ryan 2002
- Ryan DP, Marlow B, Fisher R. Educationally influential physicians: the need for construct validation. Journal of Continuing Education in the Health Profession 2002;22(3):160‐9. [DOI] [PubMed] [Google Scholar]
Schuster 1998
- Schuster MA, McGlynn EA, Brook RH. How good is the quality of health care in the United States?. Milbank Quarterly 1998;76(4):517‐63, 509. [DOI] [PMC free article] [PubMed] [Google Scholar]
Shojania 2009
- Shojania KG, Jennings A, Mayhew A, Ramsay CR, Eccles MP, Grimshaw J. The effects of on‐screen, point of care computer reminders on processes and outcomes of care. Cochrane Database of Systematic Reviews 2009, Issue 3. [DOI: 10.1002/14651858.CD001096.pub2] [DOI] [PMC free article] [PubMed] [Google Scholar]
Valente 2007
- Valente TW, Pumpuang P. Identifying opinion leaders to promote behaviour change. Health Education and Behaviour 2007;34:881‐93. [DOI] [PubMed] [Google Scholar]
References to other published versions of this review
Doumit 2007
- Doumit G, Gattellari M, Grimshaw J, O'Brien NMA. Local opinion leaders: effects on professional practice and heath care outcomes. Cochrane Database of Systematic Reviews 2007, Issue 1. [DOI: 10.1002/14651858.MR000006.pub3] [DOI] [PubMed] [Google Scholar]
Flodgren 2011
- Flodgren G, Parmelli E, Doumit G, Gattellari M, O’Brien MA, Grimshaw J, et al. Local opinion leaders: effects on professional practice and health care outcomes. Cochrane Database of Systematic Reviews 2011, Issue 8. [DOI: 10.1002/14651858.CD000125.pub4] [DOI] [PMC free article] [PubMed] [Google Scholar]
Thomson 1996
- Thomson MA, Oxman AD, Haynes RB, Davis DA, Freemantle NF, Harvey EL. Effectiveness of local opinion leaders in improving health care professional practice and health care outcomes. Cochrane Database of Systematic Reviews 1996, Issue 3. [DOI: 10.1002/14651858.CD000125] [DOI] [PubMed] [Google Scholar]
Thomson 1999
- Thomson O'Brien MA, Oxman AD, Haynes RB, Davis DA, Freemantle N, Harvey EL. Local opinion leaders: effects on professional practice and health care outcomes. Cochrane Database of Systematic Reviews 1999, Issue 2. [DOI: 10.1002/14651858.CD000125] [DOI] [PubMed] [Google Scholar]