

Abstract
Elevated miR‐31 expression is associated with poor outcome in colorectal cancer (CRC). Whether the prognostic information is independent of known molecular subgroups and gene expression‐based consensus molecular subtypes (CMS) is currently unknown. To investigate this, we analyzed nearly 2000 CRC biopsies and preclinical models. The expression of miR‐31‐5p and its host transcript, long noncoding RNA MIR31HG, was strongly correlated (Spearman's ρ > 0.80). MIR31HG outlier expression was observed in 158/1265 (12%) of pCRCs and was associated with depletion of CMS2‐canonical subgroup (odds ratio = 0.21 [0.11–0.35]) and shorter relapse‐free survival (RFS) in multivariable analysis (adjusted hazard ratio = 2.2 [1.6–3.0]). For stage II disease, 5‐year RFS for patients with MIR31HG outlier status was 49% compared to 77% for those with normal‐like expression. MIR31HG outlier status was associated with inferior outcome also within clinical high risk groups and within the poor prognostic CMS4‐mesenchymal gene expression subtype specifically. Preclinical models with MIR31HG outlier expression were characterized by reduced expression of MYC targets as well as elevated epithelial‐mesenchymal transition, TNF‐α/NFκB, TGF‐β, and IFN‐α/γ gene expression signatures, indicating cancer cell‐intrinsic properties resembling the CMS4 subgroup—associations which were recapitulated in patient biopsies. Moreover, the prognostic value of MIR31HG outlier status was independent of cytotoxic T lymphocyte and fibroblast infiltration. We here present evidence that MIR31HG expression provides clinical stratification beyond major gene expression phenotypes and tumor immune and stromal cell infiltration and propose a model where increased expression is an indicator of a cellular state conferring intrinsic invasive and/or immuno‐evasive capabilities.
Keywords: colorectal cancer, biomarker, MIR31HG, miR‐31‐5p, gene expression profiles, consensus molecular subtypes
Short abstract
What's new?
Expression of miR‐31 is associated with poor prognosis in colorectal cancer, but it's not known whether the prognostic value of the microRNA depends on consensus molecular subtypes (CMS). These authors looked at expression of MIR31HG, a long non‐coding RNA derived from the same primary transcript as miR‐31. They found that outlier expression of MIR31HG was associated with poor prognosis independent of CMS. Cells expressing high levels of MIR31HG also had strong enrichment for EMT and immune‐related gene sets. The authors propose that MIR31HG outlier expression is a biomarker for pro‐invasive and/or immunosuppressive characteristics, and poor prognosis.
Abbreviations
- CCLE
Cancer Cell Line Encyclopedia
- CI
confidence interval
- CIT
Cartes d'Identité des Tumeur
- CMS
consensus molecular subtypes
- CRC
colorectal cancer
- CRIS
CRC instrinsic subtypes
- CTL
cytotoxic T lymphocyte
- EMT
epithelial‐mesenchymal transition
- FDR
false discovery rate
- FFPE
formalin fixed paraffin embedded
- FPKM
fragments per kilobase of transcript per million mapped reads
- GEO
Gene Expression Omnibus
- HGU133p2
Affymetrix Human Genome U133 Plus 2.0
- HR
hazard ratio
- IFN
interferon
- ISC
intestinal stem cell
- lncRNA
long noncoding RNA
- LICR
Ludwig Institute for Cancer Research
- MAD
median absolute deviation
- miRNA
microRNA
- mCRC
metastatic colorectal cancer
- MSI/MSS
micro‐satellite instable/stable
- mut
mutated
- norm
normal
- OR
odds ratio
- pCRC
primary colorectal cancer
- PDX
patient derived xenograft
- qRT‐PCR
real‐time quantitative reverse transcription polymerase chain reaction
- RPM
reads per million
- RFS
relapse‐free survival
- TCGA
The Cancer Genome Atlas
- wt
wild type
Introduction
Colorectal cancer (CRC) patient classification according to the biologically distinct and gene expression‐based consensus molecular subtypes (CMS) identifies a poor‐prognostic CMS4‐mesenchymal subgroup.1 The value of CMS as a potential framework for stratified treatment is further supported by emerging evidence of subtype‐associated treatment responses.2, 3, 4 Bulk tumor gene expression profiles do however bear strong imprints of the sampled tumor microenvironment, and both immune infiltration and stromal abundance1, 5 are correlated to CMS and provide interdependent prognostic information. Improved clinical precision is dependent on identification of robust, independent markers with additional prognostic value.
MicroRNAs (miRNA) are ~22 nucleotide noncoding RNAs functioning as post‐transcriptional gene repressors important in establishing and maintaining cell lineage identity.6 We have previously reported that miR‐31‐5p has oncogenic properties in CRC cell lines7 and in primary CRC (pCRC), elevated miR‐31‐5p expression has important clinicopathological and molecular associations, including advanced cancer stage, right‐sided tumor localization, sessile serrated adenoma, low differentiation grade, micro‐satellite instability (MSI) and mutated BRAF and KRAS.8, 9 Furthermore, high expression levels have been associated with poor outcome in stage I–IV pCRCs.9, 10
Interestingly, and despite its clinicopathological and molecular associations, miR‐31‐5p expression has also been demonstrated to be independent of major gene expression subtypes.11 Accordingly, we set out to (i) investigate the value of MIR31 as an independent prognostic marker in the context of gene expression subgroups and (ii) characterize intrinsic biological differences associated with MIR31 activity. Note that we here use the general term MIR31 to denote multiple RNA molecules encoded by the MIR31HG locus (previously known as LncHIFCAR and LOC554202); MIR31HG long noncoding RNA (lncRNA) and the mir‐31 hairpin precursor which through DGCR8/DROSHA/DICER1/XPO5 mediated processing and nuclear export gives rise to mature miR‐31‐5p and miR‐31‐3p conjugates. An outline of the present study is provided in Figure 1.
Figure 1.
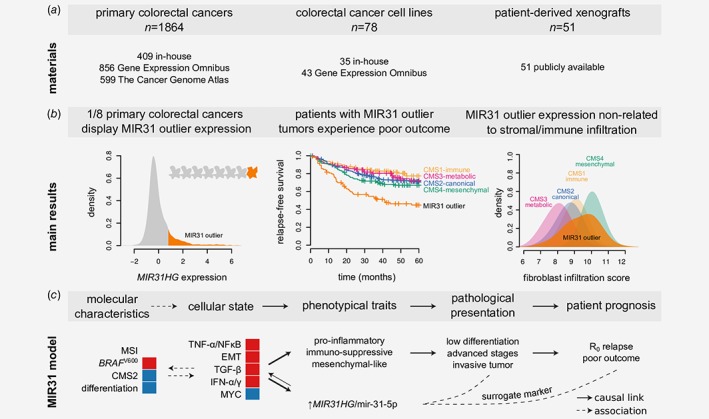
Study outline (a) Panel shows materials included with further details in the Methods section. (b) Panel illustrates the main results with further details in the Results section. (c) We propose a model where high MIR31HG/miR‐31‐5p expression is a surrogate marker of poor outcome by acting as marker of a cellular state defined by relative activation of epithelial‐mesenchymal transition (EMT), TNF‐α/NFκB, TGF‐β, and IFN‐α/γ gene circuits as well as relative downregulation of MYC targets. This cellular state is causally related to acquisition of traits linked to immune evasion, invasion and/or metastasis. Red and blue indicate activation/enrichment and reduction/depletion, respectively. CMS: consensus molecular subtype; IFN; interferon: MSI: micro‐satellite instable; R0: tumor‐free resection margin.
Materials and Methods
A total of 1993 samples were analyzed for MIR31 activity, including 129 preclinical models and 1854 pCRCs (not counting non‐CRC cell lines and metastatic CRCs). In‐house cell lines (n = 35) and patient samples (n = 409) were supplemented with publicly available gene expression data as outlined below and in Figure 1 a.
RNA expression data and samples
Mature miR‐31‐5p and miR‐31‐3p expression was analyzed in small RNA sequencing data from CRC cell lines (n = 29 unique) and pCRCs (n = 293), as well as in qRT‐PCR data from cell lines (n = 59). For analysis in larger sample sets and additional sample types, as well as of associations with gene expression signatures, the MIR31HG host gene was analyzed in gene‐level expression data from the same cell lines and primary CRCs, as well as additional cell lines (n = 78), patient‐derived xenografts (PDXs, n = 51), pCRCs (n = 1864), normal colonic mucosa samples (n = 41), and metastatic CRCs (n = 37).
In‐house CRC cell line (n = 29) Affymetrix Human Transcriptome Array 2.0 (HTA2.0) and small RNA‐seq expression data have previously been published and are available from Gene Expression Omnibus (GEO) with accession identifier GSE97023 and in Supporting Information: Data 1, respectively.12 The Cancer Genome Atlas (TCGA) level 3 RNA‐seq RSEM gene‐level (n = 599) and smRNA‐seq RPM isoform‐level data (n = 293) were downloaded from Broad GDAC Firehose with identifier doi:10.7908/C11G0KM9.13 Broad Cancer Cell Line Encyclopedia (CCLE) RNA‐seq gene‐level read count data (n = 1,019) were downloaded from https://portals.broadinstitute.org/ccle/ (dated August 15, 2017).14 CRC PDX RNA‐seq FPKM values (n = 51) were retrieved from Supplementary Table 1 in Ref. 15. NCI‐60 cancer cell line (n = 59) qRT‐PCR miRNA data were downloaded from https://wiki.nci.nih.gov/display/NCIDTPdata (accessed 2015‐Mar‐30).16 In‐house pCRC (n = 409) and normal colonic mucosa (n = 11) Affymetrix Human Exon 1.0 ST and HTA2.0 microarray gene expression data have previously been published and are available from GEO with accession identifiers GSE24550, GSE29638, GSE69182, GSE79959, GSE97023 and GSE96528.2 Normal colonic mucosa (n = 31) HTA2.0 gene expression will be submitted to GEO. Estevez‐Garcia et al. Affymetrix Human Genome U133 Plus 2.0 (HGU133p2) metastatic CRC (mCRC) gene expression data (n = 37) were downloaded from GEO with accession identifier GSE52735.17 CCLE and Astra‐Zeneca CRC cell line HGU133p2 were retrieved from GEO with accession identifiers GSE57083 [no reference] and GSE3613314 (n = 28 and n = 17 respectively, after exclusion of non‐CRC and overlapping samples). Additional in‐house HTA2.0 CRC cell line (n = 6) gene expression data will be submitted to GEO. Marisa et al. (n = 566) and Jorissen et al. (n = 290) HGU133p2 pCRC gene expression data were downloaded from GEO with accession identifiers GSE3958218 and GSE14333.19
Affymetrix microarray data were re‐processed using the justRMA function in the R20 package affy,21 with brainarray Entrez v20/v22 CDFs.22 ComBat method implemented in the R package sva was used to account for platform and batch effects.23 For merging in‐house, CCLE and Astra‐Zeneca samples, the 13 replicated cell lines were included as covariates in the ComBat model matrix.
Additional cell line data
CRC cell line MSI and nonsynonymous KRAS (codons 12, 13, 61, 117 and 146), BRAF (codon 600), TP53, DGCR8, DROSHA, DICER1 and XPO5 mutation statuses were compiled mainly from https://portals.broadinstitute.org/ccle/ (dated 2017‐Aug‐15),14 Supplementary Table 2 in Ref. 24, Supplementary Table 1 in Ref. 25 and https://cancer.sanger.ac.uk/cosmic/download (v84).26 Tumor localization was determined from the primary papers describing cell line establishment and sites of origin proximal to the splenic flexure were set to right‐sided (retrieved for 38/78 samples). Cell line annotations including Cellosaurus Research Resource Identifiers are available in Supporting Information: Data 1.
Gene expression‐based classification of samples
MIR31HG expression was used to define MIR31 outliers as samples with expression higher than median(xMIR31HG) + 3 × MAD(xMIR31HG) where xMIR31HG represents either justRMA21 signal values (microarray) or normalized read values (sequencing) and MAD represents the corresponding within‐dataset cross‐sample median absolute deviation. Samples with CDX2 expression below the 15.6% percentile in each dataset were classified as CDX2 negative.27 CMS labels for pCRCs from the CIT, LICR and TCGA (COADREAD) datasets were retrieved from Sage Bionetworks Synapse (identifier syn4978511). pCRCs in the Oslo series were classified using the classifyCMS.RF function in the R package CMSclassifier with default posterior probability threshold.1 CRC cell lines were classified according to CMS using CMScaller.28 Cell line differentiation state was determined as previously described.12. Classification of pCRCs according to the CRC intrinsic subtypes (CRIS)29 was performed using CMScaller function in the R package CMScaller28 with CRIS template genes from Supplementary Table 8 in Ref. 29. Samples with classification false discovery rate (FDR) > 0.05 were not assigned (n/a).
Differential expression analysis
Differential gene expression analysis was performed using limma.30 Differential protein expression analysis was performed using Welch's test. Proteins with missing values were not considered.
Gene set analysis
Gene sets were preselected to be CRC and CMS‐informative based on Guinney et al.1 and are listed in Supporting Information: Data 2. Camera gene set analysis31 was performed using the R package limma.30 Tumor cytotoxic T lymphocyte and fibroblast infiltration scores were calculated using the R package MCPcounter.32 Normal colonic fibroblast TGF‐β response signature was downloaded from Supplementary Table 8 in Ref. 5 and single sample gene set enrichment analysis scores calculated using the gsva function in the R package GSVA.33 ABSOLUTE34 tumor percentage estimates were retrieved from Supplementary Data 1 in Ref. 35.
Survival analysis
For survival analysis, three cohorts of pCRCs were merged (total n = 1,265). The in‐house Norwegian Oslo series is a consecutive, population‐based collection of biopsies from patients that received surgery for stage I–IV pCRCs between 2005 and 2013 (n = 409).2 The French multi‐center Cartes d'Identité des Tumeurs (CIT) is a cohort of stage I–IV colon cancers that underwent surgery between 1987 and 2007 (n = 566).18 The Australian/American Ludwig Institute for Cancer Research (LICR) dataset consists of stage I–IV pCRCs (n = 290).19 Information regarding approvals and patient consent are given in the referenced publications. Clinical annotation data were retrieved from the associated Gene Expression Omnibus (GEO) record. Baseline characteristics are presented in Supporting Information: Table S1.
Kaplan–Meier and Cox proportional hazard analyses were performed using the R package survival.36 Specifically, hazard ratios (HR), 95% confidence intervals (CI) and Wald tests were calculated using the coxph function. Model output was formatted using the R package Greg.37 The primary end‐point in the prognostic analyses was five‐year relapse‐free survival where relapse, locally or distant, or death from any cause was registered as events. The secondary end‐point was five‐year overall survival. Death from any cause were registered as event and patients were censored at loss to follow‐up, defined as last date of inquiry about death, or 5 years after surgery. R function cutoff.survival from Ref. 38 was used to estimate hazard ratios as a function of MIR31HG expression dichotomization threshold.
Cox model covariate inclusion was based on established associations with patient outcome, known association to miR‐31‐5p expression and data availability. Clinical stage and CMS were included as factorial covariates. Cox model proportional hazard assumption was tested using the cox.zph function and for covariates and models, p values were > 0.05.
Additional statistical analysis
All presented p values are two‐sided. Spearman's and Pearson's correlation, Fisher's Exact and Pearsons's χ2 tests were performed using functions cor, fisher.test and chisq.test in the R package stats. Cochran‐Armitage test for trend was performed using the chisq_test function in the R package coin.39
Results
Cancer cell‐intrinsic MIR31HG/miR‐31‐5p outlier expression in colorectal cancers
To enable analysis of MIR31 expression in large gene‐level datasets, strong expression correlation among the host gene MIR31HG and both mature mir‐31 conjugates, miR‐31‐5p and miR‐31‐3p, was confirmed in CRC cell lines12 and primary tumors13 with matching RNA (microarrays or total RNA sequencing) and miRNA (small RNA sequencing) expression data (MIR31HG/miR‐31‐5p: Spearman's ρ cells = 0.80 and ρ pCRC = 0.80; miR‐31‐5p/miR‐31‐3p, Supporting Information: Fig. S1). For cell lines, MIR31HG/miR‐31‐5p correlation was slightly improved when samples carrying coding mutations in either of the DGCR8/DROSHA/DICER1/XPO5 miRNA‐processing genes were excluded (ρ wt = 0.82, Supporting Information: Fig. S1a).
Cell line differences in both miR‐31‐5p and MIR31HG expression levels separately were recapitulated across laboratories and technological platforms indicating biological stability and analytical robustness (Supporting Information: Fig. S2a and b and text). Furthermore, comparison with cell lines from other cancer types indicated that CRC cell lines have a wide range of MIR31HG expression levels (Fig. 2 a and Supporting Information: Fig. S2c). Specifically, extrapolating from a linear least squares regression model in qRT‐PCR data, we estimated the miR‐31‐5p abundance to range from roughly 20 to 10,000 copies/cell across our 29 CRC cell lines (Supporting Information: Fig. S2a).
Figure 2.
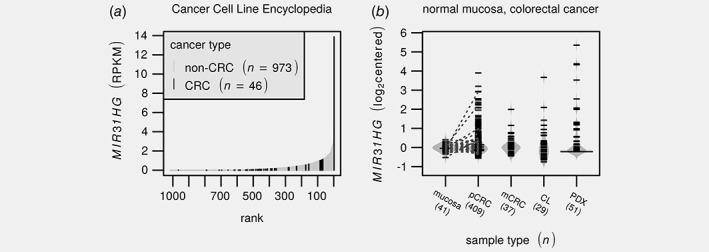
MIR31HG outlier expression is observed in a subset of primary colorectal cancers and derived preclinical models. (a) Barplot depicts MIR31HG expression across the Cancer Cell Line Encyclopedia14 with colorectal cancer samples highlighted in black. (b) Beanplot illustrates distributions in median centered MIR31HG expression estimates across normal colonic mucosa, primary2 and metastatic17 lesions as well as cell line12 and PDX15 models. Numbers below labels indicate the number of samples. Line segments indicate matched mucosa/tumor pairs. Notice that there are pairs where only the tumor show outlier expression. PDX values are based on RNA‐sequencing while the remaining are from different Affymetrix expression arrays. CL: cell line; pCRC/mCRC; primary/metastatic colorectal cancer; PDX; patient‐derived xenograft; RPKM: reads per kilobase per million.
MIR31HG outlier expression was also observed among PDX models,15 which similarly to cell lines also lack a human tumor microenvironment, and in colorectal tumors with different microenvironments, including primary2 and metastatic lesions17 (n = 29, 51, 409 and 37 respectively, Fig. 2 b). In contrast, outlier expression was not observed in normal colonic mucosa samples (n = 41, Fig. 2 a). This indicates that MIR31HG outlier expression is both cancer‐specific and cancer cell‐intrinsic, i.e. not attributable to infiltrating immune or stroma cells. In further support of this, paired pCRCs and PDXs40 showed consistent expression levels; 3 out of 15 primary tumors and their paired xenografts showed highly elevated MIR31HG expression (Supporting Information: Fig. S3).
Taken together these data demonstrate that (i) miR‐31‐3p, miR‐31‐5p and MIR31HG expression levels are highly correlated, (ii) some CRC cell lines display high‐level transcriptional upregulation of MIR31HG, which is recapitulated across technological platforms, research groups and conditions and (iii) a subset of primary and metastatic CRCs exhibit cancer cell‐intrinsic MIR31HG outlier expression.
MIR31 outlier expression is an independent prognostic factor also within the CMS4‐mesenchymal subgroup
To determine whether the clinicopathological and molecular stratifications of miR‐31‐5p expression also applies to MIR31HG, we merged three independent cohorts of totally 1,265 stage I–IV pCRCs; Oslo (n = 409),2 CIT (n = 566, no rectum)18 and LICR (n = 290).19
MIR31HG expression distribution was heavily right‐skewed with most samples having expression signals near the background levels, and a subset of 158/1265 (12%) having outlier expression determined as expression above median + 3 × MAD (Fig. 3 a). Consistent with published data, MIR31 outlier tumors were more likely to be of advanced cancer stages (p = 8.2 × 10⁻⁵, Cochran‐Armitage test for trend, Fig. 3 b), to be right‐sided (OR = 2.4 [1.7–3.5], p = 2.6 × 10⁻⁷, Fisher's exact test, Fig. 3 c), have a low differentiation level (OR = 2.5 [1.1–5.5], p = 0.03, status only available for the Oslo cohort) and harbor BRAF V600 mutations (OR = 2.8 [1.7–4.7], p = 8.1 × 10⁻⁵). Neither patient age, MSI‐status, KRAS or TP53 mutations were associated with MIR31 outlier status (p > 0.05, Fig. 3 c and Supporting Information: Fig. S4a). Notably, although, MIR31 outlier status was independent of MSI (p = 0.33, Fisher's exact test), the average MIR31HG expression was slightly higher in MSI compared to MSS tumors (log 2 fold‐change = 0.27, Supporting Information: Fig. S4b).
Figure 3.
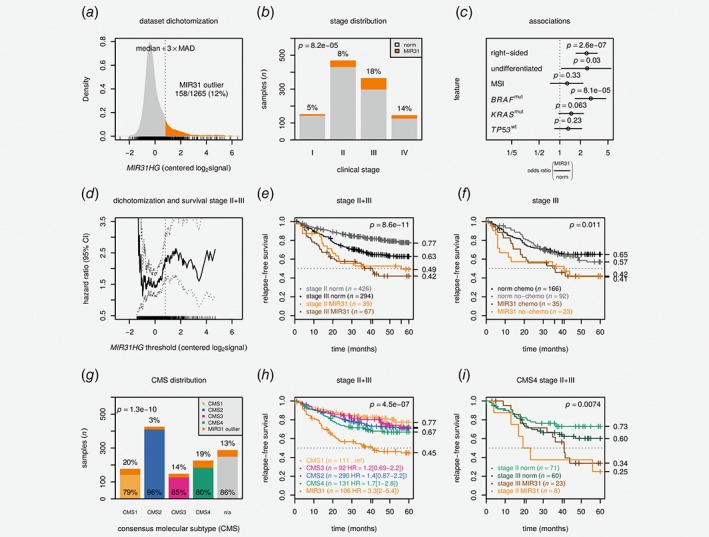
MIR31 outlier expression is a negative prognostic factor independent of consensus molecular subtypes. (a) Density plot shows centered MIR31HG expression and dichotomization threshold. (b) Barplot shows clinical stage and MIR31 outlier proportions. The p value is from a Cochran‐Armitage test. (c) Plot visualizes odds ratios with 95% confidence intervals for selected clinicopathological and molecular variables. The p values are from Fisher's exact tests. Differentiation refers to low differentiation grade and was only available for 401 cases. (d) Univariable hazard ratio (HR) with 95% confidence interval is plotted as a function of MIR31HG threshold. Kaplan–Meier plots show relapse‐free survival for (e) stage II + III pCRCs stratified according to stage and MIR31 status and (f) stage III pCRCs according to MIR31 status and adjuvant chemotherapy. The p values are from Wald tests for Cox models including stage (e) or chemo (f) in addition to MIR31 status. (g) Barplot illustrates distribution of CMS and MIR31 outliers. The p value is from χ2test. (h) Kaplan–Meier plot shows relapse‐free survival for stage II + III pCRC patients stratified by CMS and MIR31 outlier status. The p value is from Wald test for a Cox model including only CMS/MIR31 status. (i) Kaplan–Meier plot shows relapse‐free survival for CMS4 stage II + III pCRC patients stratified by MIR31 and stage. The p value is from Wald test for Cox model including stage and MIR31 status. Data are from CIT,18 LICR19 and Oslo2 cohorts. HR: hazard ratio; MAD: median absolute deviation; mut: mutated; n/a: not assigned; MSI: micro‐satellite instable.
To assess how sensitive survival analyses were to the necessarily arbitrary dichotomization, we applied CutOff Finder38 to calculate the hazard ratio (HR) as a function of MIR31HG expression threshold with 5‐year relapse‐free survival (RFS) as endpoint (stages II and III, n = 826, Fig. 3 d). Strikingly, the HR remained near‐constant within the bulk of the expression distribution with an inflection point near the applied outlier boundary, concurrently supporting both the molecular distinctiveness and the clinical validity of the MIR31HG‐based sample dichotomization. For patients with stage II tumors exhibiting an MIR31 outlier profile 5‐year RFS was 49% compared to 77% for those with normal‐like MIR31HG expression (HR = 2.5 [1.8–3.3], p < 10−8, Wald test for Cox model including stage and MIR31 status, Fig. 3 e). MIR31 outlier status was associated with inferior outcome also when stratified by adjuvant chemotherapy (Fig. 3 f, Supporting Information: Fig. S5). Among stage II + III experiencing distant relapse, MIR31 outlier patients fared significantly worse than those with MIR31 normal‐like cancers with 5‐year RFS of 0% and 42%, respectively (p = 0.0052, Wald test, HR = 2.8 [1.4–5.6], Supporting Information: Table S4 and Supporting Information: Fig. S6a). For patients with a stage II/T4 tumor, MIR31 outlier status was again associated with inferior outcome (p = 0.035, HR = 3.5 [1.1–11], Supporting Information: Fig. S6b). Overall, the negative prognostic association was seen in all three patient cohorts individually but did not reach statistical significance in the smallest sample set (Supporting Information: Fig. S7b).
Subgroup analysis among stage II + III tumors showed that MIR31 outlier expression was associated with inferior outcome within each of the molecular subgroups MSS, BRAF wt, BRAF mut, TP53 wt, TP53 mut, CDX2 positive and CDX2 negative separately, as well as for right‐sided and left‐sided/rectum tumors separately (Supporting Information: Fig. S8). The trend was similar also in the MSI subgroup, but not statistically significant (p = 0.17). Importantly, the pattern of a poorer outcome associated with MIR31HG outlier expression was consistent using 5‐year overall survival as the endpoint (Supporting Information: Fig. S9) and in the three individual cohorts separately (Supporting Information: Figs. S12 and S13).
Our primary objective was to determine whether the prognostic information captured by miR‐31‐5p/MIR31HG expression is independent of major gene expression subtypes represented by CMS.1 CRCs with outlier expression were not enriched in the poor‐prognostic CMS4‐mesenchymal group, indicating CMS‐independency (Fig. 3 g). The proportion of MIR31 outliers was largely similar in CMS1‐immune, CMS3‐epithelial/metabolic and CMS4‐mesenchymal, although a strong depletion among CMS2‐epithelial/canonical was evident (OR = 0.21 [0.11–0.35]). Kaplan–Meier analysis showed that tumors with MIR31HG outlier expression conferred a worse outcome compared to nonoutliers in all individual CMS group separately (Fig. 3 h). Notably, within CMS4, stage II MIR31 outliers were associated with a worse outcome than stage III samples with nonoutlier MIR31HG expression (Fig. 3 i). In multivariable analysis the prognostic value of MIR31 status was independent of BRAF V600, CMS and tumor stage (multivariable HR = 2.2 [1.6–3.0], p = 4.4 × 10⁻⁶, Supporting Information: Table S2). The same pattern of high MIR31HG expression and poor outcome was apparent also when MIR31HG was treated as a continuous covariate (p = 4.3 × 10⁻⁵, Supporting Information: Table S3) and with CRC intrinsic subtypes (CRIS)29 in place of CMS (Supporting Information: Fig. S14).
Taken together, these data demonstrate that miR‐31‐5p and MIR31HG expression provide similar clinical association and that MIR31HG is a prognostic factor independent of CMS and other molecular subgroups of CRC.
MIR31 outlier expression is associated with cancer cell‐intrinsic TGF‐β, TNF‐α/NFκB and IFN‐α/γ signaling
To investigate the biological basis for the CMS‐independent poor prognostic association, cancer‐cell intrinsic characteristics of MIR31 outlier expression was assessed in a panel of CRC cell lines (n = 78) recapitulating the clinicopathological and molecular associations of MIR31 outlier expression observed in the primary CRCs (Fig. 4 a and b and Supporting Information: Fig. S15).
Figure 4.
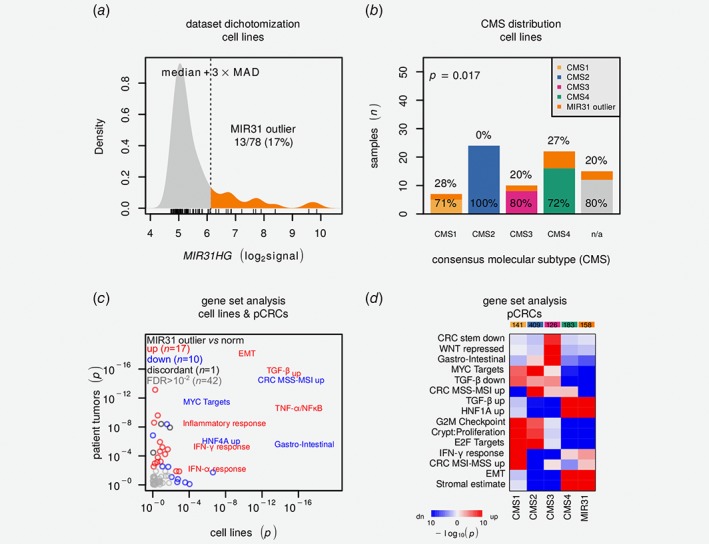
CRC cell line MIR31HG outlier expression is associated with differentiation state and immune‐related signatures. (a) Density plot visualizes MIR31HG expression distribution with dichotomization threshold. (b) Barplot illustrates distribution of CMS and MIR31 outliers. p Value is from χ2test. (c) Scatter plot visualizes gene set comparison of MIR31 outliers against remaining samples for cell lines (horizontal) and patient tumors (vertical). p Values are from Camera31 test and red and blue indicate relative up‐ and downregulation. Gene sets with FDR > 0.01 in both cell lines and pCRCs are labeled. Further details are available in Supporting Information: Data 2. (d) Heatmap visualizes results from Camera31 gene set analysis comparing CMS and MIR31 outliers. Color saturation indicates increasing significance and red and blue relative up‐ and downregulation, respectively. pCRC data are from CIT,18 LICR19 and Oslo2 cohorts. CMS: consensus molecular subtypes; EMT: epithelial‐mesenchymal transition; FDR: false discovery rate; IFNA/G: interferon‐α/γ; MAD: median absolute deviation; MSS/MSI; micro‐satellite stable/instable; pCRC; primary colorectal cancer; TGFB: transforming growth factor‐β.
There was no significant overall depletion of predicted miR‐31‐5p target transcripts in MIR31 outlier samples, neither at the mRNA nor the protein‐level (Supporting Information: Fig. S17a and b). However, by Camera31 gene set analysis of 70 preselected CMS and CRC informative gene sets28 (Fig. 4 c), MIR31 outlier cell lines were found to show strong enrichment for epithelial‐mesenchymal transition (EMT) and immune‐related gene sets such as TGF‐β, TNF‐α/NFκB and IFN‐α/γ, as well as downregulation of MYC and HNF4A target genes (false discovery rate (FDR) adjusted p < 0.005). The MIR31HG locus lies within a ~300 kbp segment on chromosome 9 that encompasses most of the human repertoire of interferon genes (Supporting Information: Fig. S18a), and activation of interferon response in MIR31 outliers was validated by collection of an independent set of nonoverlapping genes induced by IFN‐α (Supporting Information: Fig. S18b). Critically, similar patterns were observed also for the pCRCs cohorts (n = 1864, total) and PDXs (n = 51)15 (Fig. 4 c and Supporting Information: Data 2).
To further investigate the biological basis for the CMS‐independent poor prognostic value of MIR31 outlier expression, gene set analyses were performed in the context of CMS. Comparison of all MIR31 outliers (irrespective of CMS) with nonoutliers in each of the four CMS groups, showed that MIR31 outliers appeared biologically most similar to CMS4‐mesenchymals (Fig. 4 d and Supporting Information Fig. S19).
In conclusion, MIR31 outliers have intrinsic gene expression profiles associated with aggressive disease (undifferentiated state/EMT) and immune‐associated signaling.
Poor prognostic value of MIR31 outlier expression is independent of stromal and cytotoxic lymphocyte infiltration
Considering that infiltration of stromal cells is both a marker of aggressiveness and a dominating feature of CMS4 tumors, stromal compositions were assessed in both the merged CIT + LICR+Oslo dataset (n = 1,265) and the TCGA pCRC cohort (n = 599)13 (representing different analytical platforms, microarrays and total RNA sequencing, respectively). Quantification of fibroblasts specifically, based on gene expression (MCPcounter32), showed that MIR31 outlier tumors had less fibroblast infiltration than CMS4 nonoutlier tumors in both datasets (p < 10−8, Wilcoxon rank sum tests, Fig. 5 a and Supporting Information: Fig. S20a). Similarly, for TCGA, DNA copy number‐based ABSOLUTE34 estimates indicated that tumors with MIR31 outlier expression had less infiltration of nonmalignant cells than nonoutlier tumors in both CMS4 and CMS1 (Supporting Information: Fig. S20b). Together, this suggests that the poor prognostic value of MIR31 is not predominantly attributable to stromal infiltration, supporting the prognostic independence from CMS.
Figure 5.
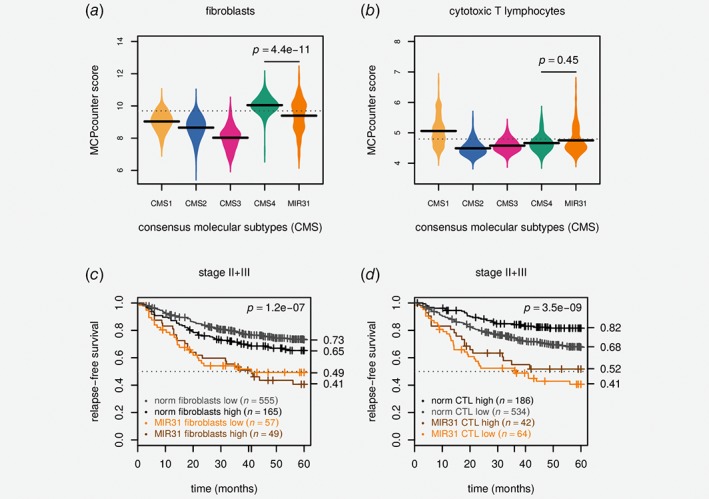
Poor prognostic value of MIR31 outlier expression is independent of cytotoxic lymphocyte and stromal infiltration. (a) Beanplot shows MCPcounter32 scores for fibroblasts and (b) cytotoxic T lymphocyte infiltration stratified by CMS and MIR31 outlier expression. The horizontal bars are the group‐wise medians and the p values are from Wilcoxon rank sum tests. (c) Kaplan–Meier plot shows survival stratified by MIR31 and MCPcounter fibroblasts and (d) cytotoxic T lymphocyte scores. Both were dichotomized according to the 75th percentiles which are indicated with dashed horizontal lines in panels c and d. The p values are for Wald tests for the Cox models including MIR31 status in addition to either MCPcounter score. Data are from CIT,18 LICR19 and Oslo2 cohorts. CTL: cytotoxic T lymphocyte.
In light of the many immune‐related signatures with differential activation in MIR31 outliers, and the strong positive prognostic value of activated immune cells in CRC, we wanted to determine whether the poor prognosis of MIR31 outliers within the CMS4 subgroup could be explained by lower levels of cytotoxic T lymphocyte (CTL) infiltration. Gene expression‐based CTL quantification showed that the CTL infiltration was not significantly higher in CMS4 MIR31 outliers compared to CMS4 nonoutliers in neither the CIT+LICR+Oslo nor the TCGA datasets (p > 0.1, Wilcoxon rank sum test, Fig. 5 b and Supporting Information: Fig. S21c).
Finally, survival analysis showed that the prognostic value of MIR31 was independent of both fibroblasts and CTL infiltration (Fig. 5 c and d). For the stage II + III pCRCs in the three cohorts stratified by the 75th‐percentile of fibroblast infiltration, RFS at 5‐years were 73%/65% for MIR31 normal‐like samples with fibroblasts high/low versus 49%/41% for MIR31 outliers fibroblasts high/low (p < 0.001). Similarly, for CTL stratified by the 75th‐percentile, RFS at 5‐years were 82%/68% for MIR31 normal‐like samples with CTL high/low versus 52%/41% for MIR31 outlier samples with CTL high/low (p < 0.001), indicating that the cancer cell‐intrinsic properties of tumors with MIR31 outlier expression conferred additive prognostic value to these well‐known prognostic factors in CRC.
Discussion
High miR‐31‐5p expression has previously been established as a poor prognostic factor in pCRC.9, 10 Here we provide evidence that MIR31 is a high‐risk biomarker beyond known molecular subgroups, major gene expression phenotypes as well as tumor immune and stromal cell infiltration. Specifically, MIR31HG outlier expression identifies a subset of largely non‐CMS2‐canonical CRCs that show inferior outcome, also when controlling for clinicopathological and molecular factors, including but not limited to stage and BRAF mutations. The biological characteristics associated with MIR31 outlier expression were cancer cell‐intrinsic, and we propose that miR‐31‐5p/MIR31HG expression is a marker of a cellular state conferring intrinsic pro‐invasive and/or immuno‐suppressive capabilities (Fig. 1 c).
It has been shown that CRC organoids and cell line models exposed to either TGF‐β or TNF‐α undergo EMT with concomitant miR‐31‐5p induction, and TGF‐β and TNF‐α in combination act synergistically to increase miR‐31‐5p expression.41 It is therefore tempting to speculate that elevated MIR31HG is a surrogate marker of dual activation of TGF‐β and TNF‐α/NFκB related signaling. These circuits confer intrinsic immune evasive and tissue invasive capabilities and may as such provide the biological basis for the aggressive disease associated with MIR31HG outlier expression. Corroborating this, CRC cell lines, PDXs and primary tumors with MIR31 outlier profile were characterized by reduced differentiation (EMT) and relative upregulation of gene signatures related to TNF‐α/NFκB, TGF‐β, IFN‐α and IFN‐γ signaling, as well as downregulation of MYC targets. TGF‐β suppression is critical in intestinal differentiation42 and is in the CRC‐setting associated with metastatic capabilities43 and tumor T‐cell exclusion.44 MIR31 outlier expression was not associated with T‐cell exclusion in our study, however, interferons are known to be produced by most cell types and modulate cancer immune surveillance. The gene set analyses therefore suggest that the poor prognostic value of high MIR31HG expression is partly linked to intrinsic immune modulatory signaling and/or resistance. In a recent study investigating the interplay between the colonic mucosa and immune system in colitis, it was found that intestinal epithelium miR‐31‐5p expression was strongly upregulated in colitis models induced by either IL10‐knockout or chemical treatment, and miR‐31‐5p expression was also significantly higher in inflamed compared to normal mucosa from Crohn's patients.45 Thus, intestinal epithelial miR‐31‐5p expression seems intrinsically linked to colonic inflammation—known to increase the risk of developing CRC. Alternatively, the poor outcome associated with high MIR31 activity may be related to the role of miR‐31‐5p in promoting stem cell expansion.46 MIR31 positivity may represent stem cell‐like subpopulations inherently resistant to chemotherapy, and LGR5+ positive stem cells were recently found to be critical in the formation and maintenance of CRC liver metastasis.47 In this context, it is interesting to note that in patients with stage III CRC and MIR31 outlier expression, adjuvant chemotherapy did not appear to improve the patient outcome.
It has recently been reported that high miR‐31‐3p expression is also associated with resistance to anti‐EGFR treatment in KRAS wild‐type metastatic CRCs.48 This is consistent with the finding that MIR31 outliers are depleted of CMS2‐canonical cases, considering earlier work from us and others showing that transit‐amplifying/CMS2‐like preclinical models show the highest sensitivity toward EGFR inhibition.2, 25 We speculate that patients with CRC exhibiting MIR31 outlier profile may present a particularly important clinical subgroup, with intrinsic aggressiveness combined with resistance toward standard chemotherapeutics and targeted treatment. The large variation in MIR31HG/miR‐31‐3p/miR‐31‐5p expression indicates that they represent analytically robust biomarkers, and in situ hybridization or qRT‐PCR based diagnostic tests may be readily implementable.
For bulk tumor tissue samples, heterogeneity in sample composition introduces noise and MIR31HG may, with its large dynamic range and on/off‐like expression pattern, provide a clean and robust readout. Although MIR31HG outlier profiles were shown to be both cancer‐specific and cancer cell‐intrinsic, we cannot exclude the possibility that the noncancerous tumor compartment may contribute to MIR31HG expression in some cases. Recently, it was shown that miR‐31‐5p expression in T cells increased during exposure to type I interferons.49 However, our analyses indicated that the prognostic value of MIR31 was independent of the level of CTL infiltration, and combination of the two markers identified a patient subgroup with a particularly poor survival.
To further characterize the role of MIR31 in CRC, the presented MIR31 outlier cell lines provide ideal models for knock‐out experiments. It would be particularly interesting to follow‐up on two recent reports. Shih et al. showed that MIR31HG, independent of the encoded miR‐31‐5p, promotes tumor development through HIF1A co‐activation.50 Tian and colleagues demonstrated that miR‐31‐5p acts as a “cell‐autonomous post‐transcriptional regulator of the ISC [intestinal stem cell] niche” and is induced upon tissue damage by facilitating the subsequent expansion of LGR5+ ISCs as to repopulate the intestinal lining.46
We provide evidence that MIR31 carries prognostic information beyond consensus molecular subtypes and MIR31 outlier status defines a subset of patients with inferior outcome even within the CMS4‐mesenchymal patient group. A bio‐clinical model is proposed: miR‐31‐5p/MIR31HG outlier expression is a biomarker of a cellular state conferring cancer cell‐intrinsic pro‐invasive and/or immuno‐suppressive capabilities resulting in poor patient prognosis.
Supporting information
Appendix S1: Supporting Information
Table S1 Baseline characteristics of CIT [Marisa 2013], LICR [Jorissen 2009] and Oslo [Sveen 2018] cohorts included in the survival analyses. The numbers in parentheses indicate percentages. adj: adjuvant; CMS: consensus molecular subtypes; MSI/MSS; micro‐satellite instable/stable; OS: overall survival; RFS: relapsefree survival.
Table S2 Relapse‐free survival modeled using Cox proportional univariate hazard function with dichotomized MIR31HG expression. Crude and adjusted values represent univariate and multivariate estimates respectively. MIR31 normal‐like, BRAF wt, CMS1 and stage I were used as reference groups. R2 =0.19; Wald test p‐value<0.001.
Acknowledgements
We are grateful to Professor Arild Nesbakken at the Department of Gastroenterological Surgery, Oslo University Hospital, for generously making the detailed and quality controlled clinical annotations for the Oslo cohort available to our study.
References
- 1. Guinney J, Dienstmann R, Wang X, et al. The consensus molecular subtypes of colorectal cancer. Nat Med 2015;21:1350–6. [DOI] [PMC free article] [PubMed] [Google Scholar]
- 2. Sveen A, Bruun J, Eide PW, et al. Colorectal cancer consensus molecular subtypes translated to preclinical models uncover potentially targetable cancer cell dependencies. Clin Cancer Res 2018;24:794–806. [DOI] [PubMed] [Google Scholar]
- 3. Song N, Pogue‐Geile KL, Gavin PG, et al. Clinical outcome from oxaliplatin treatment in stage II/III colon cancer according to intrinsic subtypes: secondary analysis of NSABP c‐07/NRG oncology randomized clinical trial. JAMA Oncol 2016;2:1162–9. [DOI] [PMC free article] [PubMed] [Google Scholar]
- 4. Okita A, Takahashi S, Ouchi K, et al. The consensus molecular subtypes of colorectal cancer as a predictive factor for chemotherapies against metastatic colorectal cancer. JCO 2018;36:736–6. [DOI] [PMC free article] [PubMed] [Google Scholar]
- 5. Calon A, Lonardo E, Berenguer‐Llergo A, et al. Stromal gene expression defines poor‐prognosis subtypes in colorectal cancer. Nat Genet 2015;47:320–9. [DOI] [PubMed] [Google Scholar]
- 6. Ebert MS, Sharp PA. Roles for MicroRNAs in conferring robustness to biological processes. Cell 2012;149:515–24. [DOI] [PMC free article] [PubMed] [Google Scholar]
- 7. Cekaite L, Rantala JK, Bruun J, et al. MiR‐9, −31, and −182 deregulation promote proliferation and tumor cell survival in colon cancer. Neoplasia 2012;14:868–79. [DOI] [PMC free article] [PubMed] [Google Scholar]
- 8. Schee K, Boye K, Abrahamsen TW, et al. Clinical relevance of microRNA miR‐21, miR‐31, miR‐92a, miR‐101, miR‐106a and miR‐145 in colorectal cancer. BMC Cancer 2012;12:505. [DOI] [PMC free article] [PubMed] [Google Scholar]
- 9. Nosho K, Igarashi H, Nojima M, et al. Association of microRNA‐31 with BRAF mutation, colorectal cancer survival and serrated pathway. Carcinogenesis 2014;35:776–83. [DOI] [PubMed] [Google Scholar]
- 10. Slattery ML, Pellatt AJ, Lee FY, et al. Infrequently expressed miRNAs influence survival after diagnosis with colorectal cancer. Oncotarget 2017;8:83845–59. [DOI] [PMC free article] [PubMed] [Google Scholar]
- 11. Cantini L, Isella C, Petti C, et al. MicroRNA‐mRNA interactions underlying colorectal cancer molecular subtypes. Nat Commun 2015;6:8878. [DOI] [PMC free article] [PubMed] [Google Scholar]
- 12. Berg KCG, Eide PW, Eilertsen IA, et al. Multi‐omics of 34 colorectal cancer cell lines ‐ a resource for biomedical studies. Mol Cancer 2017;16:116. [DOI] [PMC free article] [PubMed] [Google Scholar]
- 13. TCGA . Comprehensive molecular characterization of human colon and rectal cancer. Nature 2012;487:330–7. [DOI] [PMC free article] [PubMed] [Google Scholar]
- 14. Barretina J, Caponigro G, Stransky N, et al. The cancer cell line encyclopedia enables predictive modelling of anticancer drug sensitivity. Nature 2012;483:603–307. [DOI] [PMC free article] [PubMed] [Google Scholar]
- 15. Gao H, Korn JM, Ferretti S, et al. High‐throughput screening using patient‐derived tumor xenografts to predict clinical trial drug response. Nat Med 2015;21:1318–25. [DOI] [PubMed] [Google Scholar]
- 16. Gaur A, Jewell DA, Liang Y, et al. Characterization of MicroRNA expression levels and their biological correlates in human cancer cell lines. Cancer Res 2007;67:2456–68. [DOI] [PubMed] [Google Scholar]
- 17. Estevez‐Garcia P, Rivera F, Molina‐Pinelo S, et al. Gene expression profile predictive of response to chemotherapy in metastatic colorectal cancer. Oncotarget 2015;6:6151–9. [DOI] [PMC free article] [PubMed] [Google Scholar]
- 18. Marisa L, De Reyniès A, Duval A, et al. Gene expression classification of colon cancer into molecular subtypes: characterization, validation, and prognostic value. PLoS Med 2013;10:e1001453. [DOI] [PMC free article] [PubMed] [Google Scholar]
- 19. Jorissen RN, Gibbs P, Christie M, et al. Metastasis‐associated gene expression changes predict poor outcomes in patients with dukes stage B and C colorectal cancer. Clin Cancer Res 2009;15:7642–51. [DOI] [PMC free article] [PubMed] [Google Scholar]
- 20. R Core Team . R: a language and environment for statistical computing. Vienna, Austria: R Foundation for Statistical Computing, 2018. [Google Scholar]
- 21. Gautier L, Cope L, Bolstad BM, et al. Affy—analysis of Affymetrix GeneChip data at the probe level. Bioinformatics 2004;20:307–15. [DOI] [PubMed] [Google Scholar]
- 22. Sandberg R, Larsson O. Improved precision and accuracy for microarrays using updated probe set definitions. BMC Bioinform 2007;8:1. [DOI] [PMC free article] [PubMed] [Google Scholar]
- 23. Leek JT, Scharpf RB, Bravo HC, et al. Tackling the widespread and critical impact of batch effects in high‐throughput data. Nat Rev Genet 2010;11:733–9. [DOI] [PMC free article] [PubMed] [Google Scholar]
- 24. Mouradov D, Sloggett C, Jorissen RN, et al. Colorectal cancer cell lines are representative models of the main molecular subtypes of primary cancer. Cancer Res 2014;74:3238–47. [DOI] [PubMed] [Google Scholar]
- 25. Medico E, Russo M, Picco G, et al. The molecular landscape of colorectal cancer cell lines unveils clinically actionable kinase targets. Nat Commun 2015;6:7002. [DOI] [PubMed] [Google Scholar]
- 26. Iorio F, Knijnenburg TA, Vis DJ, et al. A landscape of pharmacogenomic interactions in cancer. Cell 2016;166:740–54. [DOI] [PMC free article] [PubMed] [Google Scholar]
- 27. Pilati C, Taieb J, Balogoun R, et al. CDX2 prognostic value in stage II/III resected colon cancer is related to CMS classification. Ann Oncol 2017;28:1032–5. [DOI] [PubMed] [Google Scholar]
- 28. Eide PW, Bruun J, Lothe RA, et al. CMScaller: an R package for consensus molecular subtyping of colorectal cancer pre‐clinical models. Sci Rep 2017;7:16618. [DOI] [PMC free article] [PubMed] [Google Scholar]
- 29. Isella C, Brundu F, Bellomo SE, et al. Selective analysis of cancer‐cell intrinsic transcriptional traits defines novel clinically relevant subtypes of colorectal cancer. Nat Commun 2017;8: ncomms15107. [DOI] [PMC free article] [PubMed] [Google Scholar]
- 30. Ritchie ME, Phipson B, Wu D, et al. Limma powers differential expression analyses for RNA‐sequencing and microarray studies. Nucl Acids Res 2015;43:e47. [DOI] [PMC free article] [PubMed] [Google Scholar]
- 31. Wu D, Smyth GK. Camera: a competitive gene set test accounting for inter‐gene correlation. Nucl Acids Res 2012;40:e133. [DOI] [PMC free article] [PubMed] [Google Scholar]
- 32. Becht E, Giraldo NA, Lacroix L, et al. Reyniès a de. Estimating the population abundance of tissue‐infiltrating immune and stromal cell populations using gene expression. Genome Biol 2016;17:218. [DOI] [PMC free article] [PubMed] [Google Scholar]
- 33. Hänzelmann S, Castelo R, Guinney J. GSVA: gene set variation analysis for microarray and RNA‐seq data. BMC Bioinformatics 2013;14:7. [DOI] [PMC free article] [PubMed] [Google Scholar]
- 34. Carter SL, Cibulskis K, Helman E, et al. Absolute quantification of somatic DNA alterations in human cancer. Nat Biotechnol 2012;30:413–21. [DOI] [PMC free article] [PubMed] [Google Scholar]
- 35. Aran D, Sirota M, Butte AJ. Systematic pan‐cancer analysis of tumour purity. Nat Commun 2015;6:8971. [DOI] [PMC free article] [PubMed] [Google Scholar]
- 36. Therneau TM. A package for survival analysis in S. 2015.
- 37. Gordon M, Greg Seifert R.: Regression helper functions. 2016. [Google Scholar]
- 38. Budczies J, Klauschen F, Sinn BV, et al. Cutoff finder: a comprehensive and straightforward web application enabling rapid biomarker cutoff optimization. PLoS One 2012;7:e51862. [DOI] [PMC free article] [PubMed] [Google Scholar]
- 39. Hothorn T, Hornik K, van De Wiel MA, et al. Implementing a class of permutation tests: the coin package. J Stat Softw 2008;28:1–23.27774042 [Google Scholar]
- 40. Linnekamp JF, van Hooff SR, Prasetyanti PR, et al. Consensus molecular subtypes of colorectal cancer are recapitulated in in vitro and in vivo models. Cell Death Differ 2018;25:616–33. [DOI] [PMC free article] [PubMed] [Google Scholar]
- 41. Cottonham CL, Kaneko S, Xu L. miR‐21 and miR‐31 converge on TIAM1 to regulate migration and invasion of colon carcinoma cells. J Biol Chem 2010;285:35293–302. [DOI] [PMC free article] [PubMed] [Google Scholar]
- 42. Reynolds A, Wharton N, Parris A, et al. Canonical WNT signals combined with suppressed TGFβ/BMP pathways promote renewal of the native human colonic epithelium. Gut 2014;63:610–21. [DOI] [PMC free article] [PubMed] [Google Scholar]
- 43. Calon A, Espinet E, Palomo‐Ponce S, et al. Dependency of colorectal cancer on a TGF‐β‐driven programme in stromal cells for metastasis initiation. Cancer Cell 2012;22:571–84. [DOI] [PMC free article] [PubMed] [Google Scholar]
- 44. Tauriello DVF, Palomo‐Ponce S, Stork D, et al. TGFβ drives immune evasion in genetically reconstituted colon cancer metastasis. Nature 2018;554:538–43. [DOI] [PubMed] [Google Scholar]
- 45. Shi T, Xie Y, Fu Y, et al. The signaling axis of microRNA‐31/interleukin‐25 regulates Th1/Th17‐mediated inflammation response in colitis. Mucosal Immunol 2017;10:983–95. [DOI] [PubMed] [Google Scholar]
- 46. Tian Y, Ma X, Lv C, et al. Stress responsive miR‐31 is a major modulator of mouse intestinal stem cells during regeneration and tumorigenesis. Elife 2017;6:e29538. [DOI] [PMC free article] [PubMed] [Google Scholar]
- 47. De Sousa e Melo F, Kurtova AV, Harnoss JM, et al. A distinct role for Lgr5+ stem cells in primary and metastatic colon cancer. Nature 2017;543:676–80. [DOI] [PubMed] [Google Scholar]
- 48. Pugh S, Thiébaut R, Bridgewater J, et al. Association between miR‐31‐3p expression and cetuximab efficacy in patients with KRAS wild‐type metastatic colorectal cancer: a post‐hoc analysis of the new EPOC trial. Oncotarget 2017;8:93856–66. [DOI] [PMC free article] [PubMed] [Google Scholar]
- 49. Moffett HF, Cartwright ANR, Kim H‐J, et al. The microRNA miR‐31 inhibits CD8+ T cell function in chronic viral infection. Nat Immunol 2017;18:791–9. [DOI] [PMC free article] [PubMed] [Google Scholar]
- 50. Shih J‐W, Chiang W‐F, Wu ATH, et al. Long noncoding RNA LncHIFCAR/MIR31HG is a HIF‐1A co‐activator driving oral cancer progression. Nat Commun 2017;8:15874. [DOI] [PMC free article] [PubMed] [Google Scholar]
Associated Data
This section collects any data citations, data availability statements, or supplementary materials included in this article.
Supplementary Materials
Appendix S1: Supporting Information
Table S1 Baseline characteristics of CIT [Marisa 2013], LICR [Jorissen 2009] and Oslo [Sveen 2018] cohorts included in the survival analyses. The numbers in parentheses indicate percentages. adj: adjuvant; CMS: consensus molecular subtypes; MSI/MSS; micro‐satellite instable/stable; OS: overall survival; RFS: relapsefree survival.
Table S2 Relapse‐free survival modeled using Cox proportional univariate hazard function with dichotomized MIR31HG expression. Crude and adjusted values represent univariate and multivariate estimates respectively. MIR31 normal‐like, BRAF wt, CMS1 and stage I were used as reference groups. R2 =0.19; Wald test p‐value<0.001.